
Green Synthesis of Fe–Cu Bimetallic Supported on Alginate-Limestone Nanocomposite for the Removal of Drugs from Contaminated Water

 , , , and
Abstract
1. Introduction
2. Experimental
2.1. Materials
2.2. Synthesis of Copper Nanoparticles
2.3. Synthesis of Fe− Nanoparticles
2.4. Preparation of ZV Fe–Cu/Alg–LS Nanocomposites
2.5. Surface Characterization of the Nanocomposites
2.5.1. Instruments
2.5.2. Adsorption Process
3. Results and Discussion
3.1. Zero Valant Fe–Cu/Alg–LS Nanocomposites Characteristics
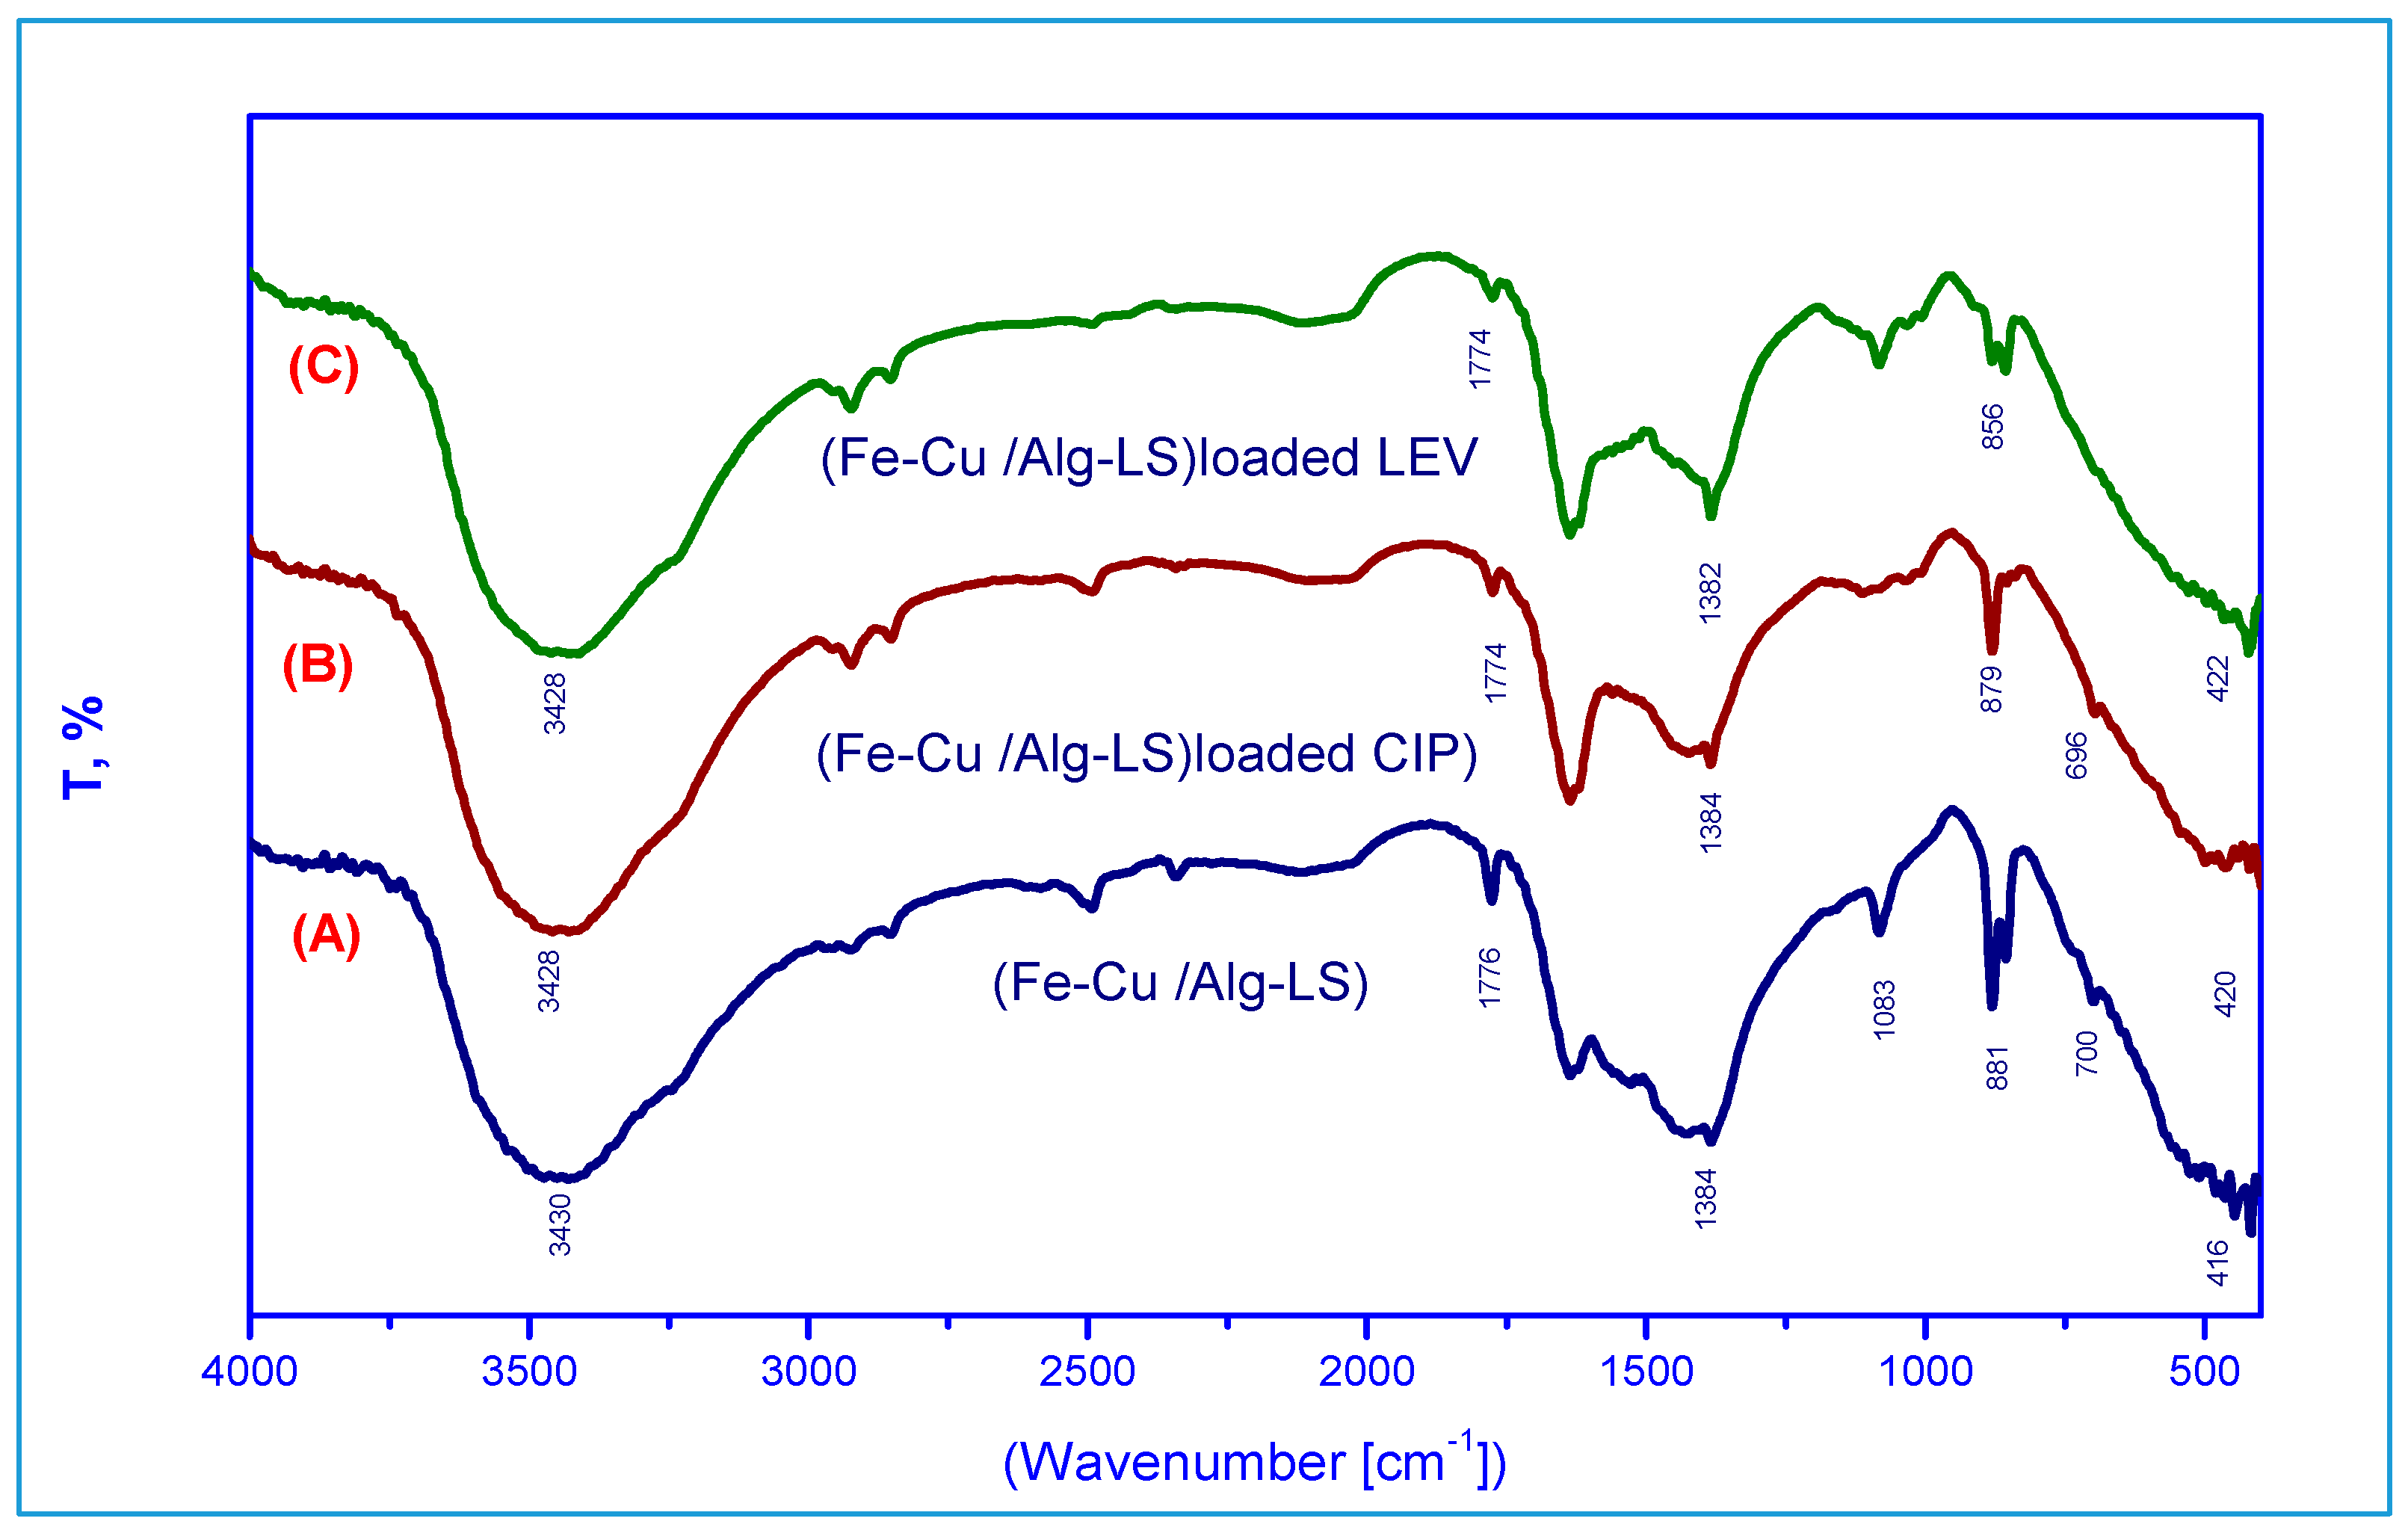
3.1.1. FTIR Study
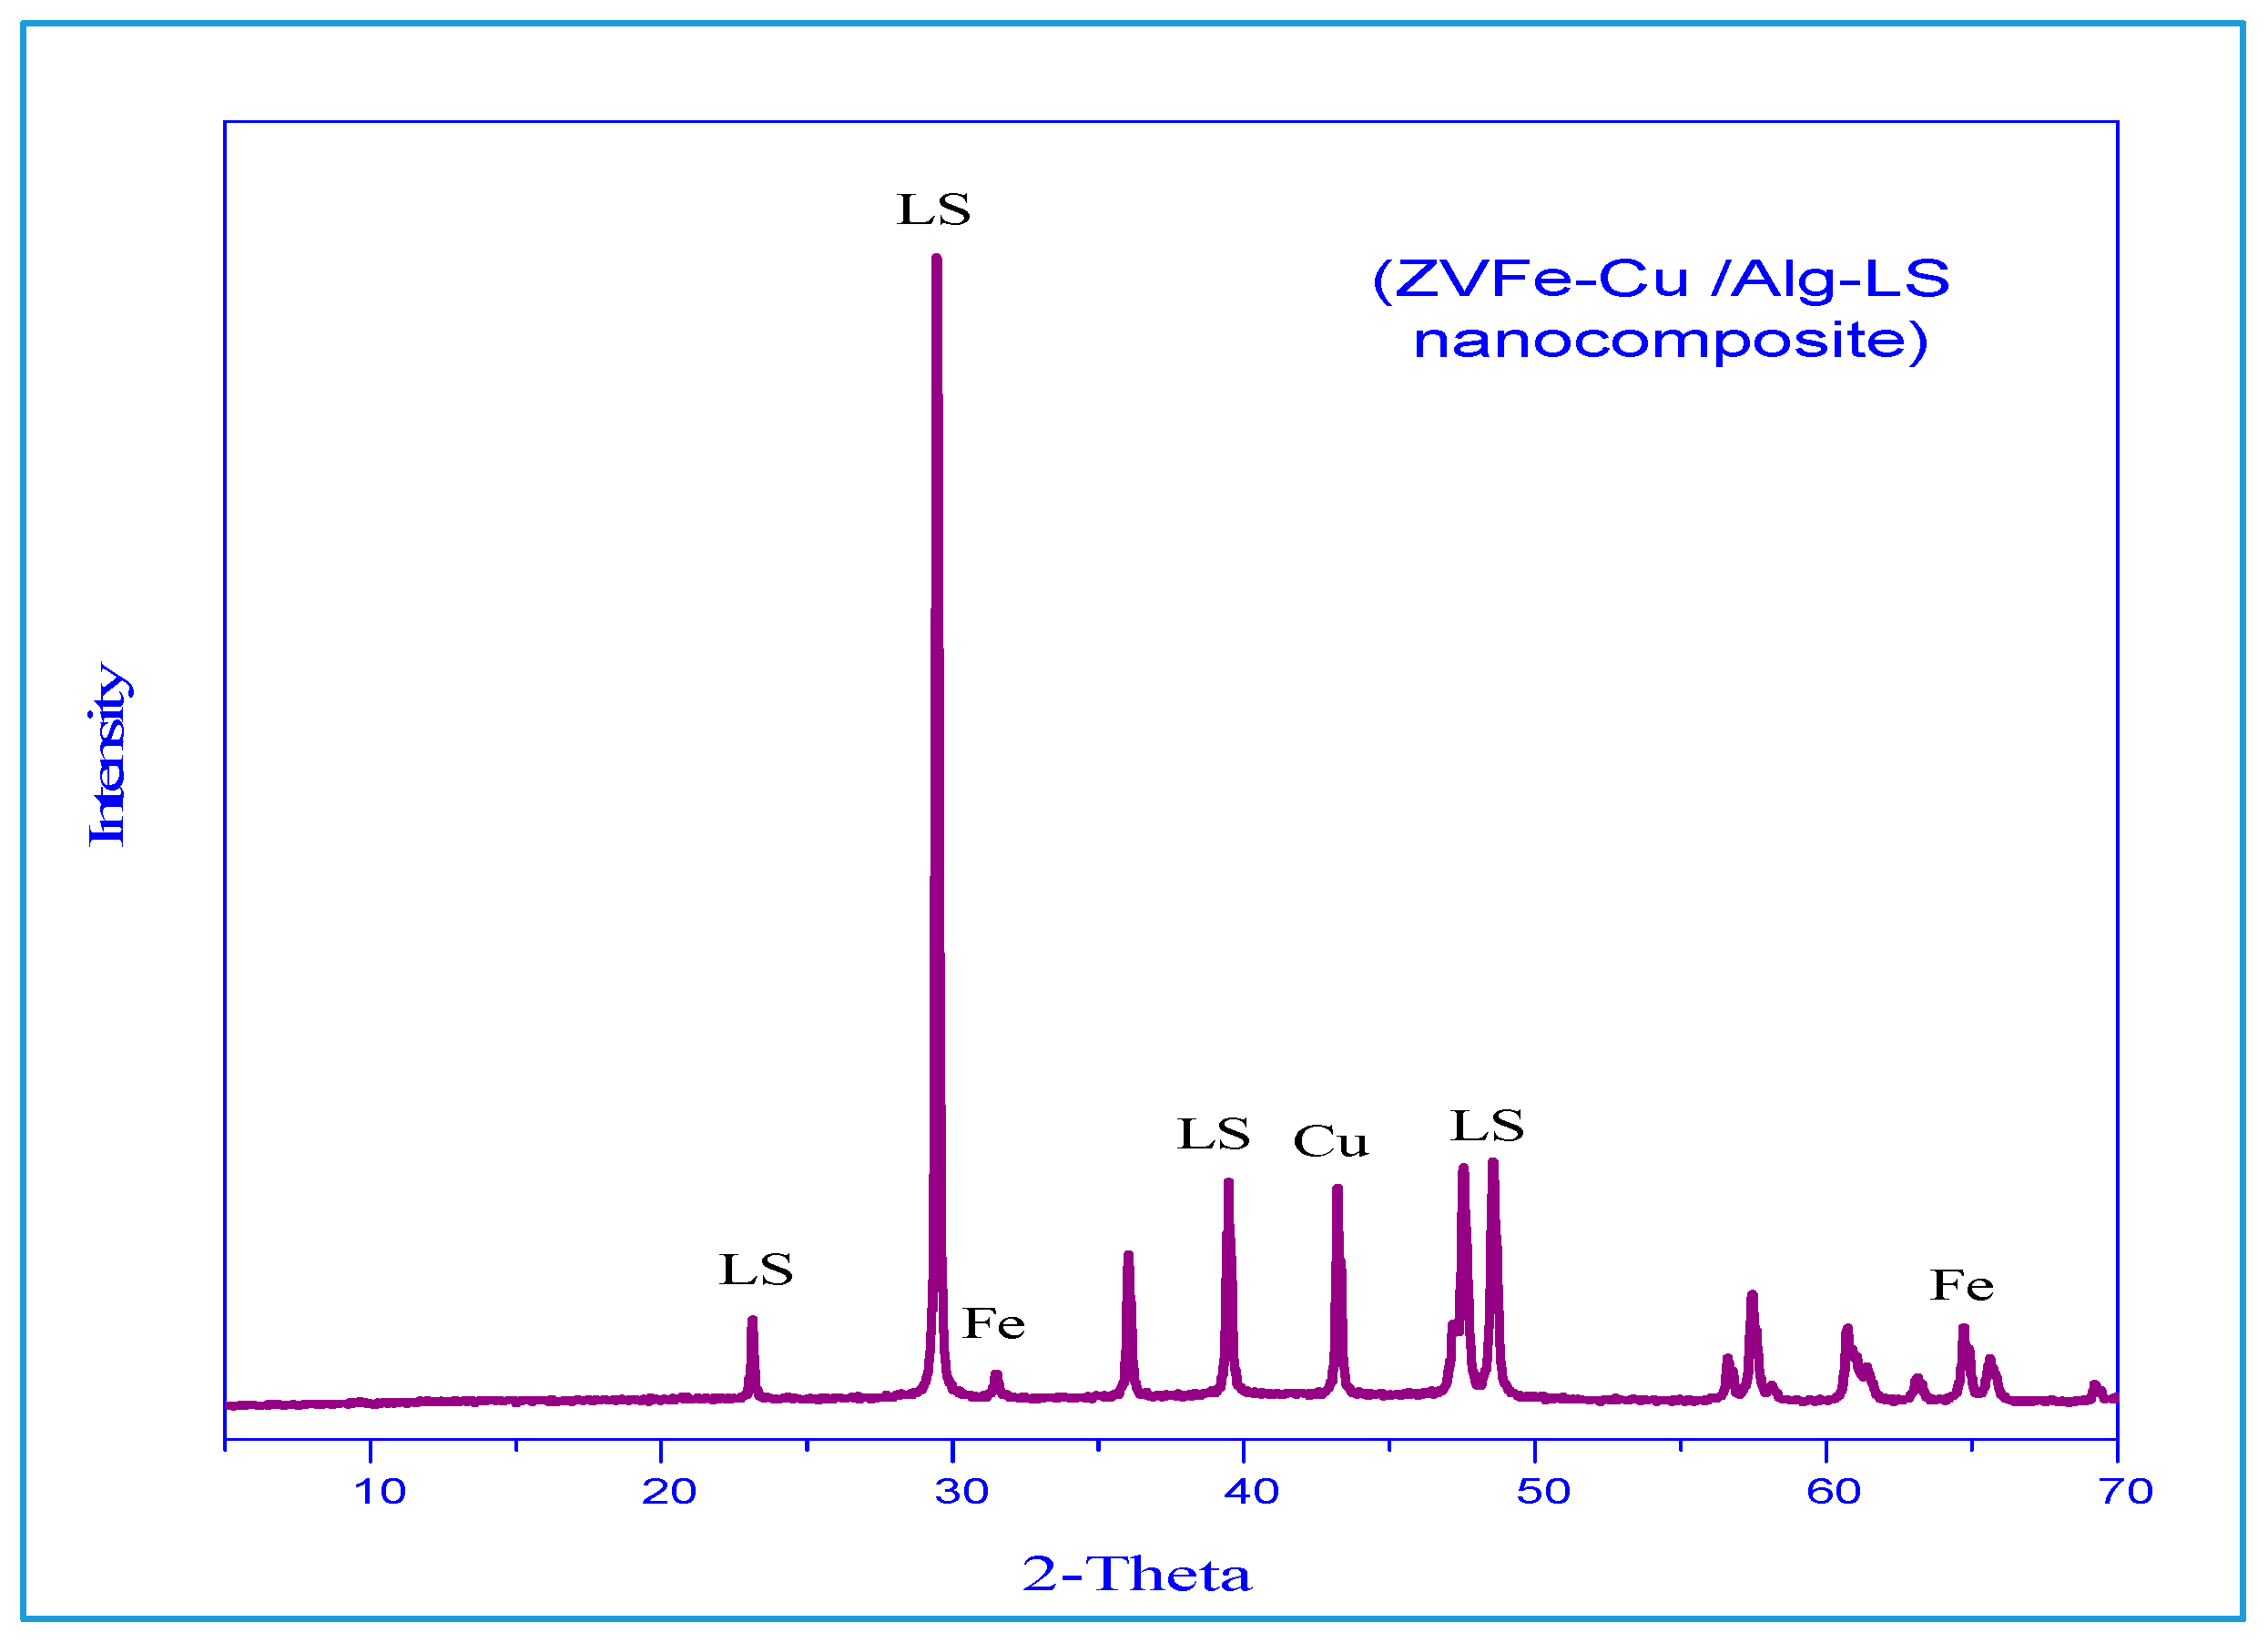
3.1.2. XRD Study
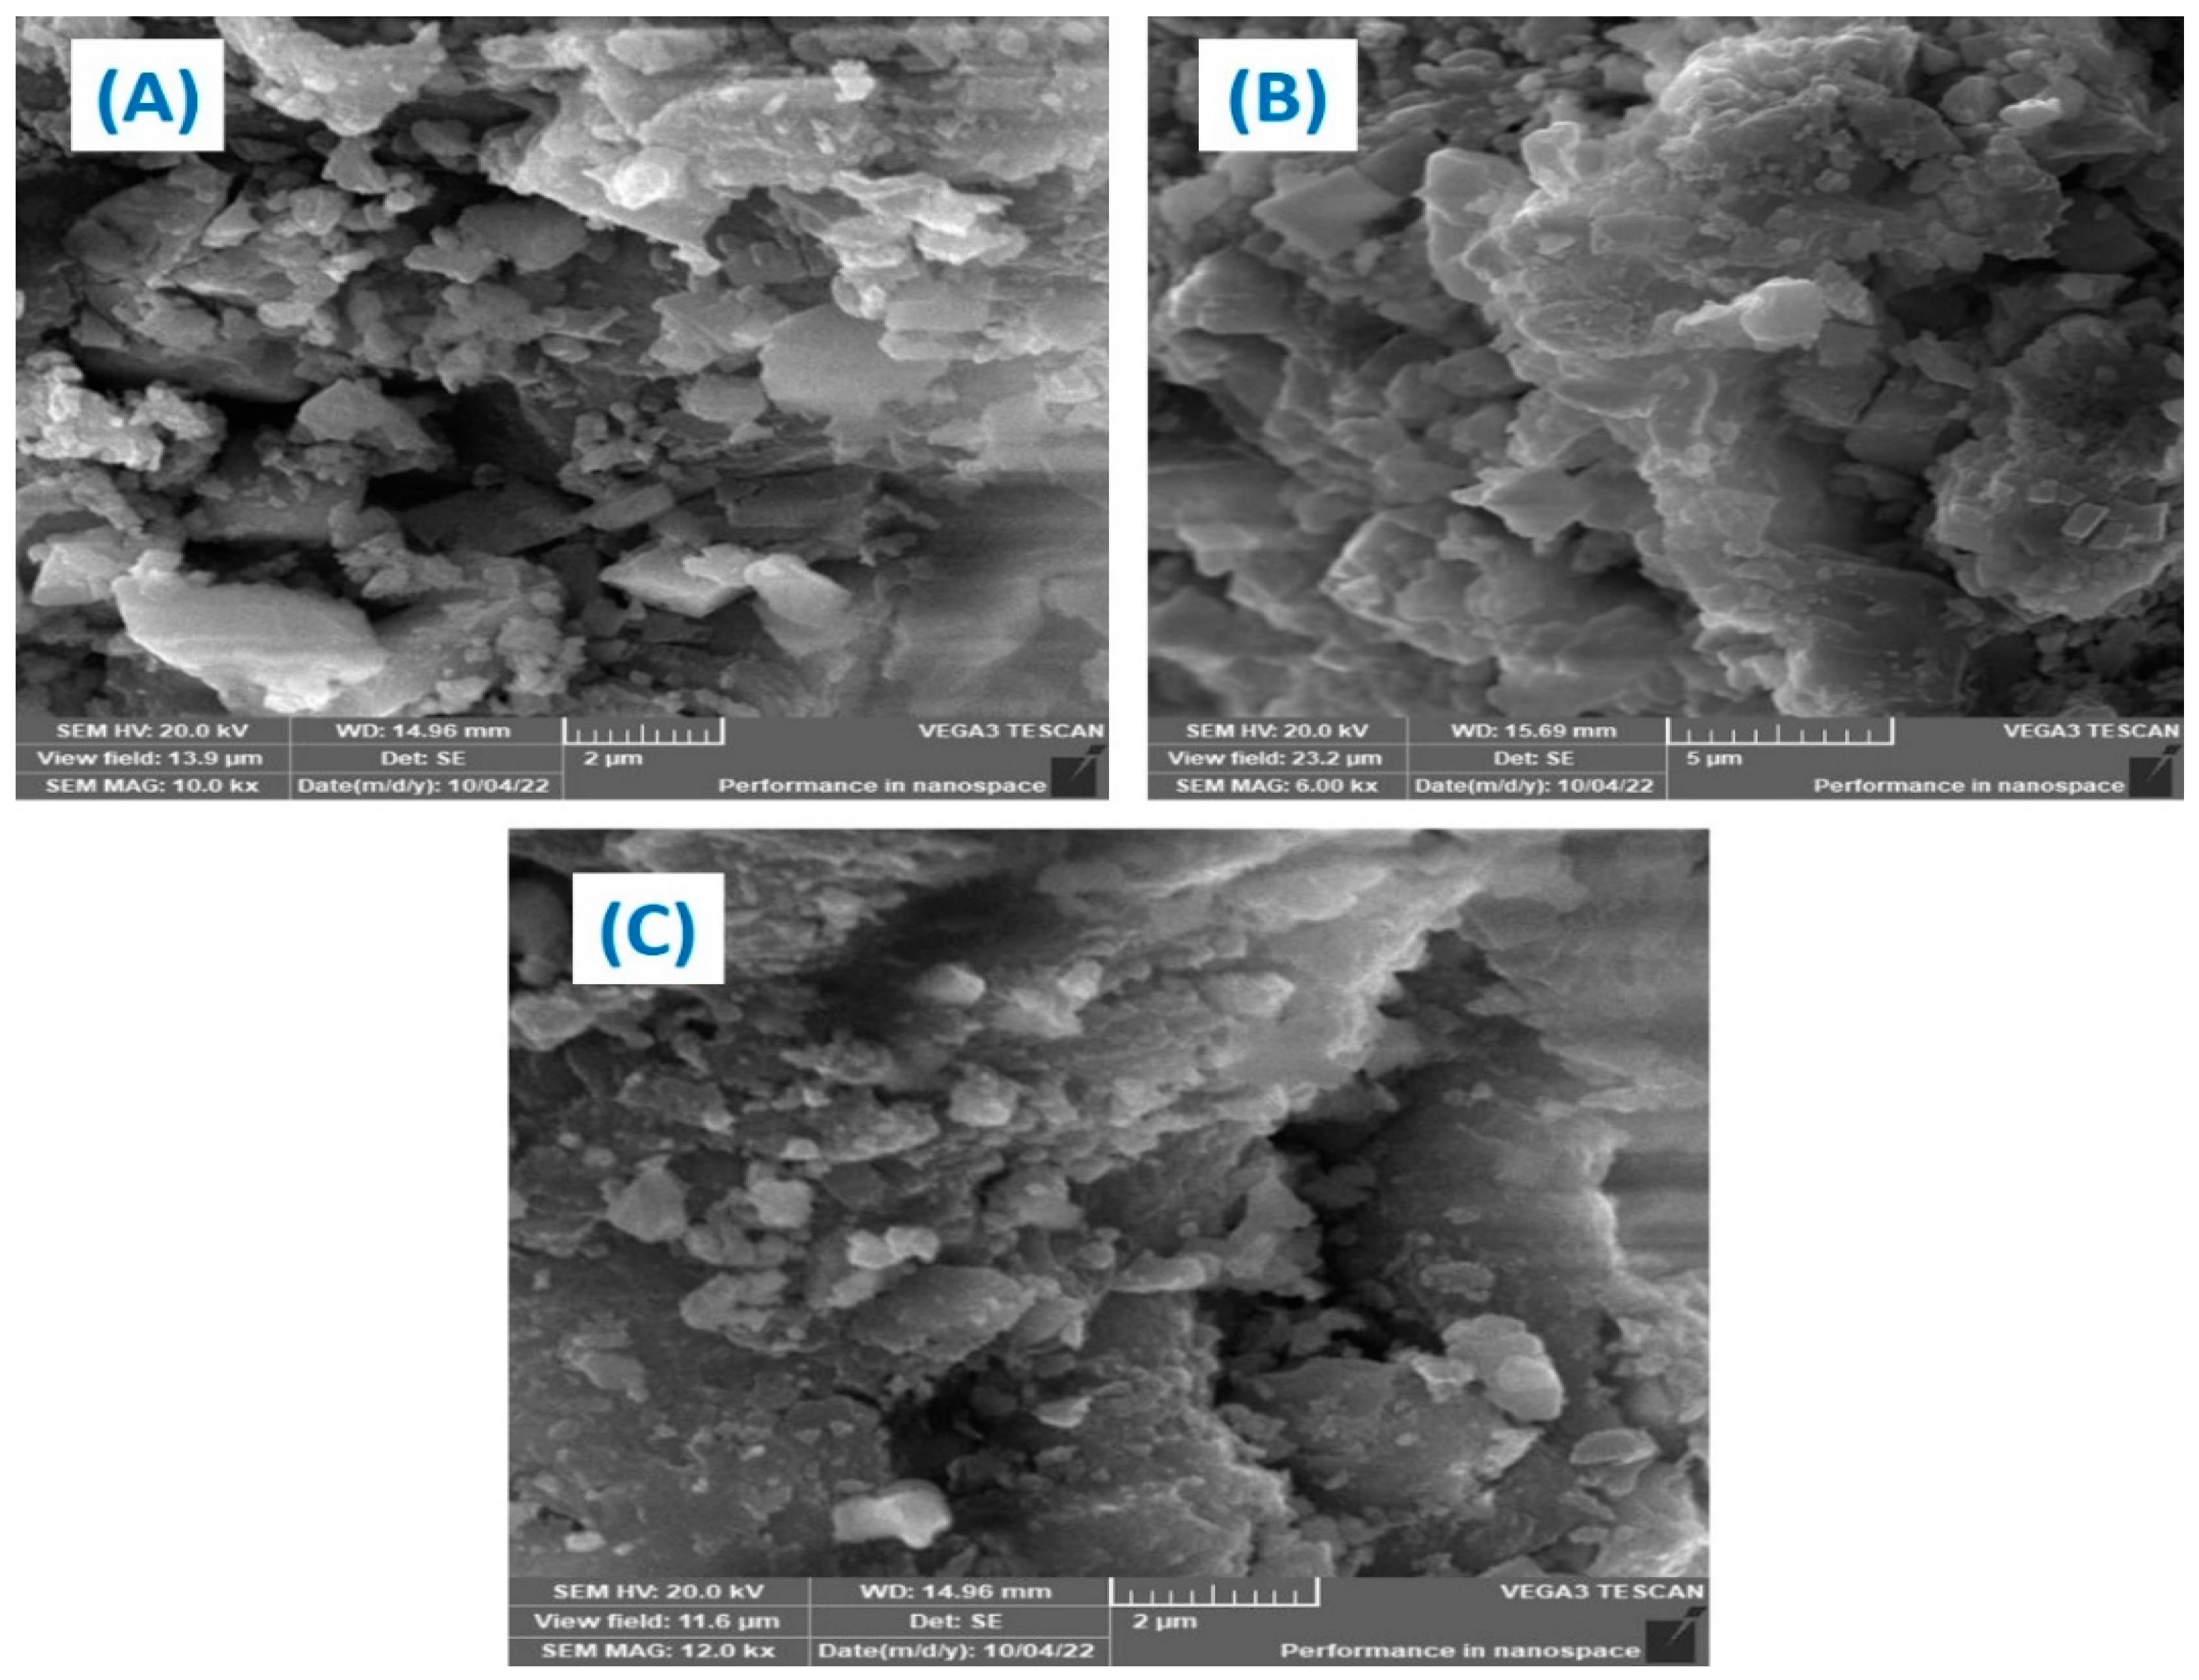
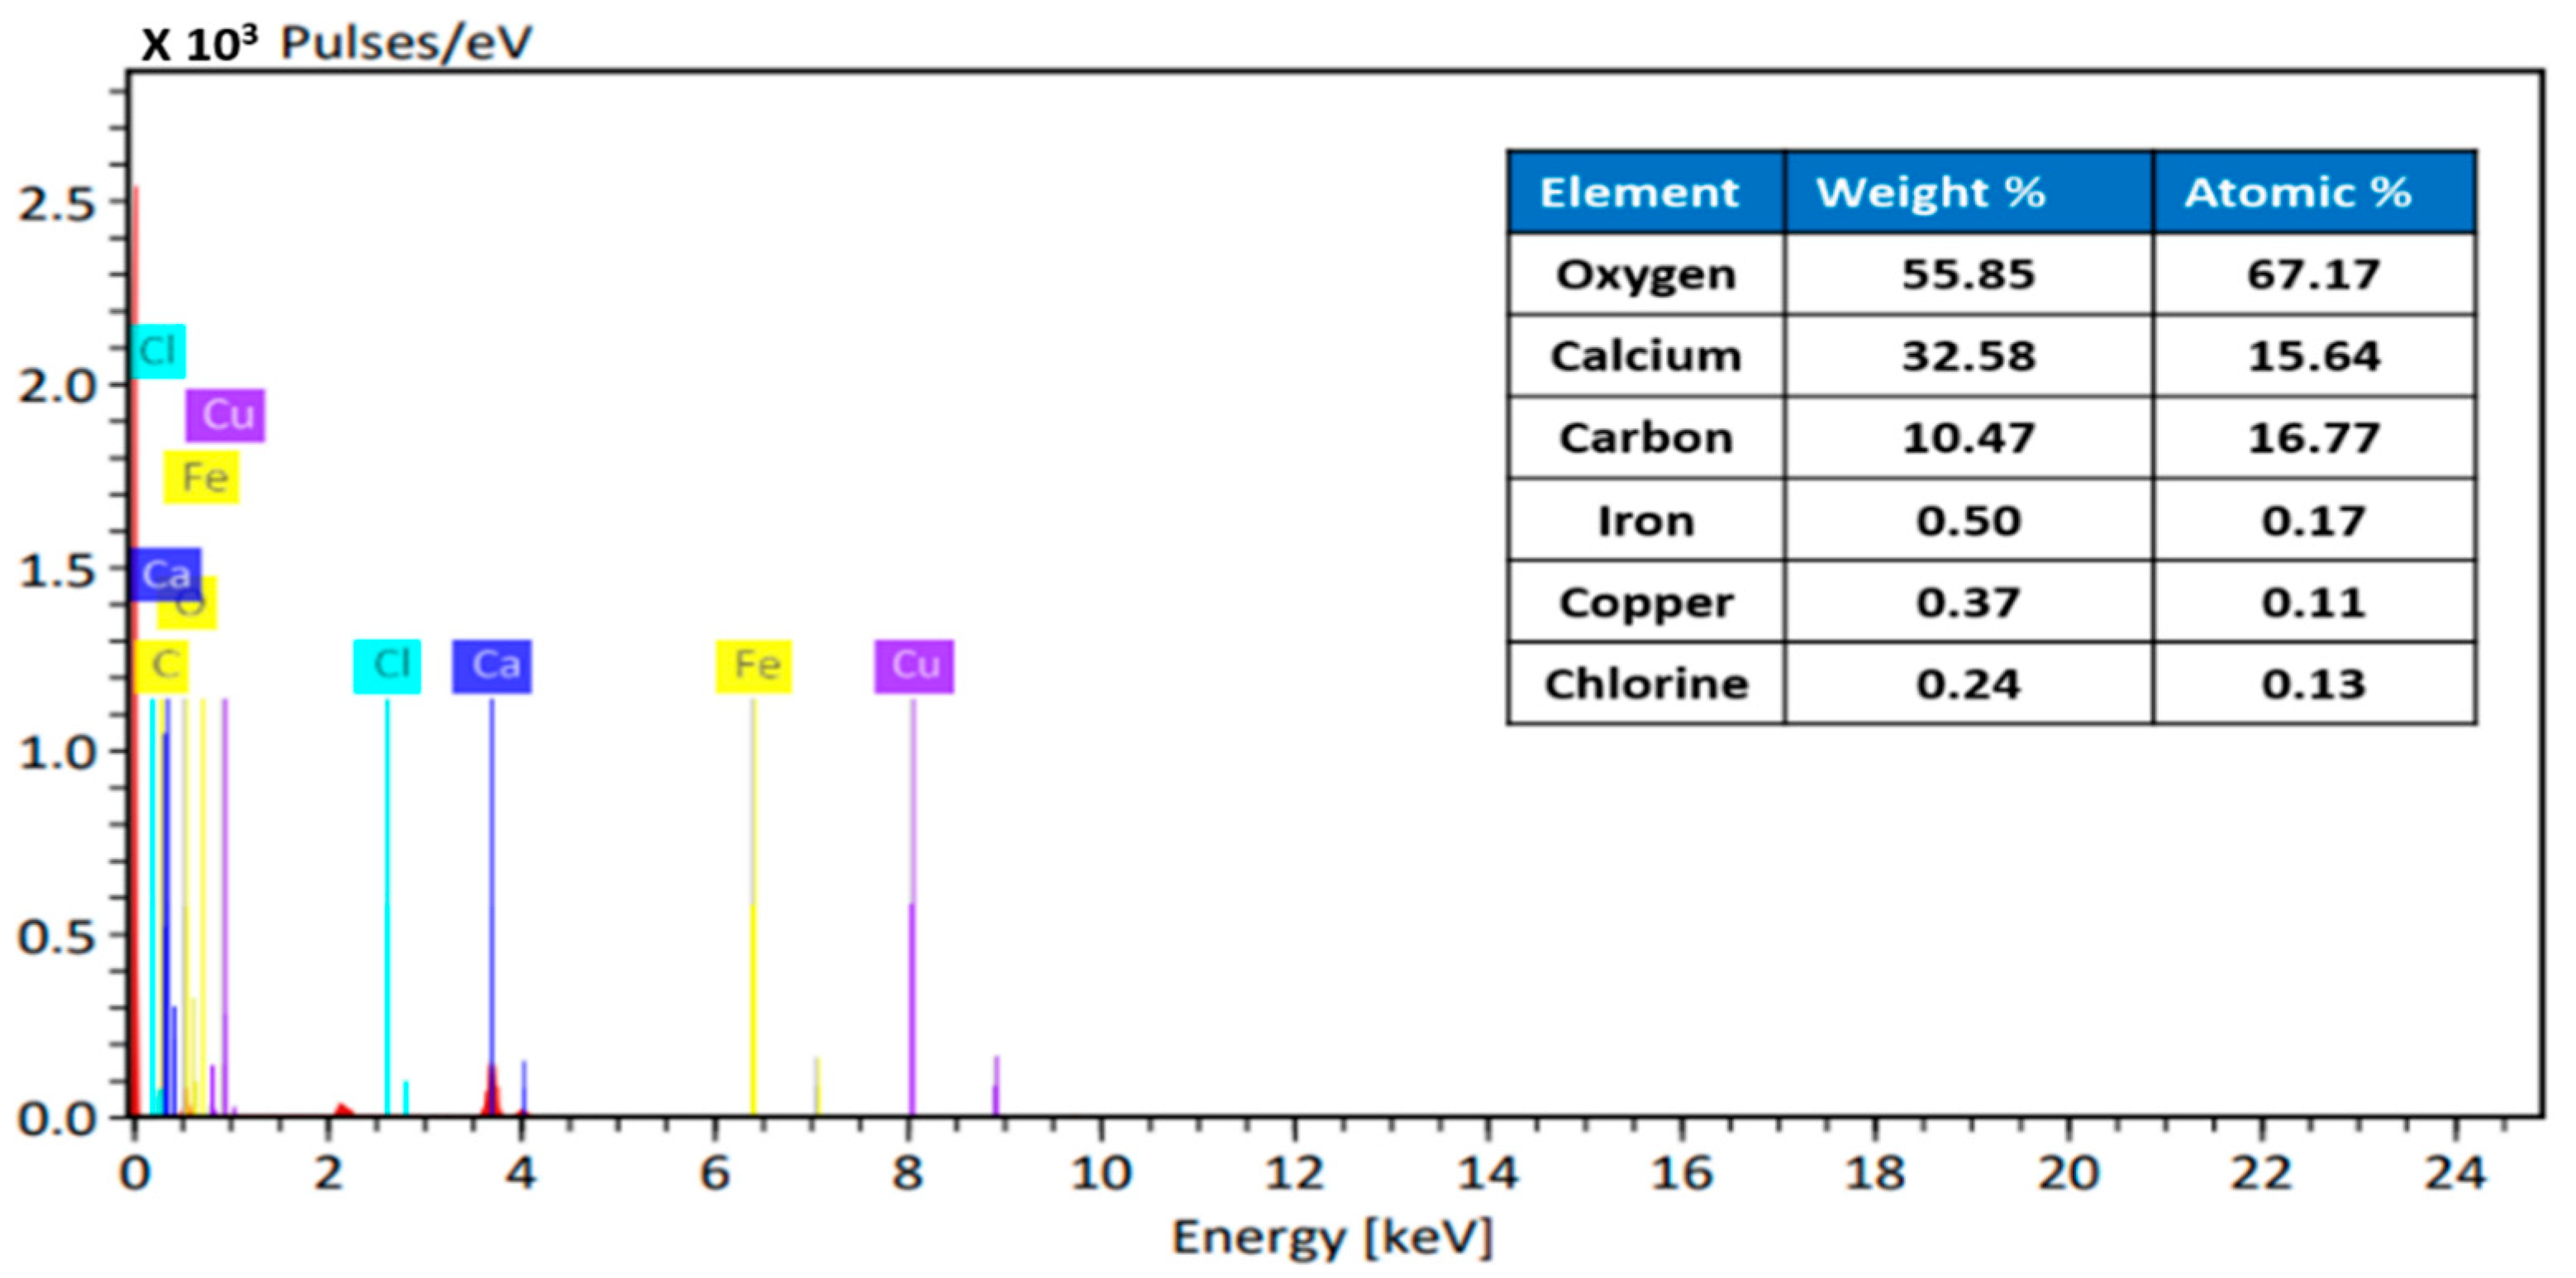
3.1.3. SEM and EDX Study
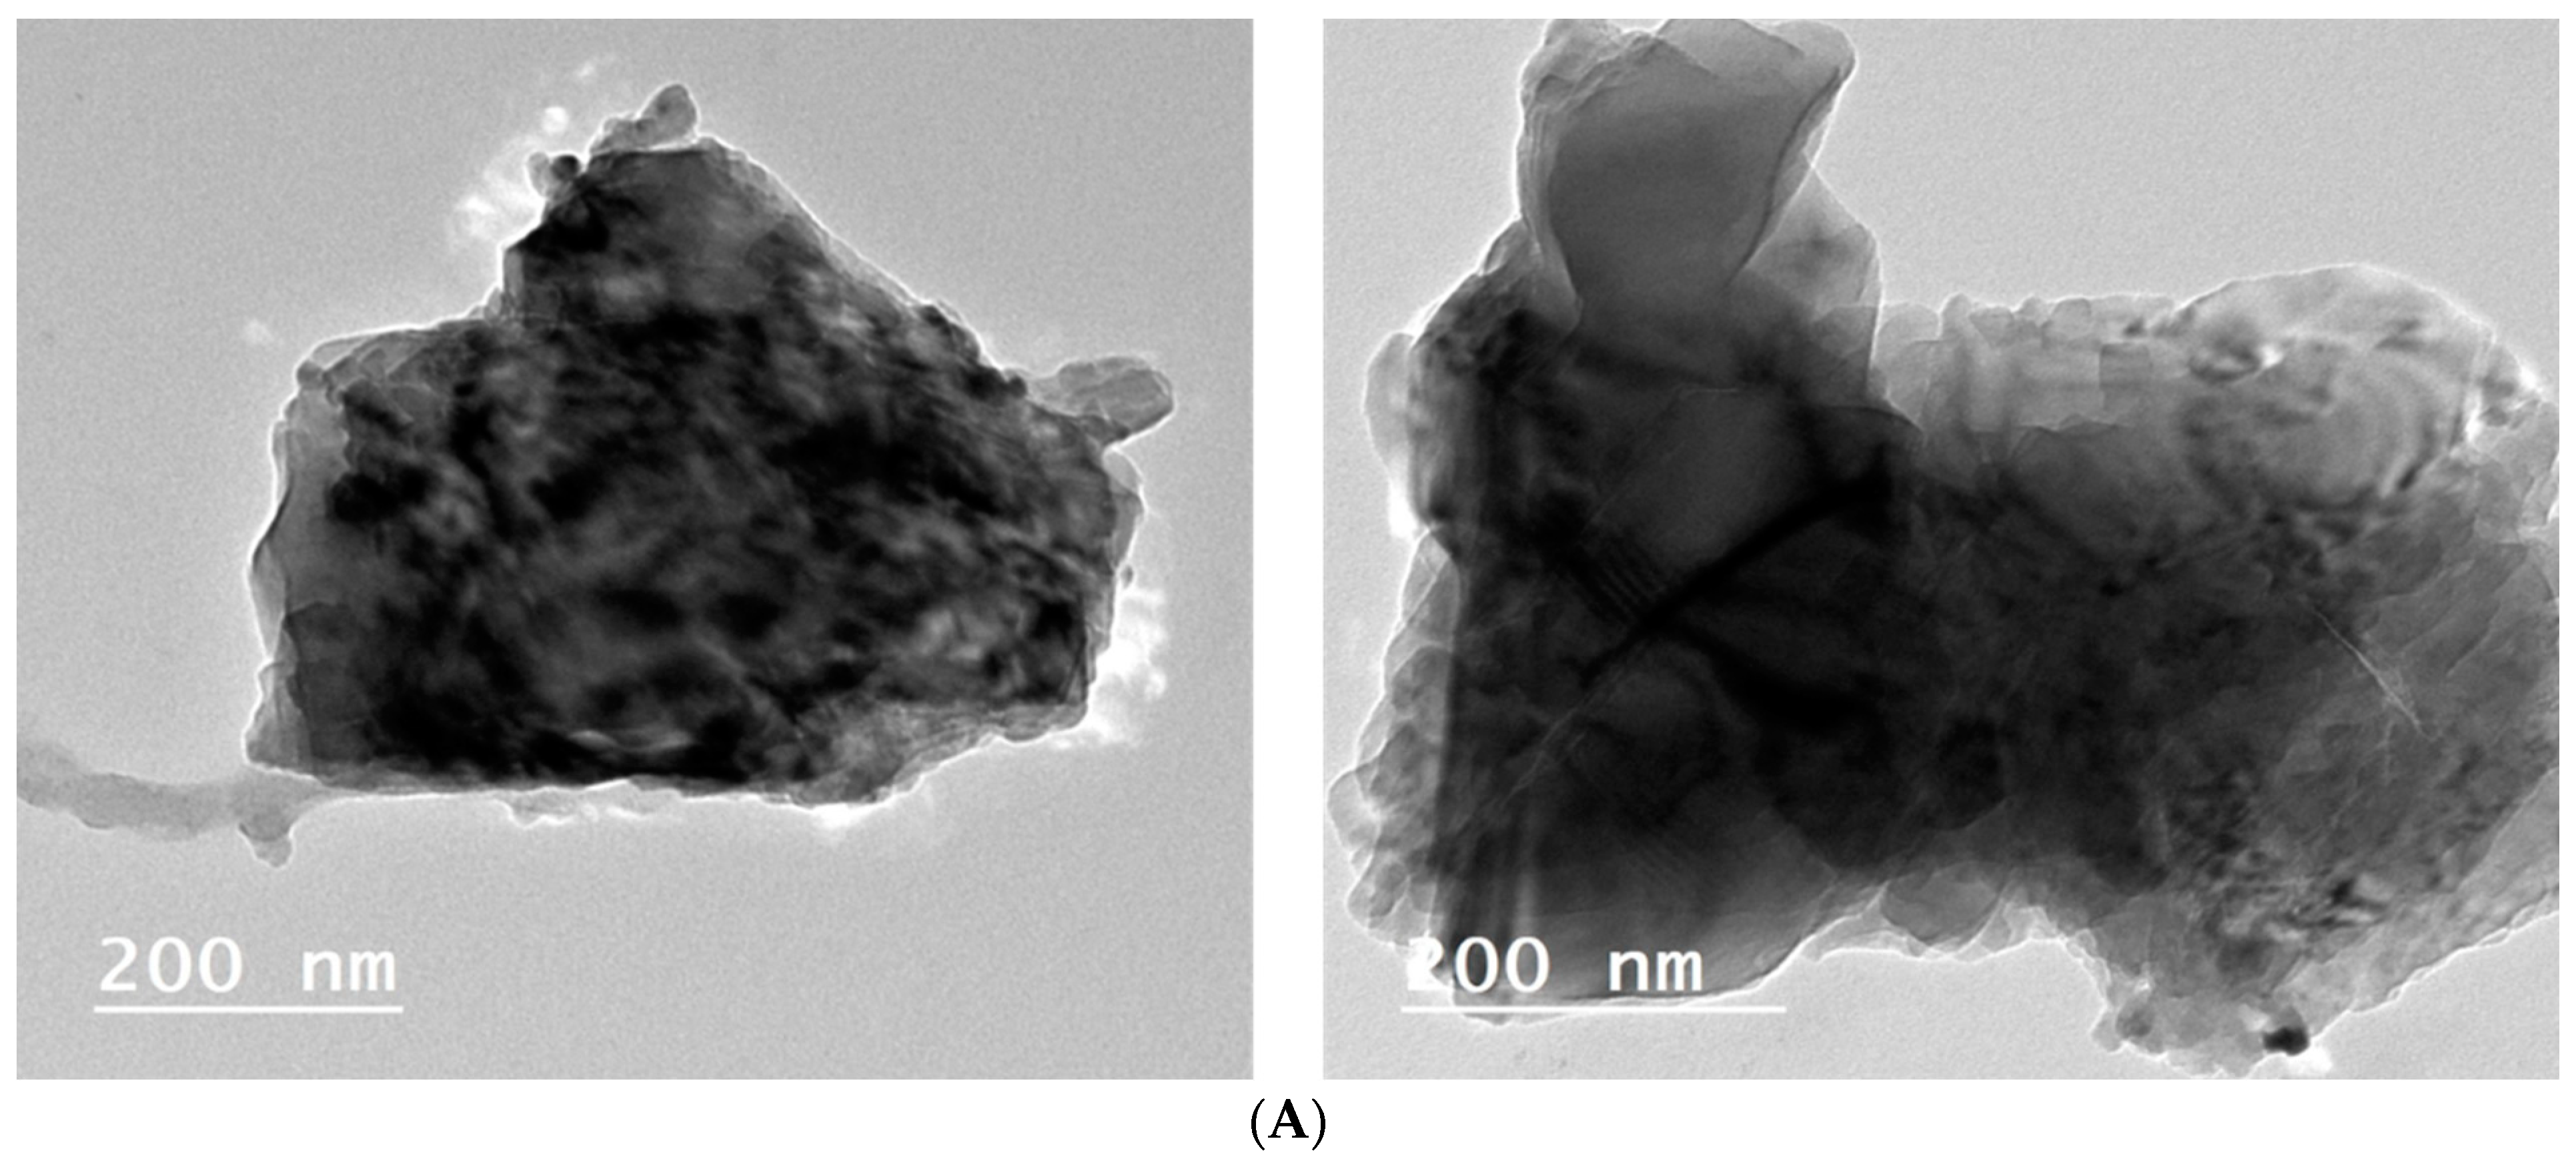
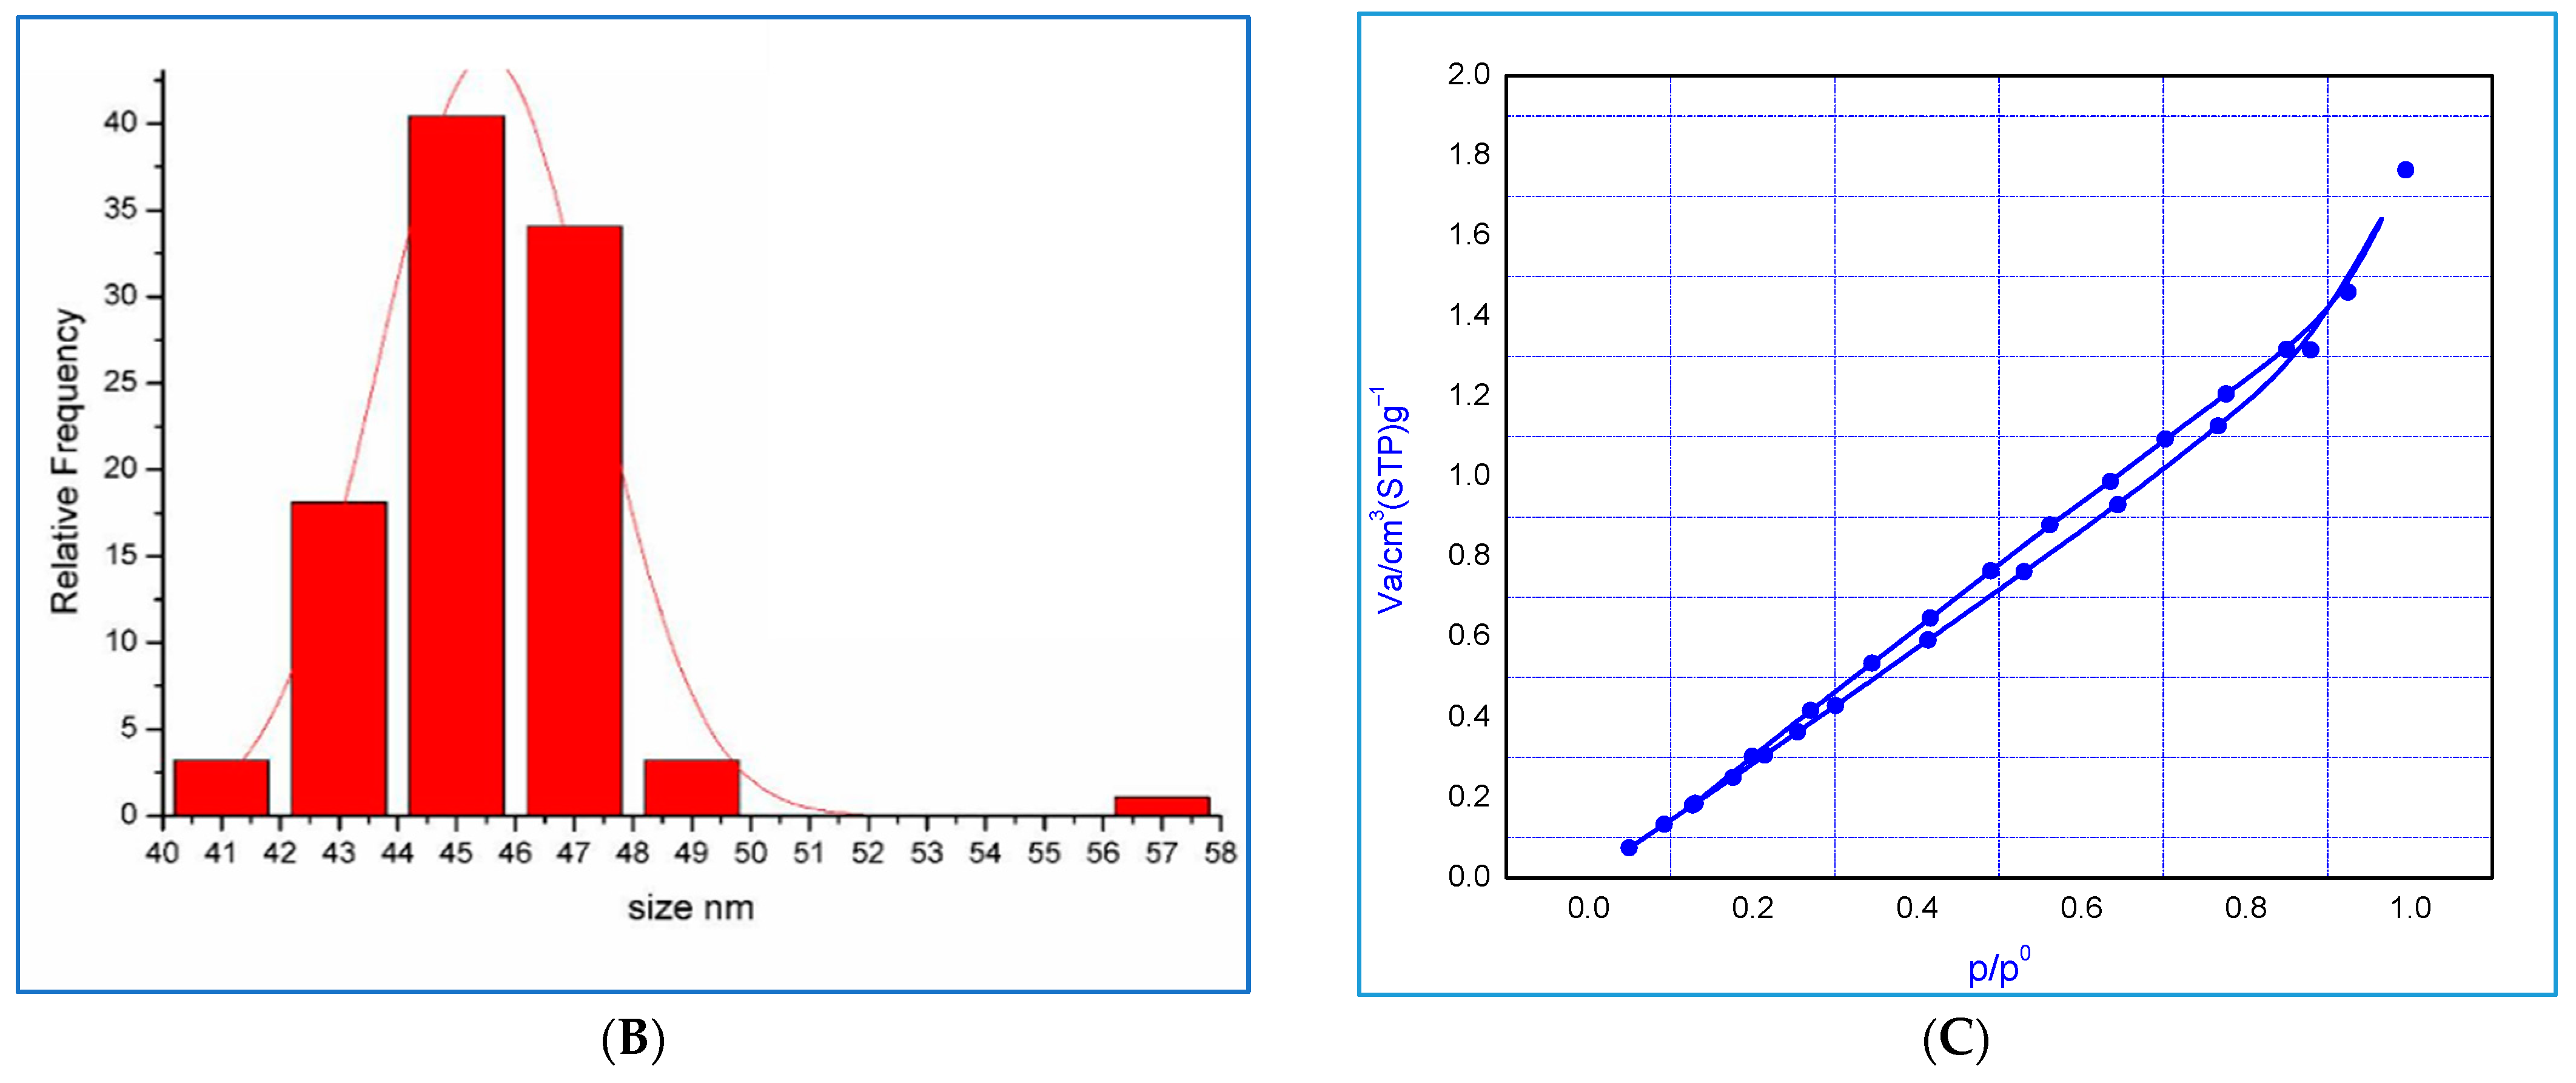
3.1.4. Transmission Electron Microscopy Study
3.1.5. BET Adsorption—Desorption Measurements
3.2. Performance of the Fe–Cu/Alg–LS Nanocomposite
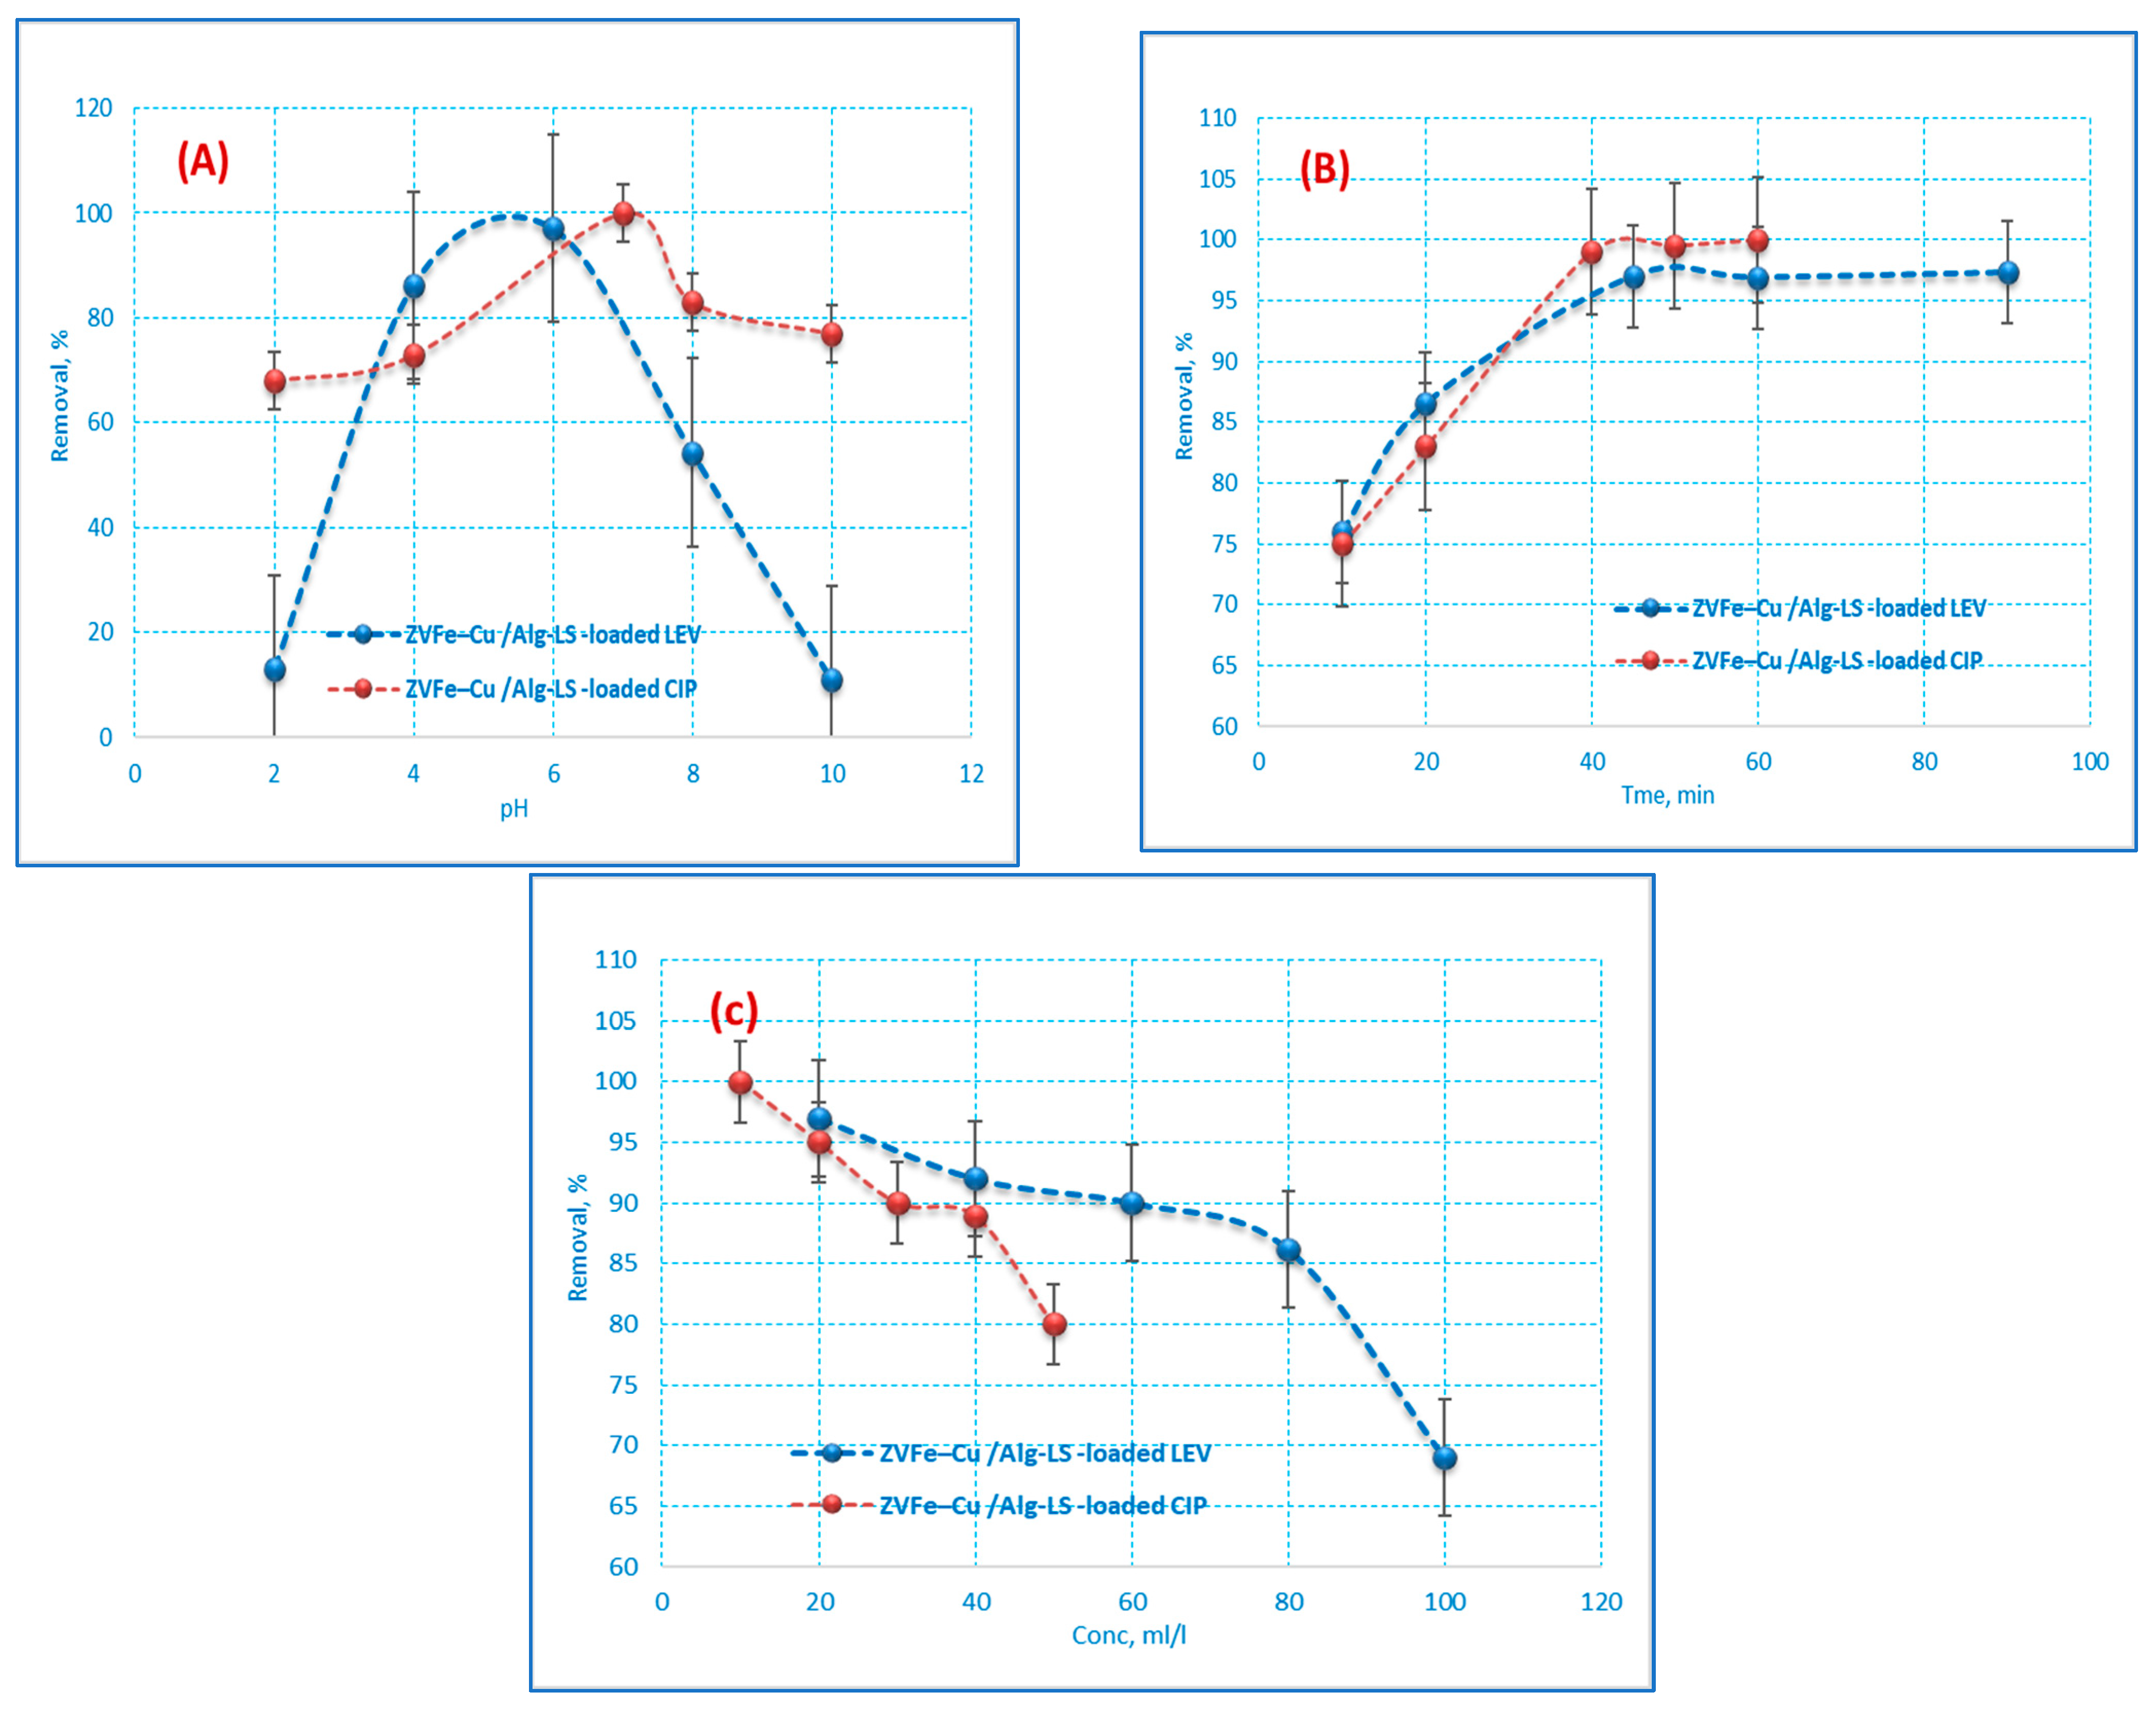
3.2.1. Effect of pH
3.2.2. Contact Time Effect
3.2.3. Effect of the CIP and LEV Concentrations
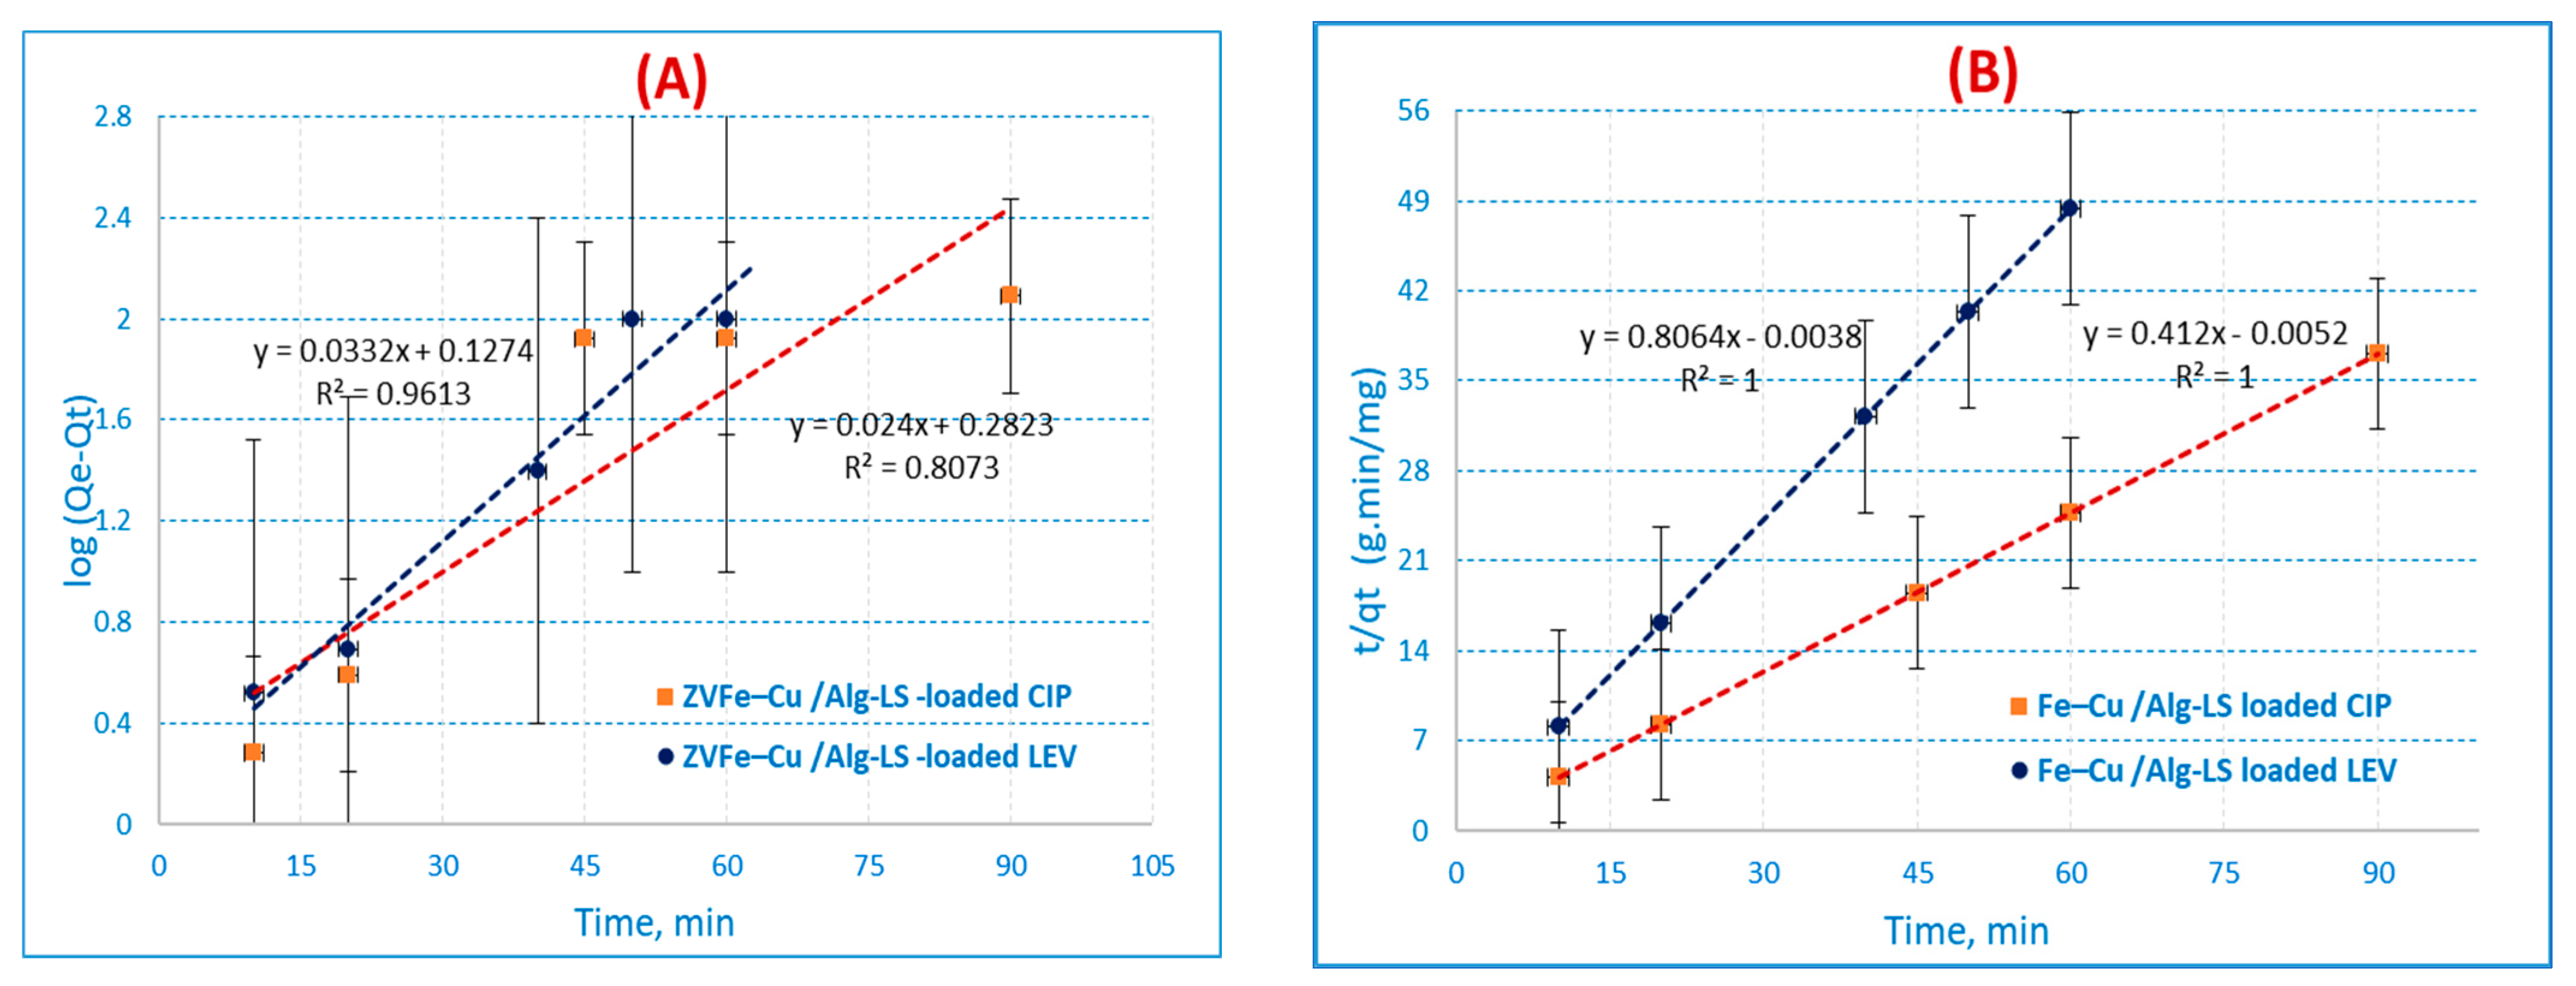
3.3. Kinetic Models
3.3.1. Pseudo-First-Order Reaction Kinetics
3.3.2. Pseudo-Second-Order Reaction
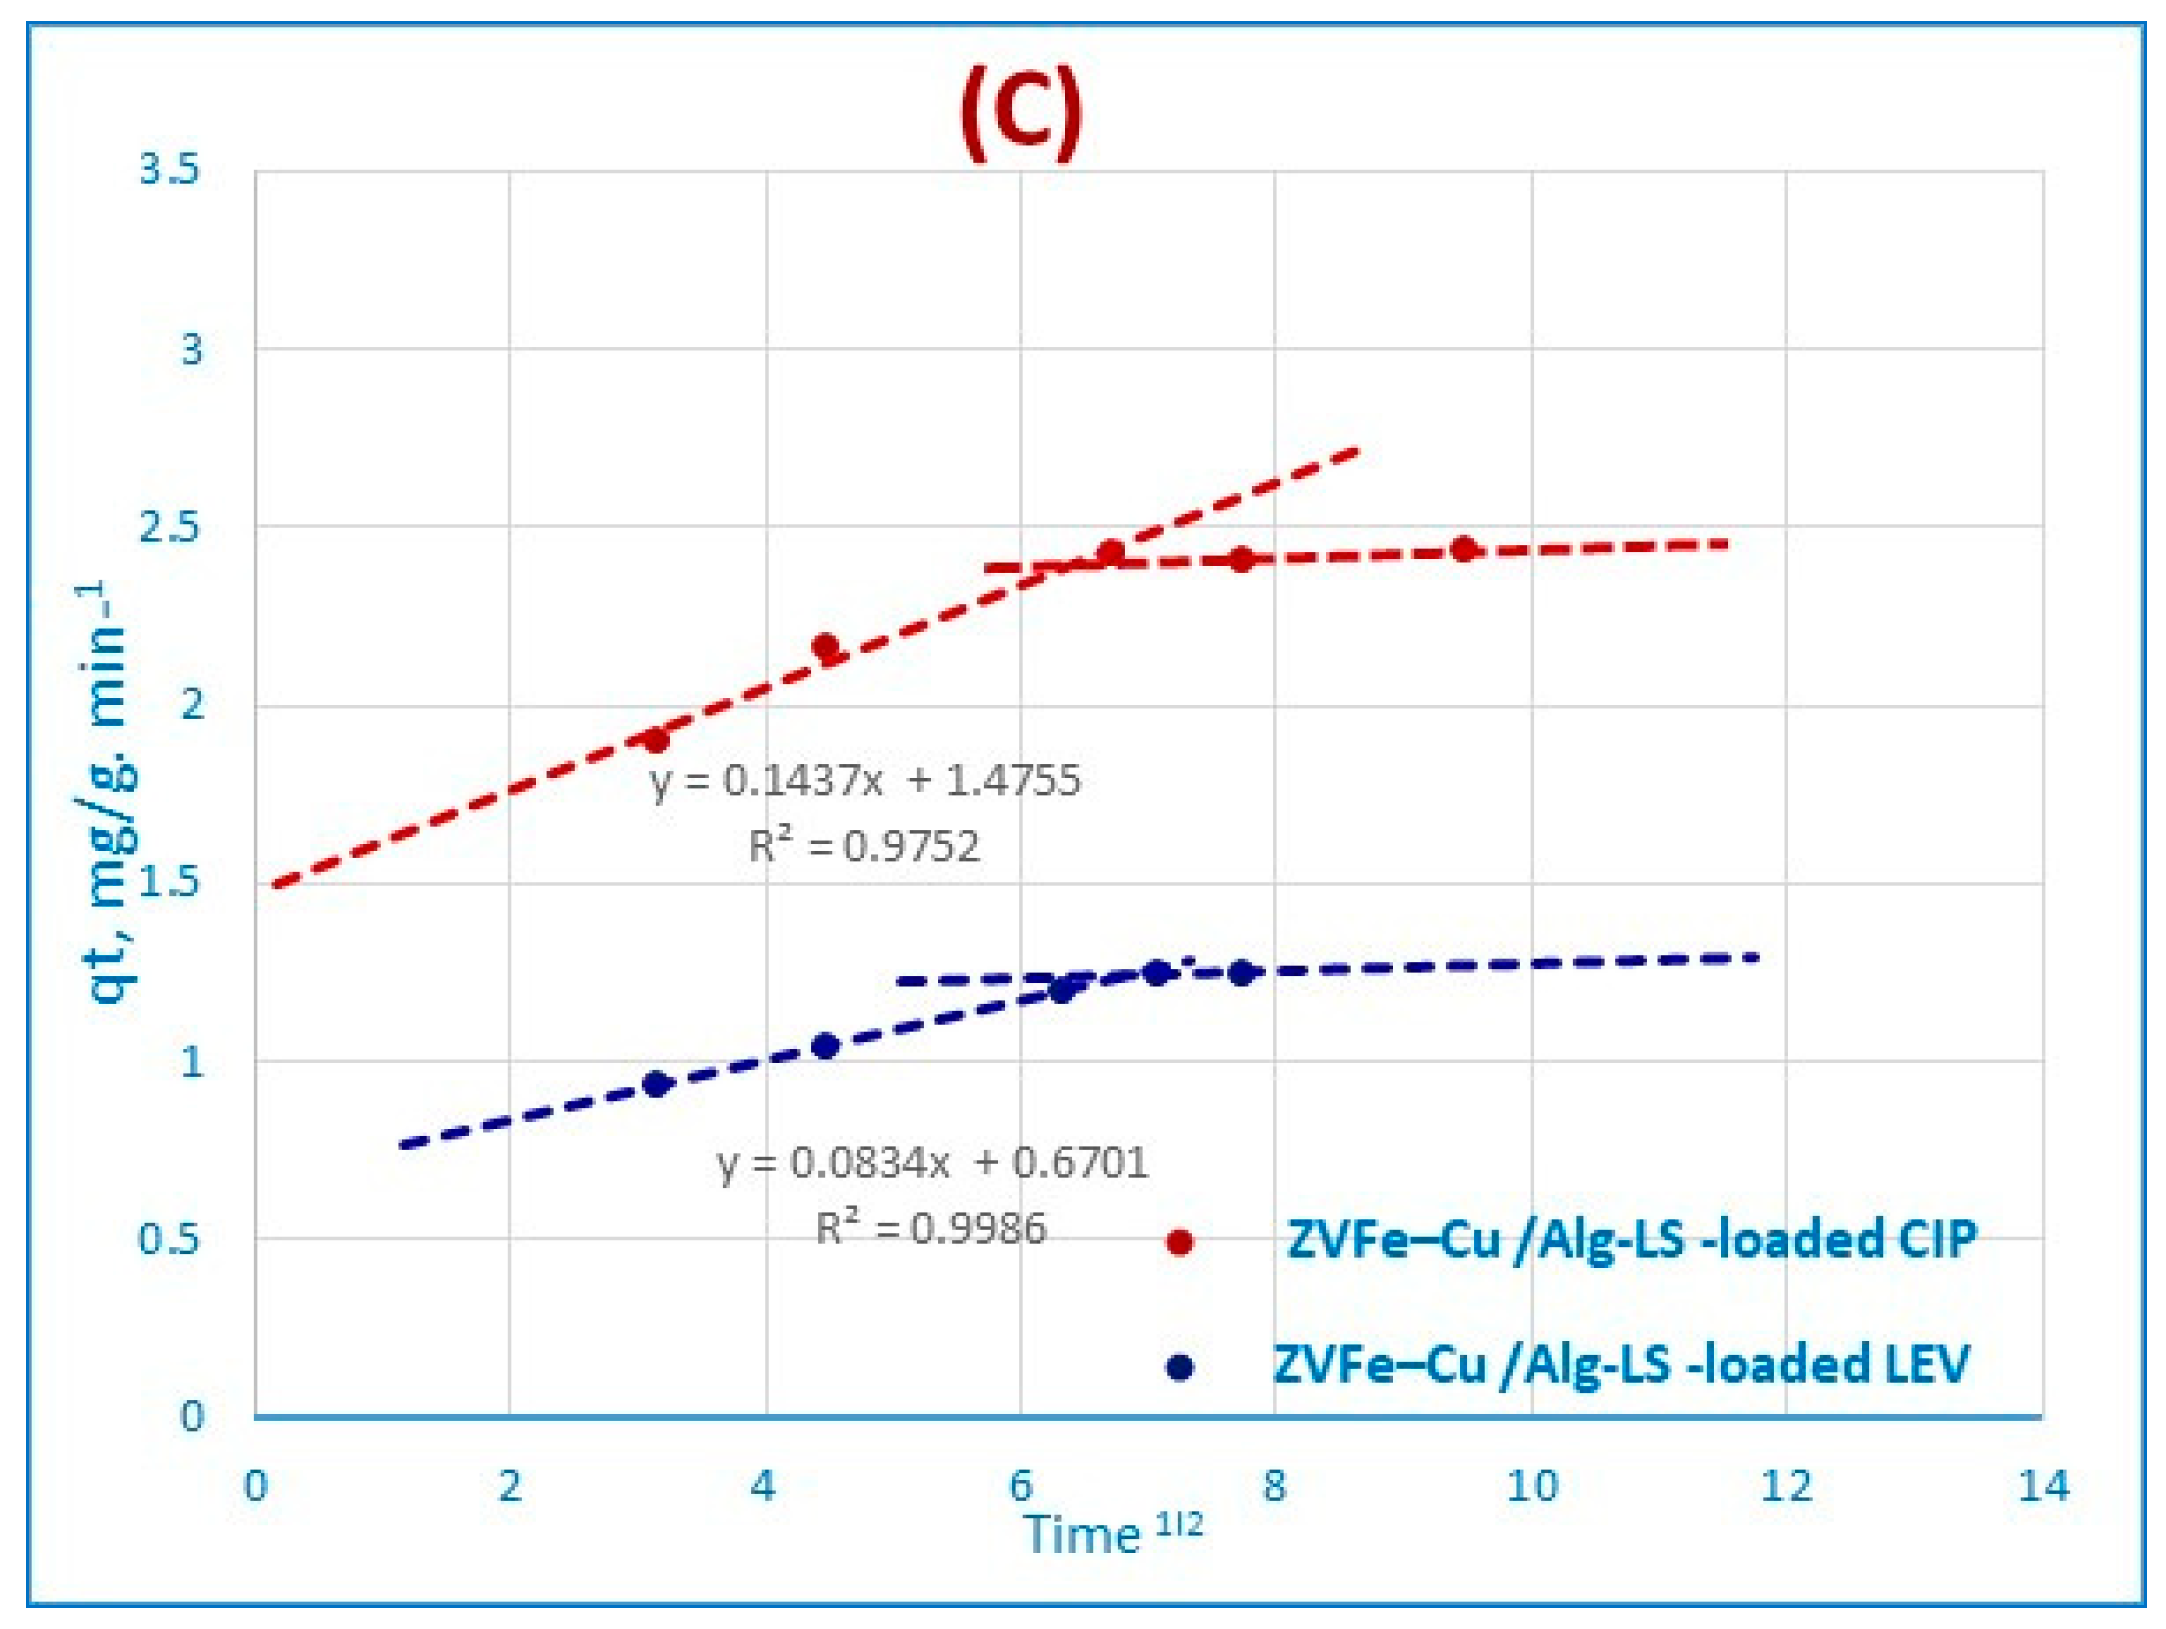
3.3.3. Morris–Weber Kinetic Equation
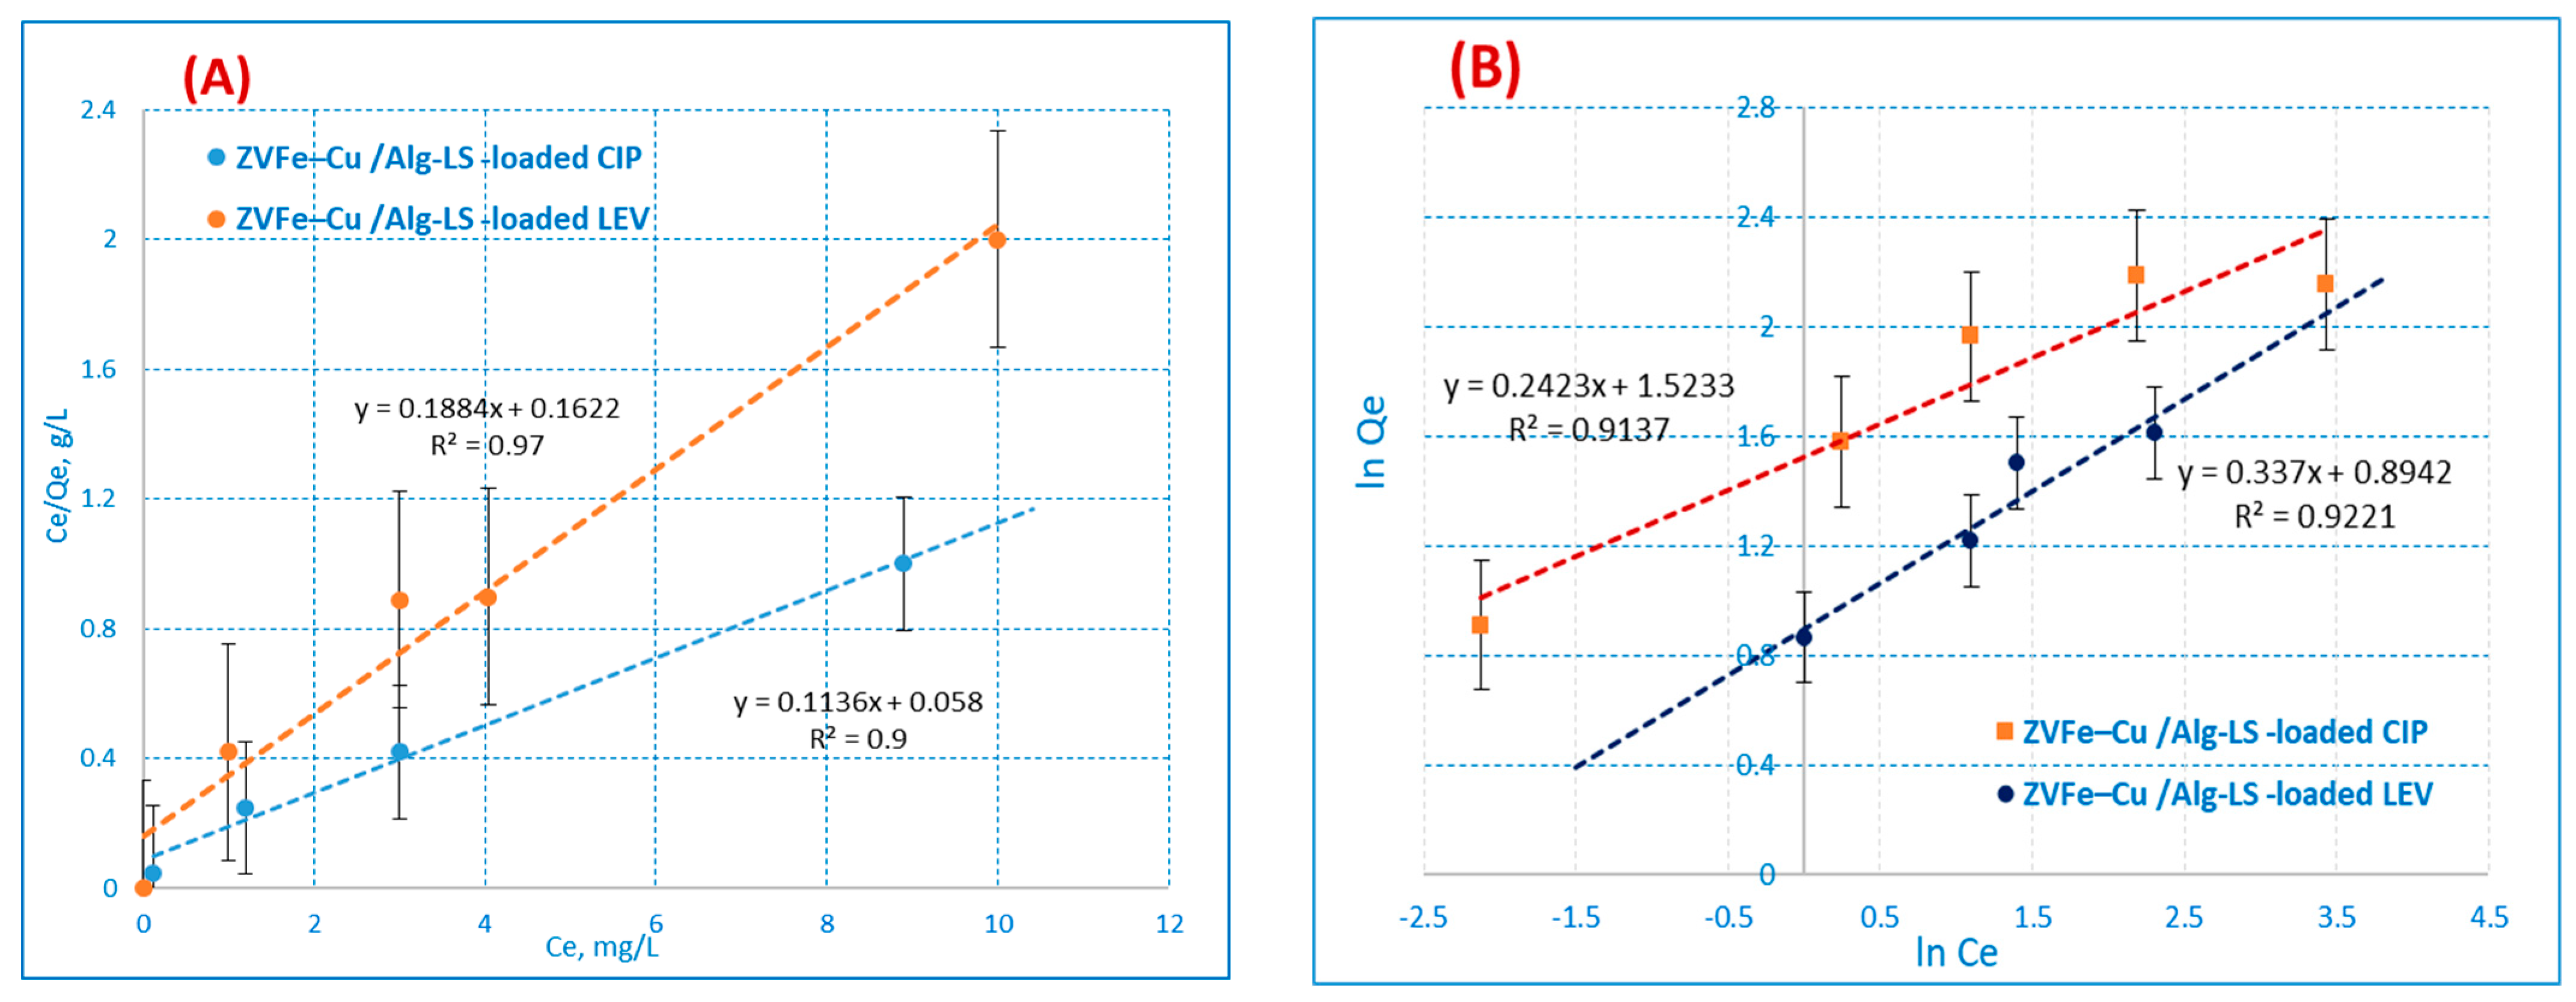
3.4. Isotherm Model
Dubinin–Radushkevich Isotherm
3.5. Sorption Thermodynamics
3.6. A Comparison Study
4. Conclusions
Author Contributions
Funding
Institutional Review Board Statement
Informed Consent Statement
Data Availability Statement
Acknowledgments
Conflicts of Interest
Sample Availability
References
- Ilavský, J.; Barloková, D.; Marton, M. Removal of Specific Pharmaceuticals from Water using Activated Carbon. IOP Conf. Ser. Earth Environ. Sci. 2021, 906, 012065. [Google Scholar] [CrossRef]
- Karungamye, P. Methods used for removal of pharmaceuticals from waste water: Review. Appl. J. Environ. Eng. Sci. 2020, 6, 412–428. [Google Scholar]
- Geetha, G.; Chandrasekaran, N.; Amitava, M. Adsorptive removal of fluoroquinolone antibiotics using green synthesized and highly efficient Fe clay cellulose-acrylamide beads. Environ. Technol. Innov. 2022, 28, 102783. [Google Scholar]
- Oladipo, A.; Mustafa, F.; Ezugwu, O.; Gazi, M. Efficient removal of antibiotic in single and binary mixture of nickel by electrocoagulation process: Hydrogen generation and cost analysis. Chemosphere 2022, 300, 134532. [Google Scholar] [CrossRef] [PubMed]
- Nasrollahi, N.; Vatanpour, V.; Khataee, A. Removal of antibiotics from wastewaters by membrane technology: Limitations, successes, and future improvements. Sci. Total Environ. 2022, 838, 156010. [Google Scholar] [CrossRef]
- Wang, X.; Li, F.; Hu, X.; Hua, T. Electrochemical advanced oxidation processes coupled with membrane filtration for degrading antibiotic residues: A review on its potential applications, advances, and challenges. Sci. Total Environ. 2021, 784, 146912. [Google Scholar] [CrossRef]
- Jie, X.; Xuehai, Y.; Meng, L.; Ye, T.; Xiaodong, L.; Fazhi, Z. Iron-containing palygorskite clay as Fenton reagent for the catalytic degradation of phenol in water. RSC Adv. 2021, 11, 29537–29542. [Google Scholar]
- Mezni, M.; Saied, T.; Horri, N.; Srasra, E. Removal of enrofloxacin from aqueous solutions using illite and synthetic zeolite X. Surf. Eng. Appl. Electrochem. 2017, 53, 89–97. [Google Scholar] [CrossRef]
- El-Shafey, E.-S.I.; Al-Lawati, H.; Al-Sumri, A.S. Ciprofloxacin adsorption from aqueous solution onto chemically prepared carbon from date palm leaflets. J. Environ. Sci. 2012, 24, 1579–1586. [Google Scholar] [CrossRef]
- El-Baz, A.A.; Hendy, I.A.; Dohdoh, A.M.; Srour, M.I. Adsorption technique for pollutants removal; current new trends future challenges—A Review. EIJEST 2020, 33, 1–24. [Google Scholar] [CrossRef]
- Hao, R.; Li, D.; Zhang, J.; Jiao, T. Green Synthesis of Iron Nanoparticles Using Green Tea and Its Removal of Hexavalent Chromium. Nanomaterials 2021, 11, 650. [Google Scholar] [CrossRef]
- Zha, S.; Cheng, Y.; Gao, Y.; Chen, Z.; Megharaj, M.; Naidu, R. Nanoscale zero-valent iron as a catalyst for heterogeneous Fenton oxidation of amoxicillin. Chem. Eng. J. 2014, 255, 141–148. [Google Scholar] [CrossRef]
- Inas, A.A.; Hala, S.H.; Ahmed, H.R.; Najla, A.; Ayman, A.G. Investigation the Effects of Green-Synthesized Copper Nanoparticles on the Performance of Activated Carbon-Chitosan-Alginate for the Removal of Cr(VI) from Aqueous Solution. Molecules 2021, 26, 2617. [Google Scholar]
- Anamika, G.; Shalu, R.; Lata, V.; Jiwan, S.; Samiksha, S.; Yadav, B.C.; Ajay, S.K. Green synthesis of iron nanoparticle from extract of waste tea: An application for phenol red removal from aqueous solution. Environ. Nanotechnol. Monit. Manag. 2018, 10, 377–387. [Google Scholar]
- Silva, E.C.; Soares, V.R.; Fajardo, A.R. Removal of pharmaceuticals from aqueous medium by alginate/polypyrrole/ZnFe2O4 beads via magnetic field enhanced adsorption. Chemosphere 2023, 316, 137734. [Google Scholar] [CrossRef] [PubMed]
- Wasilewska, M.; Deryło-Marczewska, A. Adsorption of Non-Steroidal Anti-Inflammatory Drugs on Alginate-Carbon Composites—Equilibrium and Kinetics. Materials 2022, 15, 6049. [Google Scholar] [CrossRef]
- Ragab, A.H.; Hussein, H.S.; Ahmed, I.A.; Abualnaja, K.M.; AlMasoud, N. An Efficient Strategy for Enhancing the Adsorption of Antibiotics and Drugs from Aqueous Solutions Using an Effective Limestone-Activated Carbon–Alginate Nanocomposite. Molecules 2021, 26, 5180. [Google Scholar] [CrossRef]
- Jibran, I.; Noor, S.S.; Murtaza, S.; Muhammad, I.; Nawshad, M.; Fares, M.H.; Sara, A.A.; Javed, A.K.; Zia, H.K.; Amit, B.; et al. Synergistic effects of activated carbon and nano-zerovalent copper on the performance of hydroxyapatite-alginate beads for the removal of As3+ from aqueous solution. J. Clean. Prod. 2019, 235, 875–886. [Google Scholar]
- Zhu, F.; Ma, S.; Liu, T.; Deng, X. Green synthesis of nano zero-valent iron/Cu by green tea to remove hexavalent chromium from groundwater. J. Clean. Prod. 2018, 174, 184–190. [Google Scholar] [CrossRef]
- Hu, Y.; Pan, C.; Zheng, X.; Liu, S.; Hu, F.; Xu, L.; Xu, G.; Peng, X. Removal of Ciprofloxacin with Aluminum-Pillared Kaolin Sodium Alginate Beads (CA-Al-KABs): Kinetics, Isotherms, and BBD Model. Water 2020, 12, 905. [Google Scholar] [CrossRef]
- Al-Jabari, M.H.; Saleh, S.; Shahid, A.; Reem, B.; Asem, M.; Safyan, A.K. Adsorption study of levofloxacin on reusable magnetic nanoparticles: Kinetics and antibacterial activity. J. Mol. Liq. 2019, 291, 111249. [Google Scholar] [CrossRef]
- Bilgehan, N.; Taylan, D.; Serdar, K. Behavior and Removal of Ciprofloxacin and Sulfamethoxazole Antibiotics in Three Different Types of Full-Scale Wastewater Treatment Plants: Comparative Study. Water Air Soil Pollut. 2021, 232, 127. [Google Scholar]
- Iqbal, A.; Raheela, B.; Muhammad, A.; Sofia, A.; Tania, M.; Shakeel, A.A. Photodegradation of levofloxacin in aqueous and organic solvents: A kinetic study. Acta Pharm. 2013, 63, 223–229. [Google Scholar]
- HMDB. Metabocard for Levofloxacin (HMDB0001929). Available online: https://hmdb.ca/metabolites/HMDB0001929 (accessed on 7 March 2022).
- Asghar, M.A.; Zahir, E.; Shahid, S.M.; Khan, M.N.; Iqbal, J.; Walker, G. Iron, copper and silver nanoparticles: Green synthesis using green and black tea leaves extracts and evaluation of antibacterial, antifungal and aflatoxin B1 adsorption activity. LWT 2018, 90, 98–107. [Google Scholar] [CrossRef]
- Lingamdinne, L.P.; Kim, I.S.; Ha, J.H.; Chang, Y.Y.; Koduru, J.R.; Yang, J.K. Enhanced Adsorption Removal of Pb(II) and Cr(III) by Using Nickel Ferrite-Reduced Graphene Oxide Nanocomposite. Metals 2017, 7, 225. [Google Scholar] [CrossRef]
- Sofija, S.P.; Dejan, M.K.; Snežana, P.M.; Zoltán, K.; Dragana, D.T.P.; Djurdja, V.K.; Srdjan, D.R. Removal of As(III) and Cr(VI) from aqueous solutions using “green” zero-valent iron nanoparticles produced by oak, mulberry and cherry leaf extracts. Ecol. Eng. 2016, 90, 42–49. [Google Scholar]
- Chaba, J.M.; Philiswa, N.N. Effective adsorptive removal of amoxicillin from aqueous solutions and wastewater samples using zinc oxide coated carbon nanofiber composite. Emerg. Contam. 2019, 5, 143–149. [Google Scholar] [CrossRef]
- Jinsheng, W.; Weihai, C.; Rui, Z.; Can, D. A Study of Sr Sorption Behavior in Claystone from a Candidate High-Level Radioactive Waste Geological Disposal Site under the Action of FeOOH Colloidsice. Int. J. Environ. Res. Public Health 2022, 19, 9970. [Google Scholar]
- Michael, S.C.; Doug, J.H. FT-IR Examination of the Development of Secondary Cell Wall in Cotton Fibers. Fibers 2015, 3, 30–40. [Google Scholar]
- Hong, T.; Yin, J.; Nie, S.P.; Xie, M.-Y. Applications of infrared spectroscopy in polysaccharide structural analysis: Progress, challenge and perspective. Food Chem. 2021, 12, 100168. [Google Scholar] [CrossRef] [PubMed]
- Belaidi, O.; Bouchaour, T.; Maschke, U. Structural Preferences and Vibrational Analysis of 2-Hydroxy-2-methyl-1-phenylpropan-1-one: A Computational and Infrared Spectroscopic Research. J. Struct. 2013, 2013, 942302. [Google Scholar] [CrossRef]
- Betancourt-Galindo, R.; Reyes-Rodriguez, P.Y.; Puente-Urbina, B.A.; Avila-Orta, C.A.; Rodríguez-Fernández, O.S.; Cadenas-Pliego, G.; Lira-Saldivar, R.H.; García-Cerda, L.A. Synthesis, Synthesis of Copper Nanoparticles by Thermal Decomposition and Their Antimicrobial Properties. J. Nanomater. 2014, 2014, 980545. [Google Scholar] [CrossRef]
- Solimana, T.S.; Vshivkova, S.A. Effect of Fe nanoparticles on the structure and optical properties of polyvinyl alcohol nanocomposite films. J. Non-Cryst. Solids 2019, 519, 119452. [Google Scholar] [CrossRef]
- Al-Thawadi, S.; Cord-Ruwisch, R.; Bououdina, M. Consolidation of Sand Particles by Nanoparticles of Calcite after Concentrating Ureolytic Bacteria In Situ. Int. J. Green Nanotechnol. Biomed. 2012, 4, 28–36. [Google Scholar] [CrossRef]
- Ahmed, M.J. Adsorption of quinolone, tetracycline, and penicillin antibiotics from aqueous solution using activated carbons: Review. Environ. Toxicol. Pharmacol. 2017, 50, 1–10. [Google Scholar] [CrossRef] [PubMed]
- Yoosefian, M.; Ahmadzadeh, S.; Aghasi, M.; Dolatabadi, M. Optimization of electrocoagulation process for efficient removal of ciprofloxacin antibiotic using iron electrode; kinetic and isotherm studies of adsorption. J. Mol. Liq. 2017, 225, 544–553. [Google Scholar] [CrossRef]
- Ahmadzadeh, S.; Asadipour, A.; Pournamdari, M.; Behnam, B.; Rahimi, H.R.; Dolatabadi, M. Removal of ciprofloxacin from hospital wastewater using electrocoagulation technique by aluminum electrode: Optimization and modelling through response surface methodology. Process Saf. Environ. Prot. 2017, 109, 538–547. [Google Scholar] [CrossRef]
- Wang, C.J.; Li, Z.H.; Jiang, W.-T. Adsorption of ciprofloxacin on 2:1 dioctahedral clay minerals. Appl. Clay Sci. 2011, 54, 723–728. [Google Scholar] [CrossRef]
- Inchaurrondo, N.; Font, J.; Ramos, C.P.; Haure, P. Natural diatomites: Efficient green catalyst for Fenton-like oxidation of Orange II. Appl. Catal. B 2016, 181, 481–494. [Google Scholar] [CrossRef]
- El-Bendary, N.; El-Etriby, H.K.; Mahanna, H. Reuse of adsorption residuals for enhancing removal of ciprofloxacin from wastewater. Environ. Technol. 2021, 42, 4438–4454. [Google Scholar] [CrossRef]
- Wondimu, K.W.; Beteley, T.M.; Joon, W.K.; Yonas, C. Enhanced Ciprofloxacin Removal from Aqueous Solution Using a Chemically Modified Biochar Derived from Bamboo Sawdust: Adsorption Process Optimization with Response Surface Methodology. Adsorp. Sci. Technol. 2022, 2022, 2699530. [Google Scholar]
- Khana, Z.A.; Mekkya, A.E.M.; Bin Mahfouzc, A.S.; Saleha, T.S.; Mohy Eldin, M.S. Separation of nickel(II) ions from synthetic aqueous solutions with novel dimethylglyoxime-modified Amberlite IRA-420: Kinetic and equilibrium studies. Desalin. Water Treat. 2017, 81, 123–132. [Google Scholar] [CrossRef]
- Margaritis, K.; Thodoris, D.K. Why Is the Linearized Form of Pseudo-Second Order Adsorption Kinetic Model So Successful in Fitting Batch Adsorption Experimental Data? Colloids Interfaces 2022, 6, 55. [Google Scholar]
- Aljeboree, M.; Alshirifi, N.; Alkaim, F. Kinetics and equilibrium study for the adsorption of textile dyes on coconut shell activated carbon. Arab. J. Chem. 2017, 10, 3381. [Google Scholar] [CrossRef]
- Elwakeel, K.; El-Bindary, A.; Kouta, E.; Guibal, E. Functionalization of polyacrylonitrile/Na-Y-zeolite composite with amidoxime groups for the sorption of Cu(II), Cd(II) and Pb(II) metal ions. Chem. Eng. J. 2018, 332, 727–736. [Google Scholar] [CrossRef]
- Ho, Y.S.; McKay, G. The Kinetics of Sorption of Divalent Metal Ions onto Sphagnum Moss Peat. Water Res. 2000, 34, 735–742. [Google Scholar] [CrossRef]
- Meenakshi, S.; Viswanathan, N. Identification of selective ion-exchange resin for fluoride sorption. J. Colloid. Interface Sci. 2007, 308, 438–450. [Google Scholar] [CrossRef] [PubMed]
- Israa, I.N.; Hilal, W.S. Adsorption of Eriochrom Black T Azo Dye onto Nanosized Anatase TiO2. J. Environ. Eng. Sci. 2015, 2, 86–92. [Google Scholar]
- Ho, Y.-S. Effect of pH on lead removal from water using tree fern as the sorbent. Bioresour. Technol. 2005, 96, 1292–1296. [Google Scholar] [CrossRef]
- Ahmed, H.R.; Inas, A.A.; Dina, M.D.B. The Removal of Brilliant Green Dye from Aqueous Solution Using Nano Hydroxyaptite/Chitosan Composite as a Sorbent. Molecules 2019, 24, 847. [Google Scholar]
- Sebastiano, C.; Claudio, E.; Georgeta, P.; Antonella, G. Combination of interfacial reduction of hexavalent chromium and trivalent chromium immobilization on tin-functionalized hydroxyapatite materials. Appl. Surf. Sci. 2021, 539, 148227. [Google Scholar]
- Inas, A.A.; Najlaa, S.A.; Hussein, H.S.; Ahmed, H.R. Environmentally Friendly Mesoporous Nanocomposite Prepared from Al-Dross Waste with Remarkable Adsorption Ability for Toxic Anionic Dye. J. Chem. 2019, 2019, 7685204. [Google Scholar]
- Inas, A.A.; Hussein, H.S.; Ahmed, H.R.; Najlaa, S.A. Synthesis and Characterization of Silica-Coated Oxyhydroxide Aluminum/Doped Polymer Nanocomposites: A Comparative Study and Its Application as a Sorbent. Molecules 2020, 25, 1520. [Google Scholar]
- Fozia, B.; Jamshed, A.; Shahid, I.; Sobia, N.; Syed, N.; Abbas, B. Study of Isothermal, Kinetic, and Thermodynamic Parameters for Adsorption of Cadmium: An Overview of Linear and Nonlinear Approach and Error Analysis. Bioinorg. Chem. Appl. 2018, 2018, 3463724. [Google Scholar]
- Elgarahy, A.M.; Elwakeel, K.Z.; Elshoubaky, G.A.; Mohammad, S.H. Microwave-accelerated sorption of cationic dyes onto green marine algal biomass. Environ. Sci. Pollut. Res. 2019, 26, 22704–22722. [Google Scholar] [CrossRef]
- Salvestrini, S.; Leone, V.; Iovino, P.; Canzano, S.; Capasso, S. Considerations about the correct evaluation of sorption ther-modynamic parameters from equilibrium isotherms. J. Chem. Thermodyn. 2014, 68, 310–316. [Google Scholar] [CrossRef]
- Zhao, W.; Zhu, J.; Wei, W.; Ma, L.; Zhua, J.; Xie, J. Comparative study of modified/non-modified aluminum and silica aerogels for anionic dye adsorption performance. RSC Adv. 2018, 8, 29129. [Google Scholar] [CrossRef] [PubMed]
- Haleemat, I.; Folahan, A.; Olalekan, S.F.; Bhekumusa, J.X. Adsorption of Cr (VI) on synthetic hematite (α-Fe2O3) nanopar-ticles of different morphologies. Korean J. Chem. Eng. 2014, 31, 142–154. [Google Scholar]
- Shujauddin, K.; Zhang, L.; Aimin, L.; Muhammad, I.; Zhang, X. Microwave-assisted hydrothermal carbonization of furfural residue for adsorption of Cr(VI): Adsorption and kinetic study. Pol. J. Environ. Stud. 2020, 29, 1671–1681. [Google Scholar]
- Maria, E.R.; Miria, B.; Karim, S. Removal of Ciprofloxacin from Aqueous Solutions Using Pillared Clays. Materials 2017, 10, 1345. [Google Scholar]
- Pham, T.; Vu, T.; Nguyen, H.; Le, P.; Hoang, T. Adsorptive Removal of Antibiotic Ciprofloxacin from Aqueous Solution Using Protein-Modified Nanosilica. Polymers 2020, 12, 57. [Google Scholar] [CrossRef] [PubMed]
- Tran, Q.T.; Do, T.H.; Ha, X.L.; Nguyen, H.P.; Nguyen, A.T.; Ngo, T.C.Q.; Chau, H.D. Study of the Ciprofloxacin Adsorption of Activated Carbon Prepared from Mangosteen Peel. Appl. Sci. 2022, 12, 8770. [Google Scholar] [CrossRef]
- Abukhadra, M.; Mohamed, A.; El-Sherbeeny, A.; Soliman, A. adsorption of toxic and biologically active levofloxacin residuals from wastewater using clay nanotubes as a novel fixed bed; column performance and optimization. ACS Omega 2020, 5, 26195–26205. [Google Scholar] [CrossRef] [PubMed]
- Altaf, S.; Zafar, R.; Zaman, W.Q.; Ahmad, S.; Yaqoob, K.; Syed, A.; Khan, A.J.; Bilal, M.; Arshad, M. Removal of levofloxacin from aqueous solution by green synthesized magnetite (Fe3O4) nanoparticles using Moringa olifera: Kinetics and reaction mechanism analysis. Ecotoxicol. Environ. Saf. 2021, 226, 112826. [Google Scholar] [CrossRef] [PubMed]
- Ciobanu, G.; Harja, M. Studies on the Sorption of Levofloxacin from Aqueous Solutions onto Nanohydroxyapatite. Rev. Roum. Chim. 2018, 63, 593–601. [Google Scholar]


| Ciprofloxacin (CIP) [22] | Levofloxacin (LEV) | |
|---|---|---|
| Structure |  |  |
| Molecular formula | C17H18FN3O3 | C18H20FN3O4 |
| Usage | Antibiotic | Antibiotic |
| Molecular weight (g mol−1) | 331.346 | 361.373 |
| pKa | 6.09 | 5.59 (acid) and 7.94 (base) [23] |
| Water solubility (g L−1) at 20 °C | 36 | 1.44 [24] |
| Sample | Surface Area (m2 g−1) | Pore Volume (cm3 g−1) | Pore Radius (nm) |
|---|---|---|---|
| Fe–Cu/Alg–LS | 21.0506 | 0.04432 | 1.92176 |
| Kinetic Models | Parameter | Ciprofloxacin (CIP) | Levofloxacin (LEV) |
|---|---|---|---|
| qe, exp (mg g−1) | 2.425 | 1.24 | |
| PFOR | qe, cal (mg g−1) | 1.915 | 1.34 |
| Kads (min−1) | 0.4120 | 0.8064 | |
| R2 | 0.8073 | 0.9613 | |
| PSOR | qe, cal (mg g−1) | 2.427 | 1.24 |
| K2 (g mg−1 min−1) | 0.00007 | 1.157 | |
| R2 | 1 | 1 | |
| Morris–Weber | Kd (mg g−1 min0.5) | 0.0831 | 0.0727 |
| R2 | 0.1884 | 0.9783 |
| Kinetic isotherm | Parameter | Ciprofloxacin (CIP) | Levofloxacin (LEV) |
|---|---|---|---|
| Langmuir | qe, cal. (mg g−1) | 8.84 | 5.3 |
| KL (L mg−1) | 0.0012 | 0.0011 | |
| R2 | 0.9731 | 0.9990 | |
| Freundlich | KF (moln−1 Ln g−1) | 4.5850 | 2.7150 |
| n | 4.12 | 3.60 | |
| R2 | 0.9137 | 0.9221 | |
| D–R model | E (kJ mol−1) | 0.7624 | 0.7446 |
| q(D-R) (mg g−1) | 8.4350 | 4.4260 | |
| R2 | 0.9402 | 0.8088 |
| Parameter | T (K) | A% | ln KL | ∆H° (KJ·mol−1) | ∆S° (J·mol−1·K−1) | ∆G° (kJ·mol−1) | R2 |
|---|---|---|---|---|---|---|---|
| Ciprofloxacin (CIP) | 303 | 97.0 | 1.25 | 10.75 | −46.12 | −3.148 | 0.9621 |
| 313 | 97.2 | 1.46 | −3.812 | ||||
| 333 | 97.6 | 1.65 | −4.568 | ||||
| levofloxacin (LEV) | 303 | 99.0 | 2.50 | −12.39 | −20.49 | −6.26 | 0.8929 |
| 313 | 98.6 | 2.20 | −5.72 | ||||
| 333 | 98.4 | 2.03 | −5.45 |
| Ciprofloxacin | |||
|---|---|---|---|
| The Sorbent | Adsorption Capacity, mg/g | Conditions | References |
| Fe–Cu Bimetallic Supported on Alginate–Limestone Nanocomposite | 8.8 | 20 ppm, 45 min. | Current research |
| Chemically prepared carbon from date palm leaflets | 44.6 | Ci = 200 ppm, 2880 min. | [9] |
| Pillared Clays | 122.1 | Ci = 18–500 ppm, 1440 min. | [61] |
| A chemically modified bamboo biochar was prepared from bamboo sawdust | 78.43 | Ci = 20 ppm, 46 min. | [42] |
| Protein-modified nanosilica (ProMNS) | 85 | Ci = 10 ppm, 90 min. | [62] |
| Activated carbon from Mangosteen Peel | 29.76 | Ci = 300 ppm, 60 min. | [63] |
| Fe clay cellulose-acrylamide beads | 57.84 | Ci= 0.01, ppm | [3] |
| Levofloxacin | |||
| Fe–Cu Bimetallic Supported on Alginate–Limestone Nanocomposite | 8.8 | 10 ppm, 40 min. | Current research |
| Clay nanotubes | 442 | Ci =10 ppm,1800 min. | [64] |
| Fe clay cellulose-acrylamide beads | 38.01 | Ci= 0.01 ppm | [3] |
| Magnetite (Fe3O4—gINPs) nanoparticles from Moringa olifera | 22.47 | Ci= 4 ppm, 1440 min. | [65] |
| Hydroxyapatite nanopowder | 157.09 (uncalcined Nanohydroxyapatite) | Ci= 25 ppm, 80 min. | [66] |
Disclaimer/Publisher’s Note: The statements, opinions and data contained in all publications are solely those of the individual author(s) and contributor(s) and not of MDPI and/or the editor(s). MDPI and/or the editor(s) disclaim responsibility for any injury to people or property resulting from any ideas, methods, instructions or products referred to in the content. |
© 2023 by the authors. Licensee MDPI, Basel, Switzerland. This article is an open access article distributed under the terms and conditions of the Creative Commons Attribution (CC BY) license (https://creativecommons.org/licenses/by/4.0/).
Share and Cite
Ahmed, I.A.; Hussein, H.S.; ALOthman, Z.A.; ALanazi, A.G.; Alsaiari, N.S.; Khalid, A. Green Synthesis of Fe–Cu Bimetallic Supported on Alginate-Limestone Nanocomposite for the Removal of Drugs from Contaminated Water. Polymers 2023, 15, 1221. https://doi.org/10.3390/polym15051221
Ahmed IA, Hussein HS, ALOthman ZA, ALanazi AG, Alsaiari NS, Khalid A. Green Synthesis of Fe–Cu Bimetallic Supported on Alginate-Limestone Nanocomposite for the Removal of Drugs from Contaminated Water. Polymers. 2023; 15(5):1221. https://doi.org/10.3390/polym15051221
Chicago/Turabian StyleAhmed, Inas A., Hala. S. Hussein, Zeid A. ALOthman, Abdullah G. ALanazi, Norah Salem Alsaiari, and Awais Khalid. 2023. "Green Synthesis of Fe–Cu Bimetallic Supported on Alginate-Limestone Nanocomposite for the Removal of Drugs from Contaminated Water" Polymers 15, no. 5: 1221. https://doi.org/10.3390/polym15051221
APA StyleAhmed, I. A., Hussein, H. S., ALOthman, Z. A., ALanazi, A. G., Alsaiari, N. S., & Khalid, A. (2023). Green Synthesis of Fe–Cu Bimetallic Supported on Alginate-Limestone Nanocomposite for the Removal of Drugs from Contaminated Water. Polymers, 15(5), 1221. https://doi.org/10.3390/polym15051221