
Effects of NCO/OH Ratios on Bio-Based Polyurethane Film Properties Made from Acacia mangium Liquefied Wood


 ,
,  and
and
Abstract
1. Introduction
2. Materials and Methods
2.1. Materials
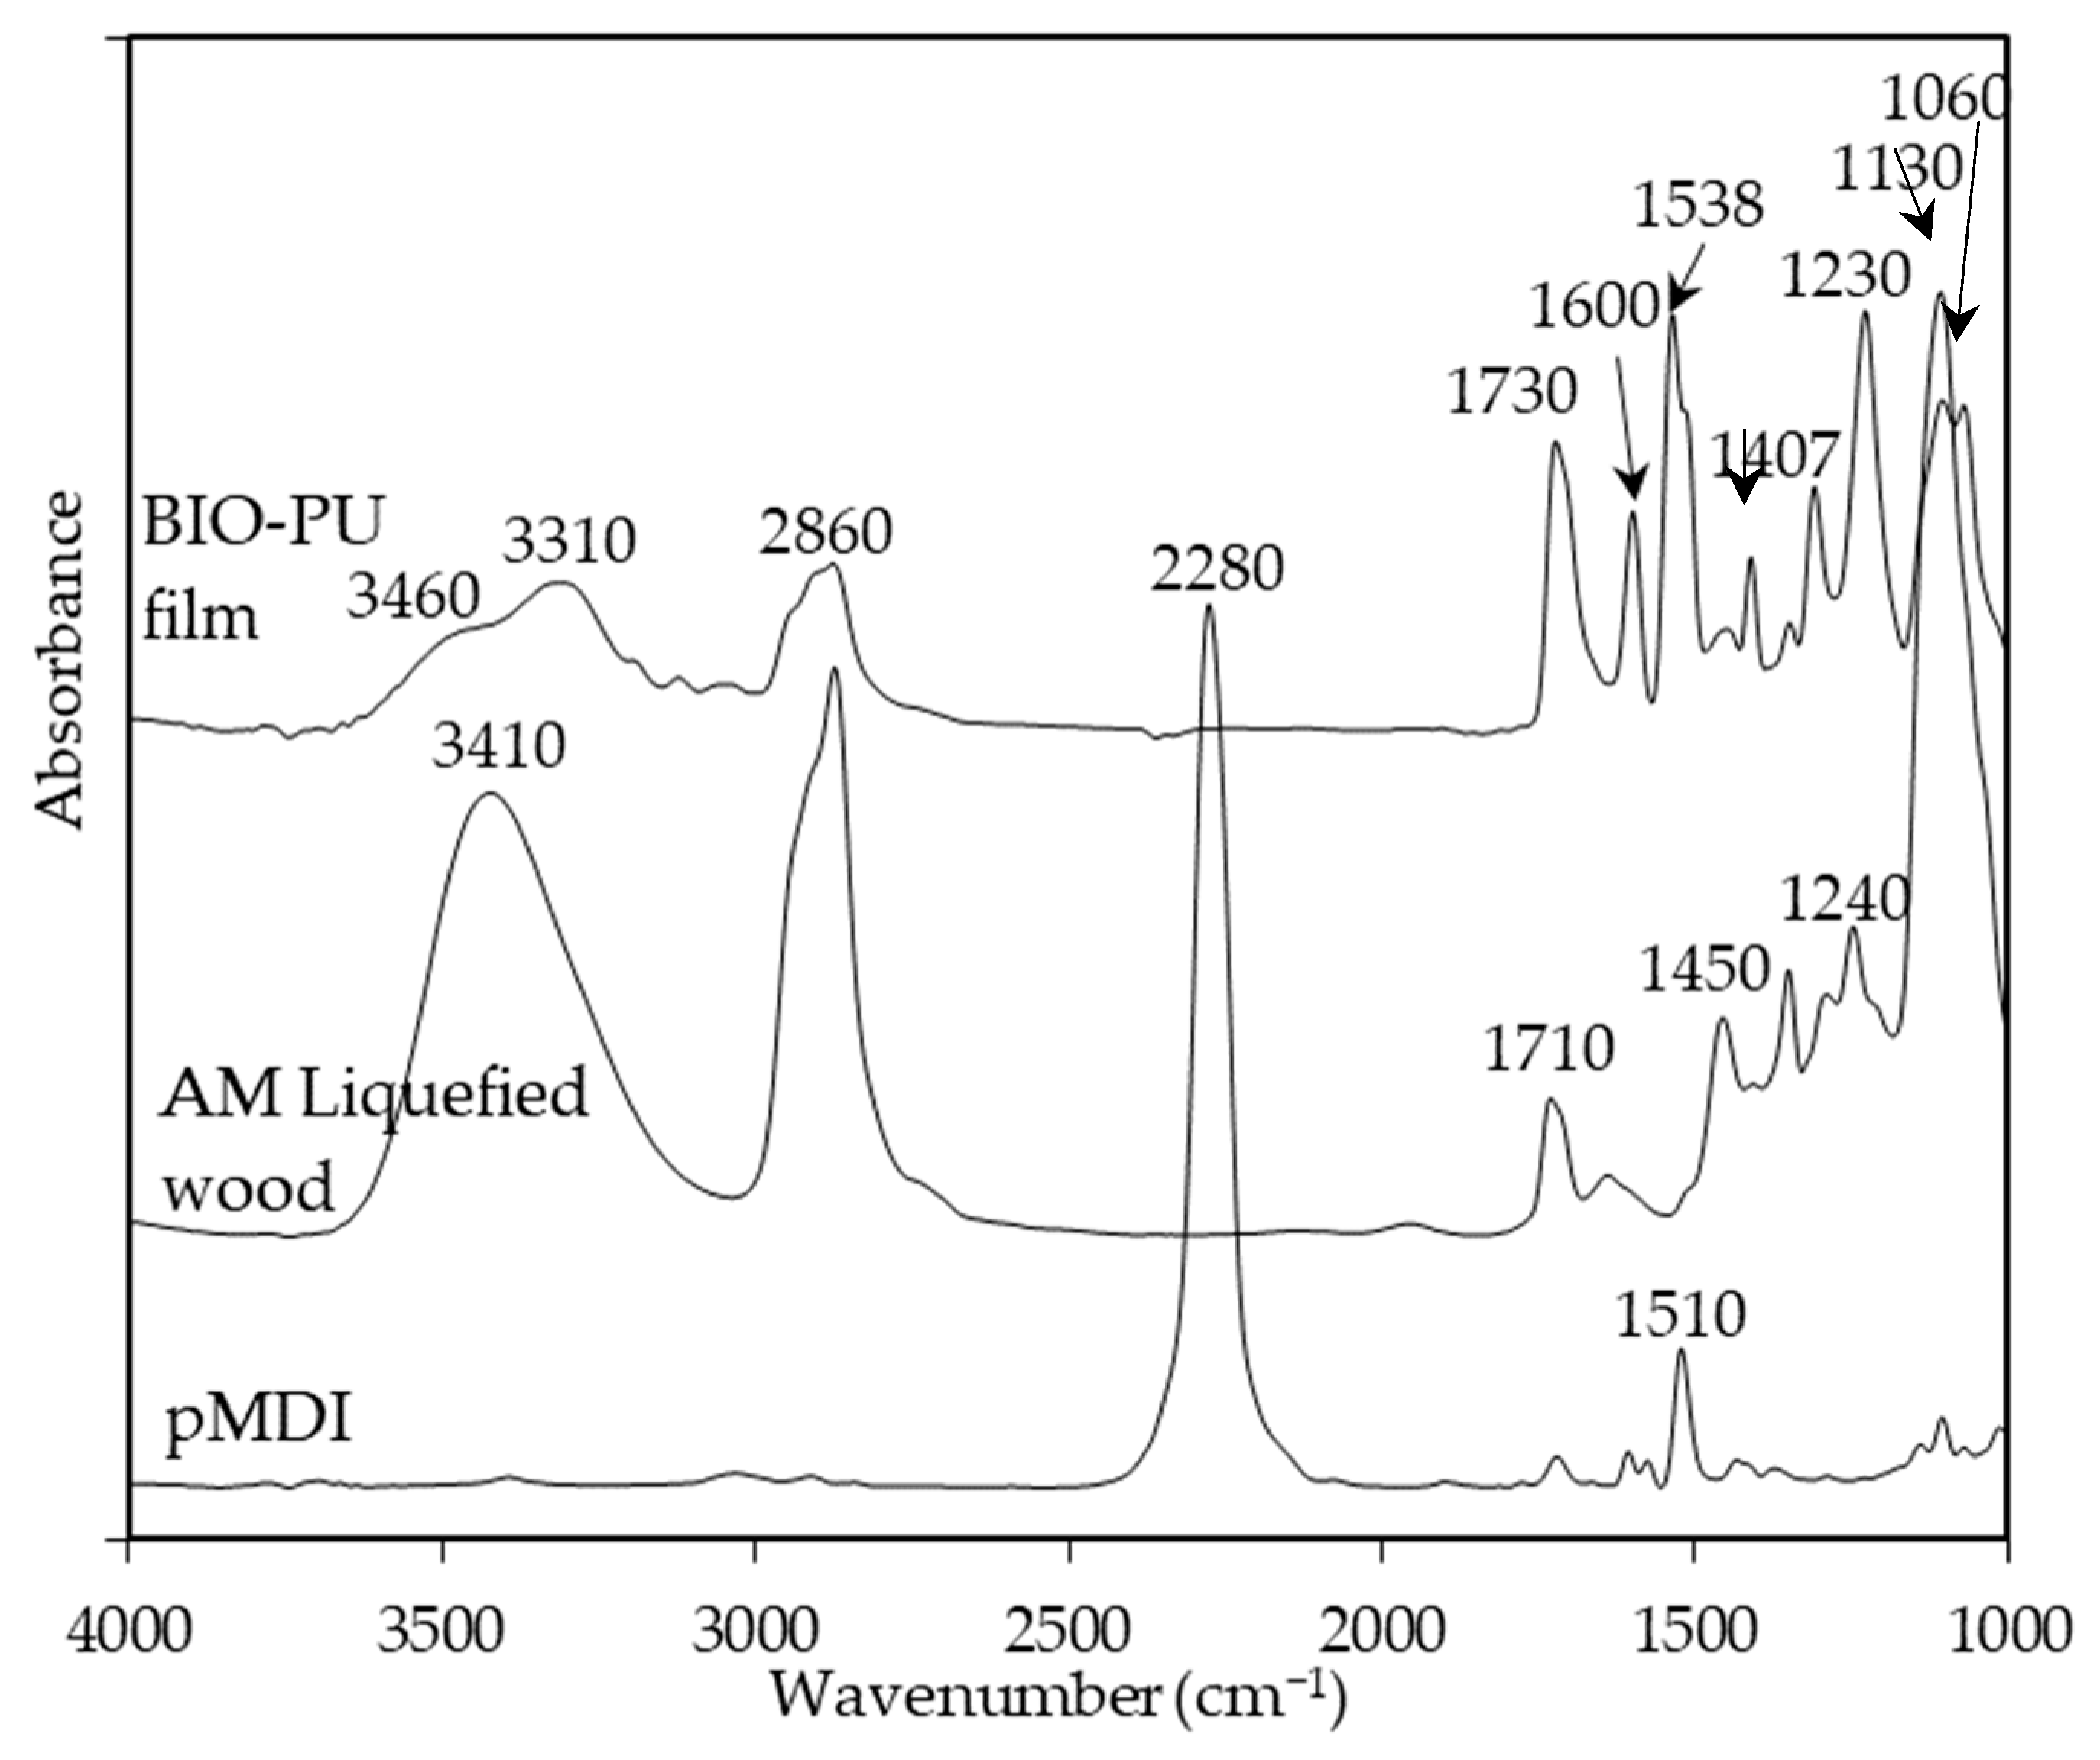
2.2. Liquefaction of Wood
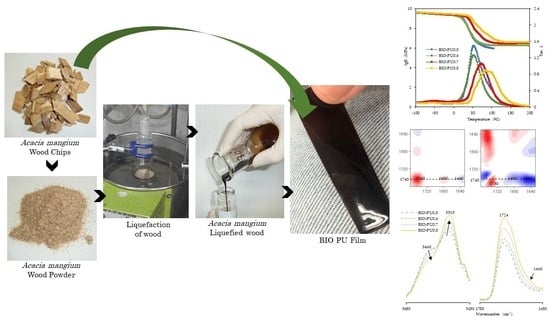
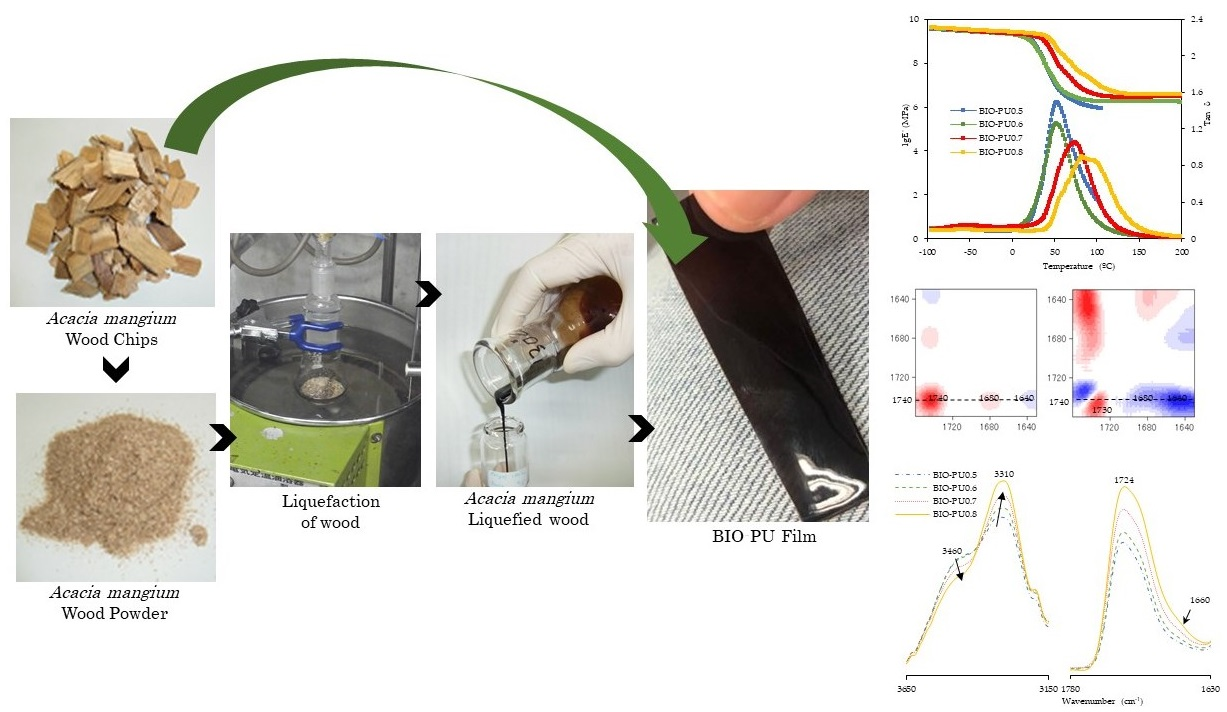
2.3. Preparation of Polyurethane Film
2.4. Measurements
3. Results and Discussion
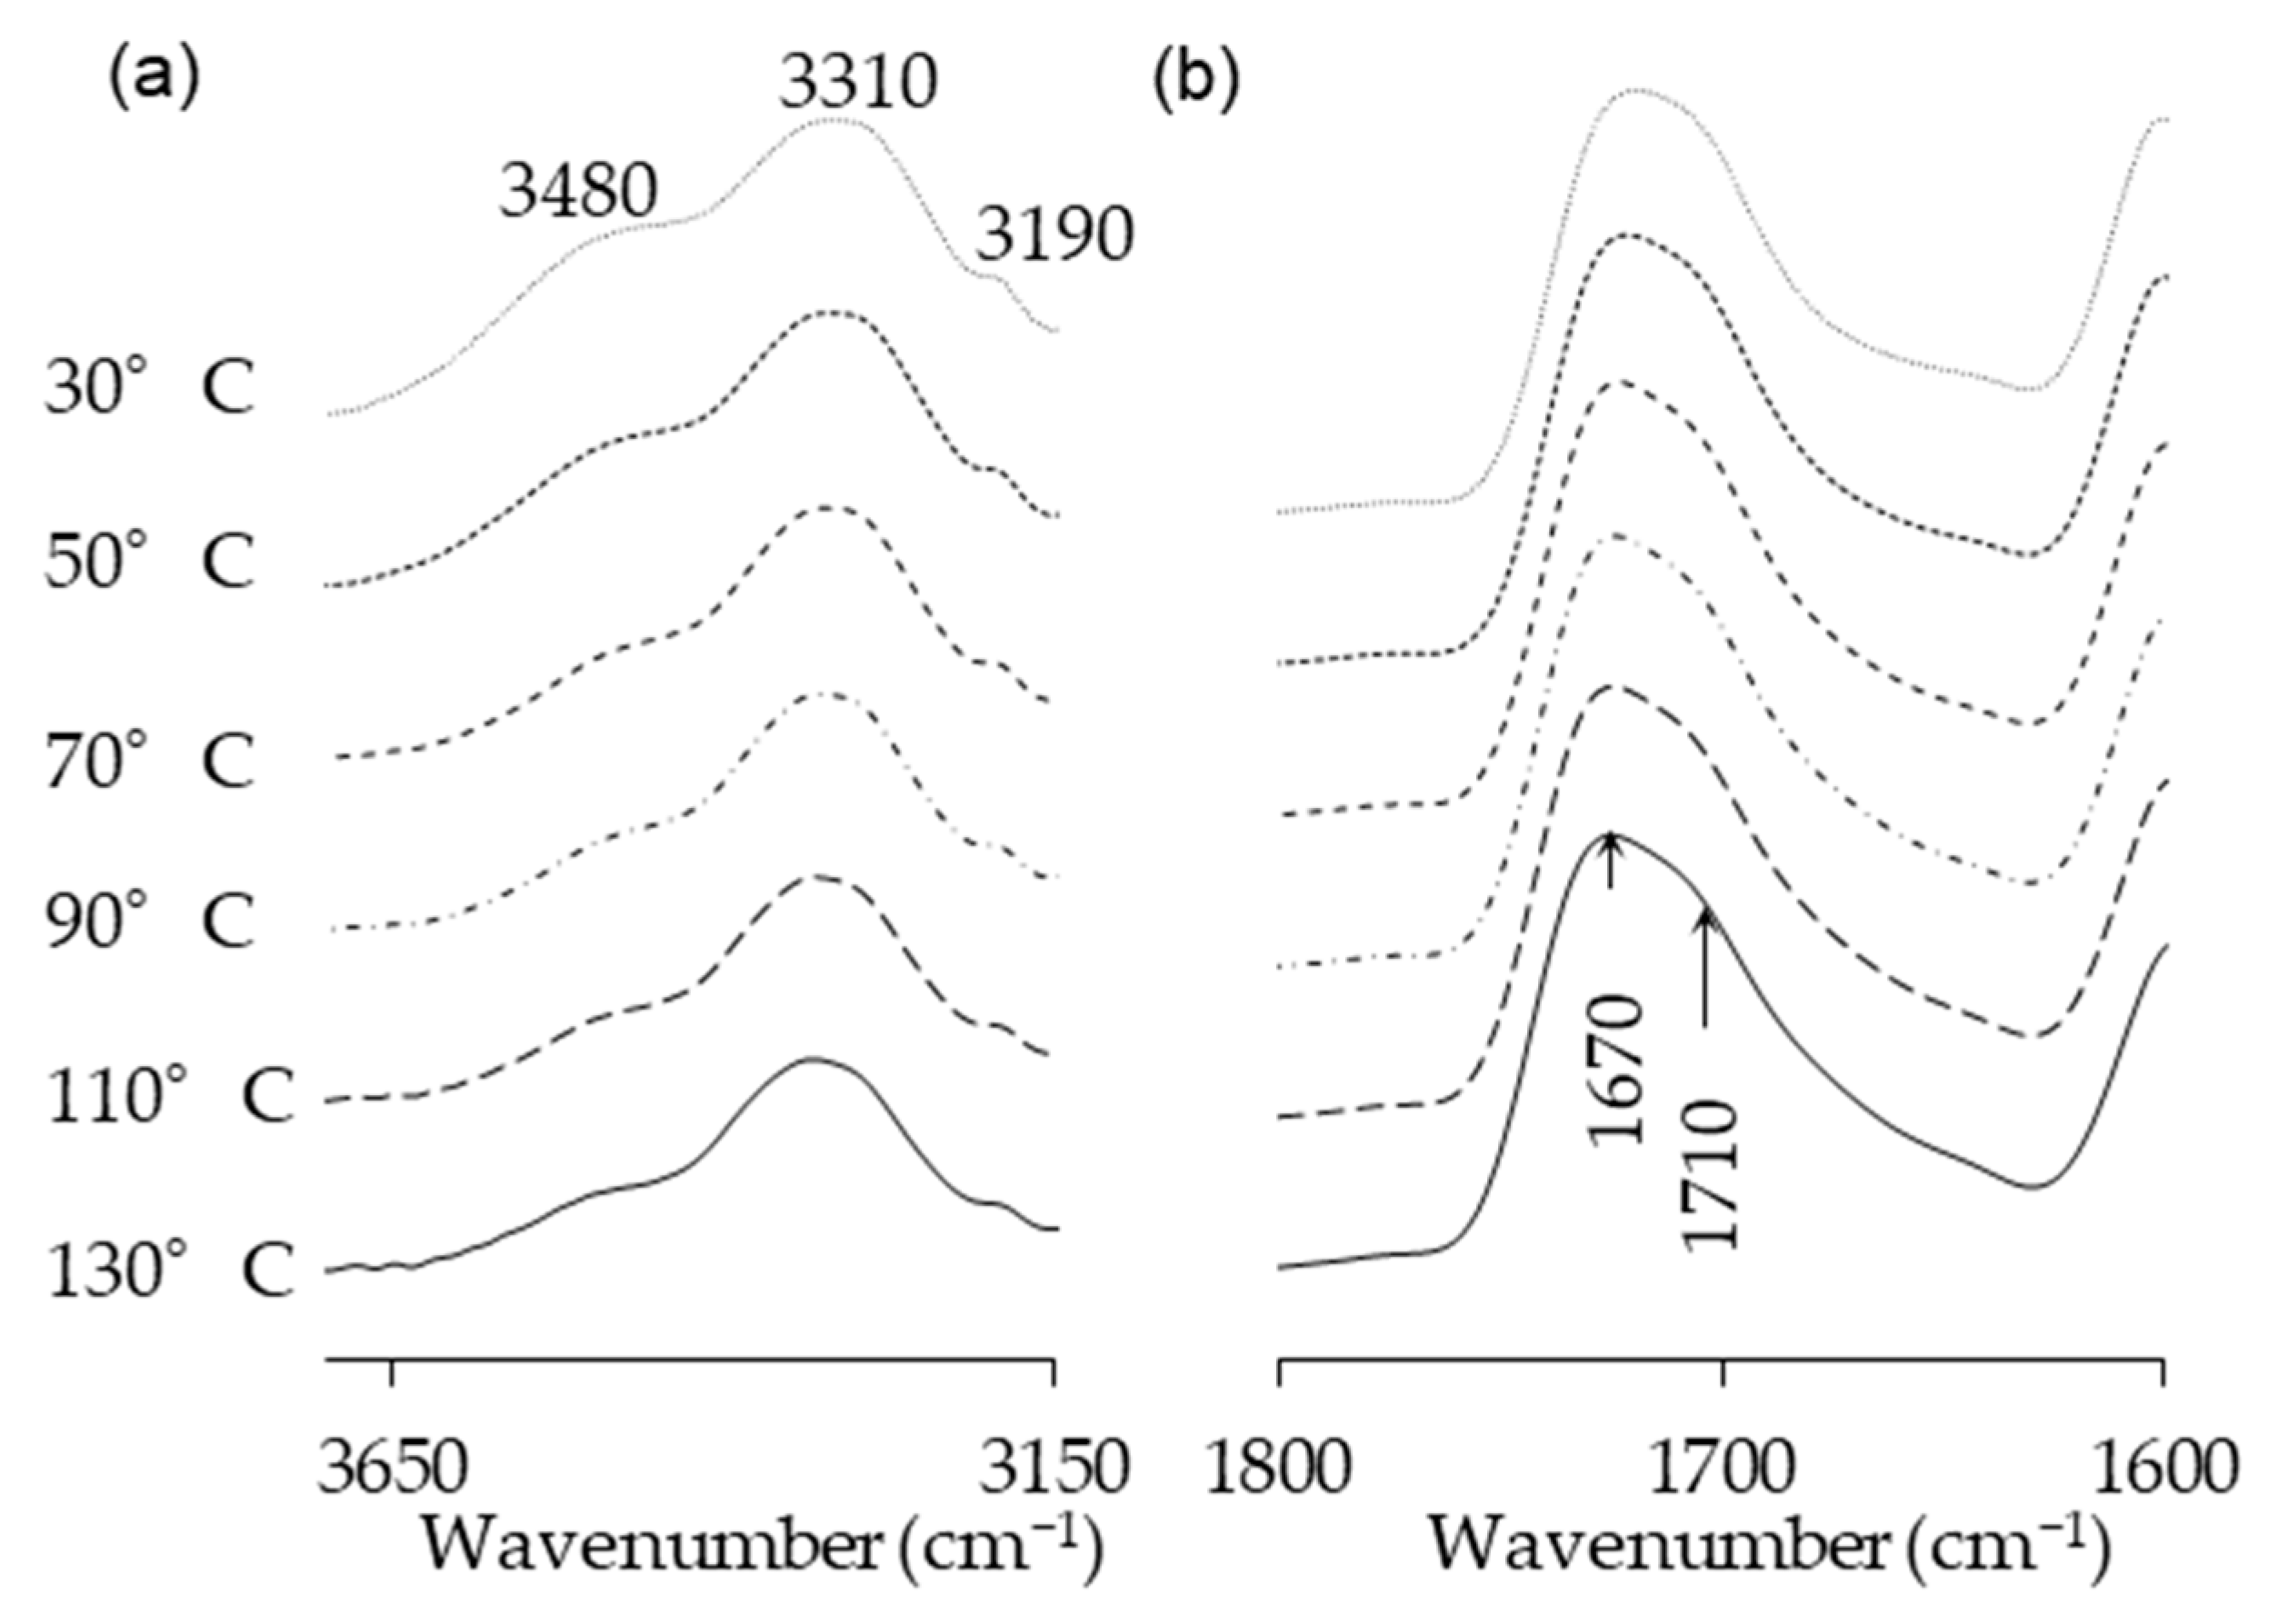
3.1. Effect of Heating Time and Temperature
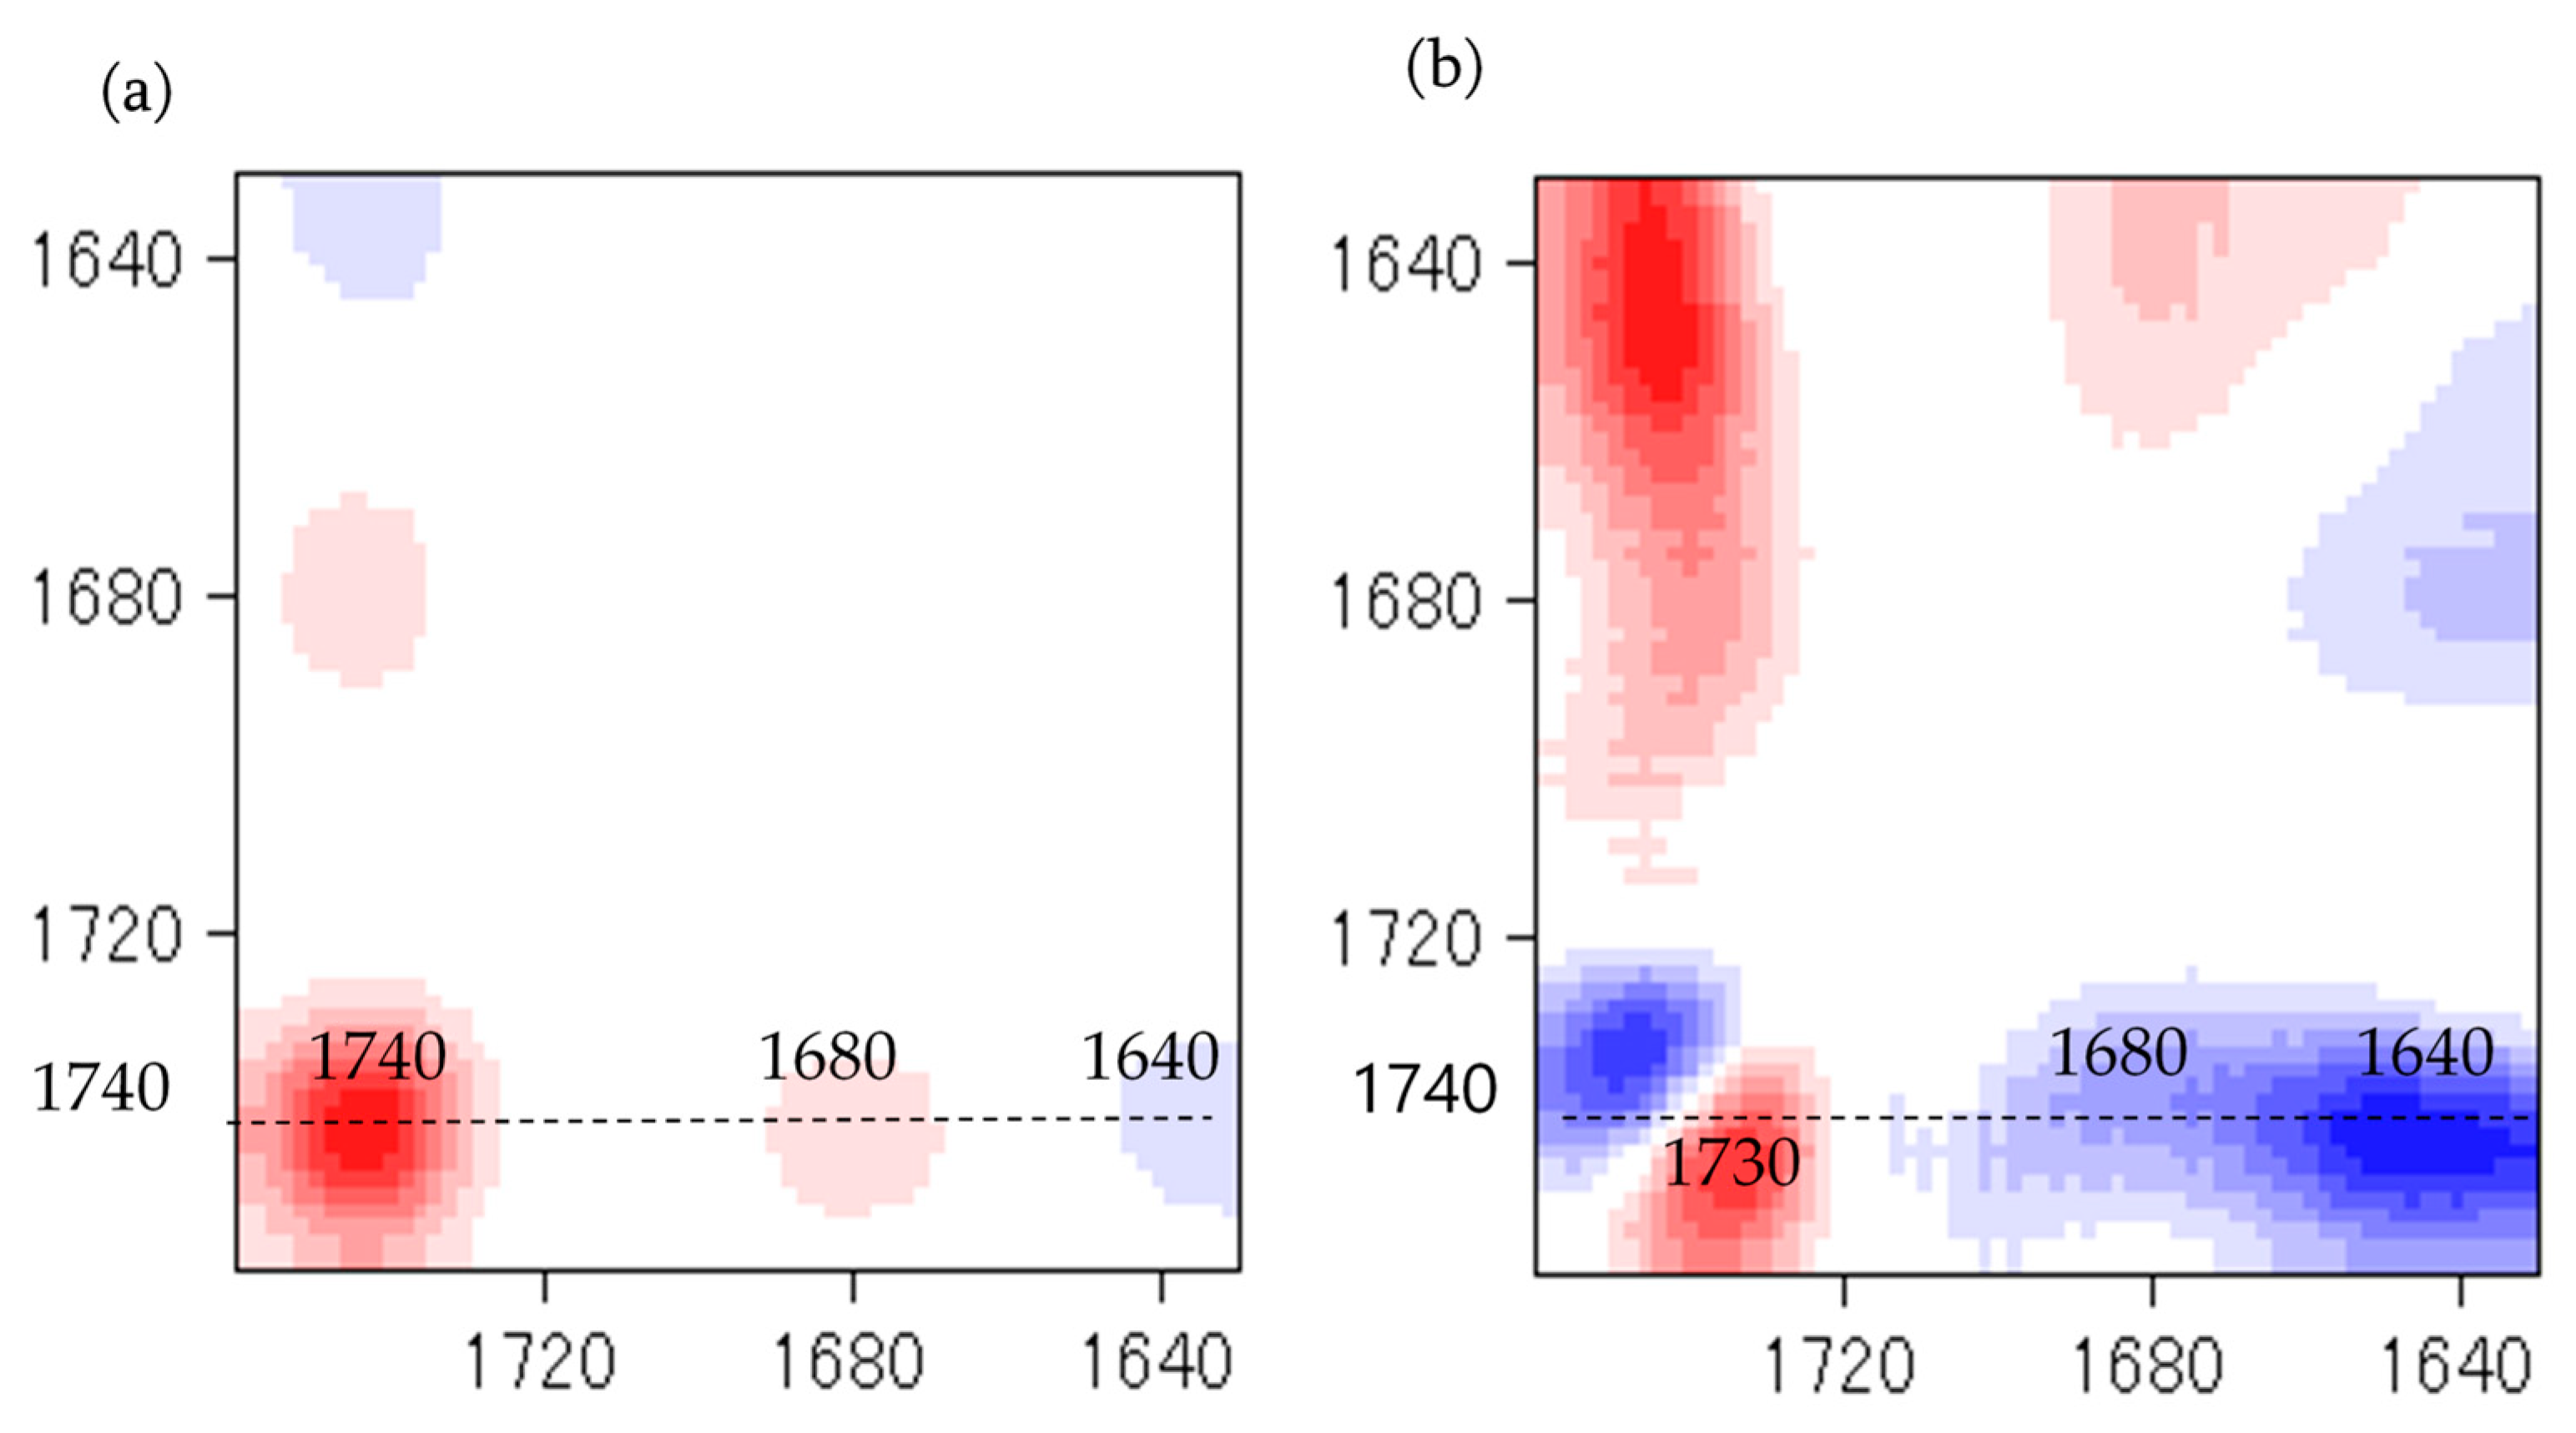
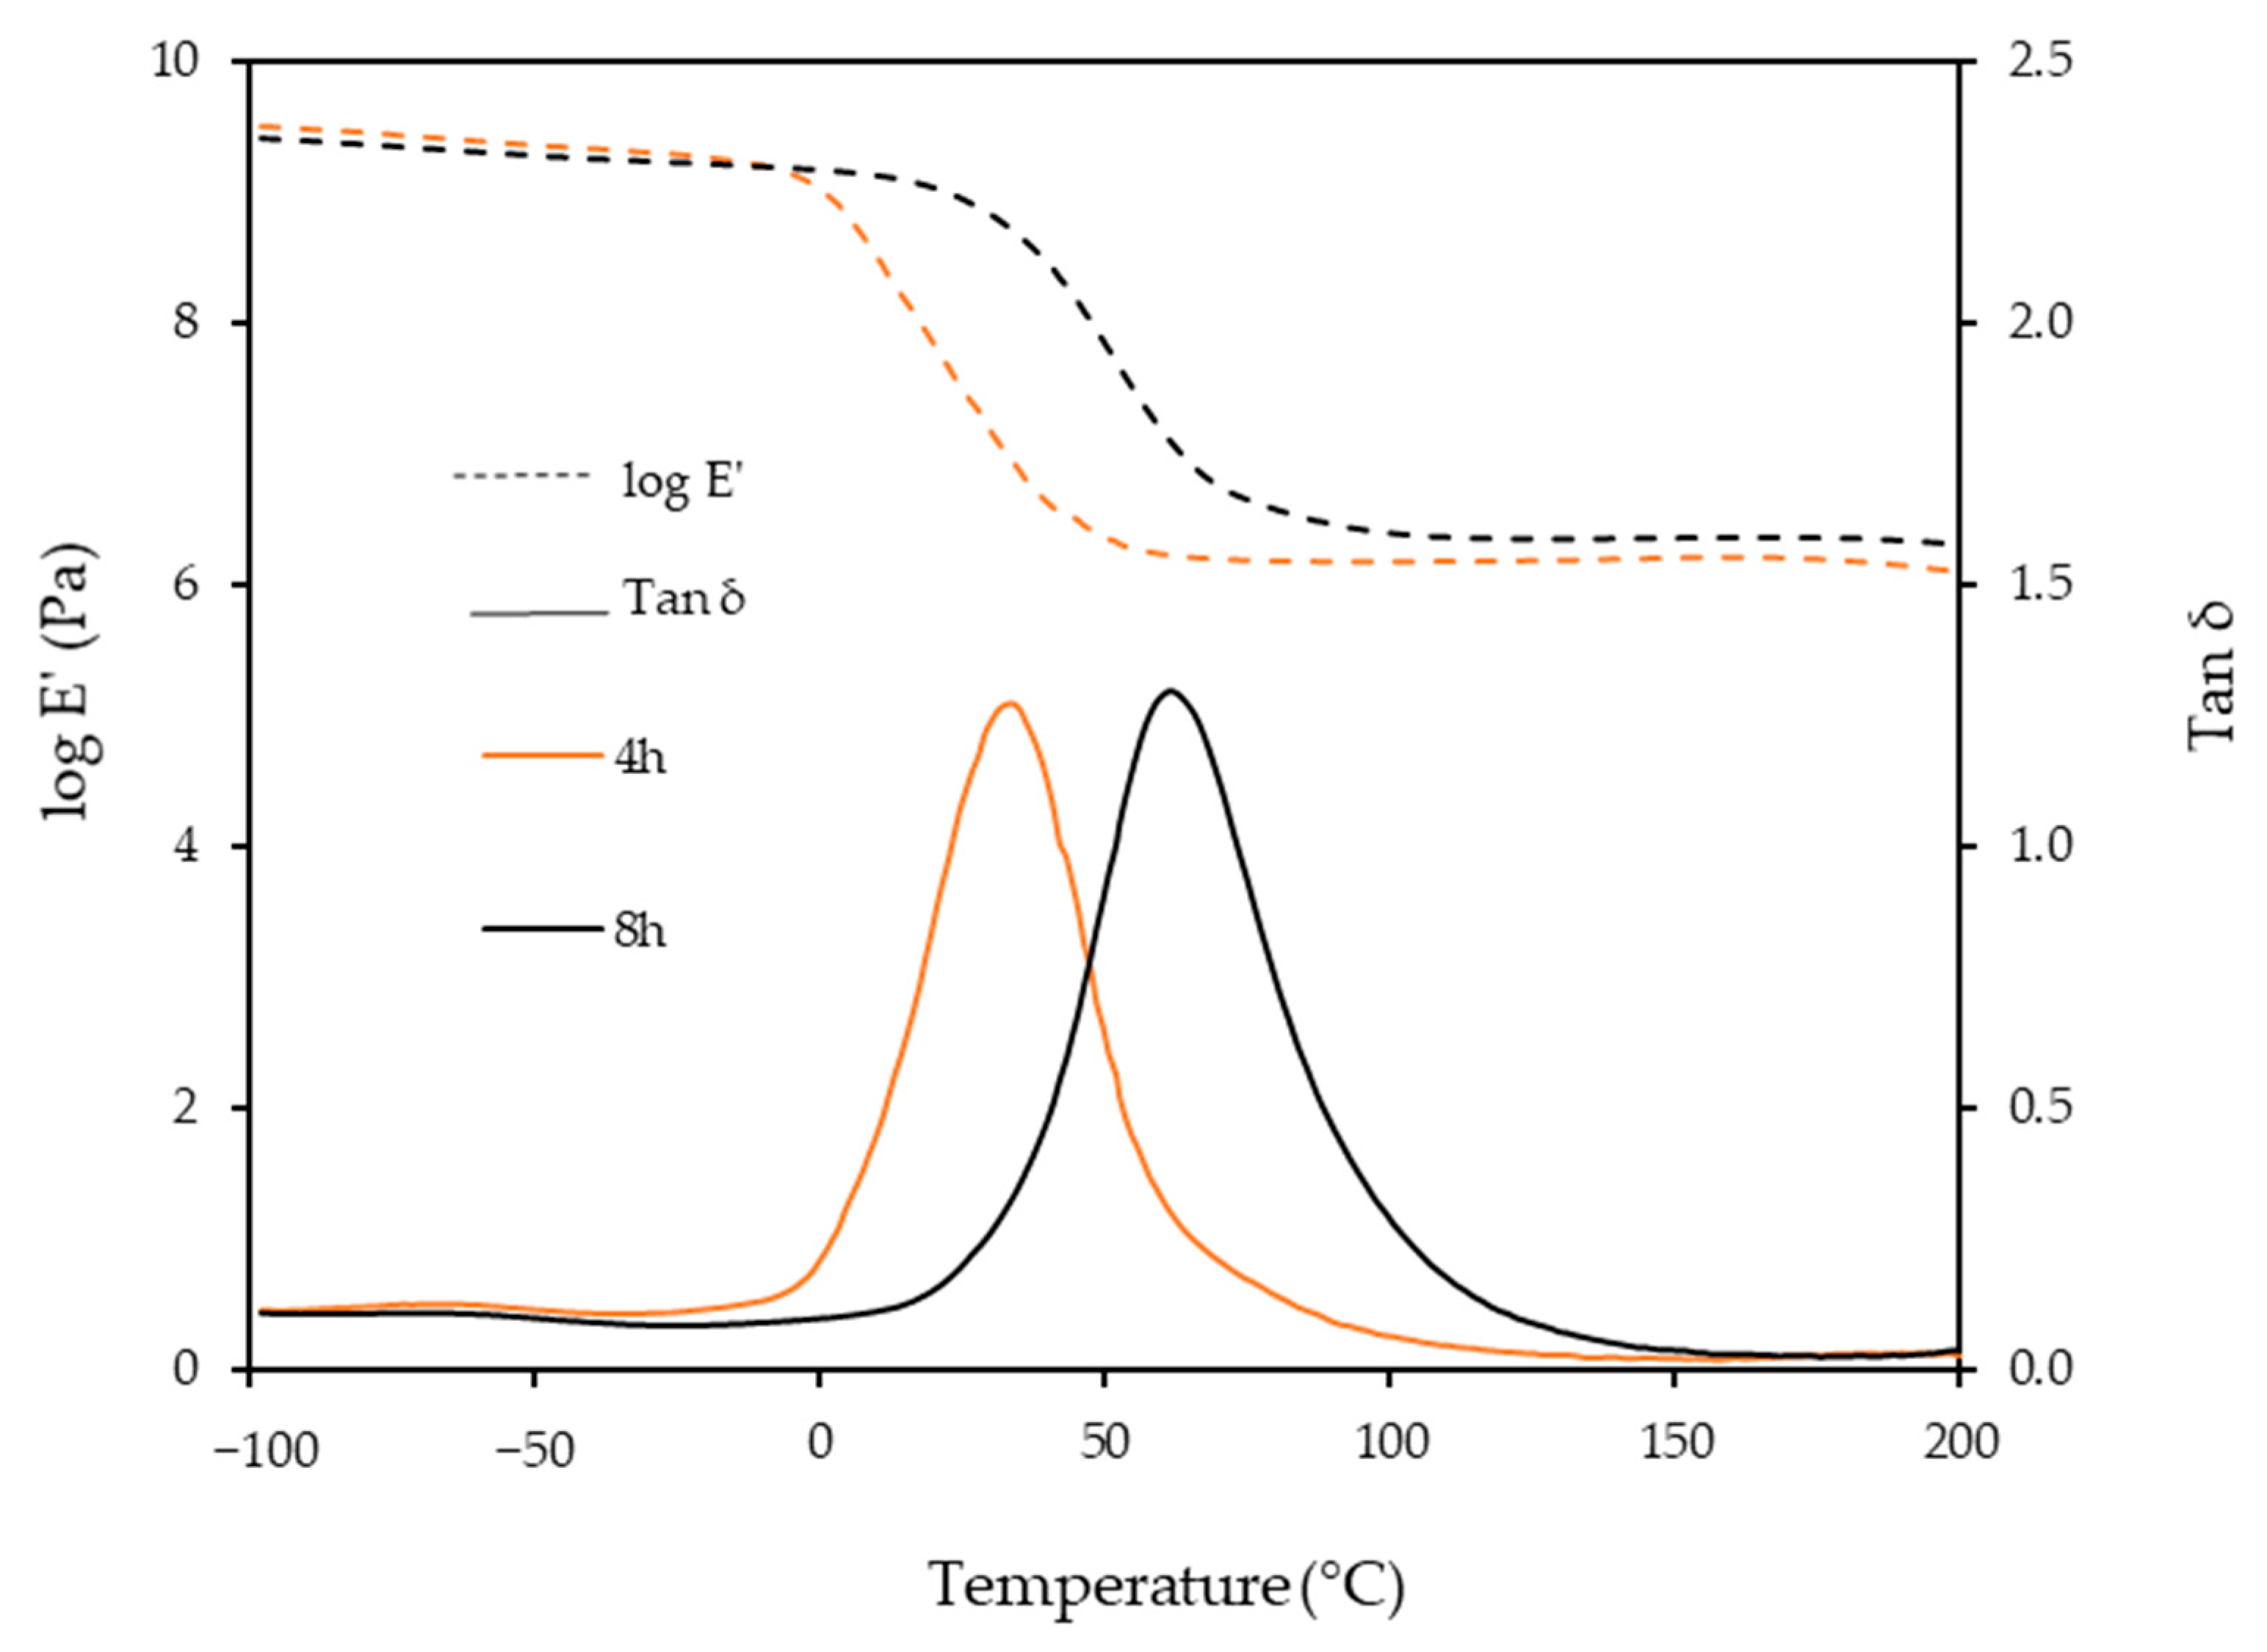
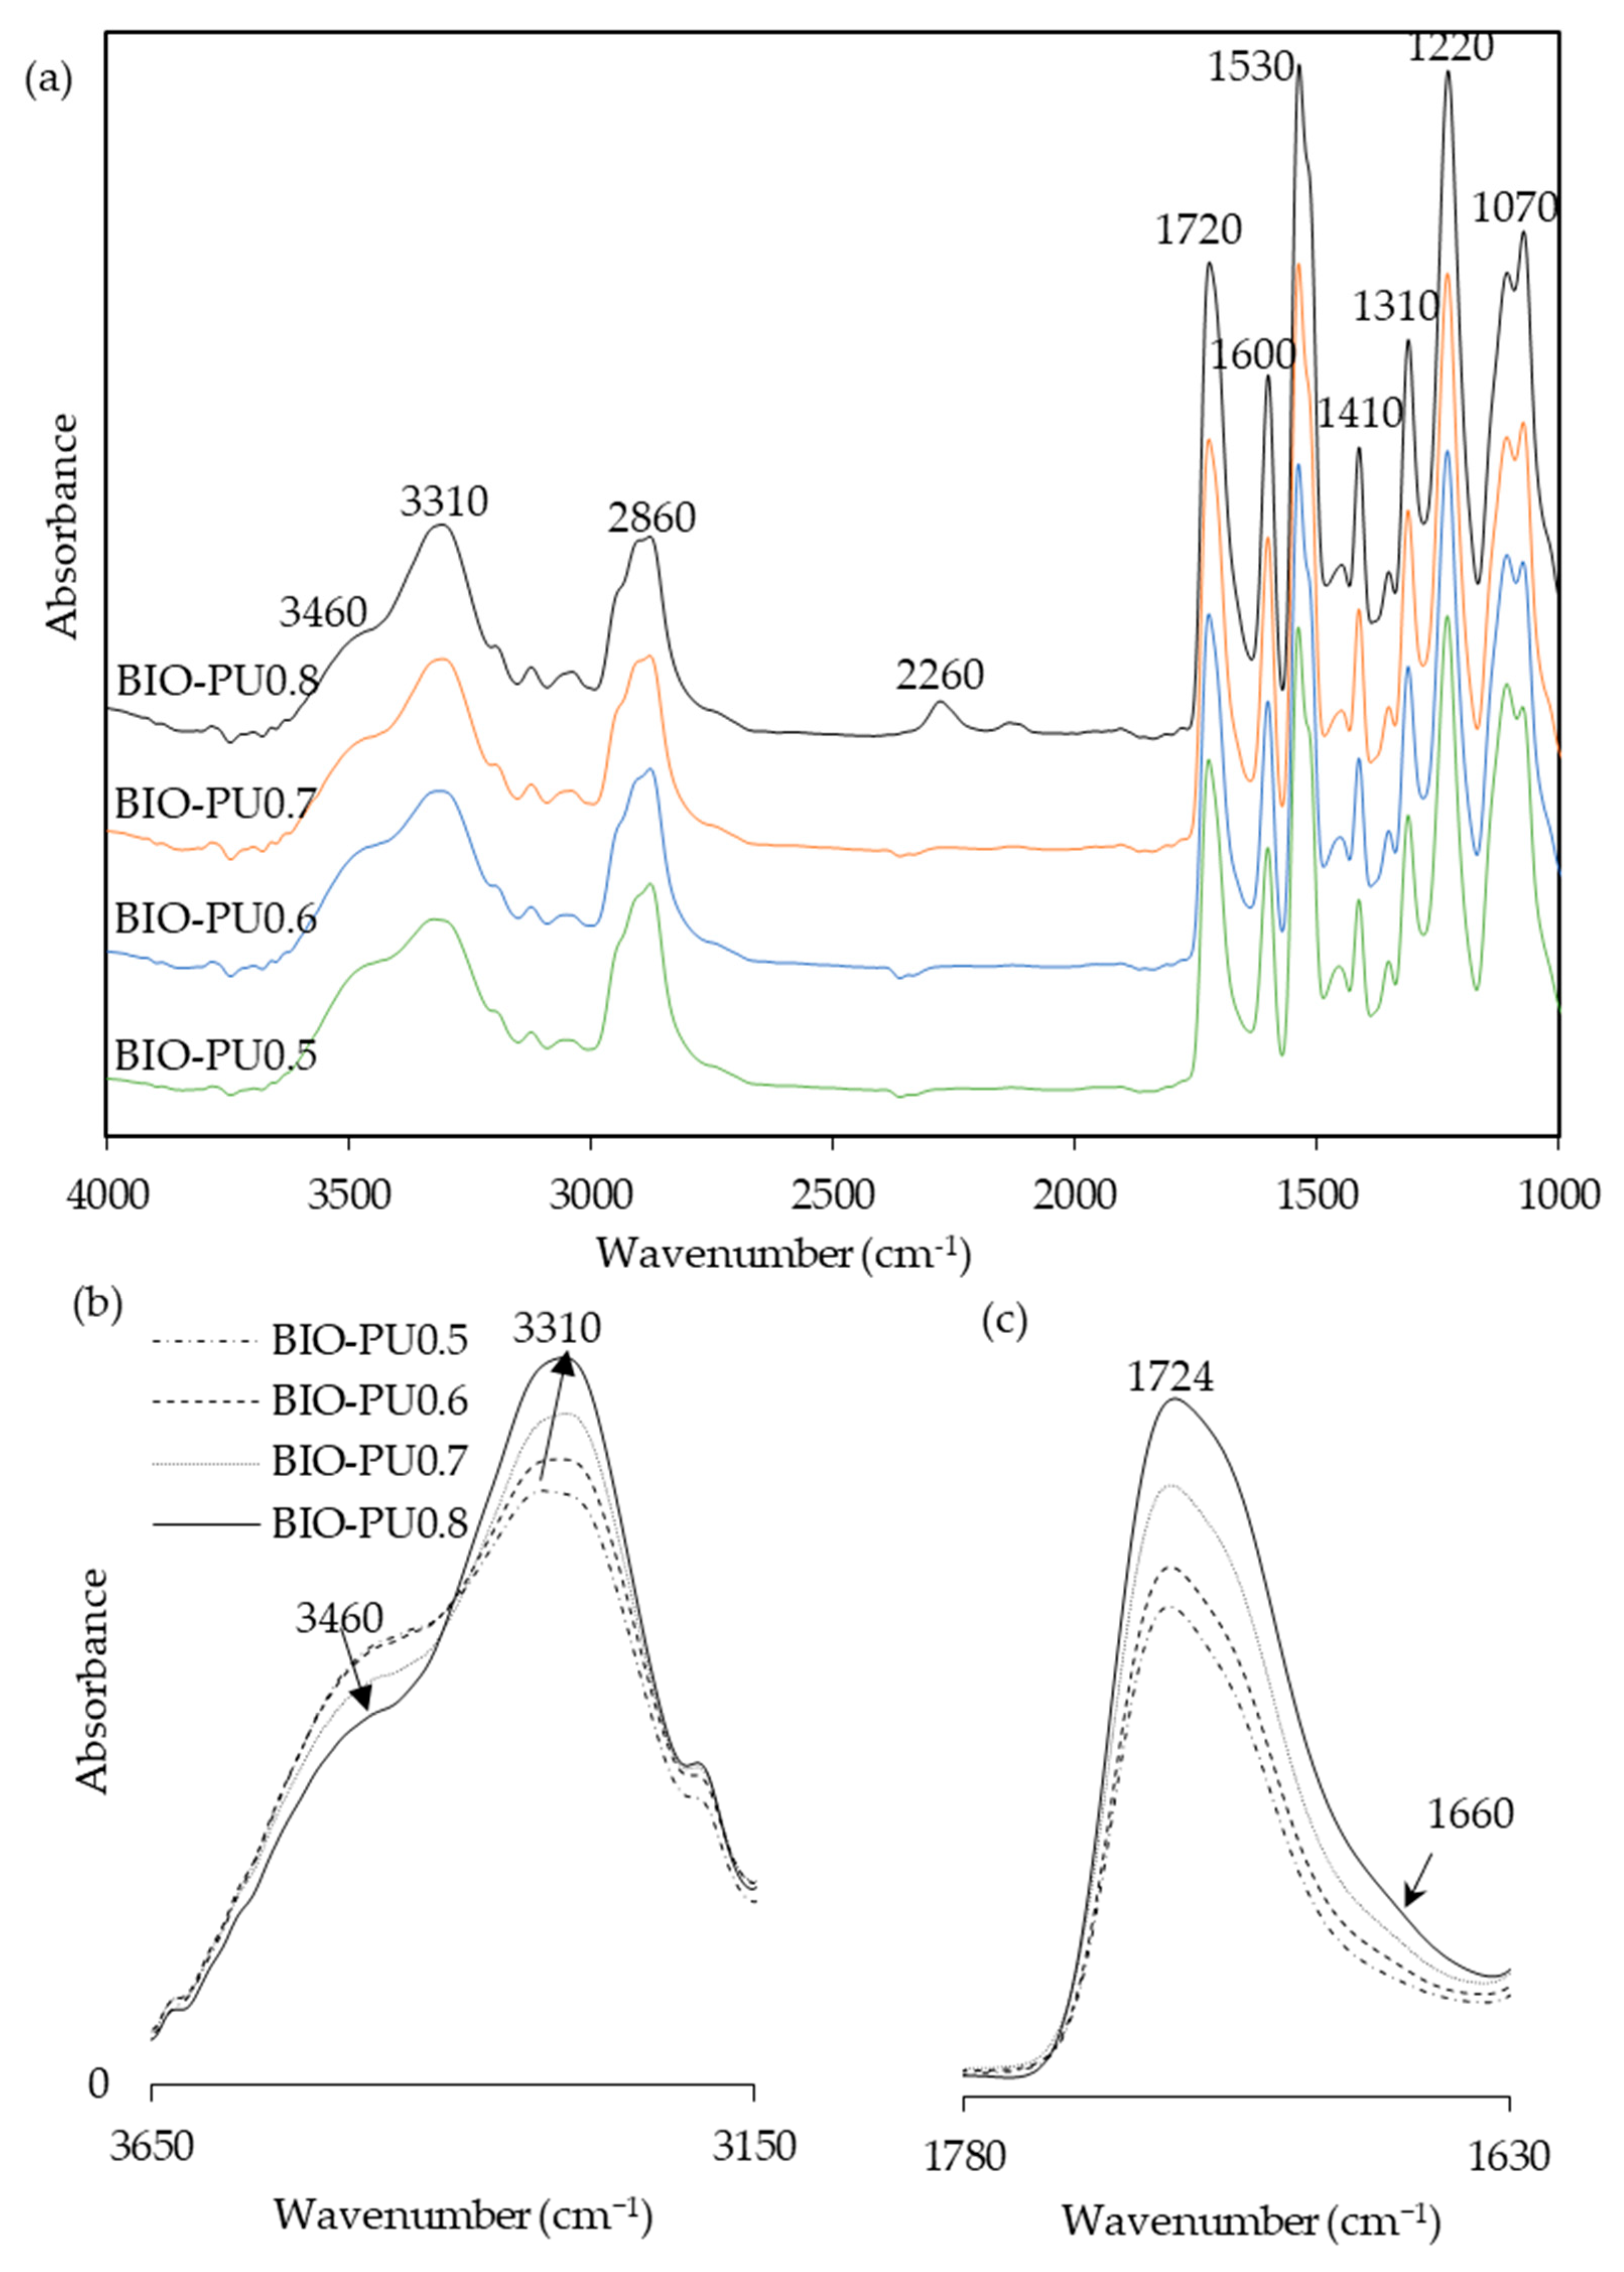
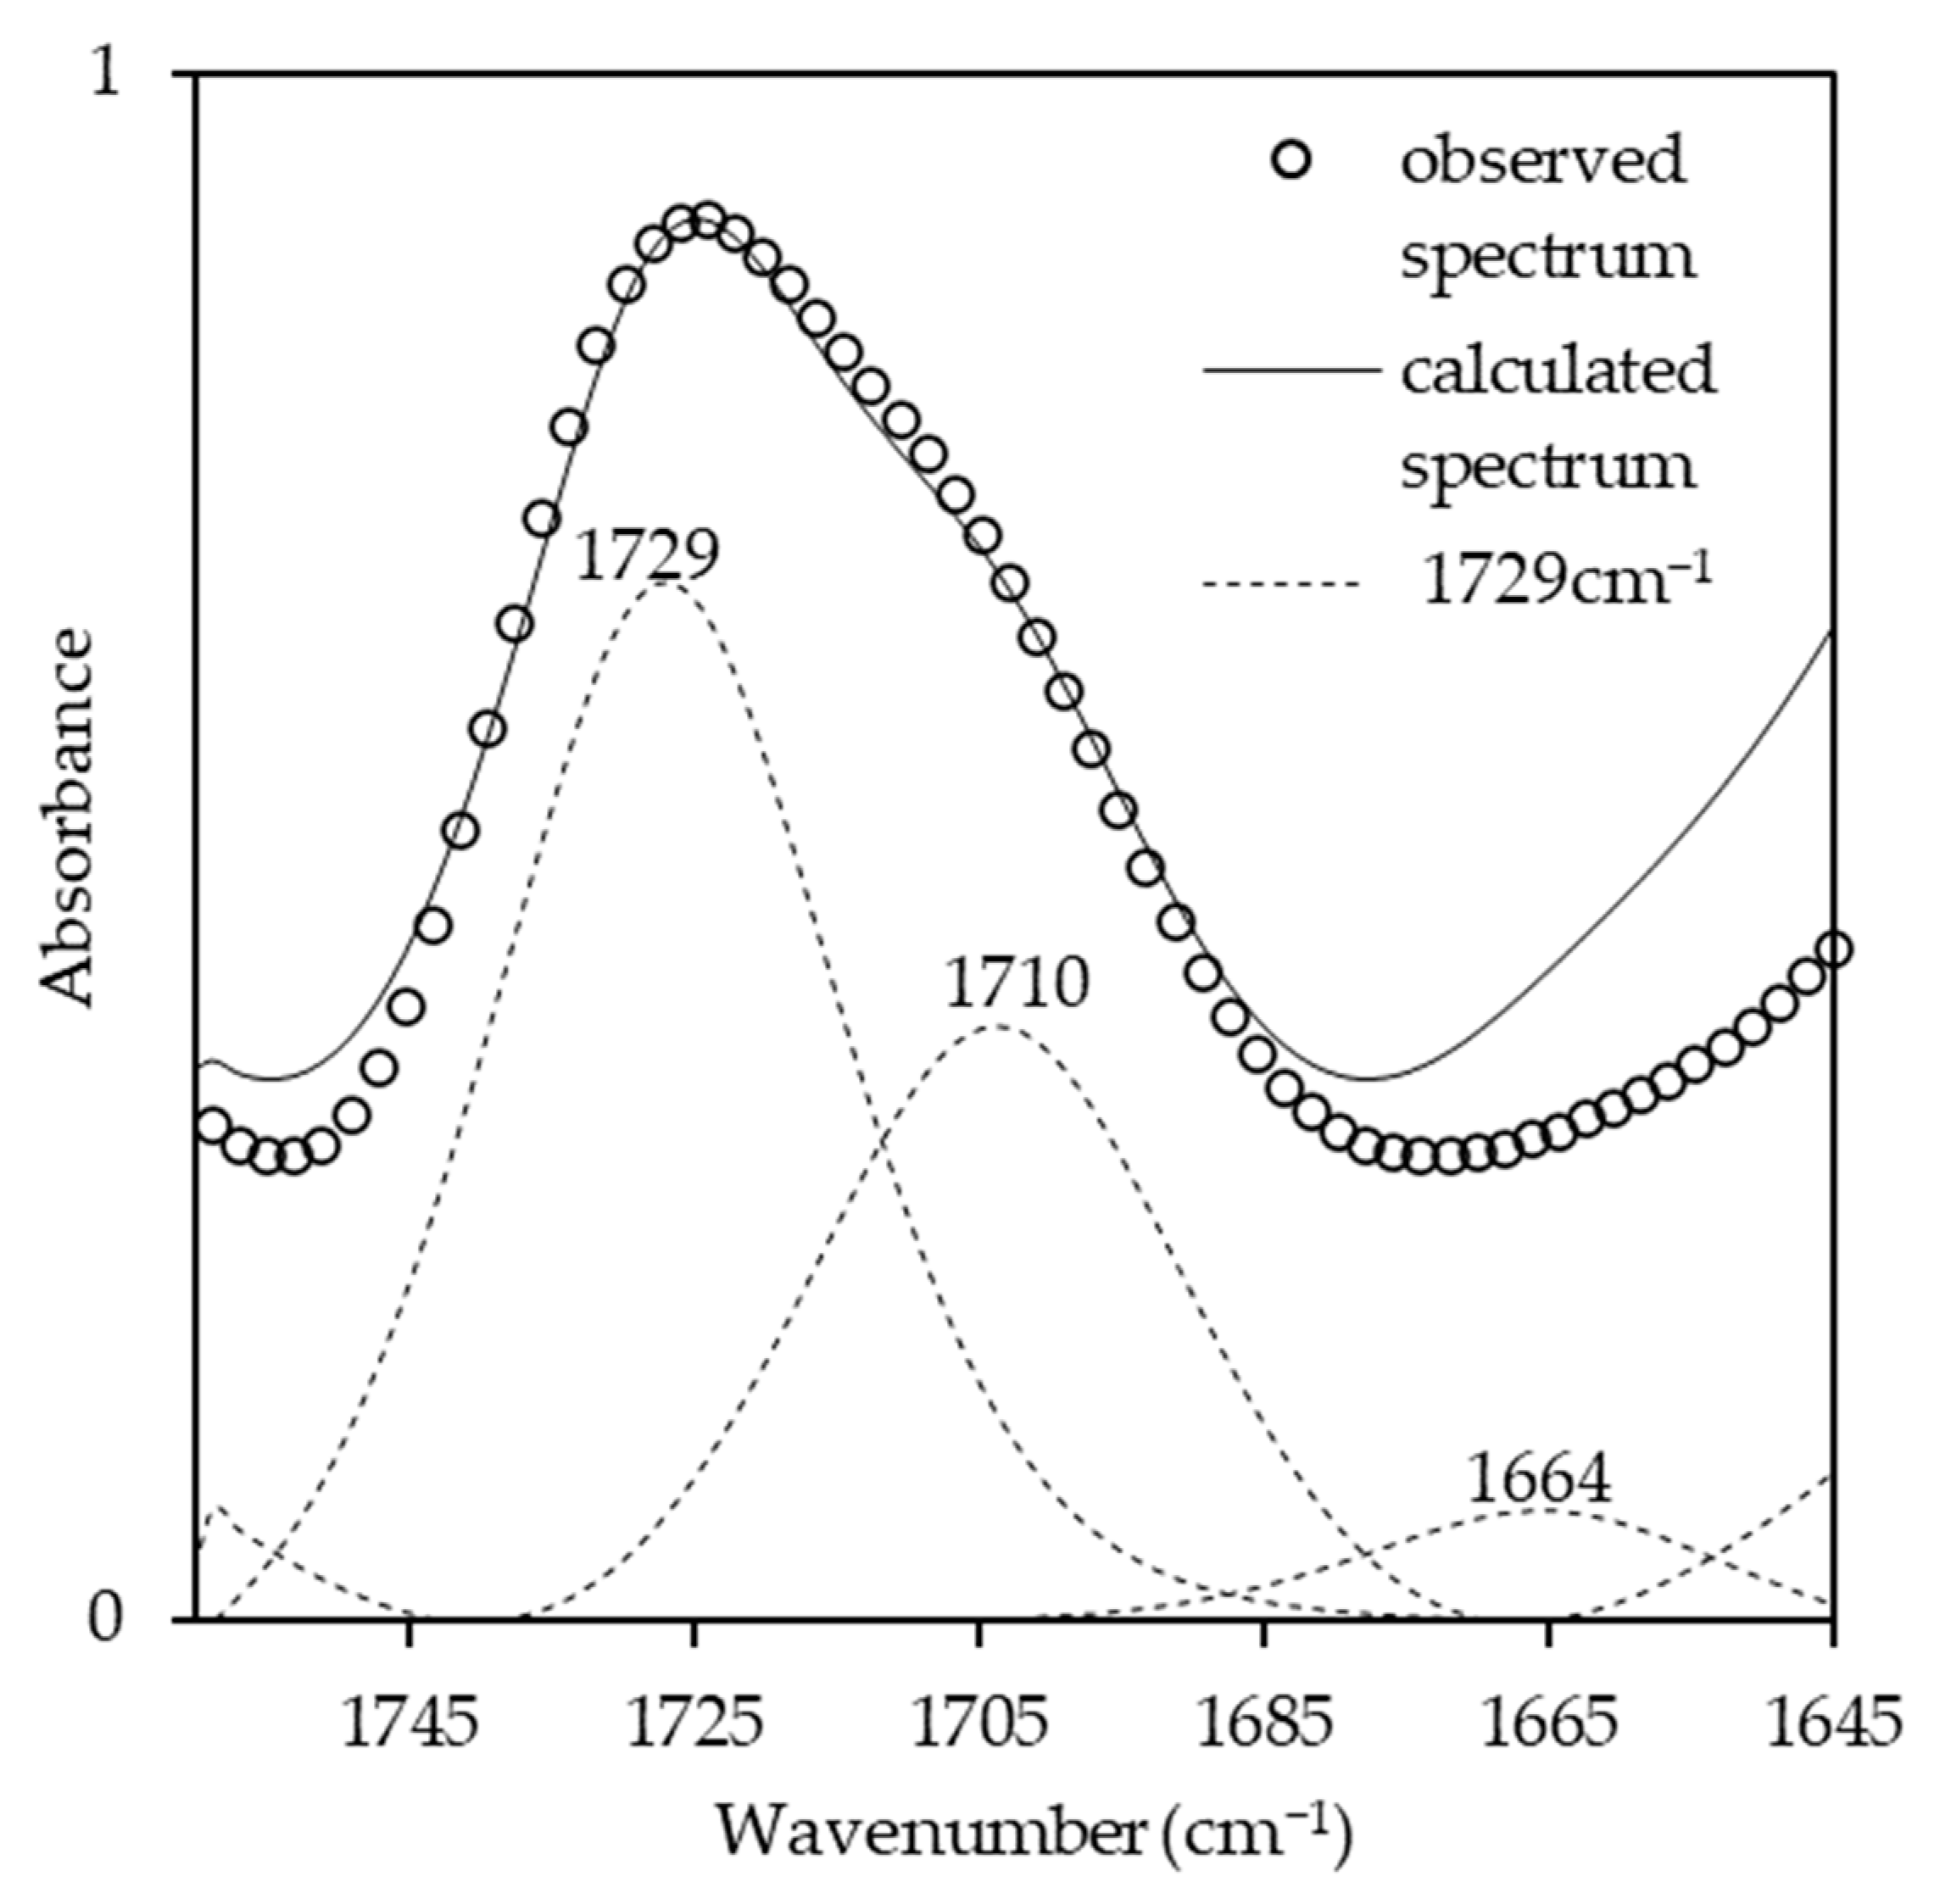
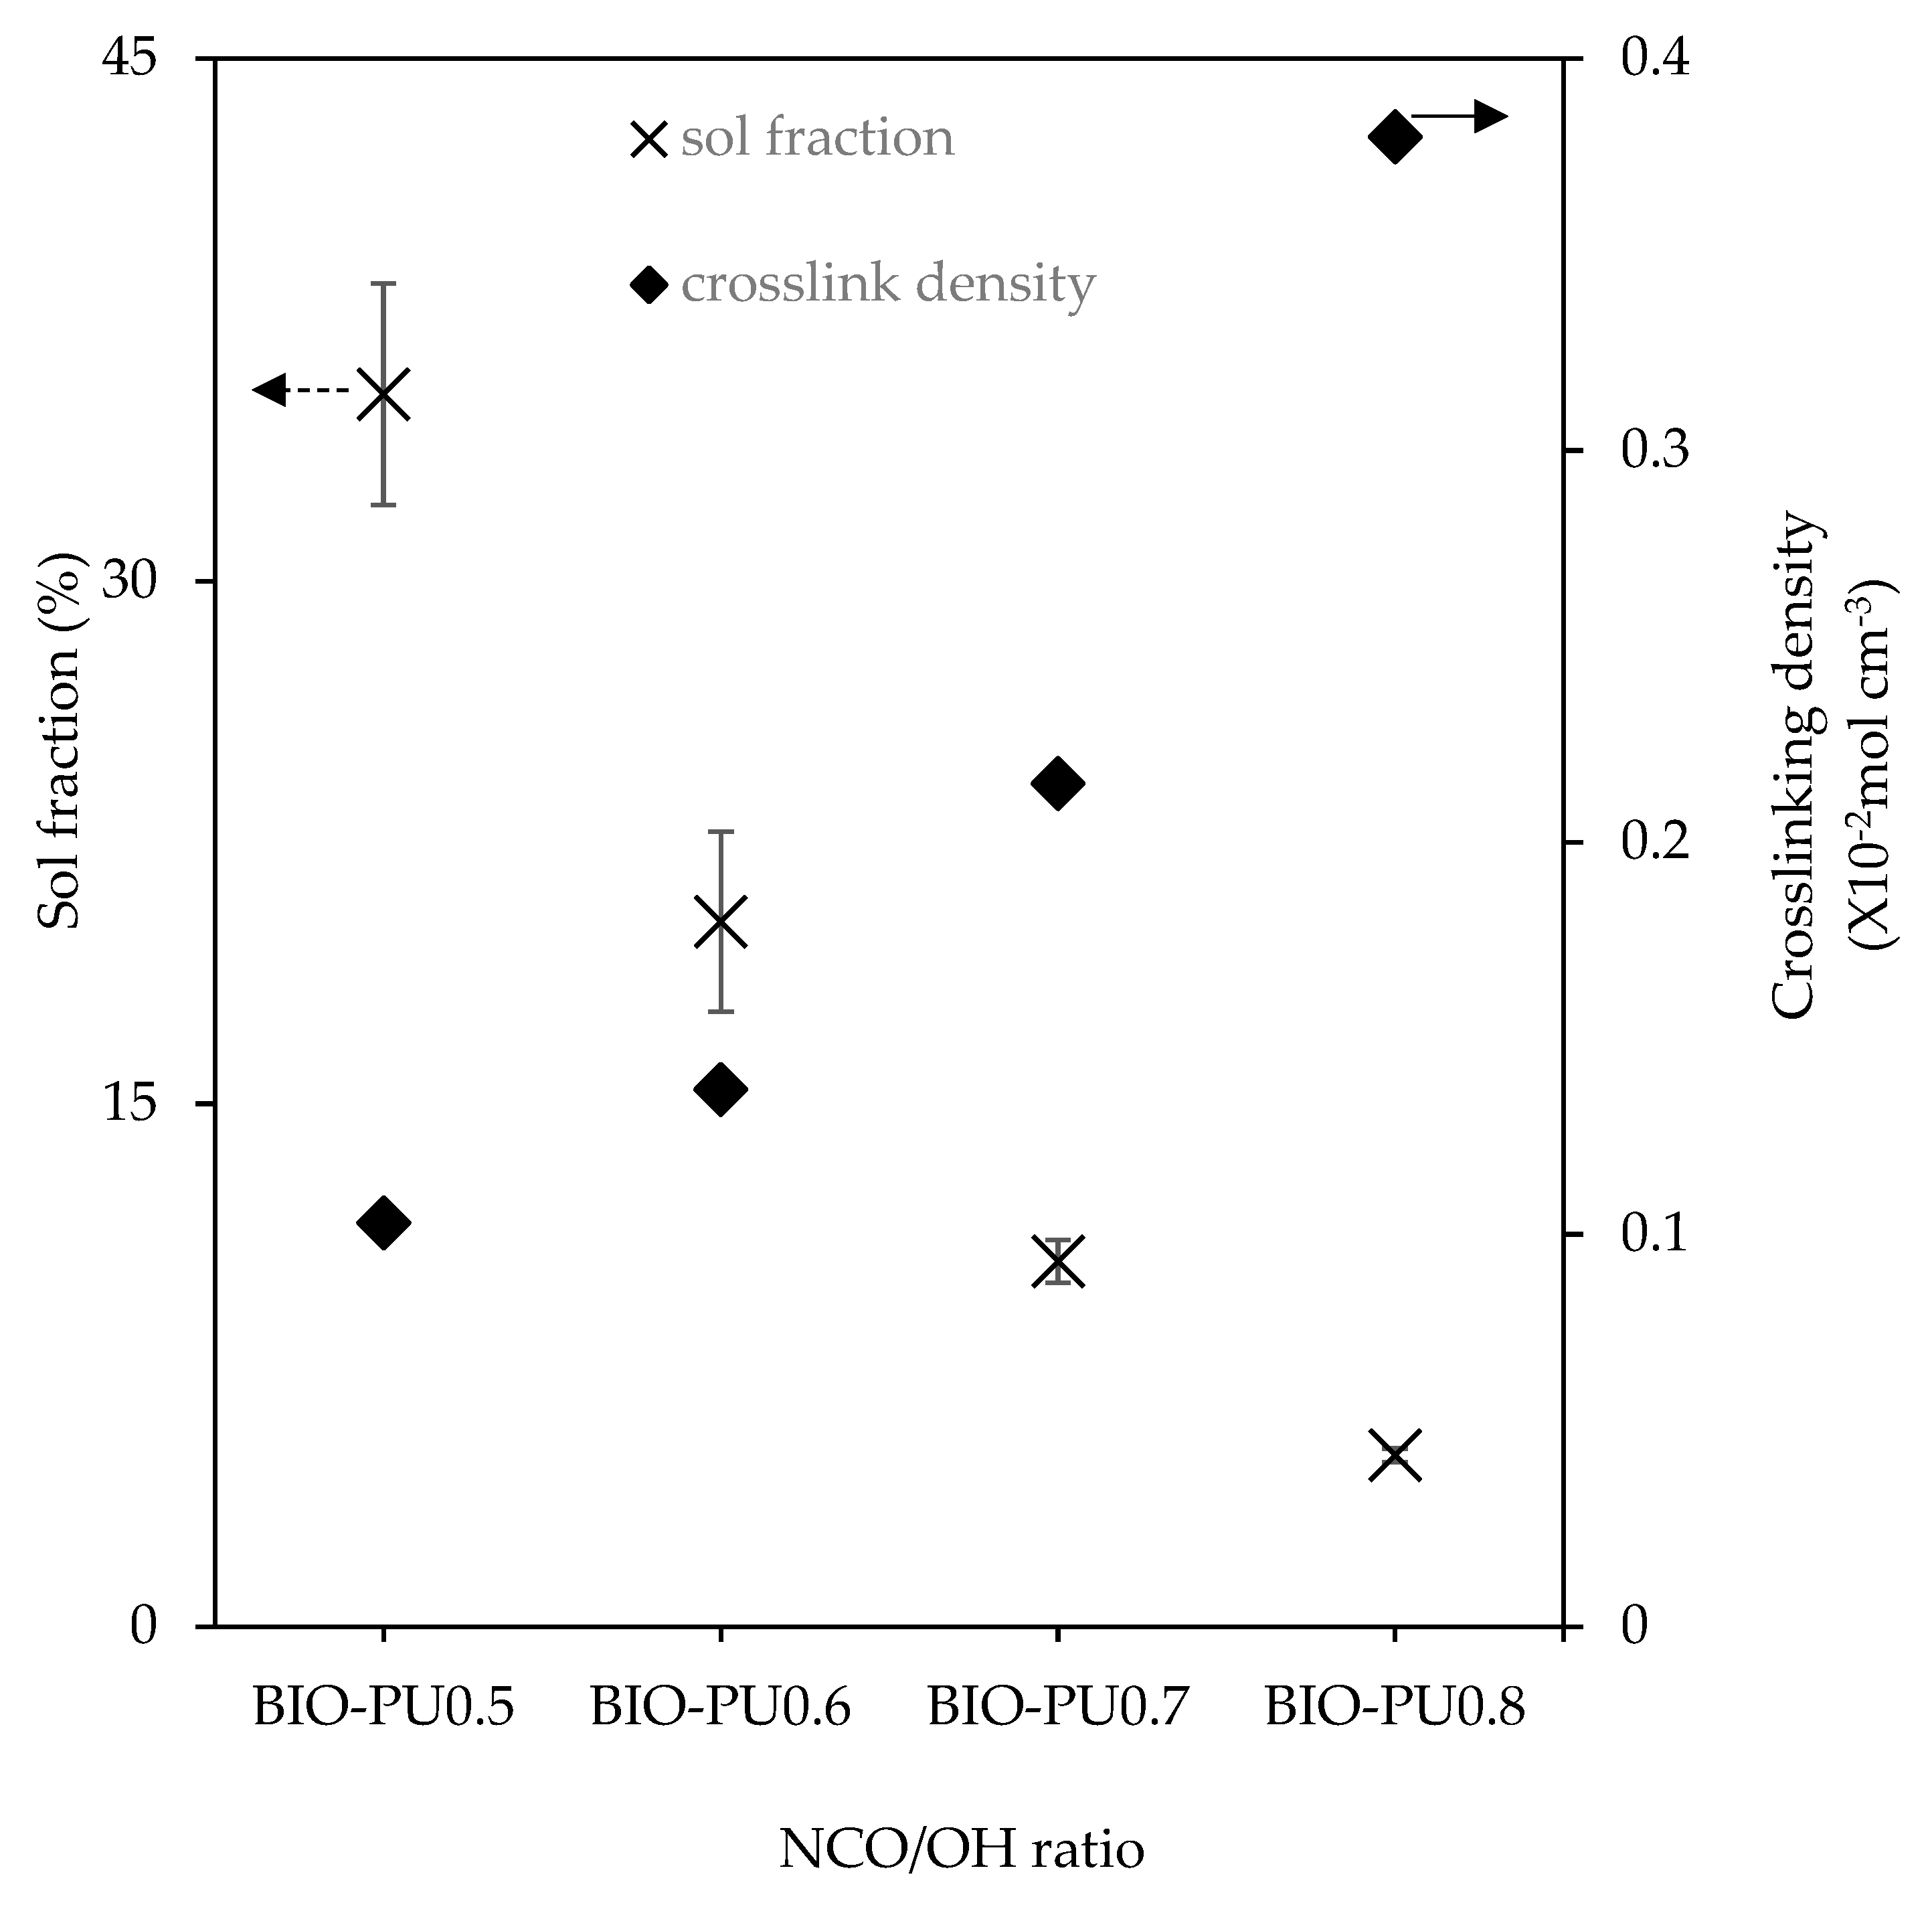
3.2. Effect of NCO/OH Ratios on BIO-PU Film Properties
4. Conclusions
Author Contributions
Funding
Institutional Review Board Statement
Informed Consent Statement
Data Availability Statement
Acknowledgments
Conflicts of Interest
References
- Nacas, A.M.; Ito, N.M.; De Sousa JR, R.R.; Spinacé, M.A.; Dos Santos, D.J. Effect of NCO:OH ratio on the mechanical properties and chemical structure of kraft lignin-based polyurethane adhesive. J. Adhes. 2017, 93, 18–29. [Google Scholar] [CrossRef]
- Yilgor, I.; Yilgor, E.; Wilkes, G.L. Critical parameters in designing segmented polyurethanes and their effect on morphology and properties: A comprehensive review. Polymer 2015, 58, A1–A36. [Google Scholar] [CrossRef]
- Szychers, M. Structure-property relations in polyurethanes. In Szychers’s Handbook of Polyurethanes, 2nd ed.; CRC Press: Boca Raton, FL, USA, 2013; p. 50. [Google Scholar]
- Coleman, M.M.; Skrovanek, D.J.; Hu, J.; Painter, P.C. Hydrogen bonding in polymer blends. 1. FTIR studies of urethane-ether blends. Macromol 1988, 21, 59–65. [Google Scholar] [CrossRef]
- Ravey, M.; Pearce, A.M. Flexible polyurethane foam. I. Thermal decomposition of a polyether-based, water-blown commercial type of flexible polyurethane foam. J. Appl. Polym. Sci. 1997, 63, 47–74. [Google Scholar] [CrossRef]
- Zhang, J.; Hori, N.; Takemura, A. Optimization of preparation process to produce polyurethane foam made by oilseed rape straw based polyol. Polym. Degrad. Stab. 2019, 166, 31–39. [Google Scholar] [CrossRef]
- Lee, W.J.; Hu, M.S.; Yu, C.Y.; Chen, Y.C. Influences of liquefied lignin content on the properties of waterborne polyurethane prepared with different chain extenders. Holzforschung 2020, 75, 668–676. [Google Scholar] [CrossRef]
- Zhou, X.; Qin, T.; Huang, L.; Zhang, X.; Yang, Z.; Wang, Y. Mechanisms and main regularities of biomass liquefaction with alcoholic solvents. Energy Fuel. 2009, 23, 5213–5218. [Google Scholar] [CrossRef]
- Gosz, K.; Tercjak, A.; Olszewski, A.; Haponiuk, J.; Piszczyk, Ł. Bio-based polyurethane networks derived from liquefied sawdust. Materials 2021, 14, 3138. [Google Scholar] [CrossRef]
- Lee, W.J.; Lin, M.S. Preparation and application of polyurethane adhesives made from polyhydric alcohol liquefied Taiwan Acacia and China Fir. J. Appl. Polym. Sci. 2008, 109, 23–31. [Google Scholar] [CrossRef]
- Jiang, W.; Hosseinpourpia, R.; Biziks, V.; Ahmed, S.A.; Militz, H.; Adamopoulos, S. Preparations of polyurethane adhesives from crude and purified liquefied sawdust. Polymers 2021, 13, 3267. [Google Scholar] [CrossRef]
- Kurimoto, Y.; Takeda, M.; Doi, S.; Tamura, Y.; Ono, H. Network structures and thermal properties of polyurethane films prepared from liquefied wood. Bioresour. Technol. 2001, 77, 33–40. [Google Scholar] [CrossRef]
- Yao, Y.; Yoshioka, M.; Shiraishi, N. Water-absorbing polyurethanes foams from liquefied starch. J. Appl. Polym. Sci. 1996, 60, 193–194. [Google Scholar] [CrossRef]
- Lu, Y.; Larock, R.C. Soybean-oil-based waterborne polyurethane dispersions: Effects of polyol functionality and hard segment content on properties. Biomacromolecules 2008, 9, 3332–3340. [Google Scholar] [CrossRef] [PubMed]
- Huang, J.; Zhang, L. Effects of NCO/OH molar ratio on structure and properties of graft-interpenetration polymer networks from polyurethane and nitrolignin. Polymer 2017, 43, 2287–2294. [Google Scholar] [CrossRef]
- Patel, R.H.; Mishra, V.K. Effect of increasing NCO ratio on properties of flame retardant di-phosphorous based polyether ester urethanes. Prog. Org. Coat. 2020, 141, 105533. [Google Scholar] [CrossRef]
- Kojio, K.; Kugumiya, S.; Uchiba, Y.; Nishino, Y.; Furukawa, M. The microphase-separated structure of polyurethane bulk and thin films. J. Polym. 2009, 41, 118–124. [Google Scholar] [CrossRef]
- Bao, L.H.; Lan, Y.J.; Zhang, S.F. Effect of NCO/OH molar ratio on the structure and properties of aqueous polyurethane from modified castor oil. J. Iran Polym. 2006, 15, 737–746. [Google Scholar]
- Gouveia, J.R.; de Sousa Júnior, R.R.; Ribeiro, A.O.; Saraiva, S.A.; dos Santos, D.J. Effect of soft segment molecular weight and NCO:OH ratio on thermomechanical properties of lignin based thermoplastic polyurethane adhesive. Eur. Polym. J. 2020, 131, 109690. [Google Scholar] [CrossRef]
- Palle, I.; Hori, N.; Iwata, T.; Takemura, A. Optimization of polyol production via liquefaction from Acacia mangium and analysis of the polyols by traditional methods and two-dimensional correlation spectroscopy. Holzforschung 2018, 72, 451–458. [Google Scholar] [CrossRef]
- Almarego, W.L.F.; Perrin, D.D. Purification of Laboratory Chemicals, 4th ed.; Butterworth-Heinemann: Oxford, UK, 1966. [Google Scholar]
- Coleman, M.M.; Lee, K.H.; Skrovanek, D.J.; Painter, P.C. Hydrogen bonding in polymers. 4. Infrared temperature studies of a simple polyurethane. Macromol 1986, 19, 2149–2157. [Google Scholar] [CrossRef]
- Fuensanta, M.; Martin-Martinez, J.M. Viscoelastic and adhesion properties of new poly(ether-urethane) pressure-sensitive adhesive. Front. Mech. Eng. 2020, 6, 1–10. [Google Scholar] [CrossRef]
- Teo, L.S.; Chen, C.Y.; Kuo, J.F. Fourier transform infrared spectroscopy study on effects of temperature on hydrogen bonding in amine-containing polyu-rethanes and poly(urethane-urea)s. Macromol 1997, 30, 1793–1799. [Google Scholar] [CrossRef]
- Skrovanek, D.J.; Howe, S.E.; Painter, P.C.; Coleman, M.M. Hydrogen bonding in polymers. Infrared temperature studies of an amorphous polyamide. Macromol 1985, 18, 1676–1683. [Google Scholar] [CrossRef]
- Wang, F.C.; Feve, M.; Lam, T.M.; Pascault, J.P. FTIR analysis of hydrogen bonding in amorphous linear aromatic polyurethanes I. Influence of temperature. J. Polym. Sci. Part B Polym. Phys. 1994, 32, 1305–1313. [Google Scholar] [CrossRef]
- Yilgor, I.; Yilgor, E.; Guler, I.G.; Ward, T.C.; Wilkes, G.L. FTIR investigation of the influence of diisocyanate symmetry on the morphology development in model segmented polyurethanes. Polymer 2006, 47, 4105–4114. [Google Scholar] [CrossRef]
- Xu, Q.; Hong, T.; Zhou, Z.; Gao, J.; Xue, L. The effect of the trimerization catalyst on thermal stability and the fire performance of the polyisocyanurate-polyurethane foam. Fire Mater. 2018, 42, 119–127. [Google Scholar] [CrossRef]
- Jung, Y.S.; Lee, S.; Park, J.; Shin, E.J. One-shot synthesis of thermoplastic polyurethane based on bio-polyol (polytrimethylene ether glycol) and characterization of microphase separation. Polymers 2022, 14, 4269. [Google Scholar] [CrossRef] [PubMed]
- Strikovsky, A.; Zharkov, V. Infra-red spectroscopy study of equilibrium association of urethane groups in poly (ether urethane)s. Polymer 1993, 34, 3397–3401. [Google Scholar] [CrossRef]
- Noda, I. Two-dimensional codistrbution spectroscopy to determine the sequential order of distributed presence of species. J. Mol. Struct. 2014, 1069, 50–58. [Google Scholar] [CrossRef]
- Long, T.S.; Pisney, J.J. Characterization of polyurethane using infrared and thermal analysis. Plastic. Eng. 1976, 22, 398–403. [Google Scholar]
- Petrović, Z.S.; Zavargo, Z.; Flyn, J.H.; Macknight, W.J. Thermal degradation of segmented polyurethanes. J. Appl. Polym. Sci. 1994, 51, 1087–1095. [Google Scholar] [CrossRef]
- Jiricny, J.; Reese, C.B. The thermal decomposition of isocyanurates. Br. Polym. J. 1980, 12, 81–84. [Google Scholar] [CrossRef]


| BIO-PU Film | Formulation (wt%) | NCO/OH Ratio | |
|---|---|---|---|
| A. mangium Liquefied Wood | pMDI | ||
| BIO-PU 0.5 | 59 | 41 | 0.5 |
| BIO-PU 0.6 | 54 | 46 | 0.6 |
| BIO-PU 0.7 | 50 | 50 | 0.7 |
| BIO-PU 0.8 | 47 | 53 | 0.8 |
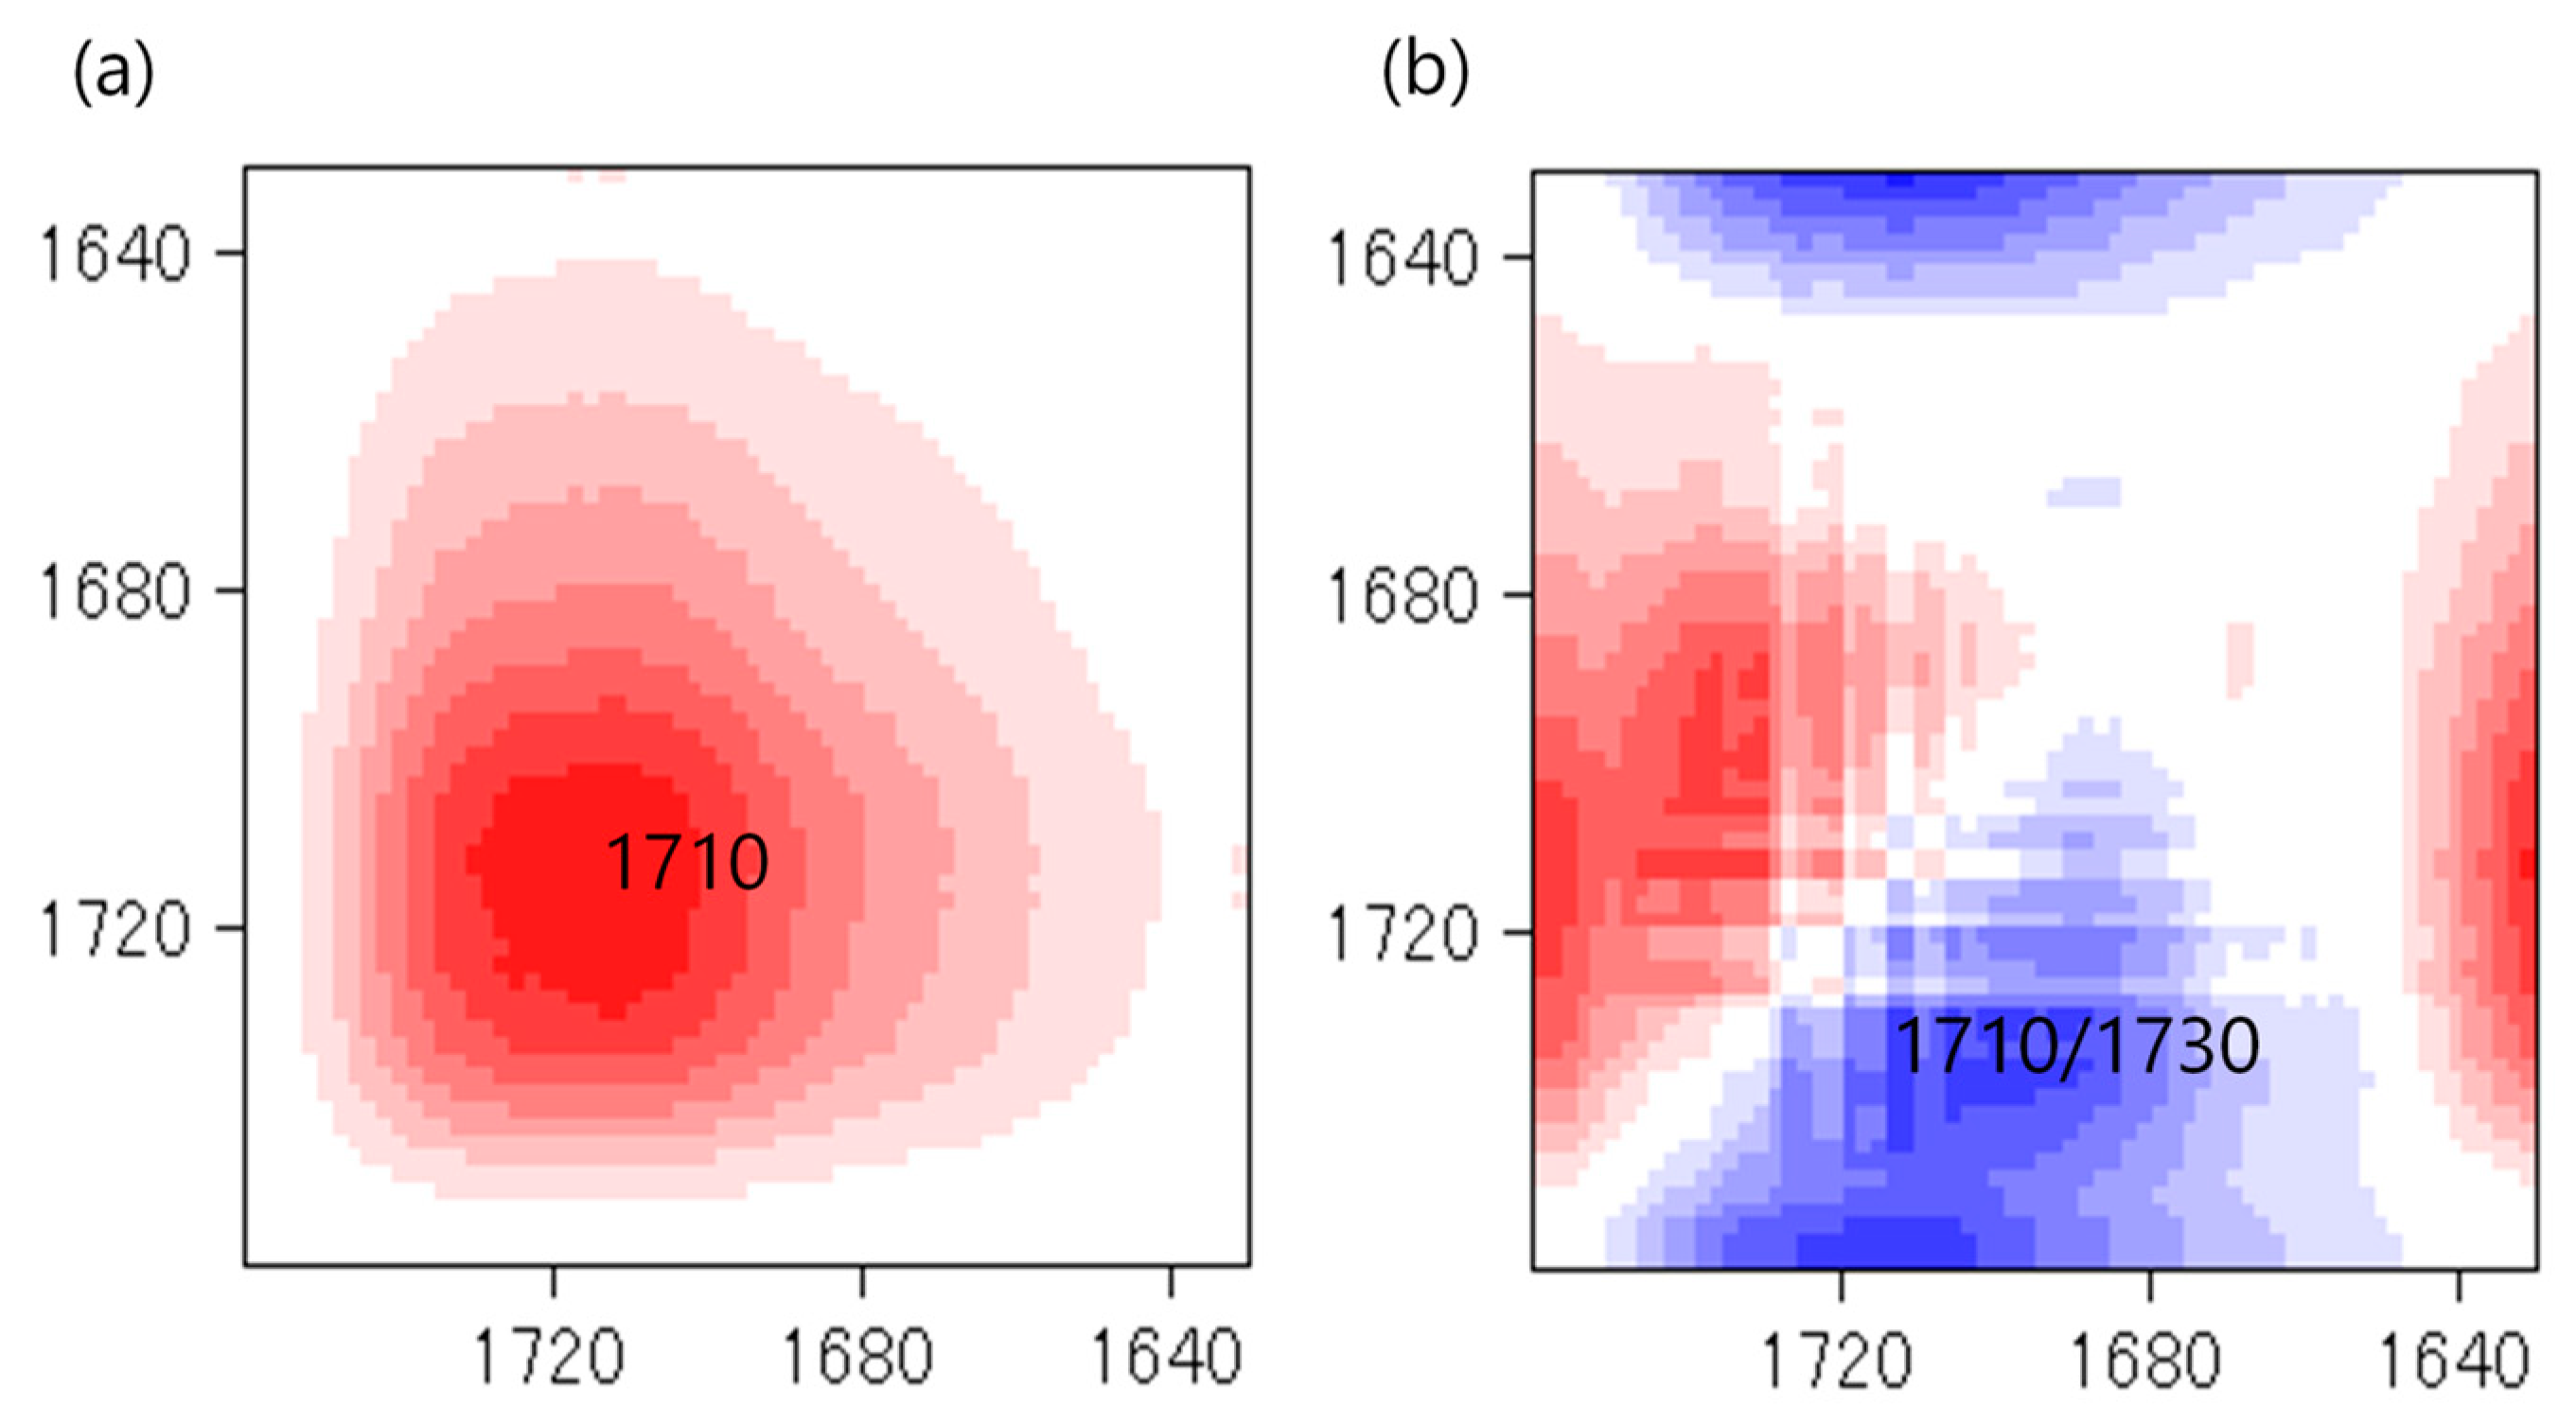
| NCO/OH | Urethane (Free) | Urethane (H-Bonded) | Urea | |||
|---|---|---|---|---|---|---|
| Freq (cm−1) | Width a (cm−1) | Freq (cm−1) | Width (cm−1) | Freq (cm−1) | Width (cm−1) | |
| BIO-PU0.5 | 1729 | 6.476 | 1710 | 7.176 | - | - |
| BIO-PU0.6 | 1727 | 11.261 | 1703 | 7.940 | 1664 | 1.500 |
| BIO-PU0.7 | 1729 | 8.835 | 1709 | 10.138 | 1666 | 1.677 |
| BIO-PU0.8 | 1729 | 10.729 | 1707 | 11.956 | 1667 | 2.466 |
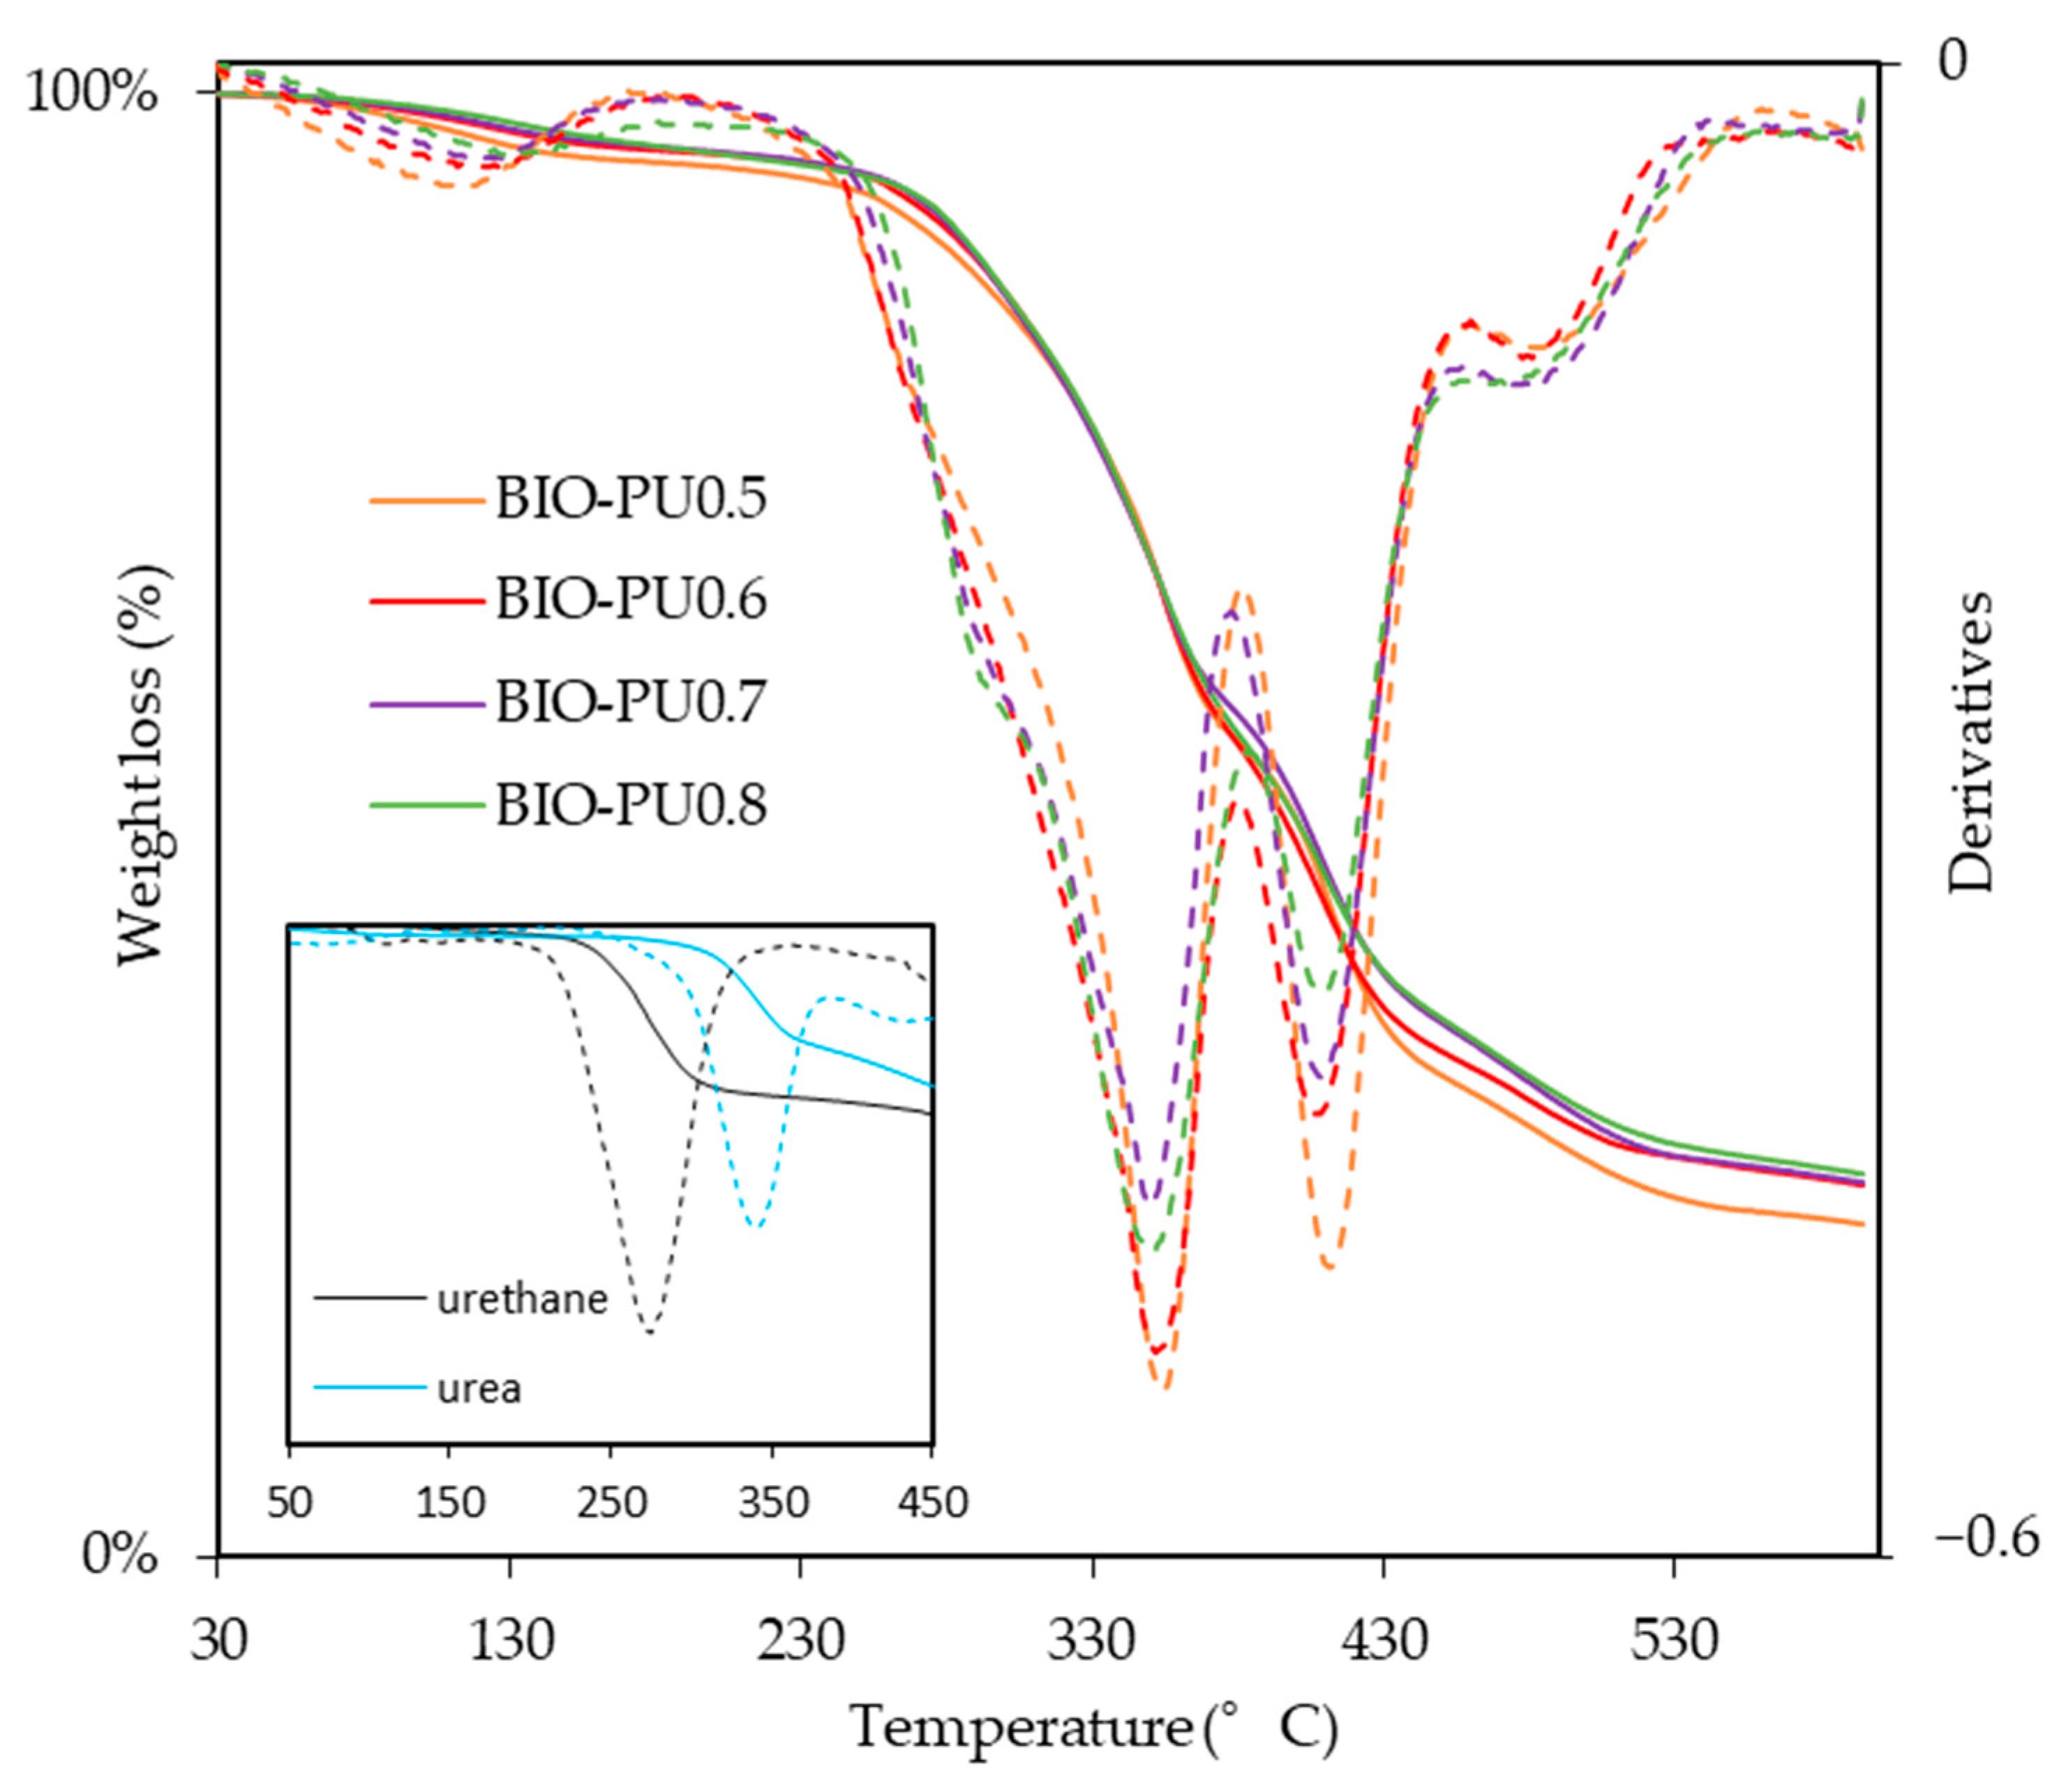
| BIO-PU Film | T10wt.% (°C) | T50wt.% (°C) | Residue at 600 °C (wt%) |
|---|---|---|---|
| BIO-PU 0.5 | 275 | 399 | 2.43 |
| BIO-PU 0.6 | 283 | 396 | 2.57 |
| BIO-PU 0.7 | 284 | 402 | 2.74 |
| BIO-PU 0.8 | 286 | 400 | 2.71 |
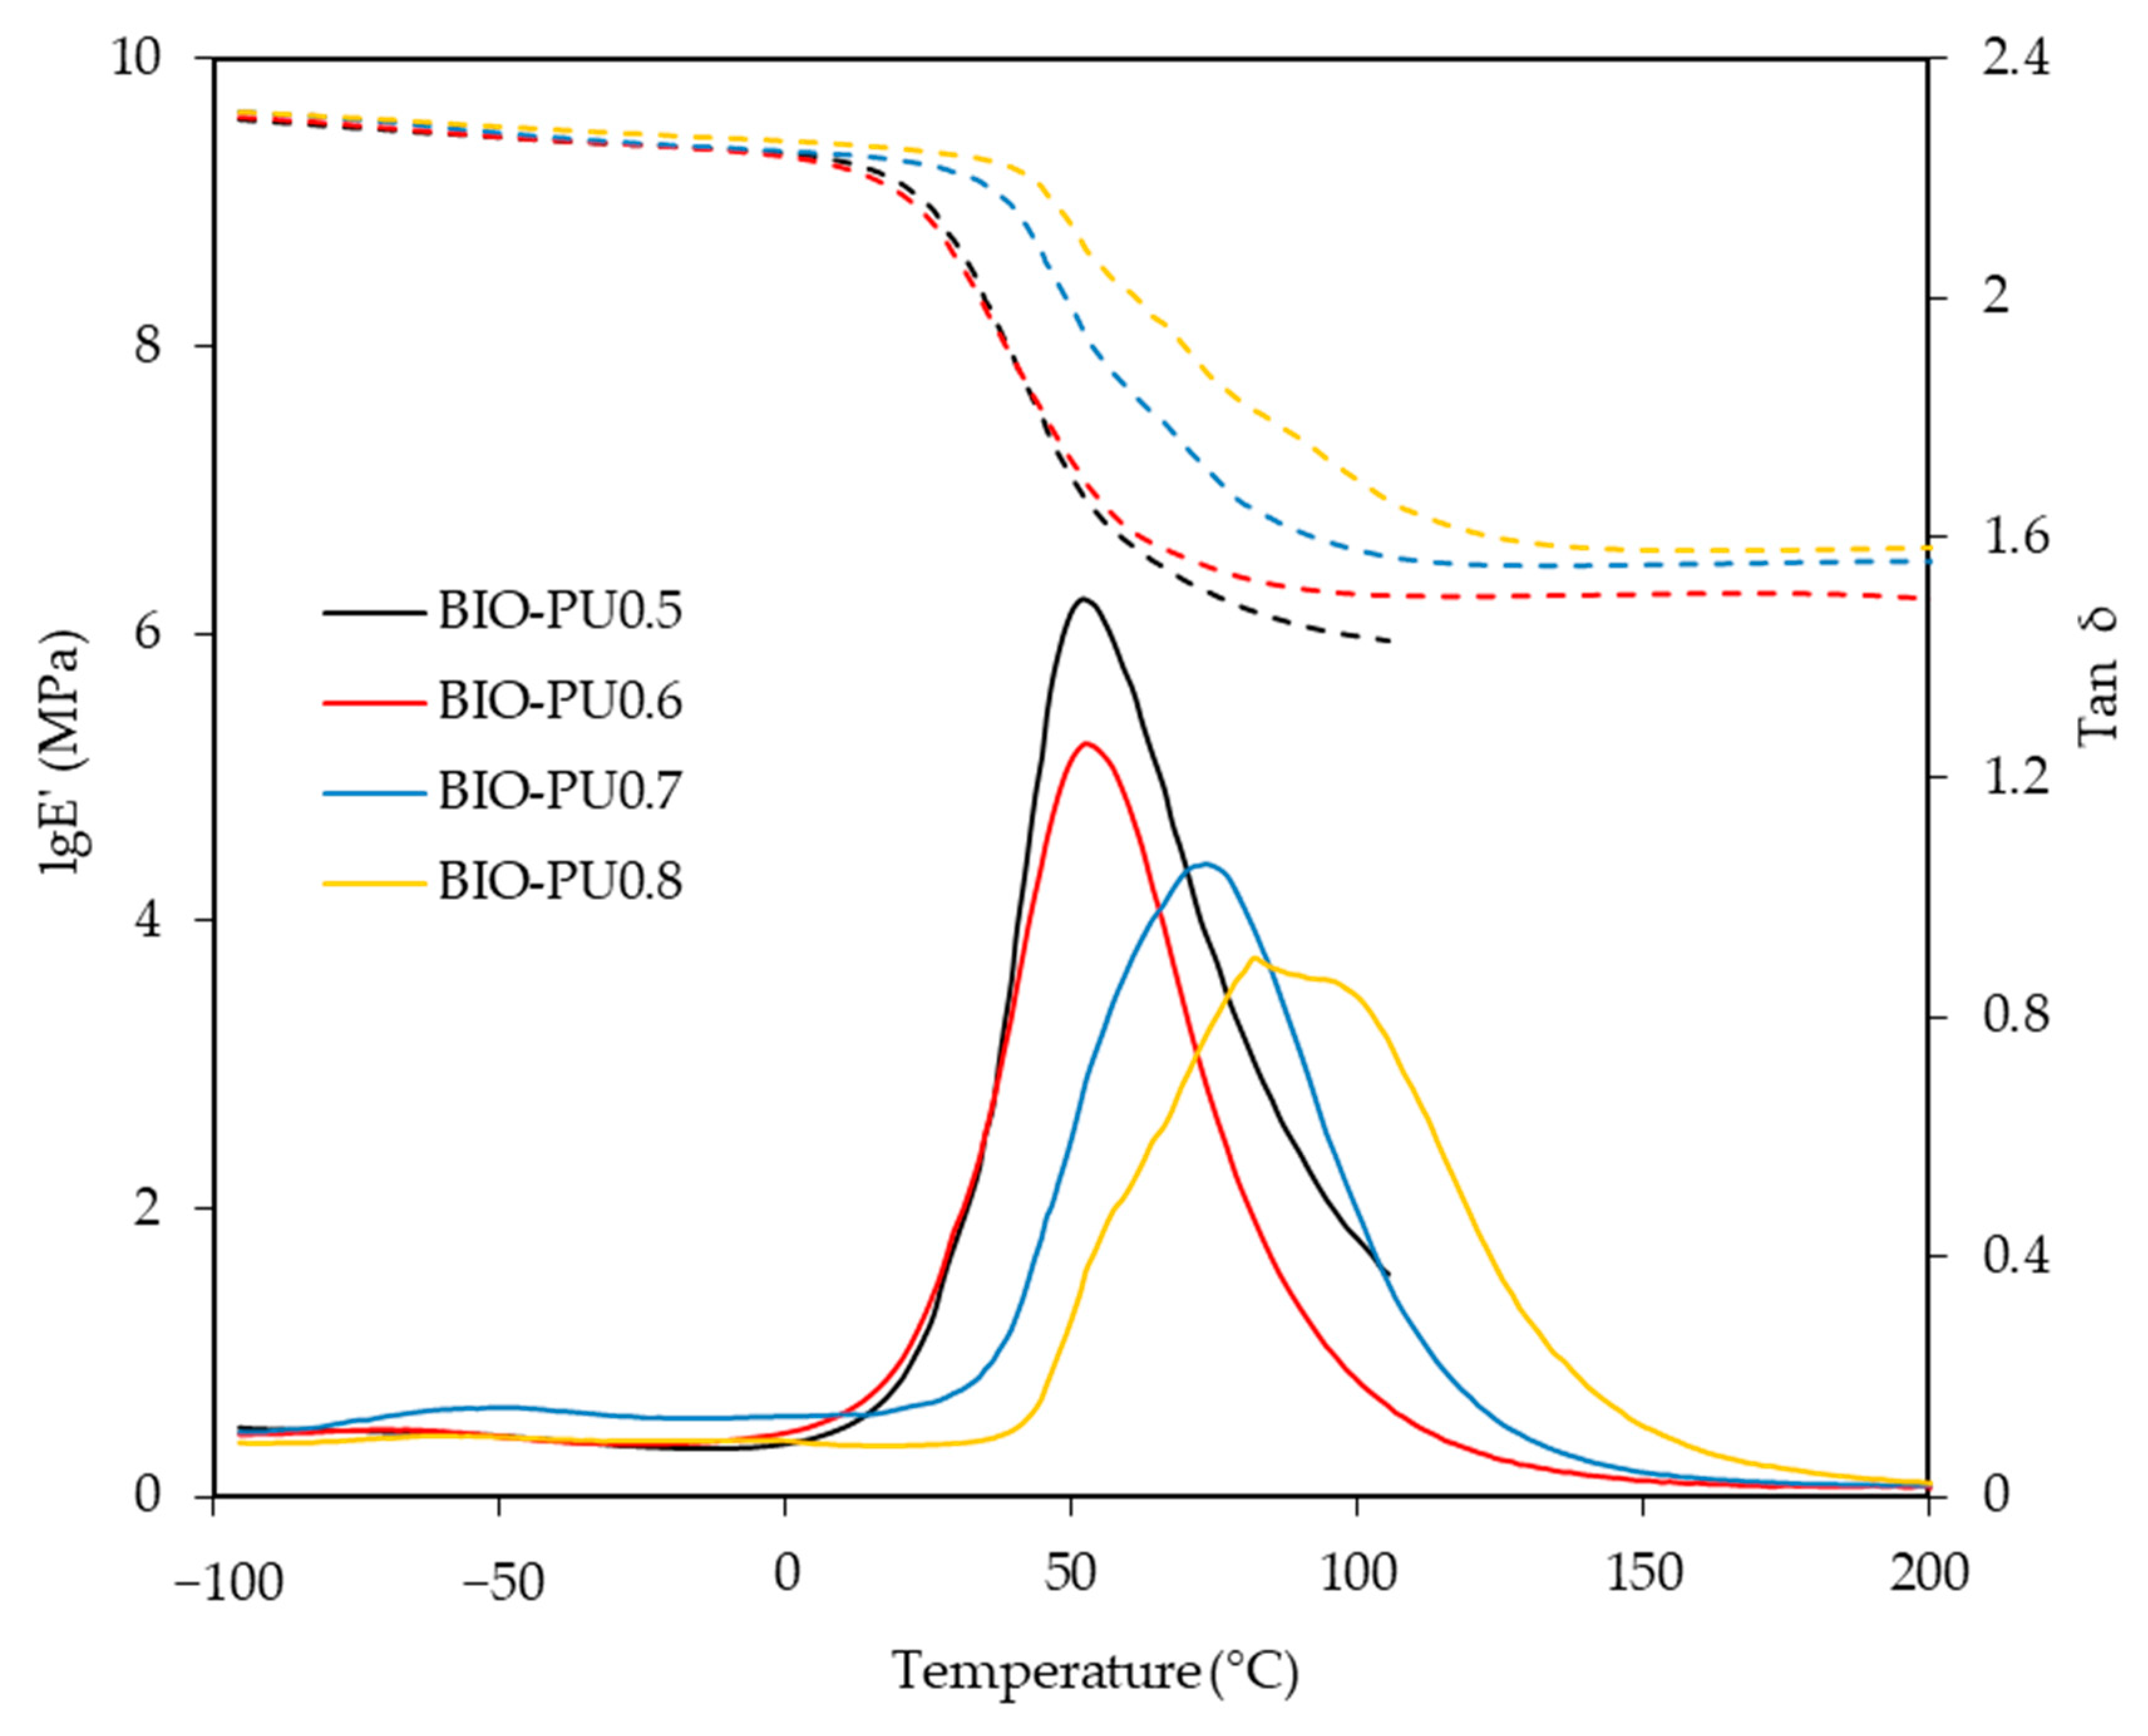
| BIO-PU Film | Tg (°C) | E′ (MPa) |
|---|---|---|
| BIO-PU 0.5 | 50.15 | 8.32 |
| BIO-PU 0.6 | 51.45 | 11.1 |
| BIO-PU 0.7 | 72.25 | 18.2 |
| BIO-PU 0.8 | 84.85 | 33.4 |
Disclaimer/Publisher’s Note: The statements, opinions and data contained in all publications are solely those of the individual author(s) and contributor(s) and not of MDPI and/or the editor(s). MDPI and/or the editor(s) disclaim responsibility for any injury to people or property resulting from any ideas, methods, instructions or products referred to in the content. |
© 2023 by the authors. Licensee MDPI, Basel, Switzerland. This article is an open access article distributed under the terms and conditions of the Creative Commons Attribution (CC BY) license (https://creativecommons.org/licenses/by/4.0/).
Share and Cite
Palle, I.; Lodin, V.; Mohd Yunus, A.A.; Lee, S.H.; Md Tahir, P.; Hori, N.; Antov, P.; Takemura, A. Effects of NCO/OH Ratios on Bio-Based Polyurethane Film Properties Made from Acacia mangium Liquefied Wood. Polymers 2023, 15, 1154. https://doi.org/10.3390/polym15051154
Palle I, Lodin V, Mohd Yunus AA, Lee SH, Md Tahir P, Hori N, Antov P, Takemura A. Effects of NCO/OH Ratios on Bio-Based Polyurethane Film Properties Made from Acacia mangium Liquefied Wood. Polymers. 2023; 15(5):1154. https://doi.org/10.3390/polym15051154
Chicago/Turabian StylePalle, Ismawati, Valeritta Lodin, Ag Ahmad Mohd Yunus, Seng Hua Lee, Paridah Md Tahir, Naruhito Hori, Petar Antov, and Akio Takemura. 2023. "Effects of NCO/OH Ratios on Bio-Based Polyurethane Film Properties Made from Acacia mangium Liquefied Wood" Polymers 15, no. 5: 1154. https://doi.org/10.3390/polym15051154
APA StylePalle, I., Lodin, V., Mohd Yunus, A. A., Lee, S. H., Md Tahir, P., Hori, N., Antov, P., & Takemura, A. (2023). Effects of NCO/OH Ratios on Bio-Based Polyurethane Film Properties Made from Acacia mangium Liquefied Wood. Polymers, 15(5), 1154. https://doi.org/10.3390/polym15051154