

Effective Removal of Glyphosate from Aqueous Systems Using Synthesized PEG-Coated Calcium Peroxide Nanoparticles: Kinetics Study, H2O2 Release Performance and Degradation Pathways

 ,
, 
 , and
, and
Abstract
:
1. Introduction
2. Materials and Methods
2.1. Chemical Reagents
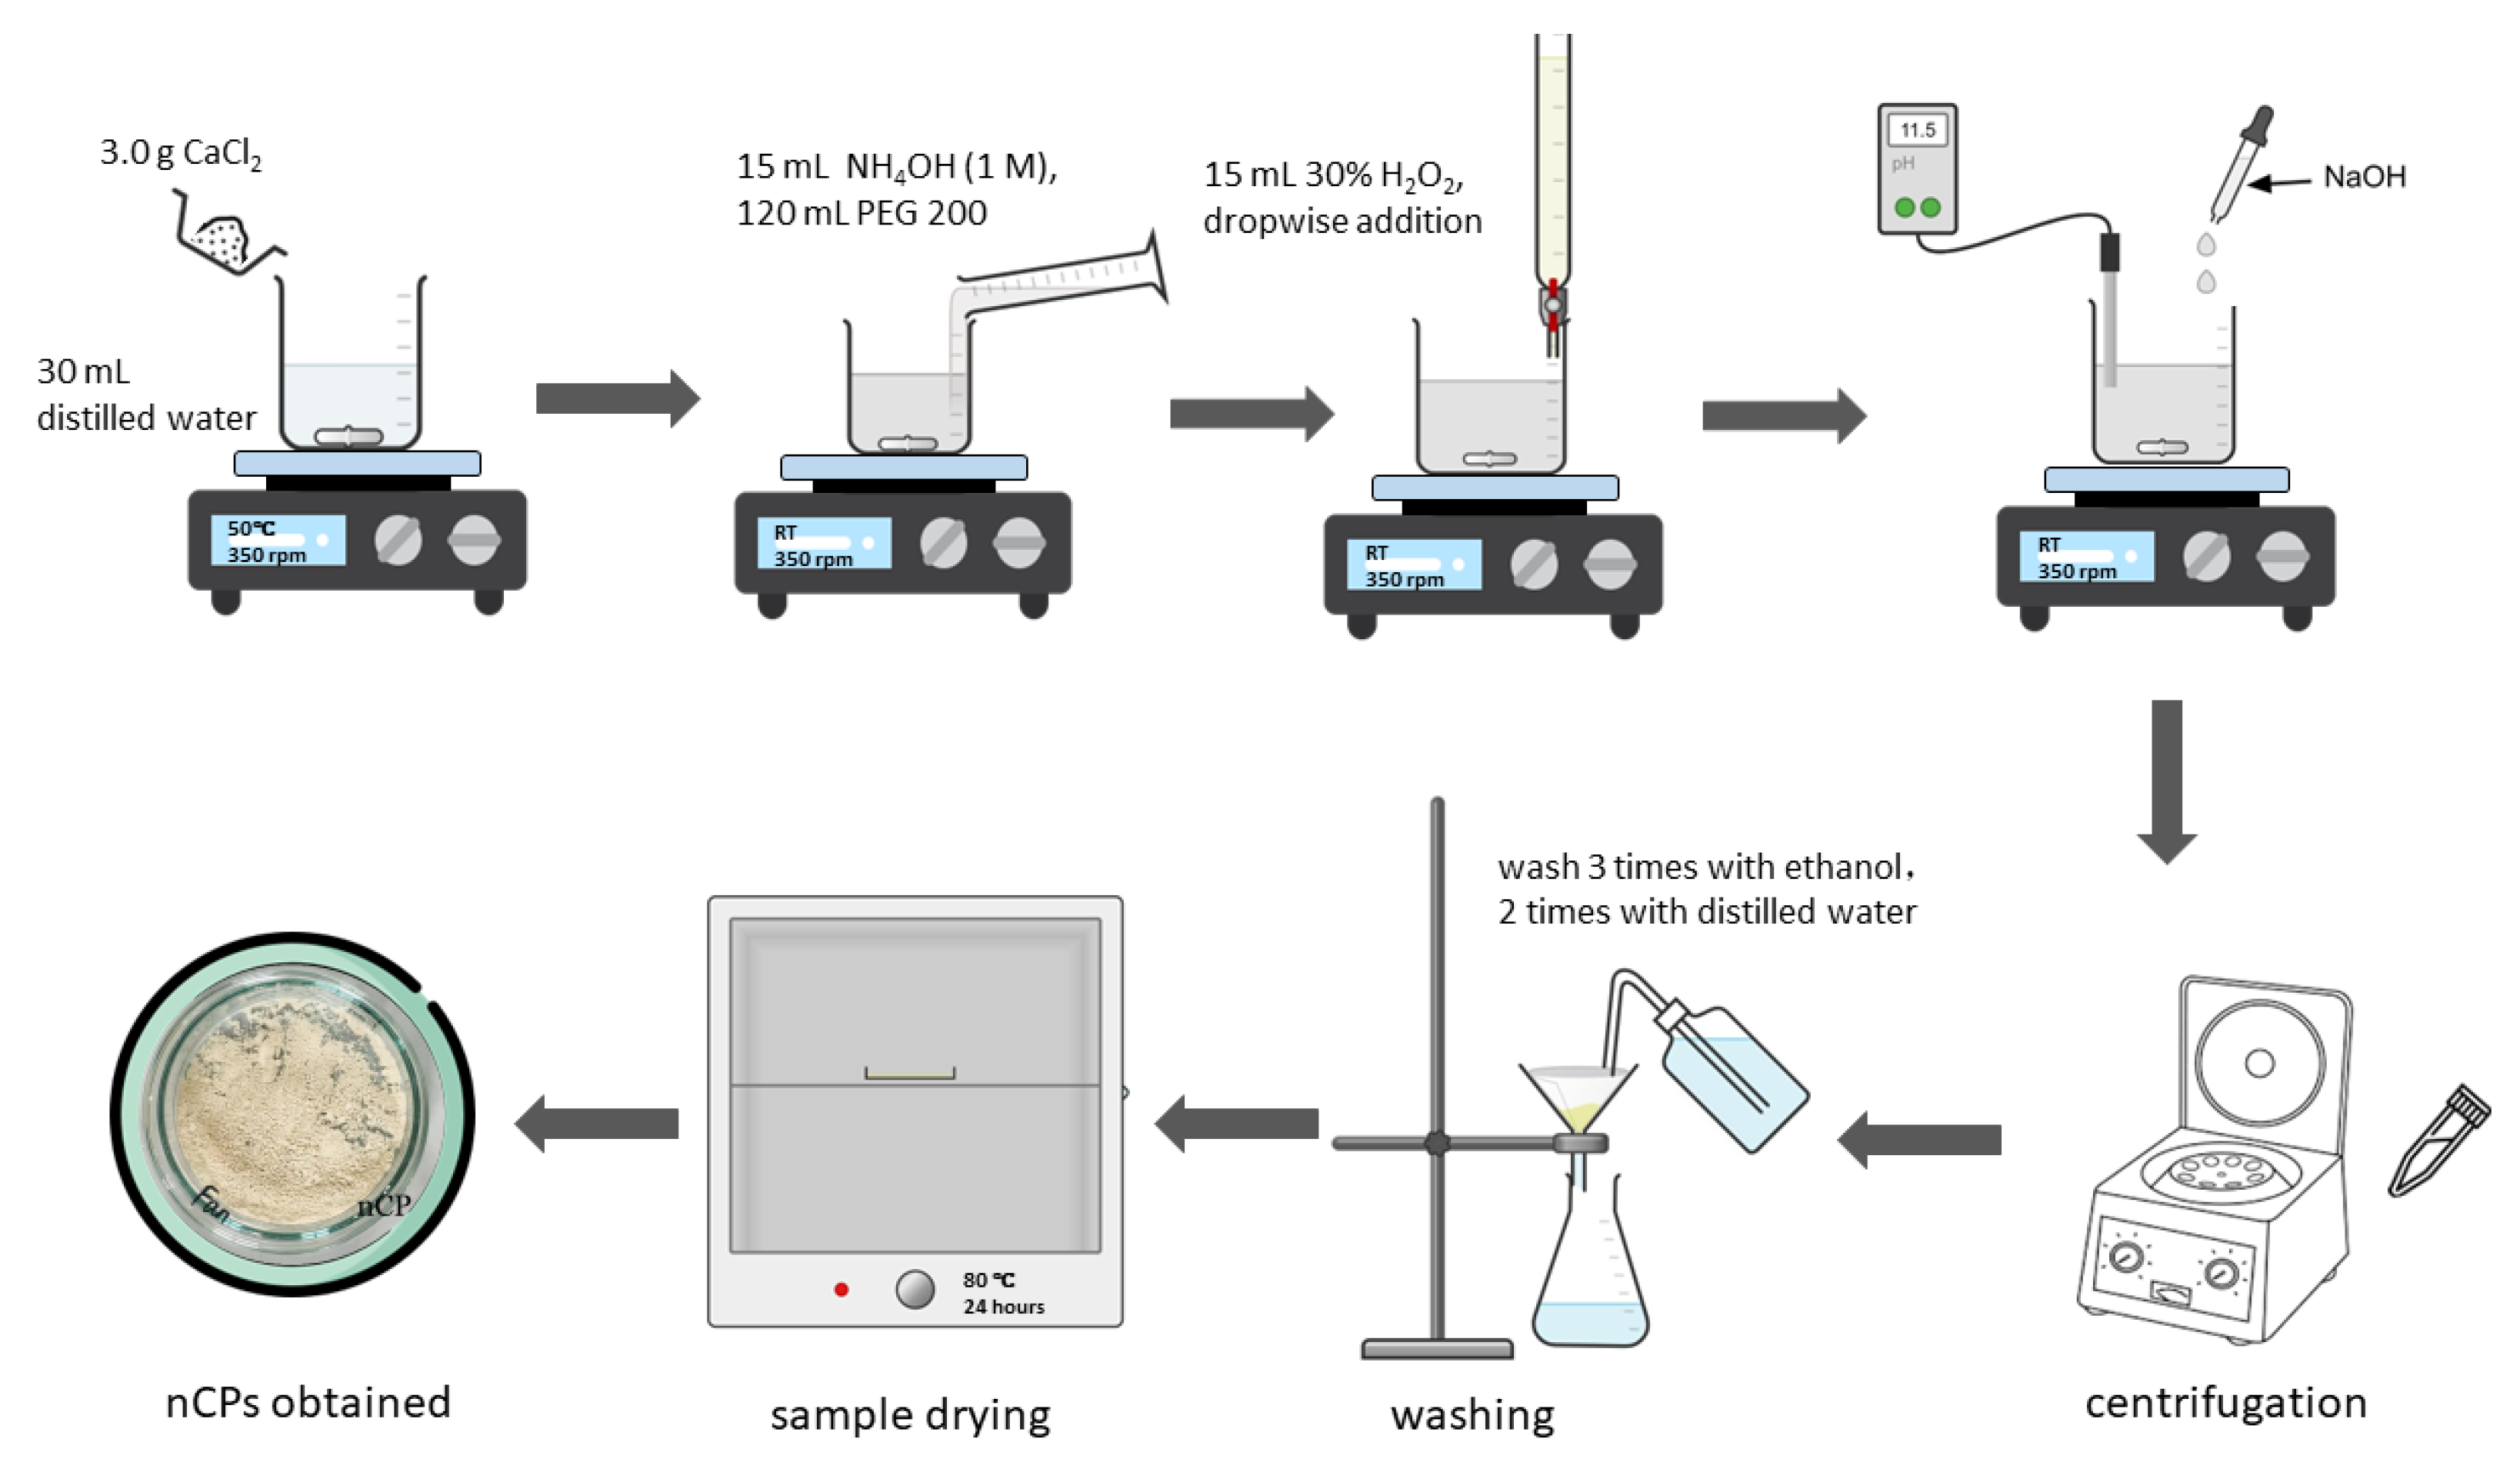
2.2. Synthesis of Calcium Peroxide Nanoparticles (nCPs)
2.3. Fenton-Based Reaction Experiment Procedure
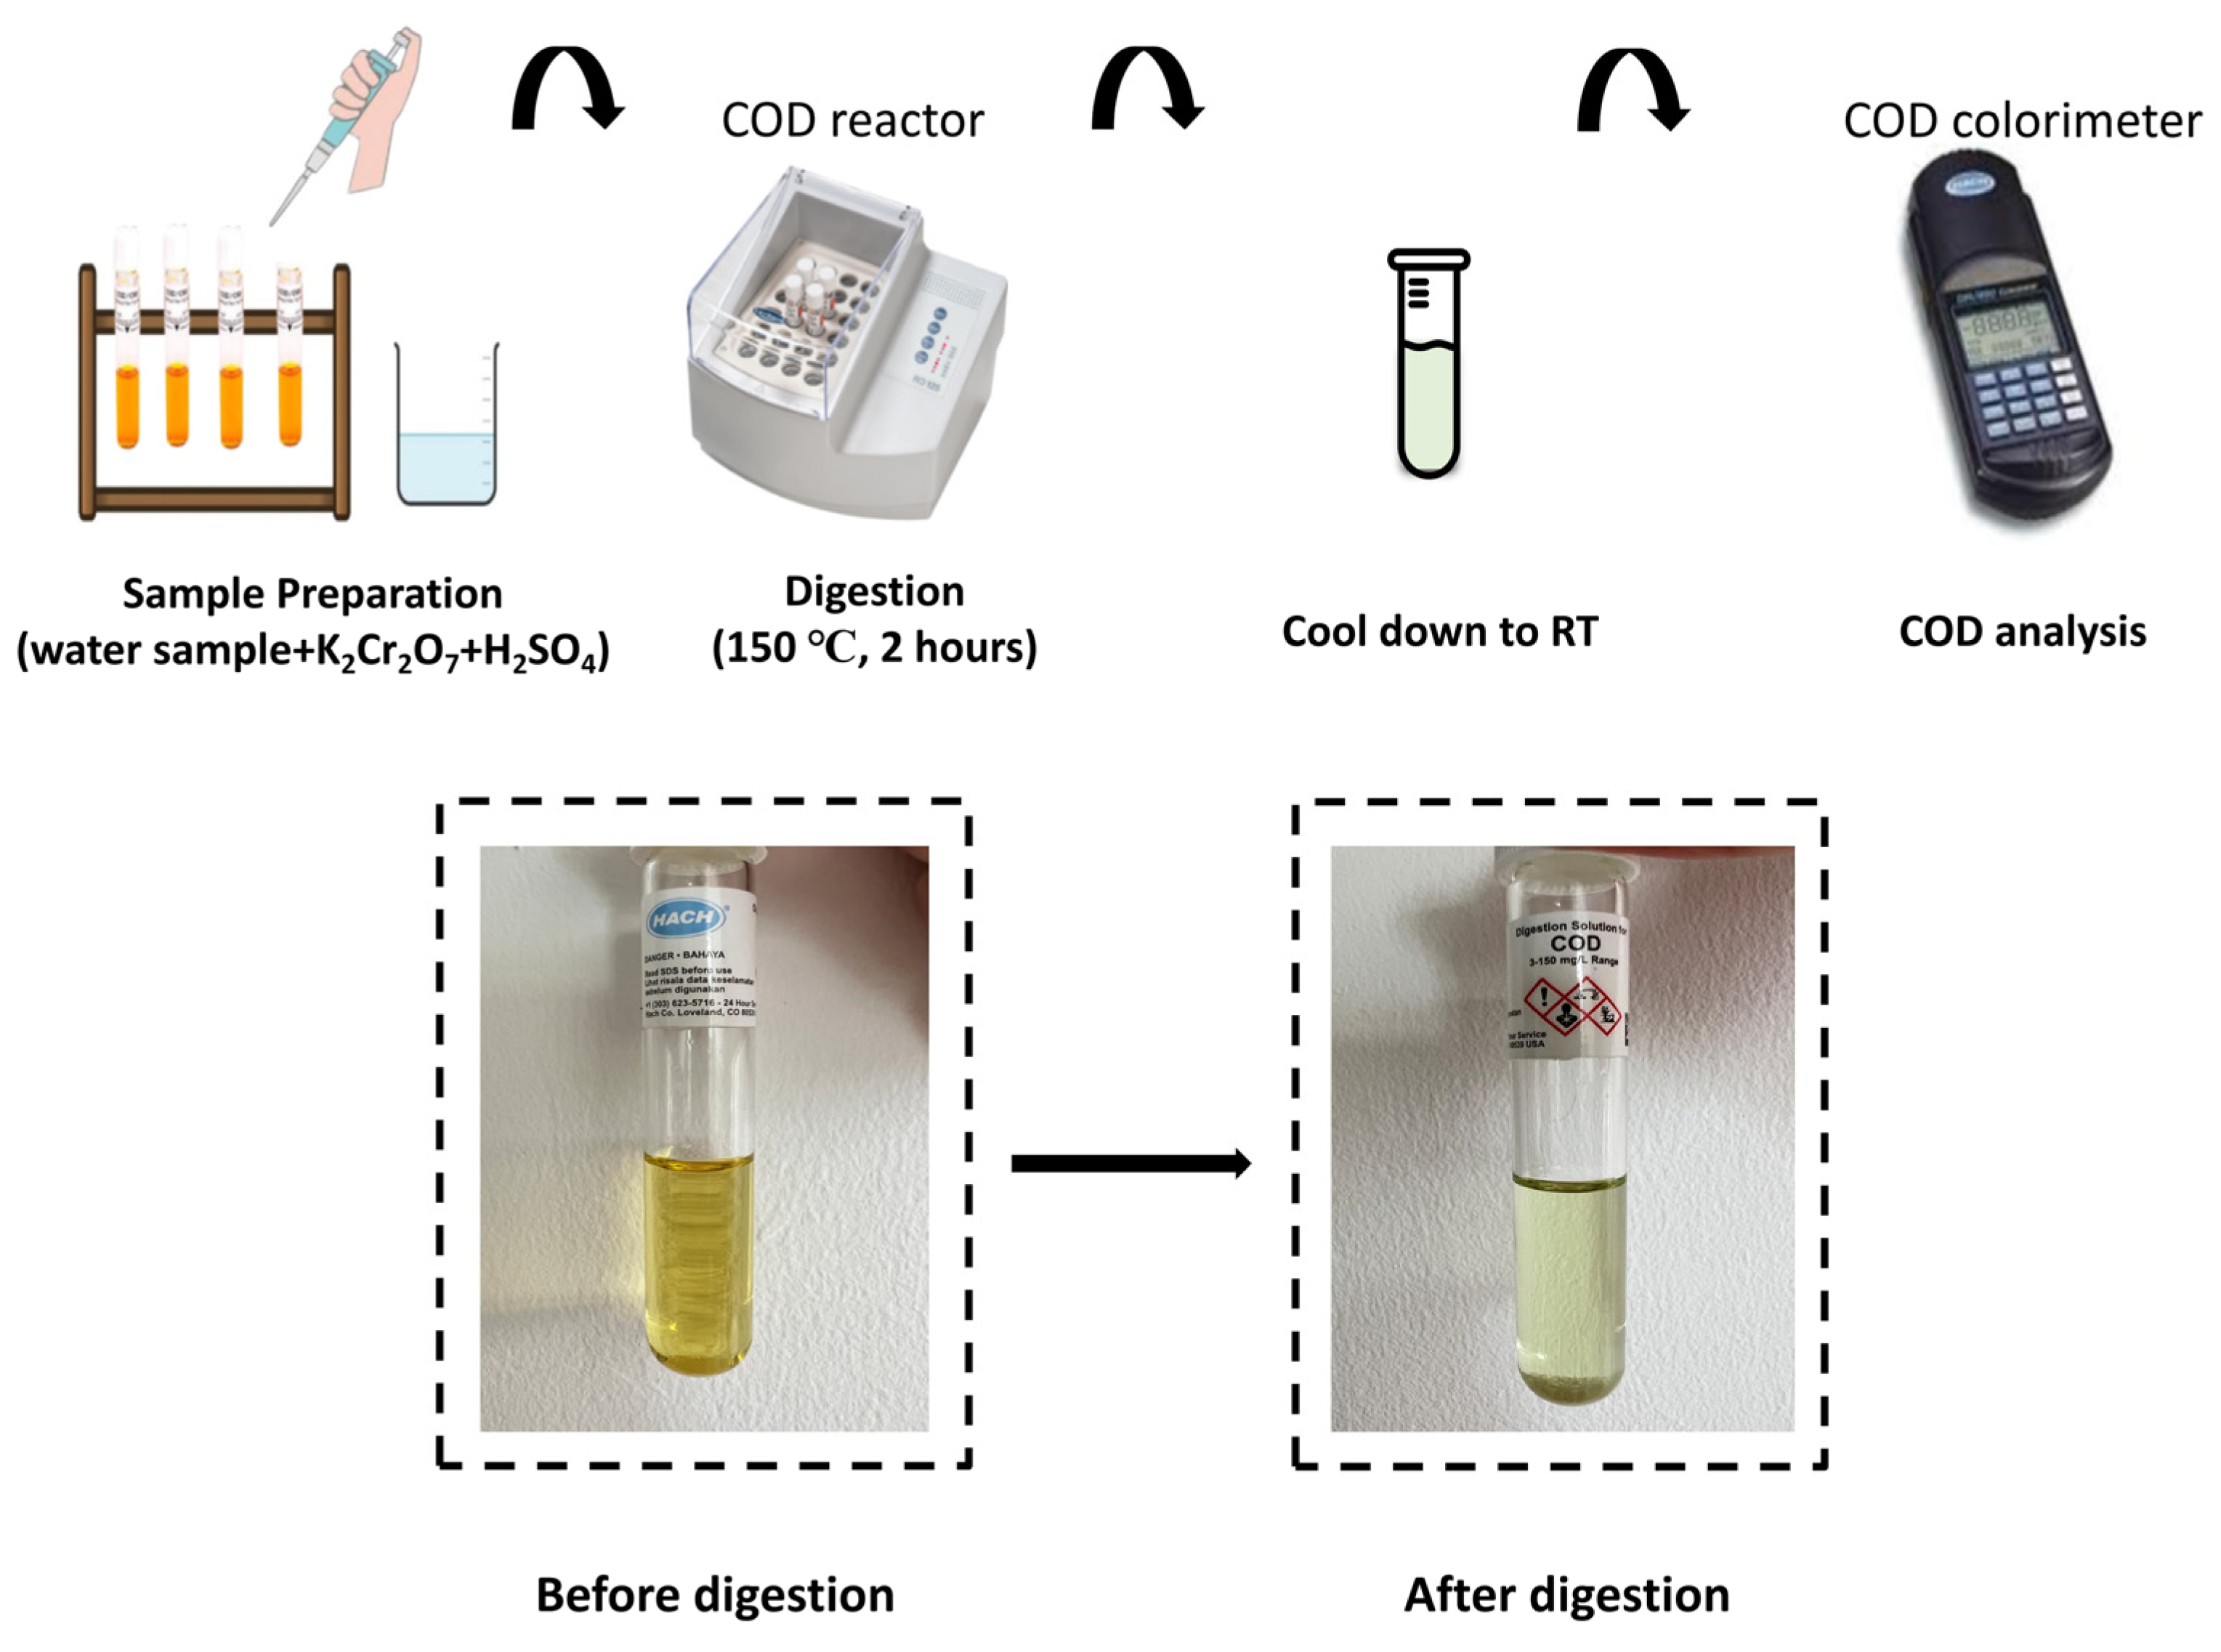
2.4. Analytical Method
2.5. Kinetic Study
3. Results
3.1. Characterization
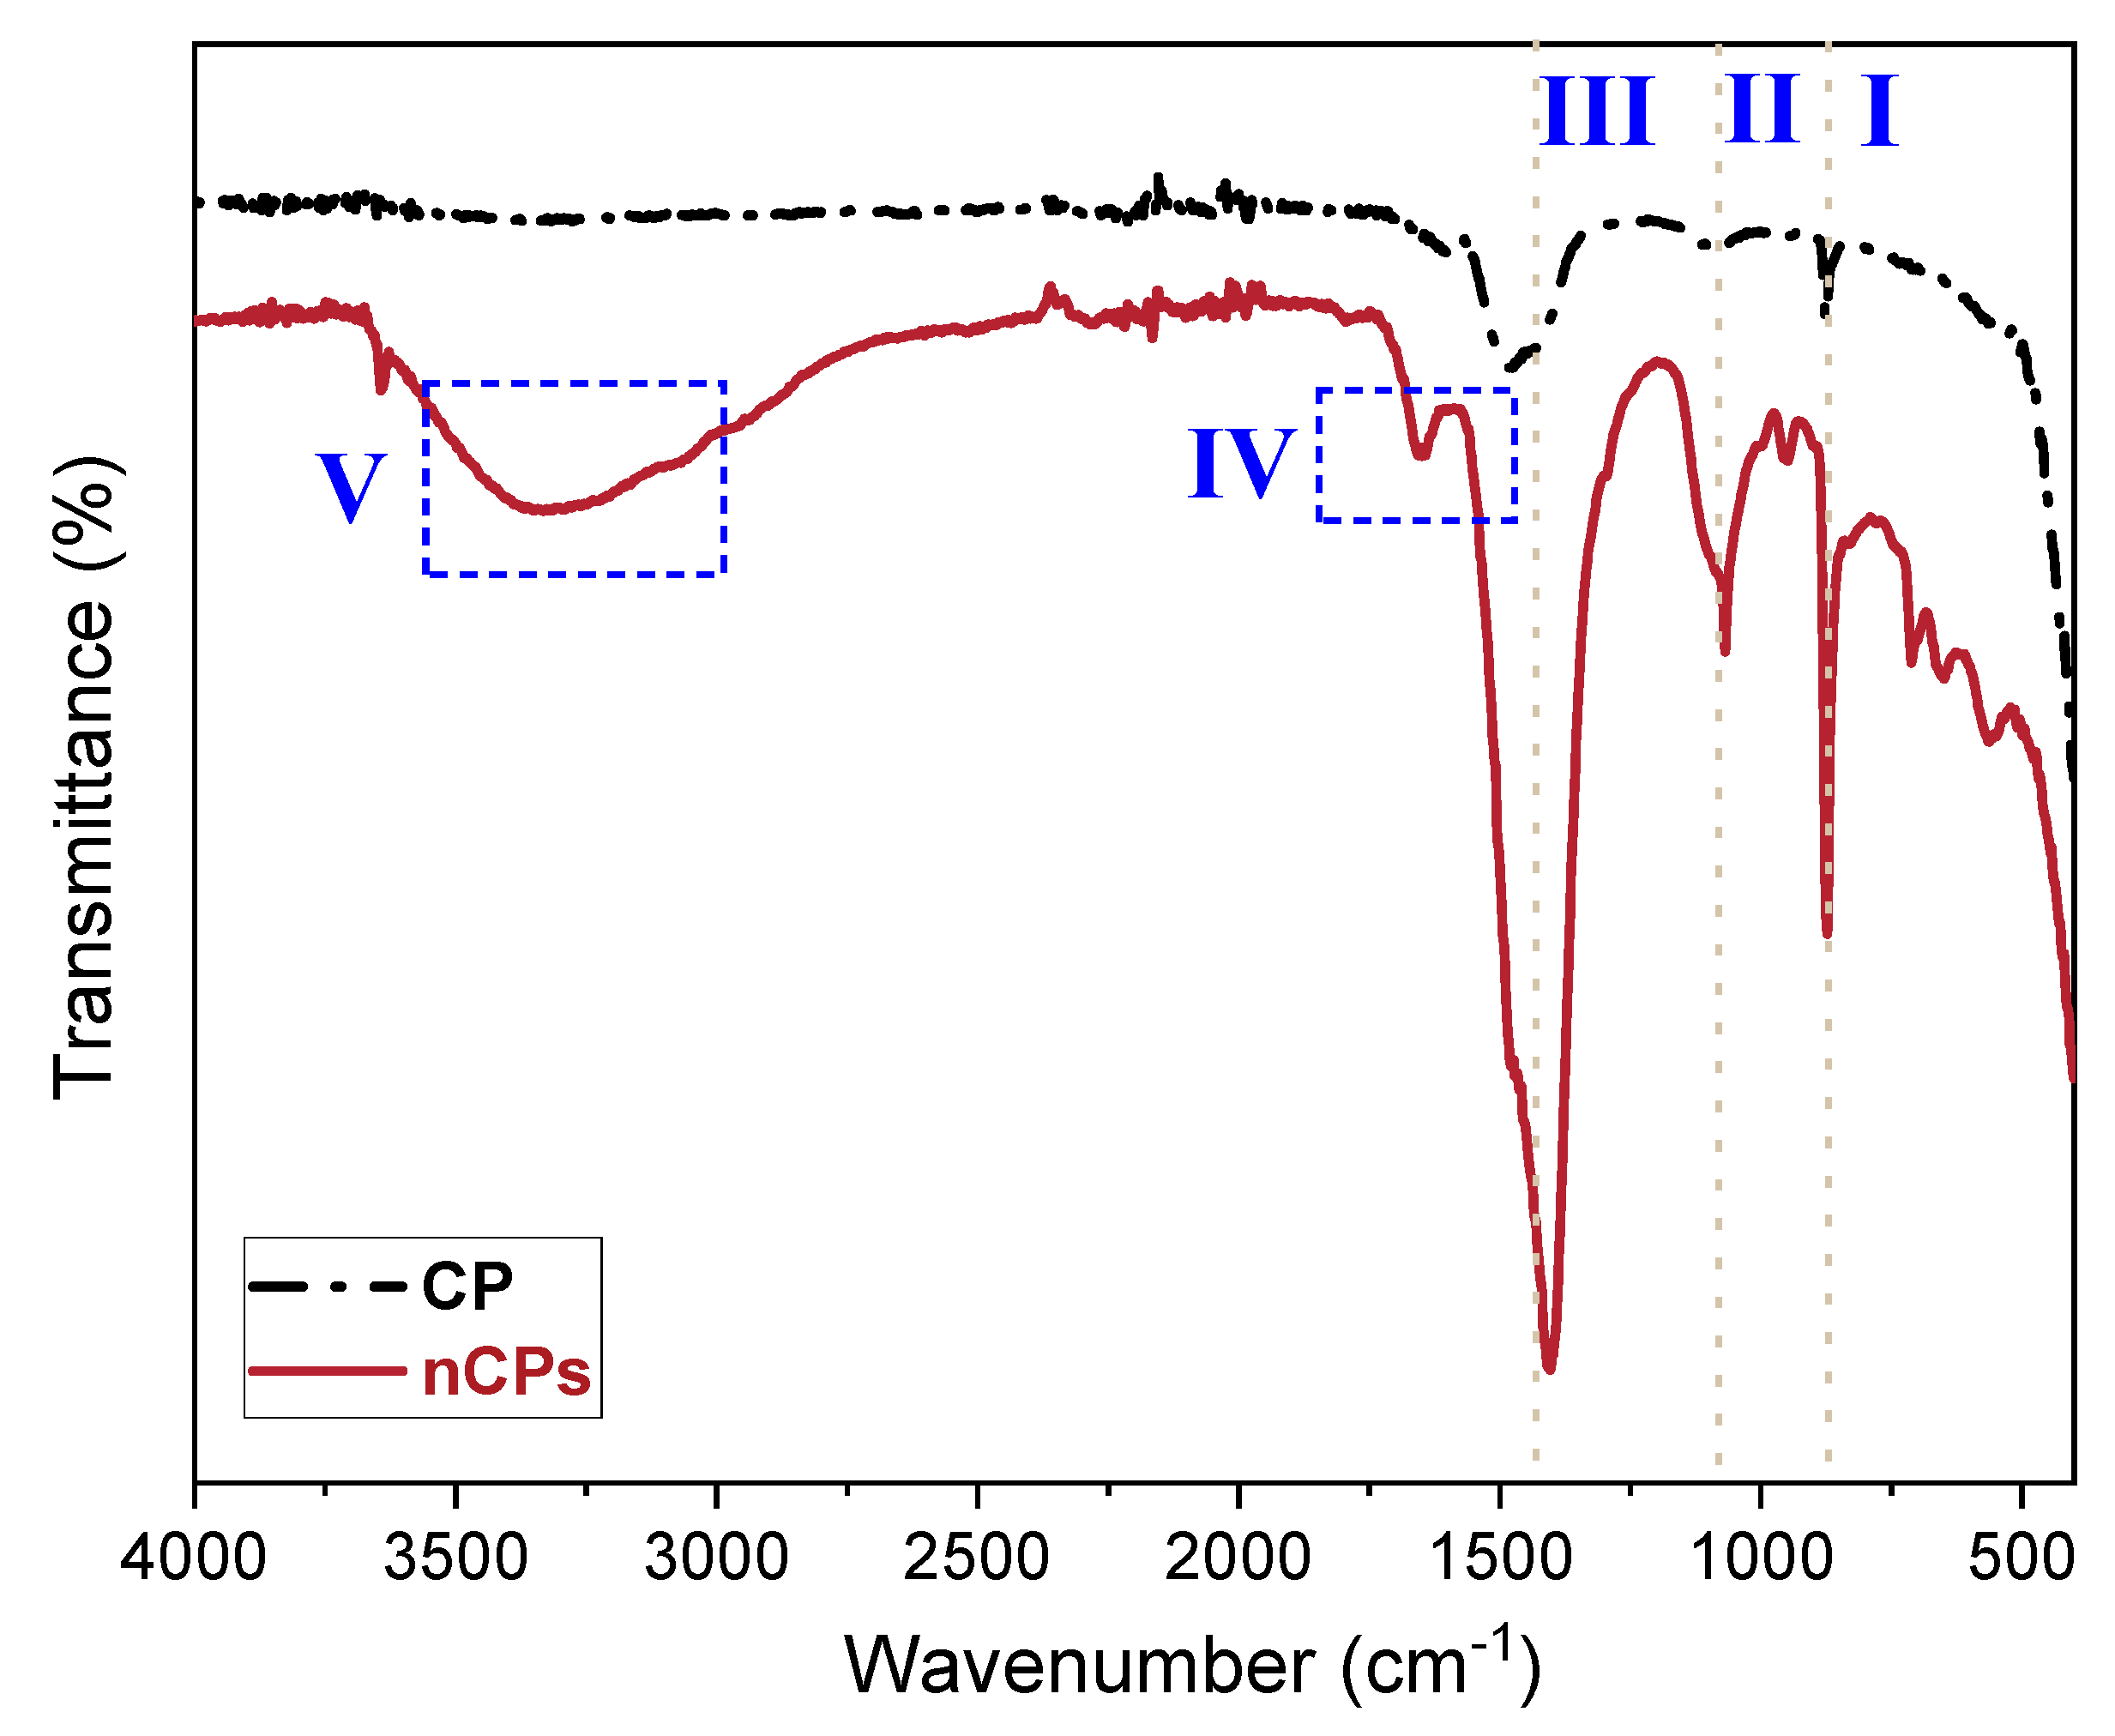
3.1.1. FTIR Spectra of CP and nCPs
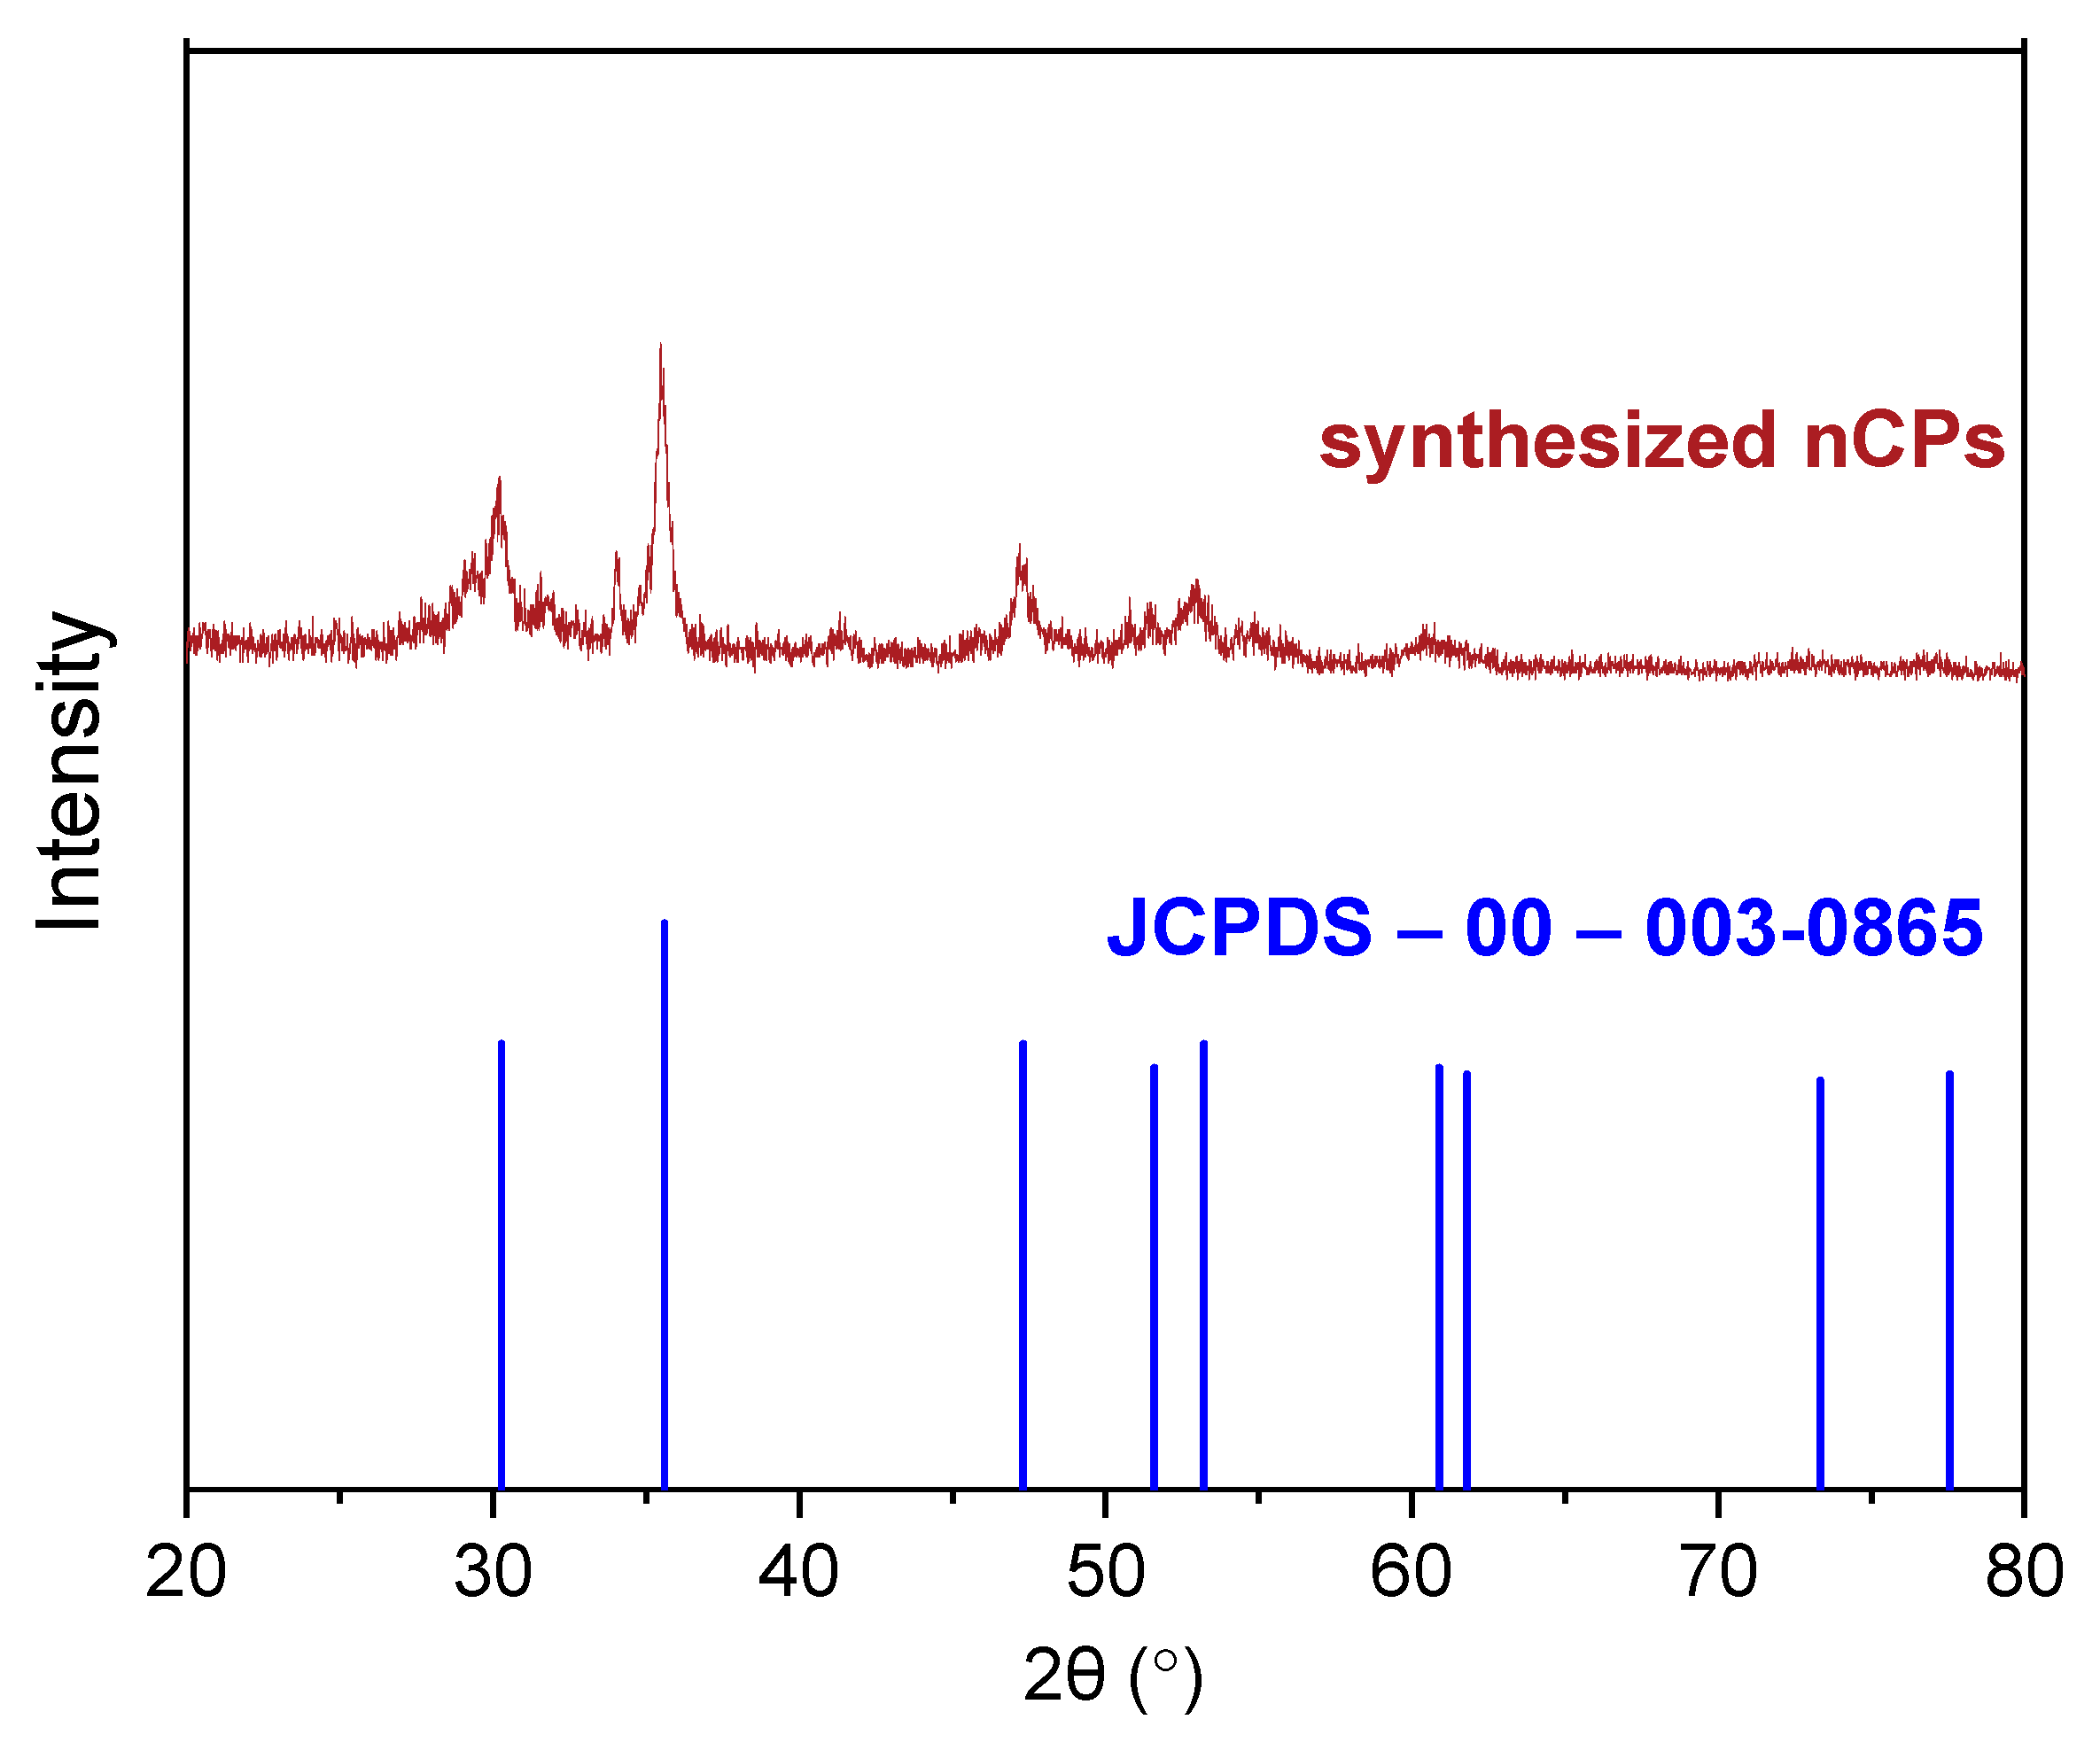
3.1.2. XRD Patterns of CP and nCPs
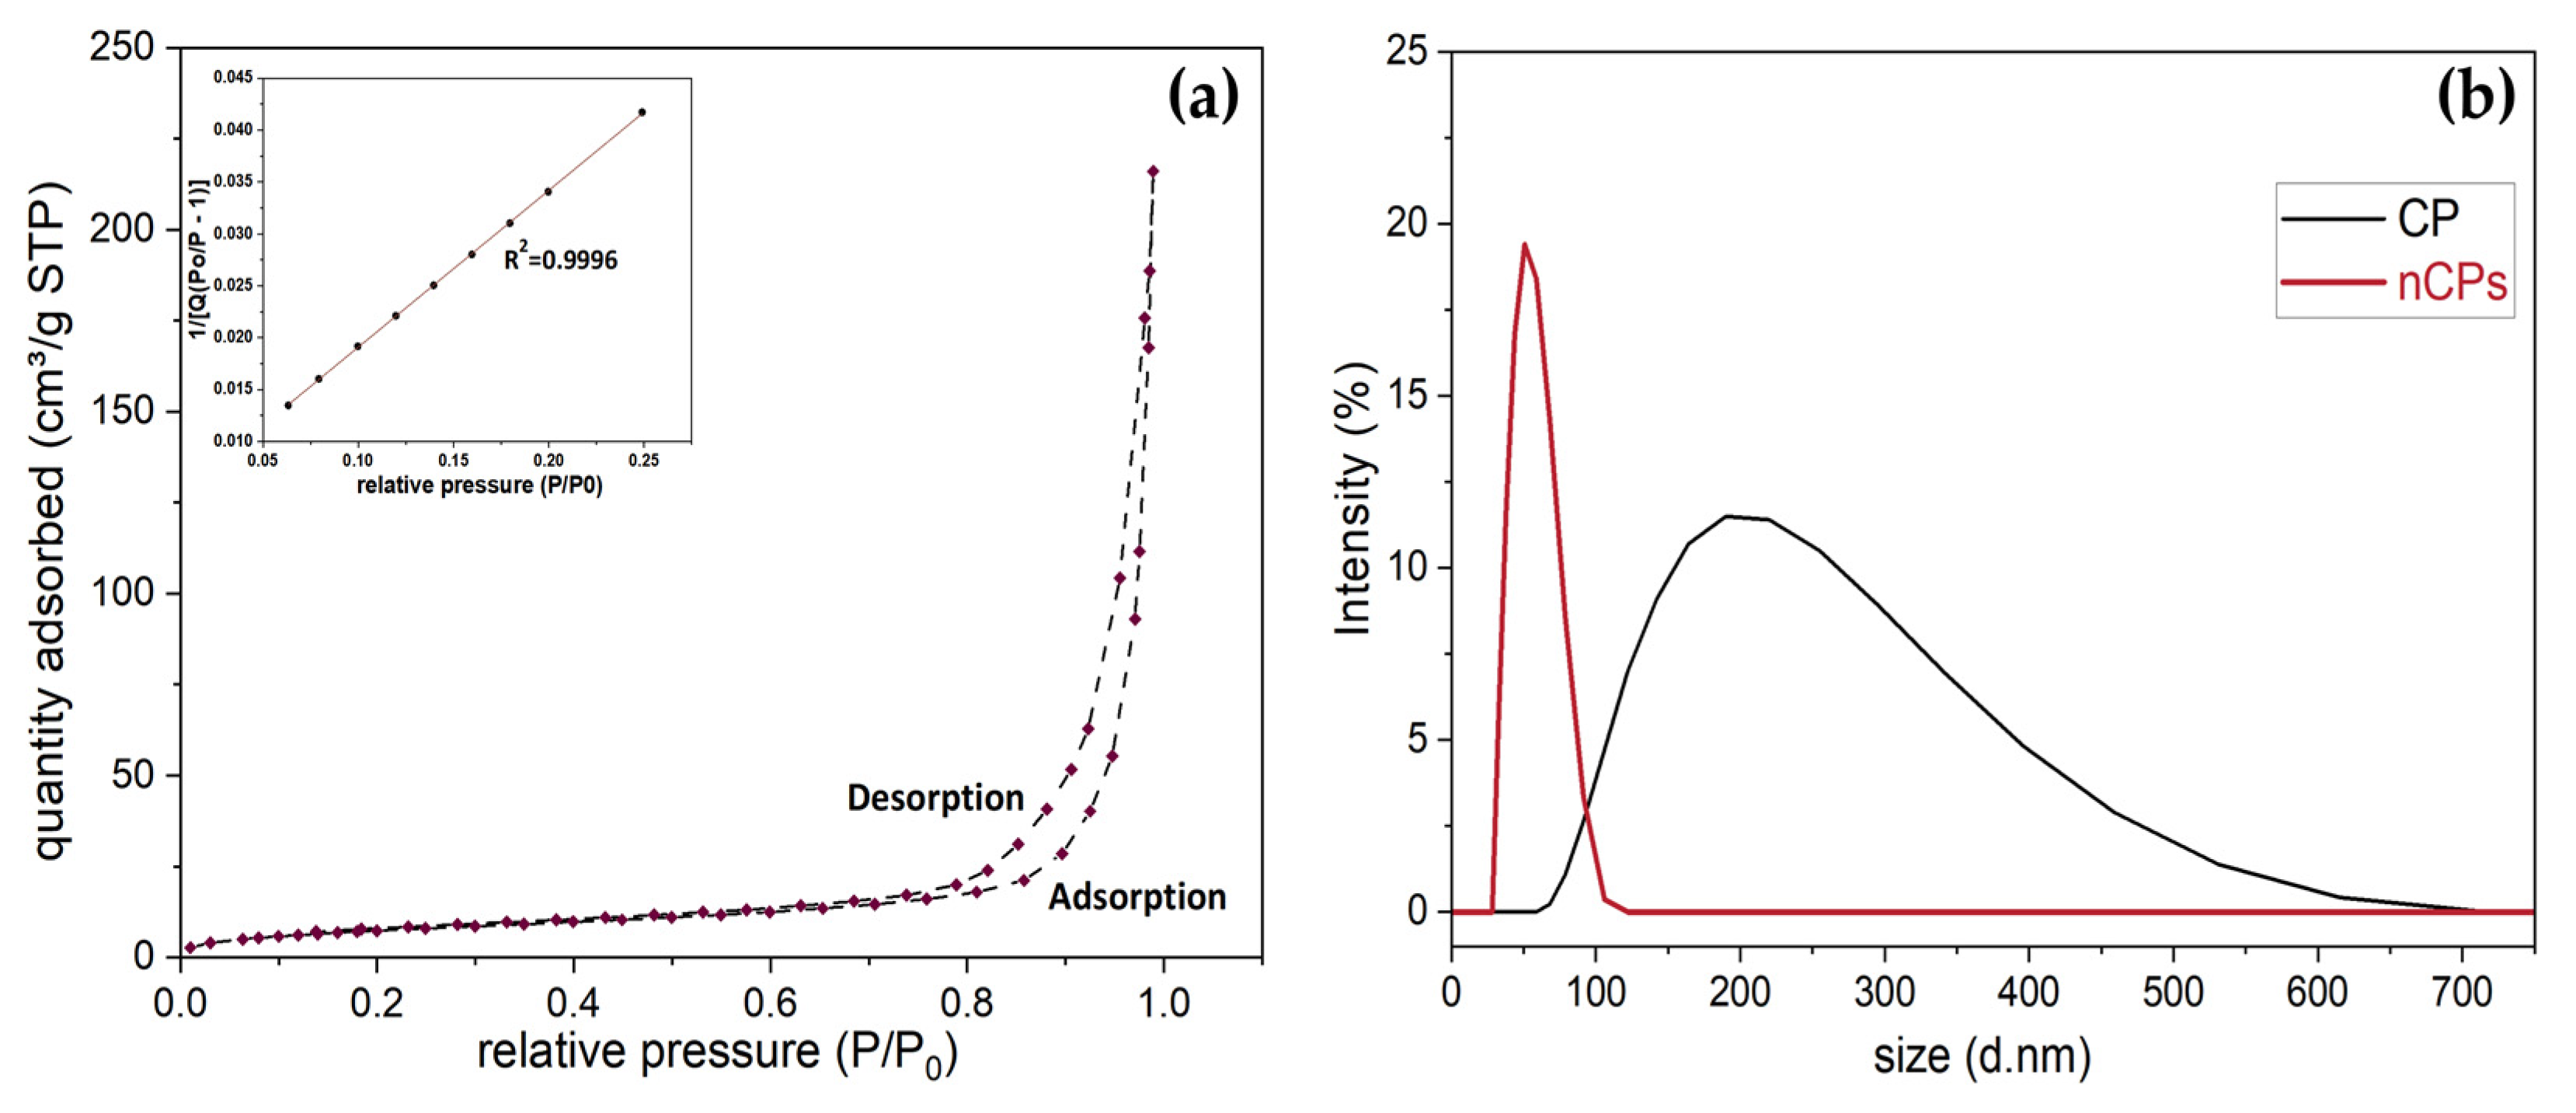
3.1.3. Physicochemical Properties of CP and nCPs
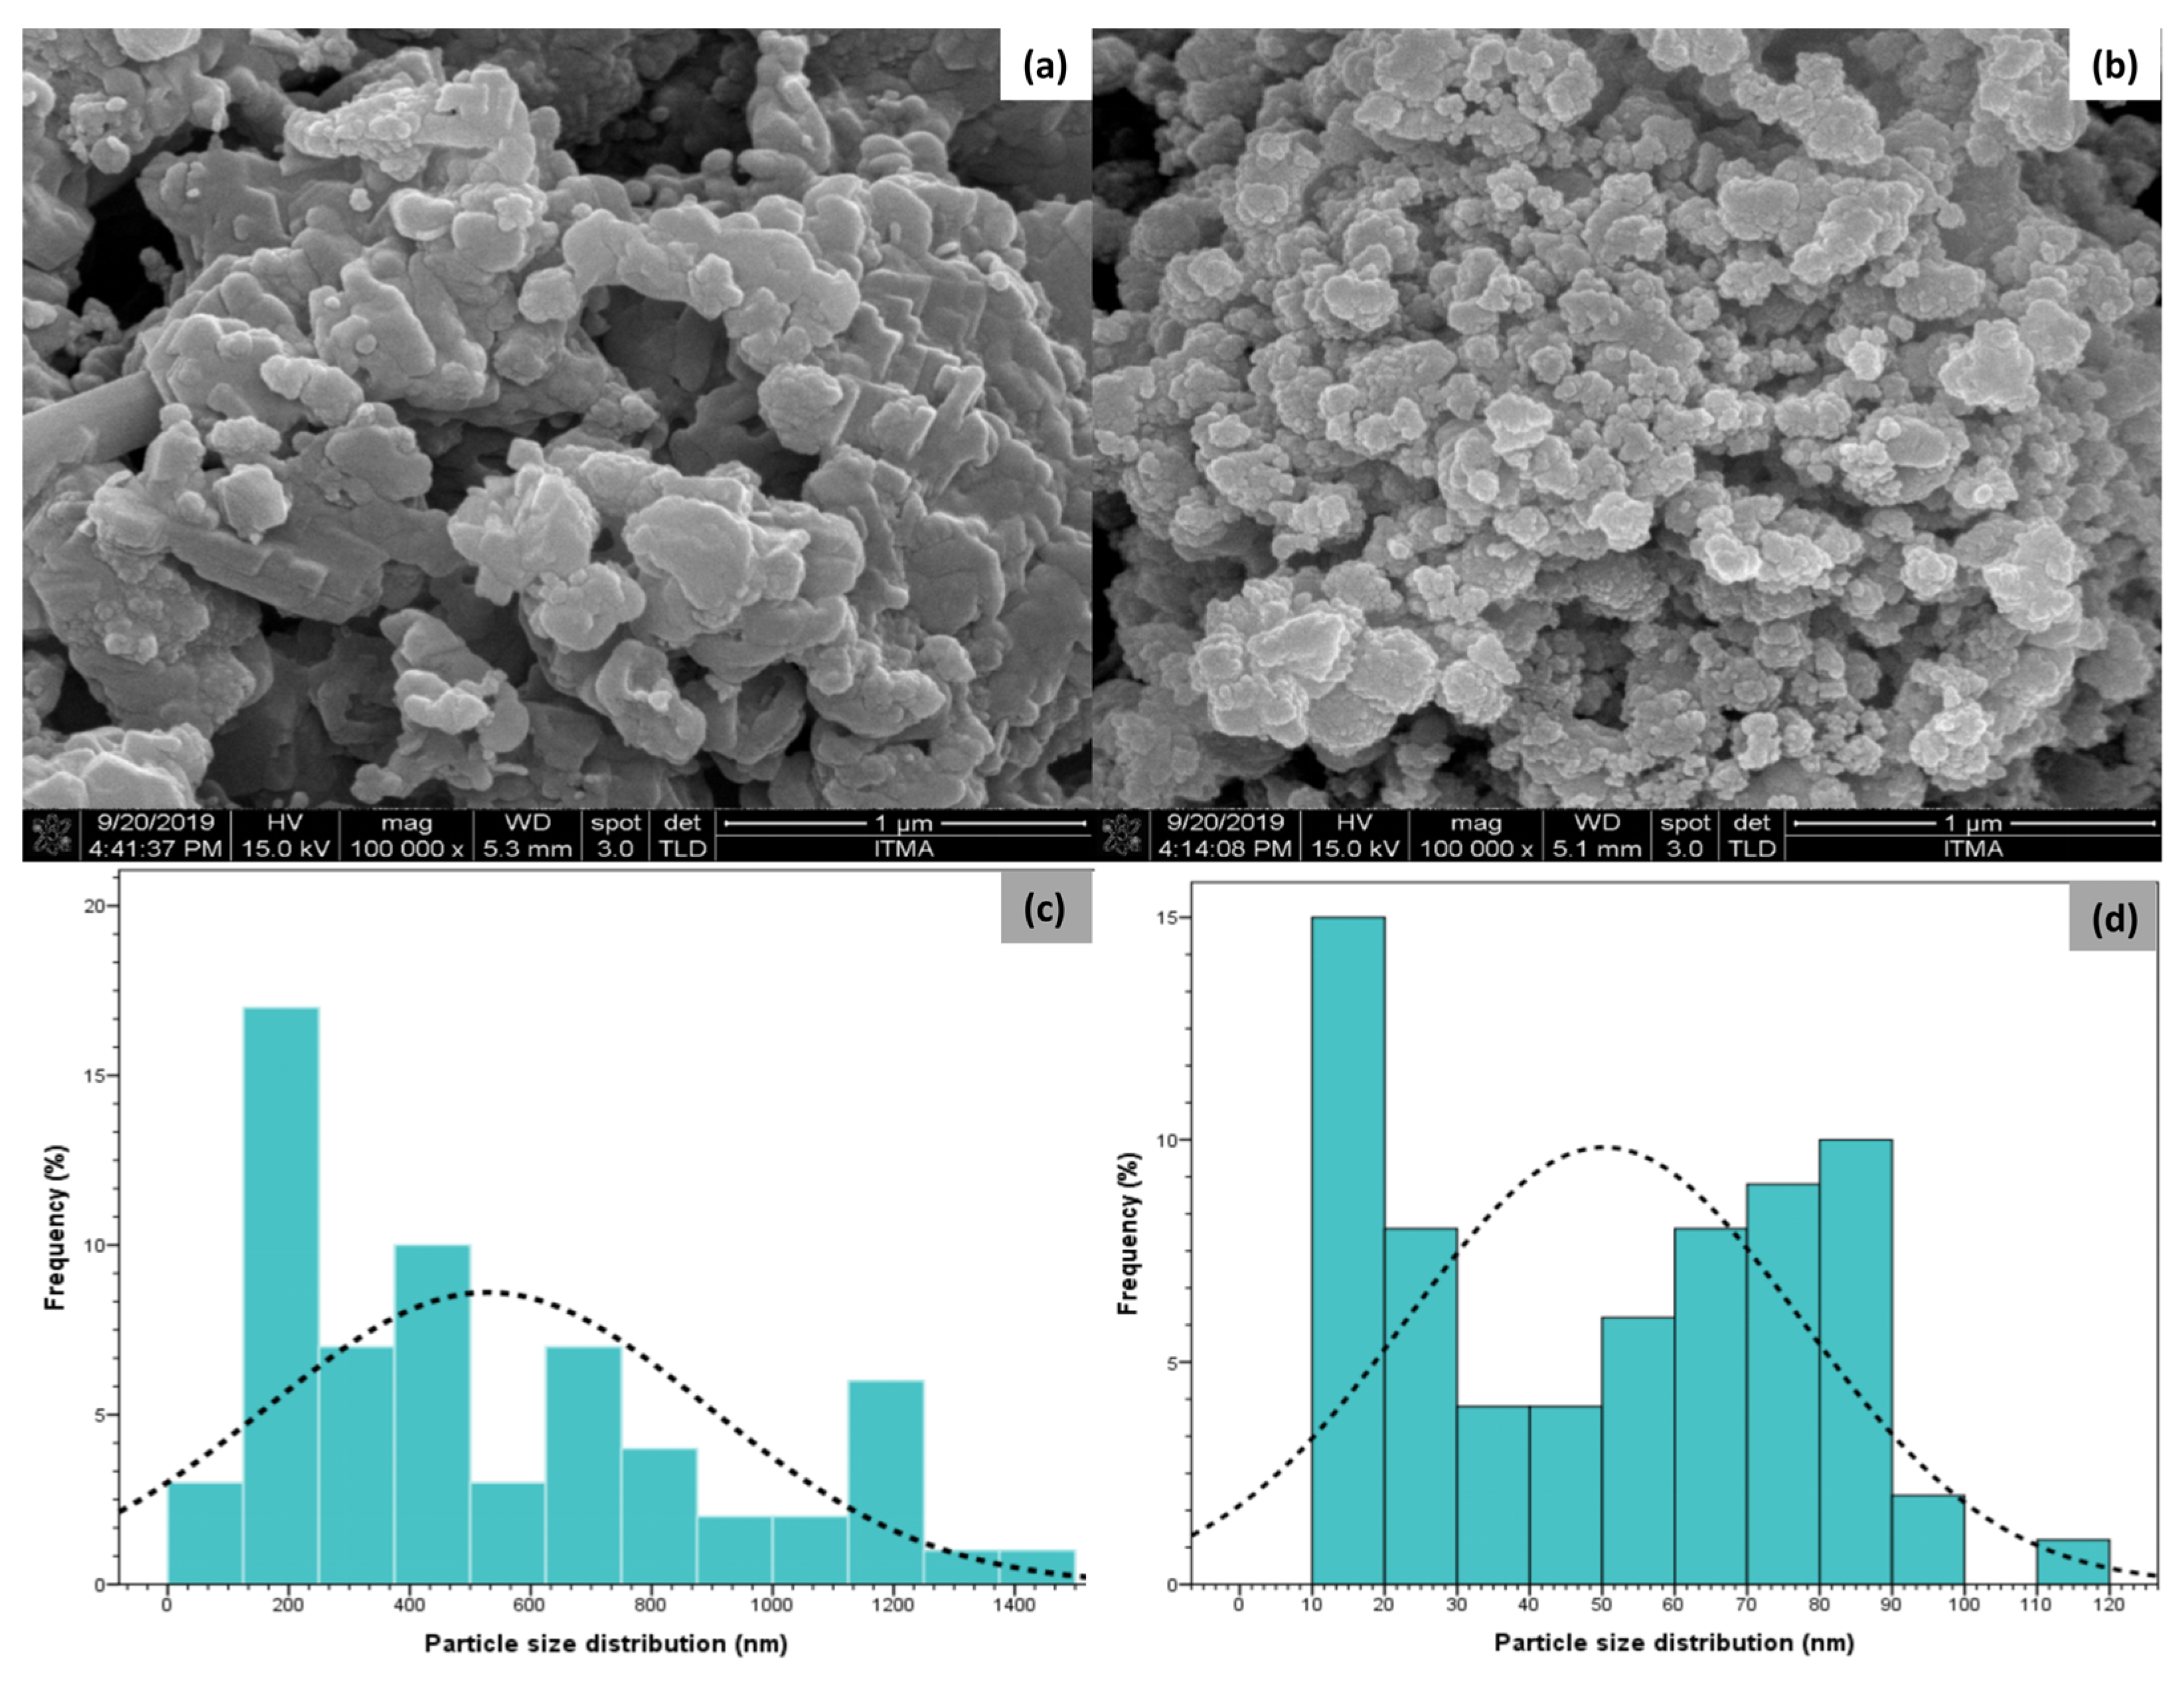
3.1.4. FESEM Results of CP and nCPs
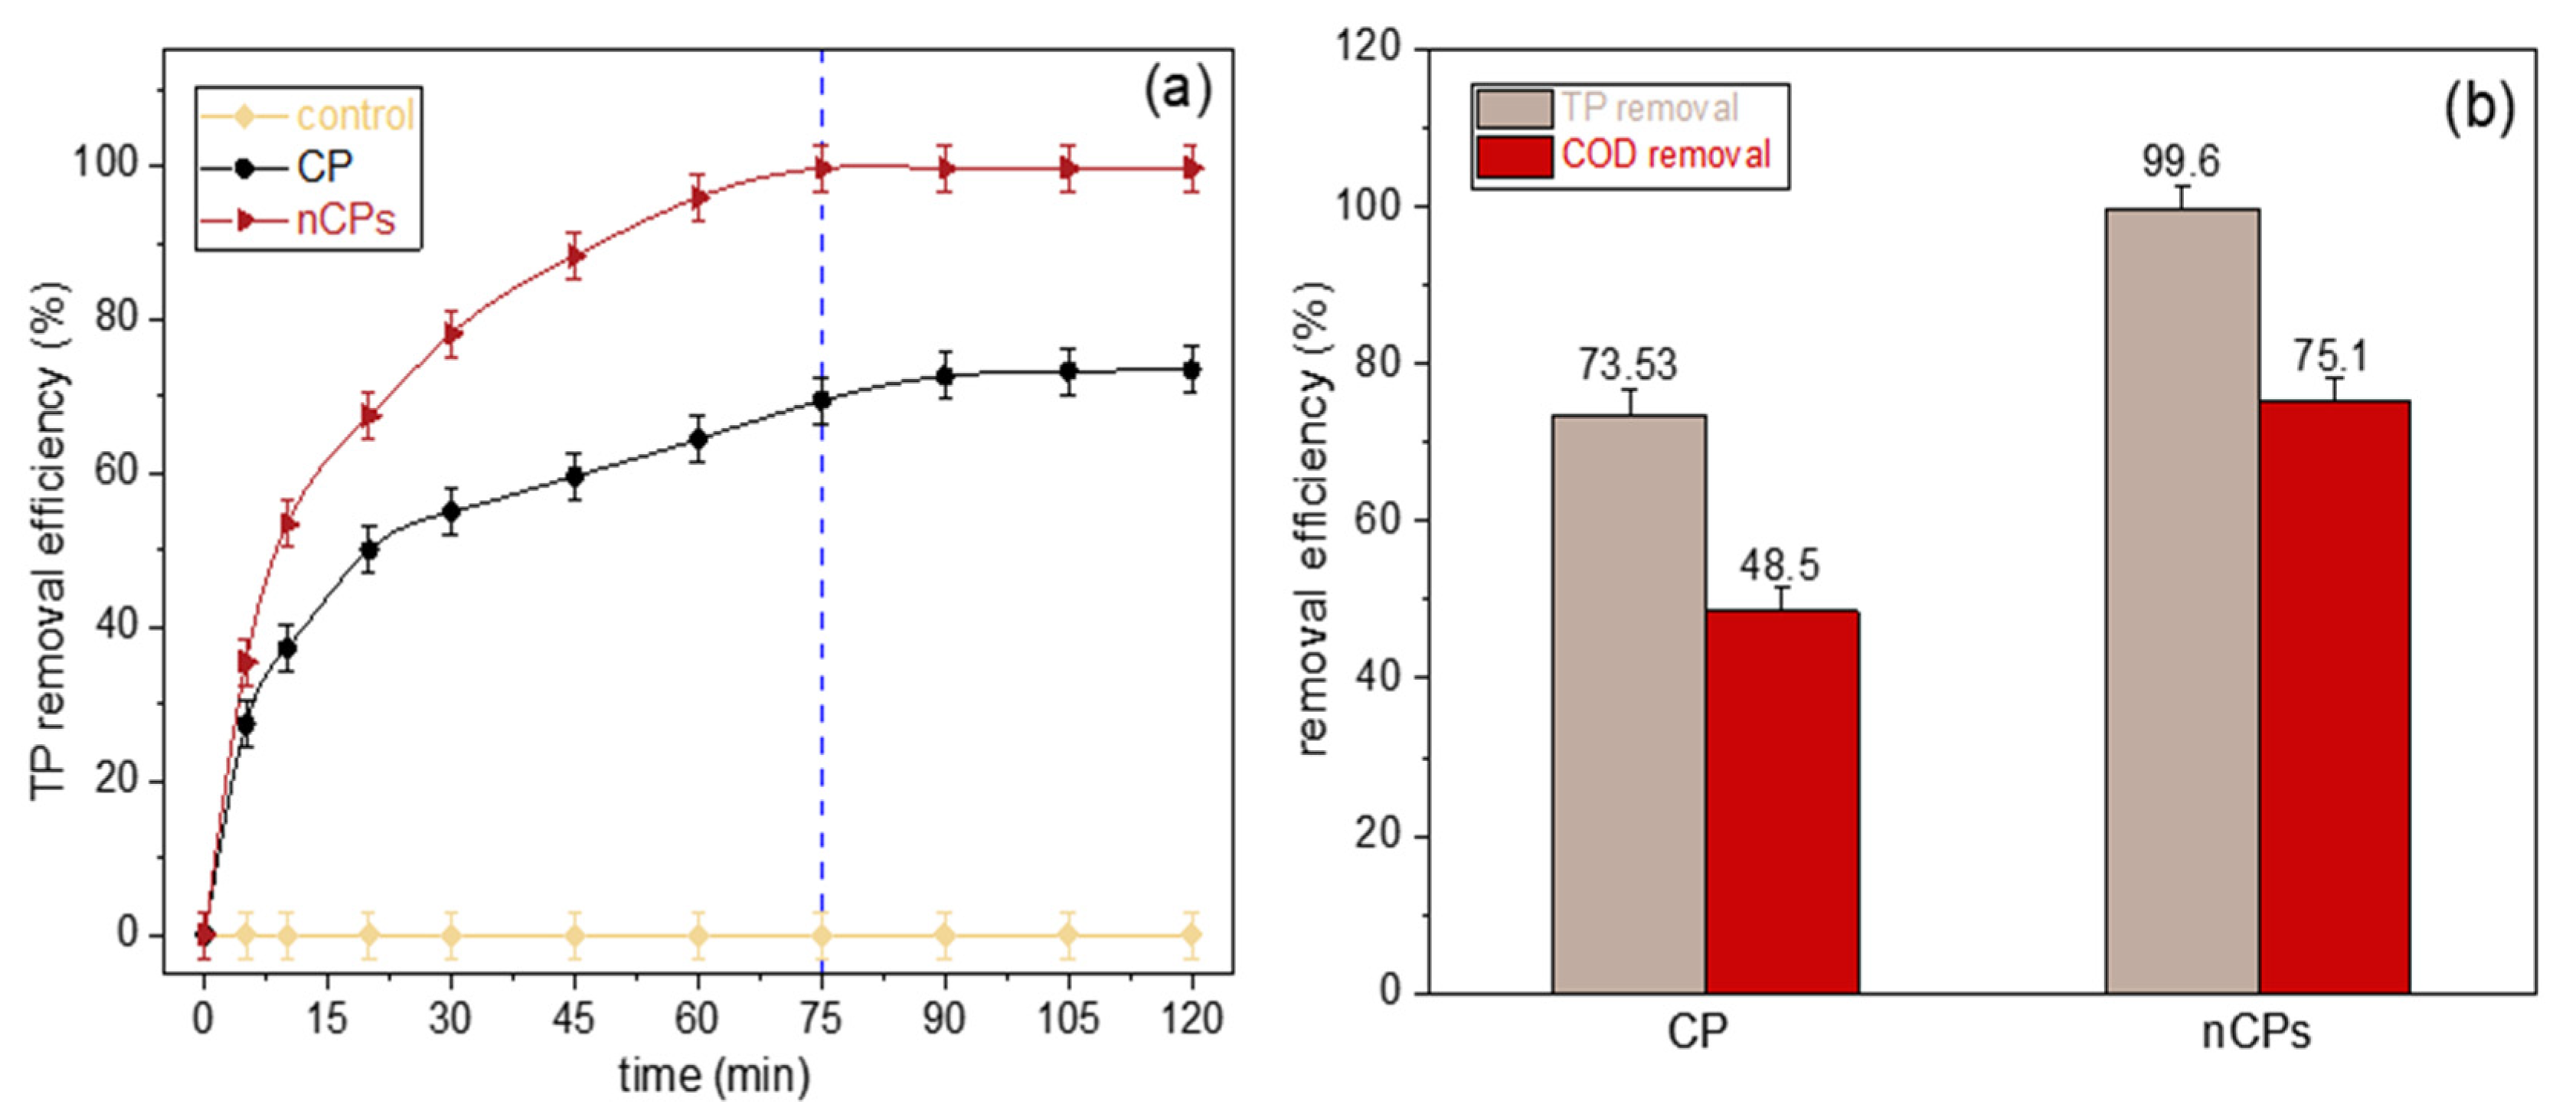
3.2. Glyphosate Removal Process Using Fenton-Based System
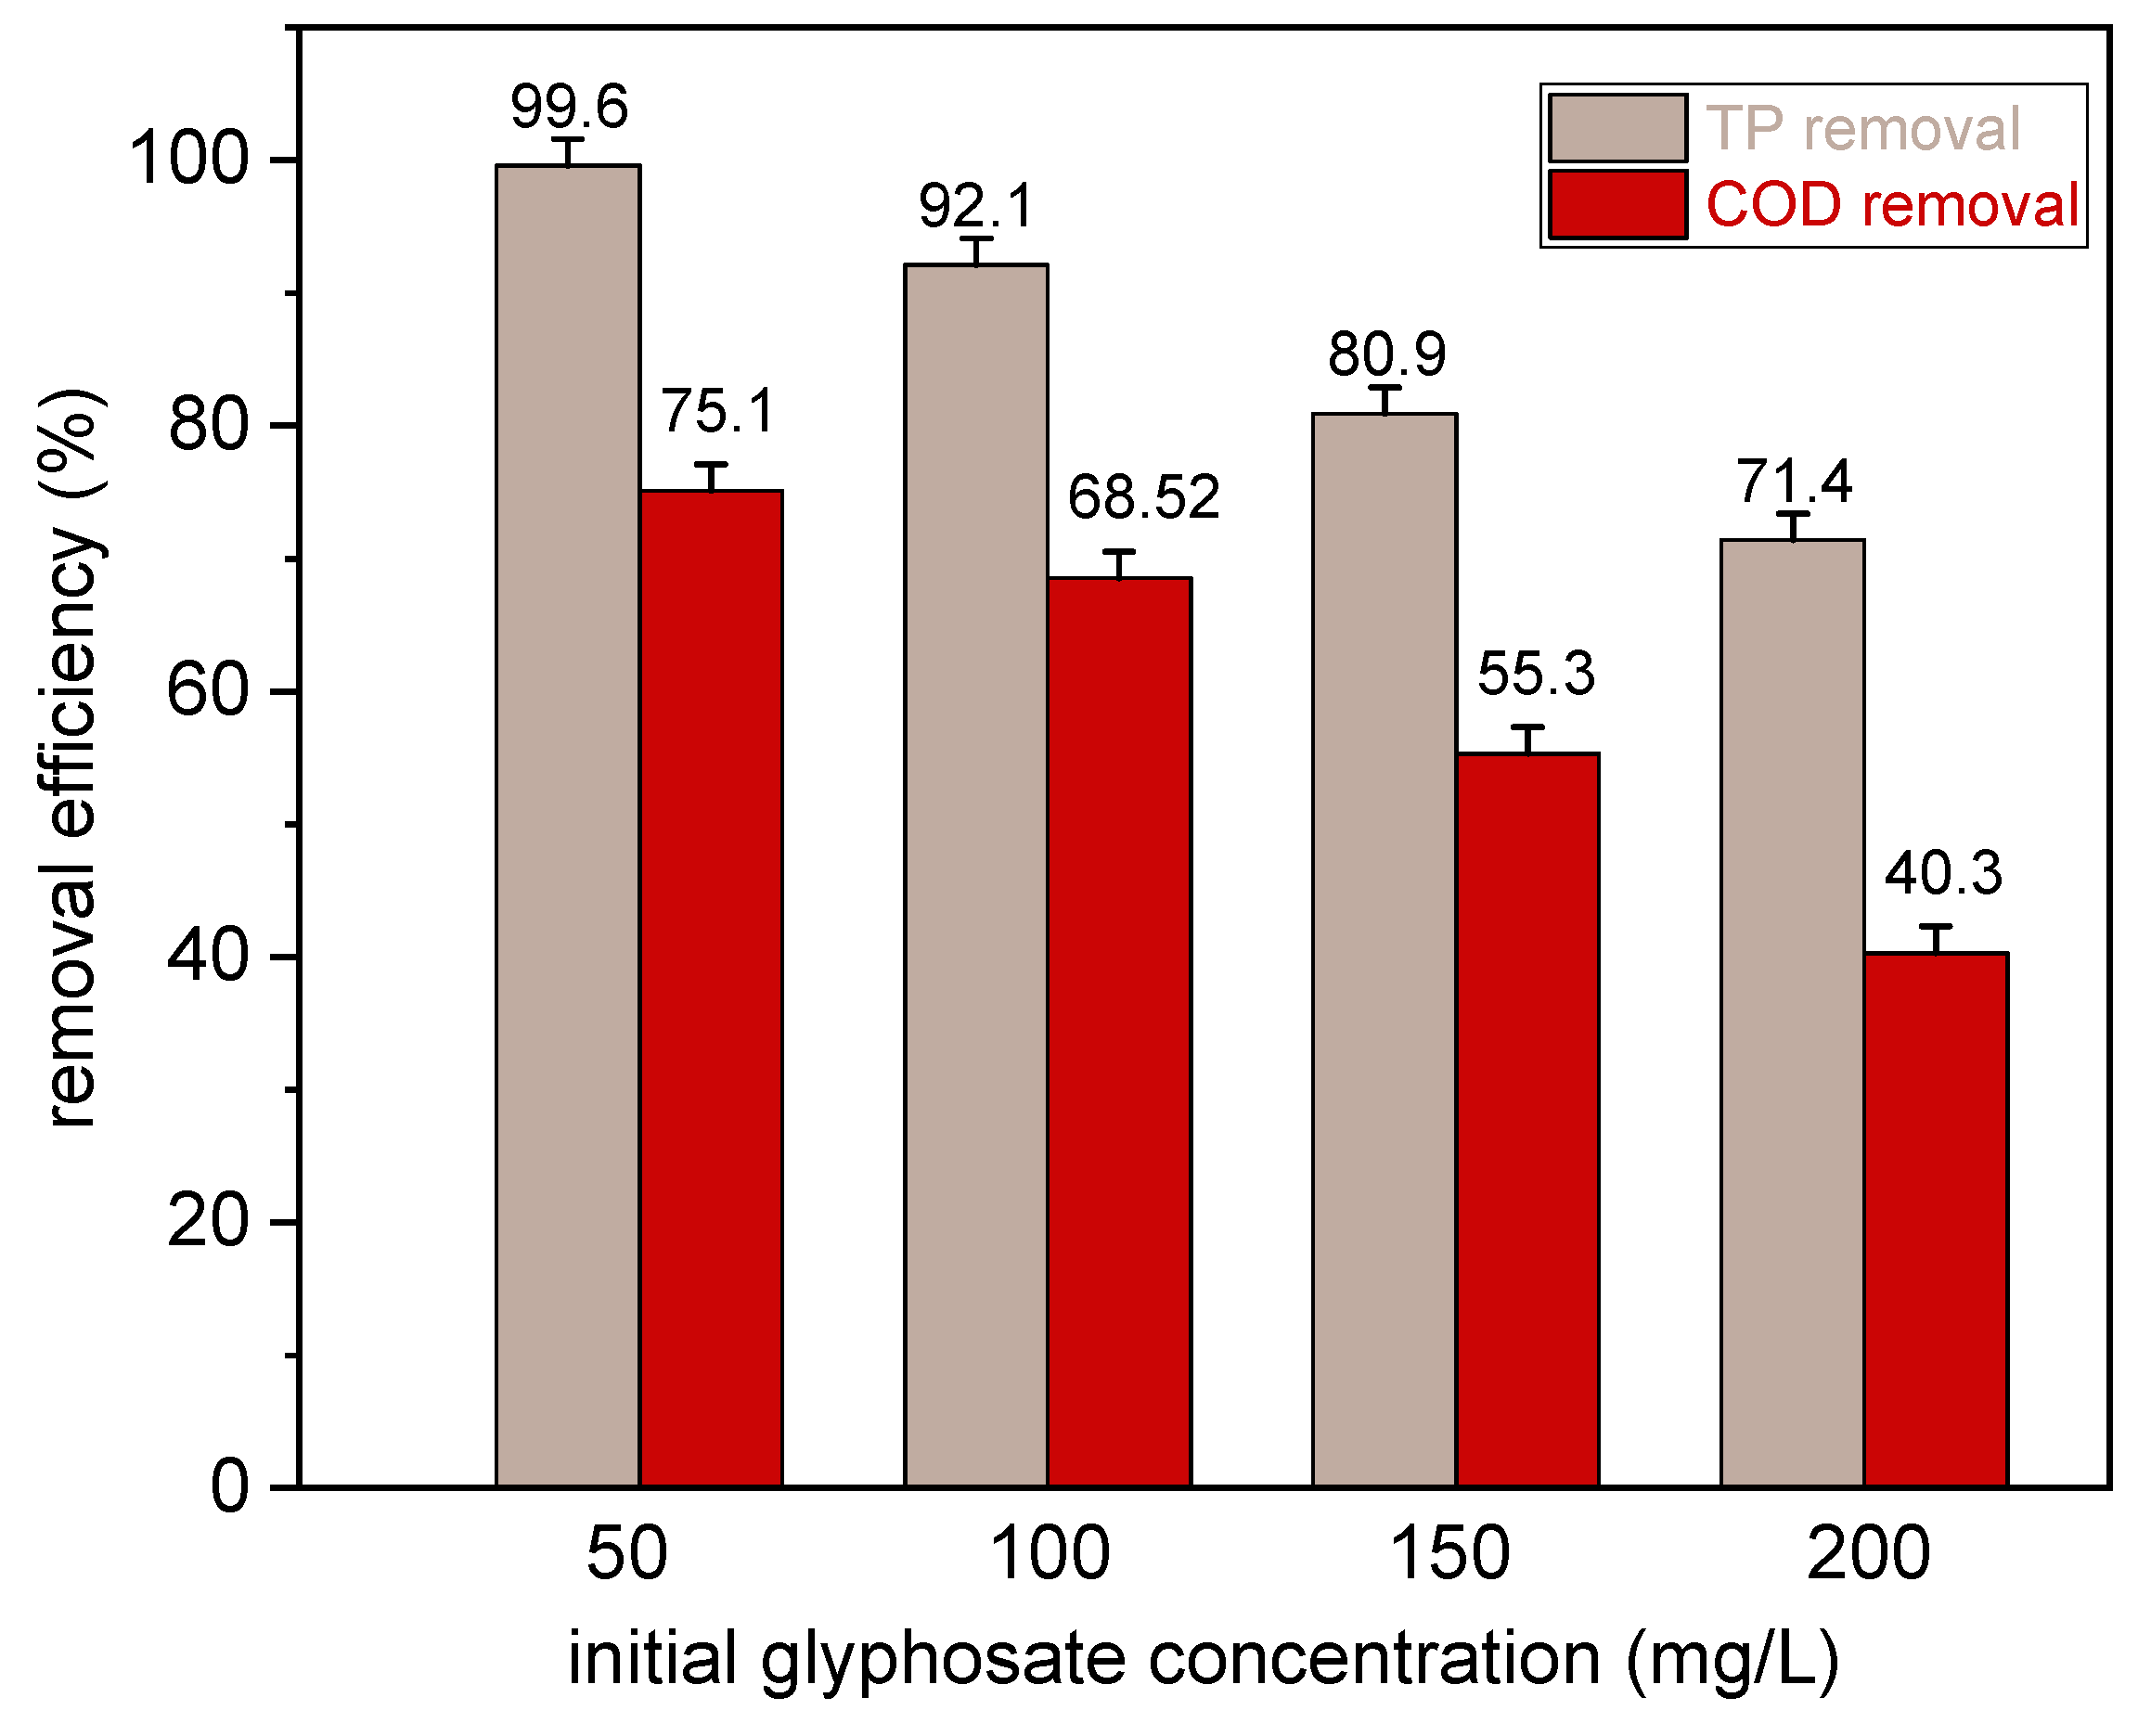
3.3. Effect of Initial Glyphosate Concentration
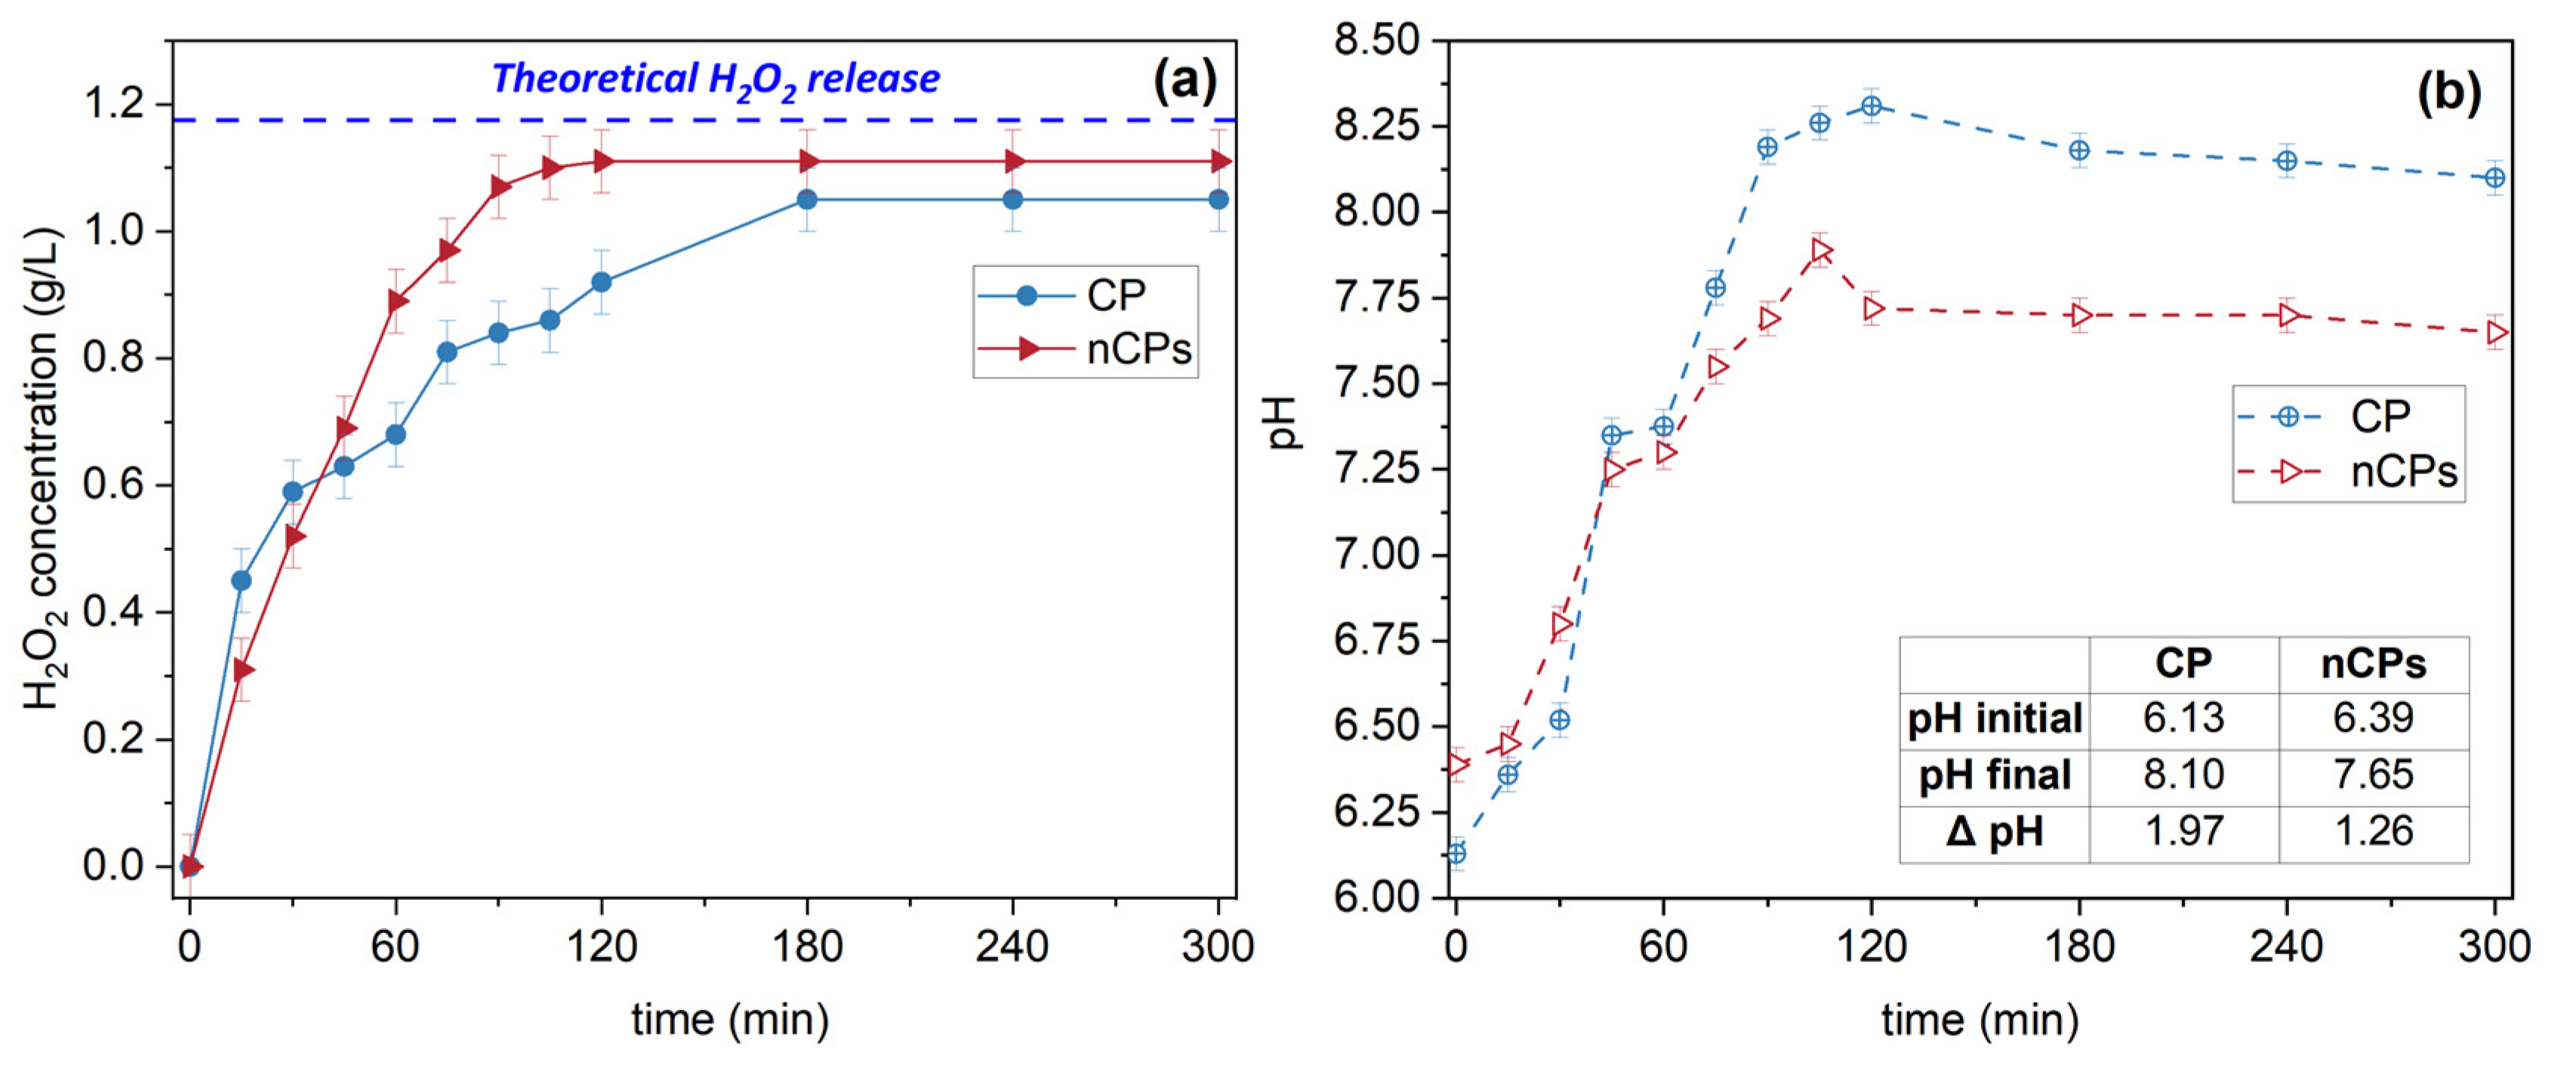
3.4. H2O2 Release
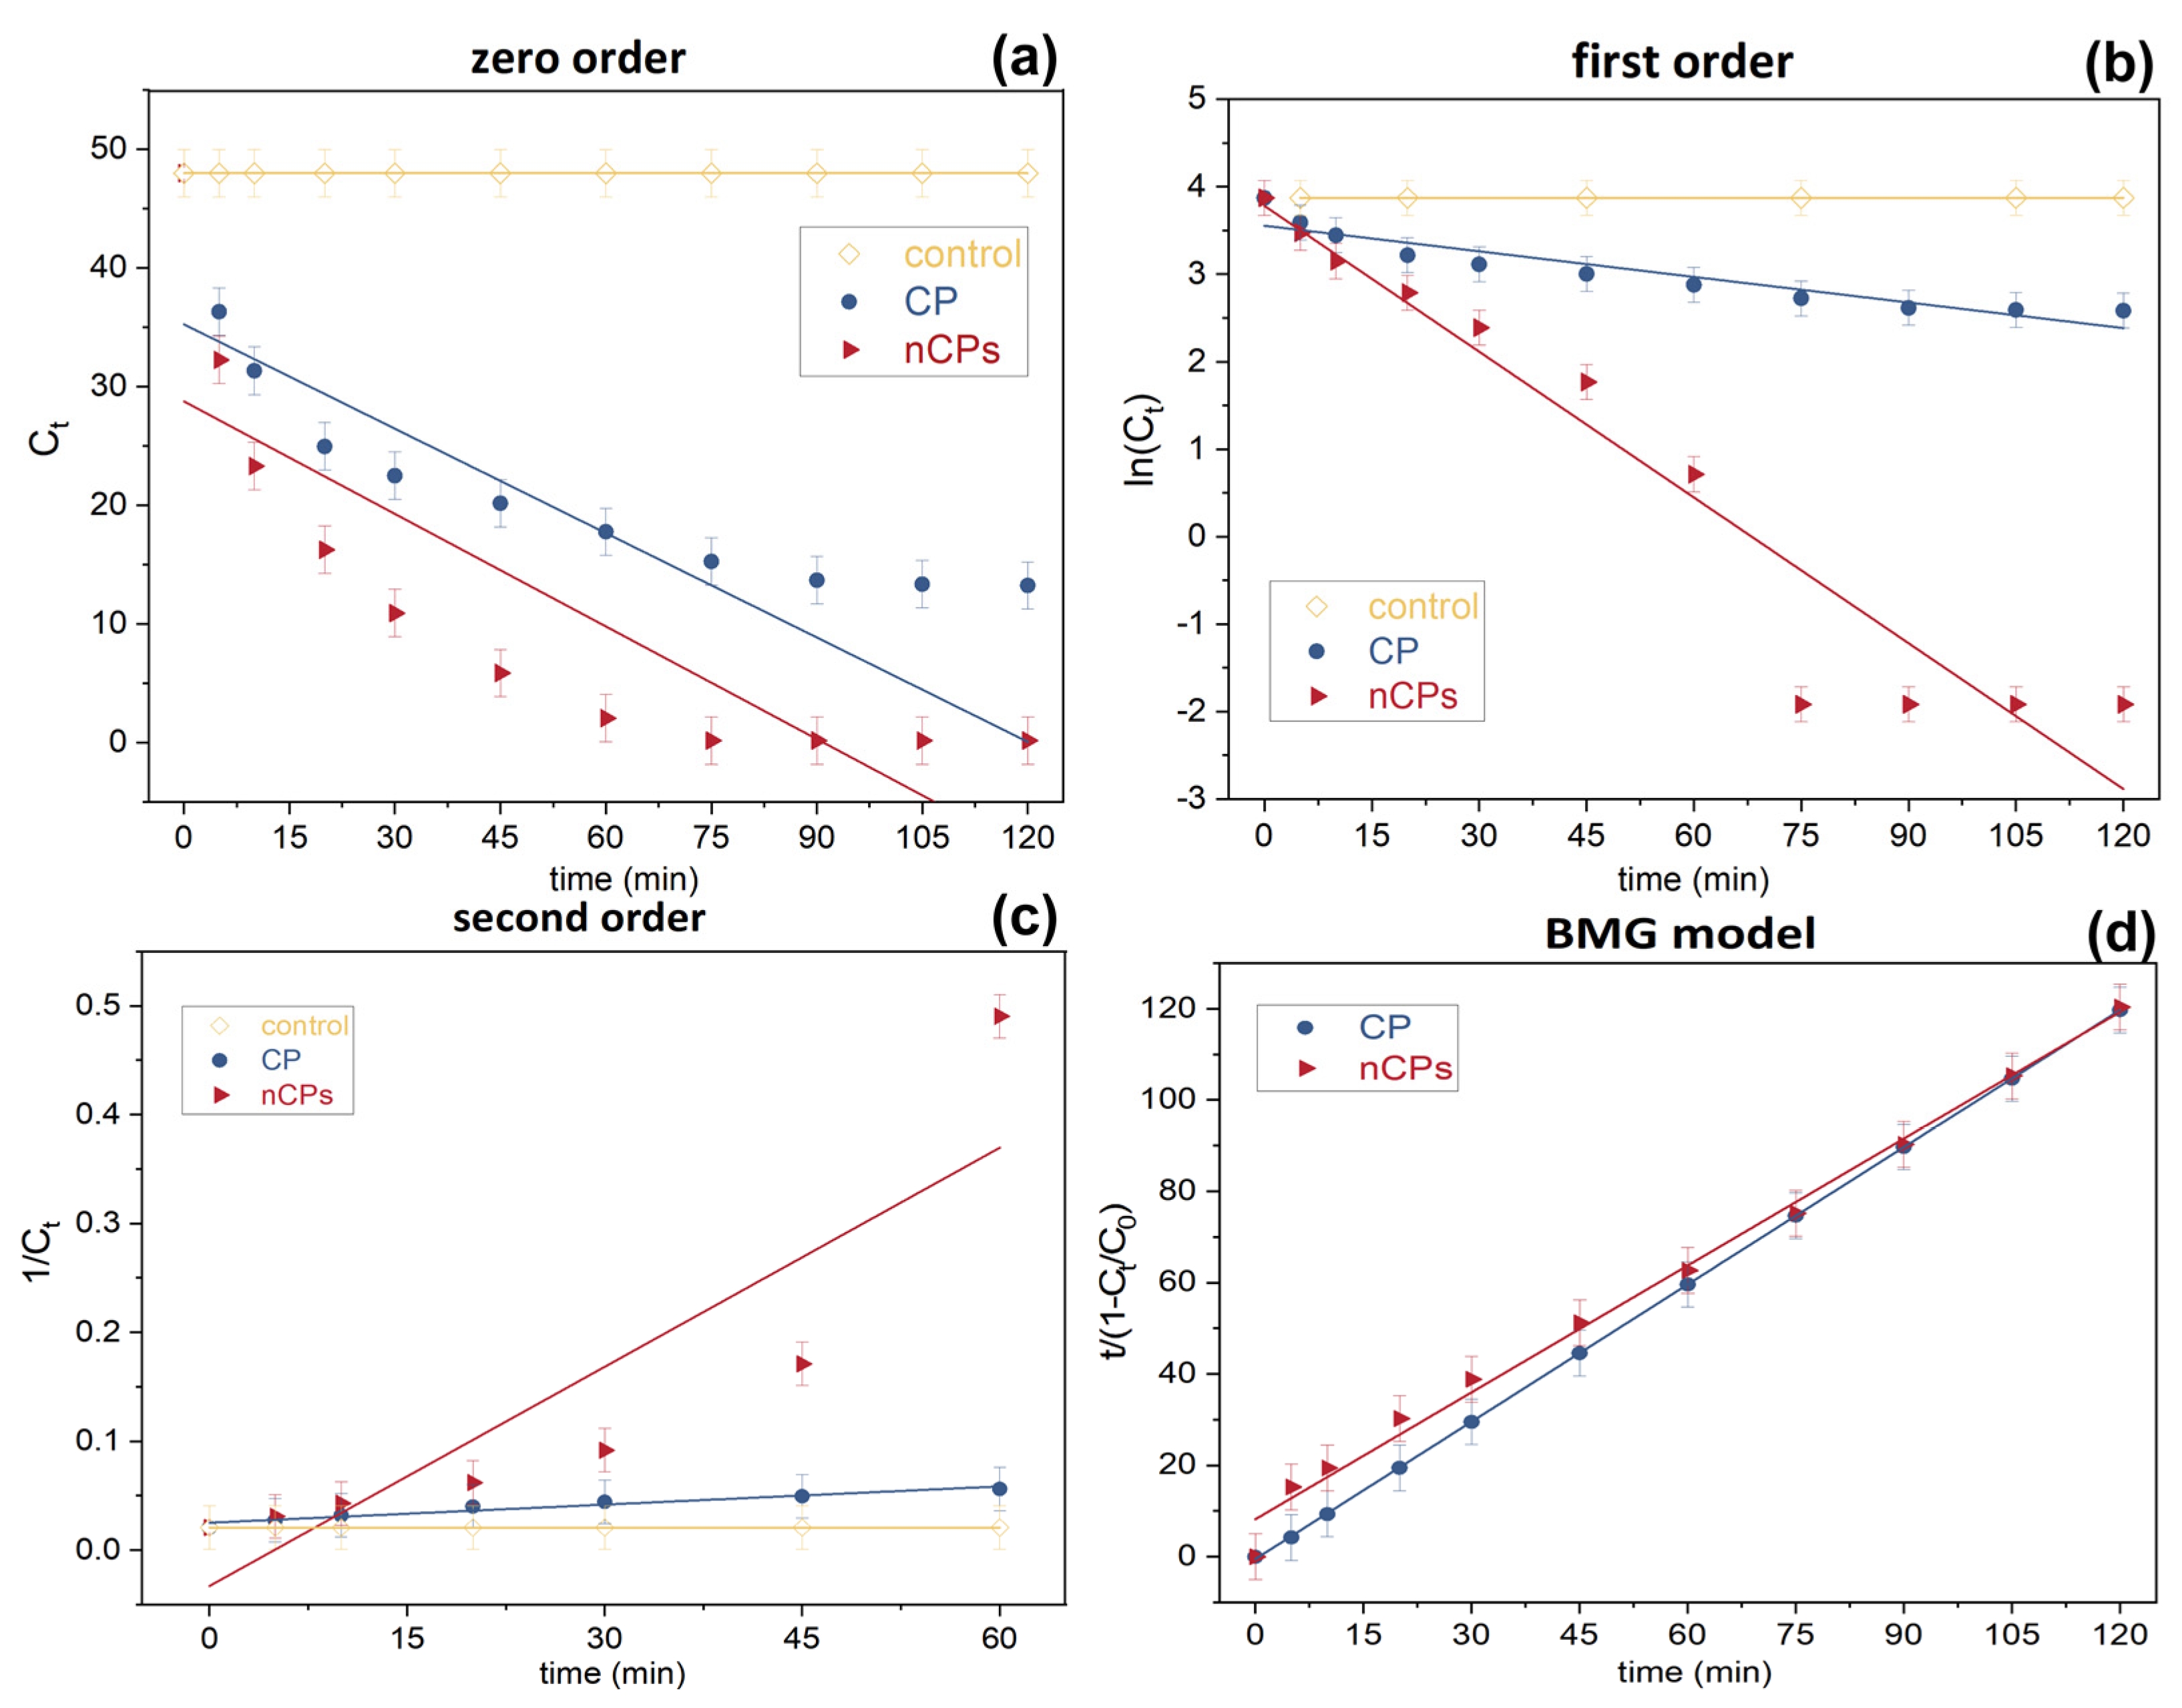
3.5. Kinetic Study
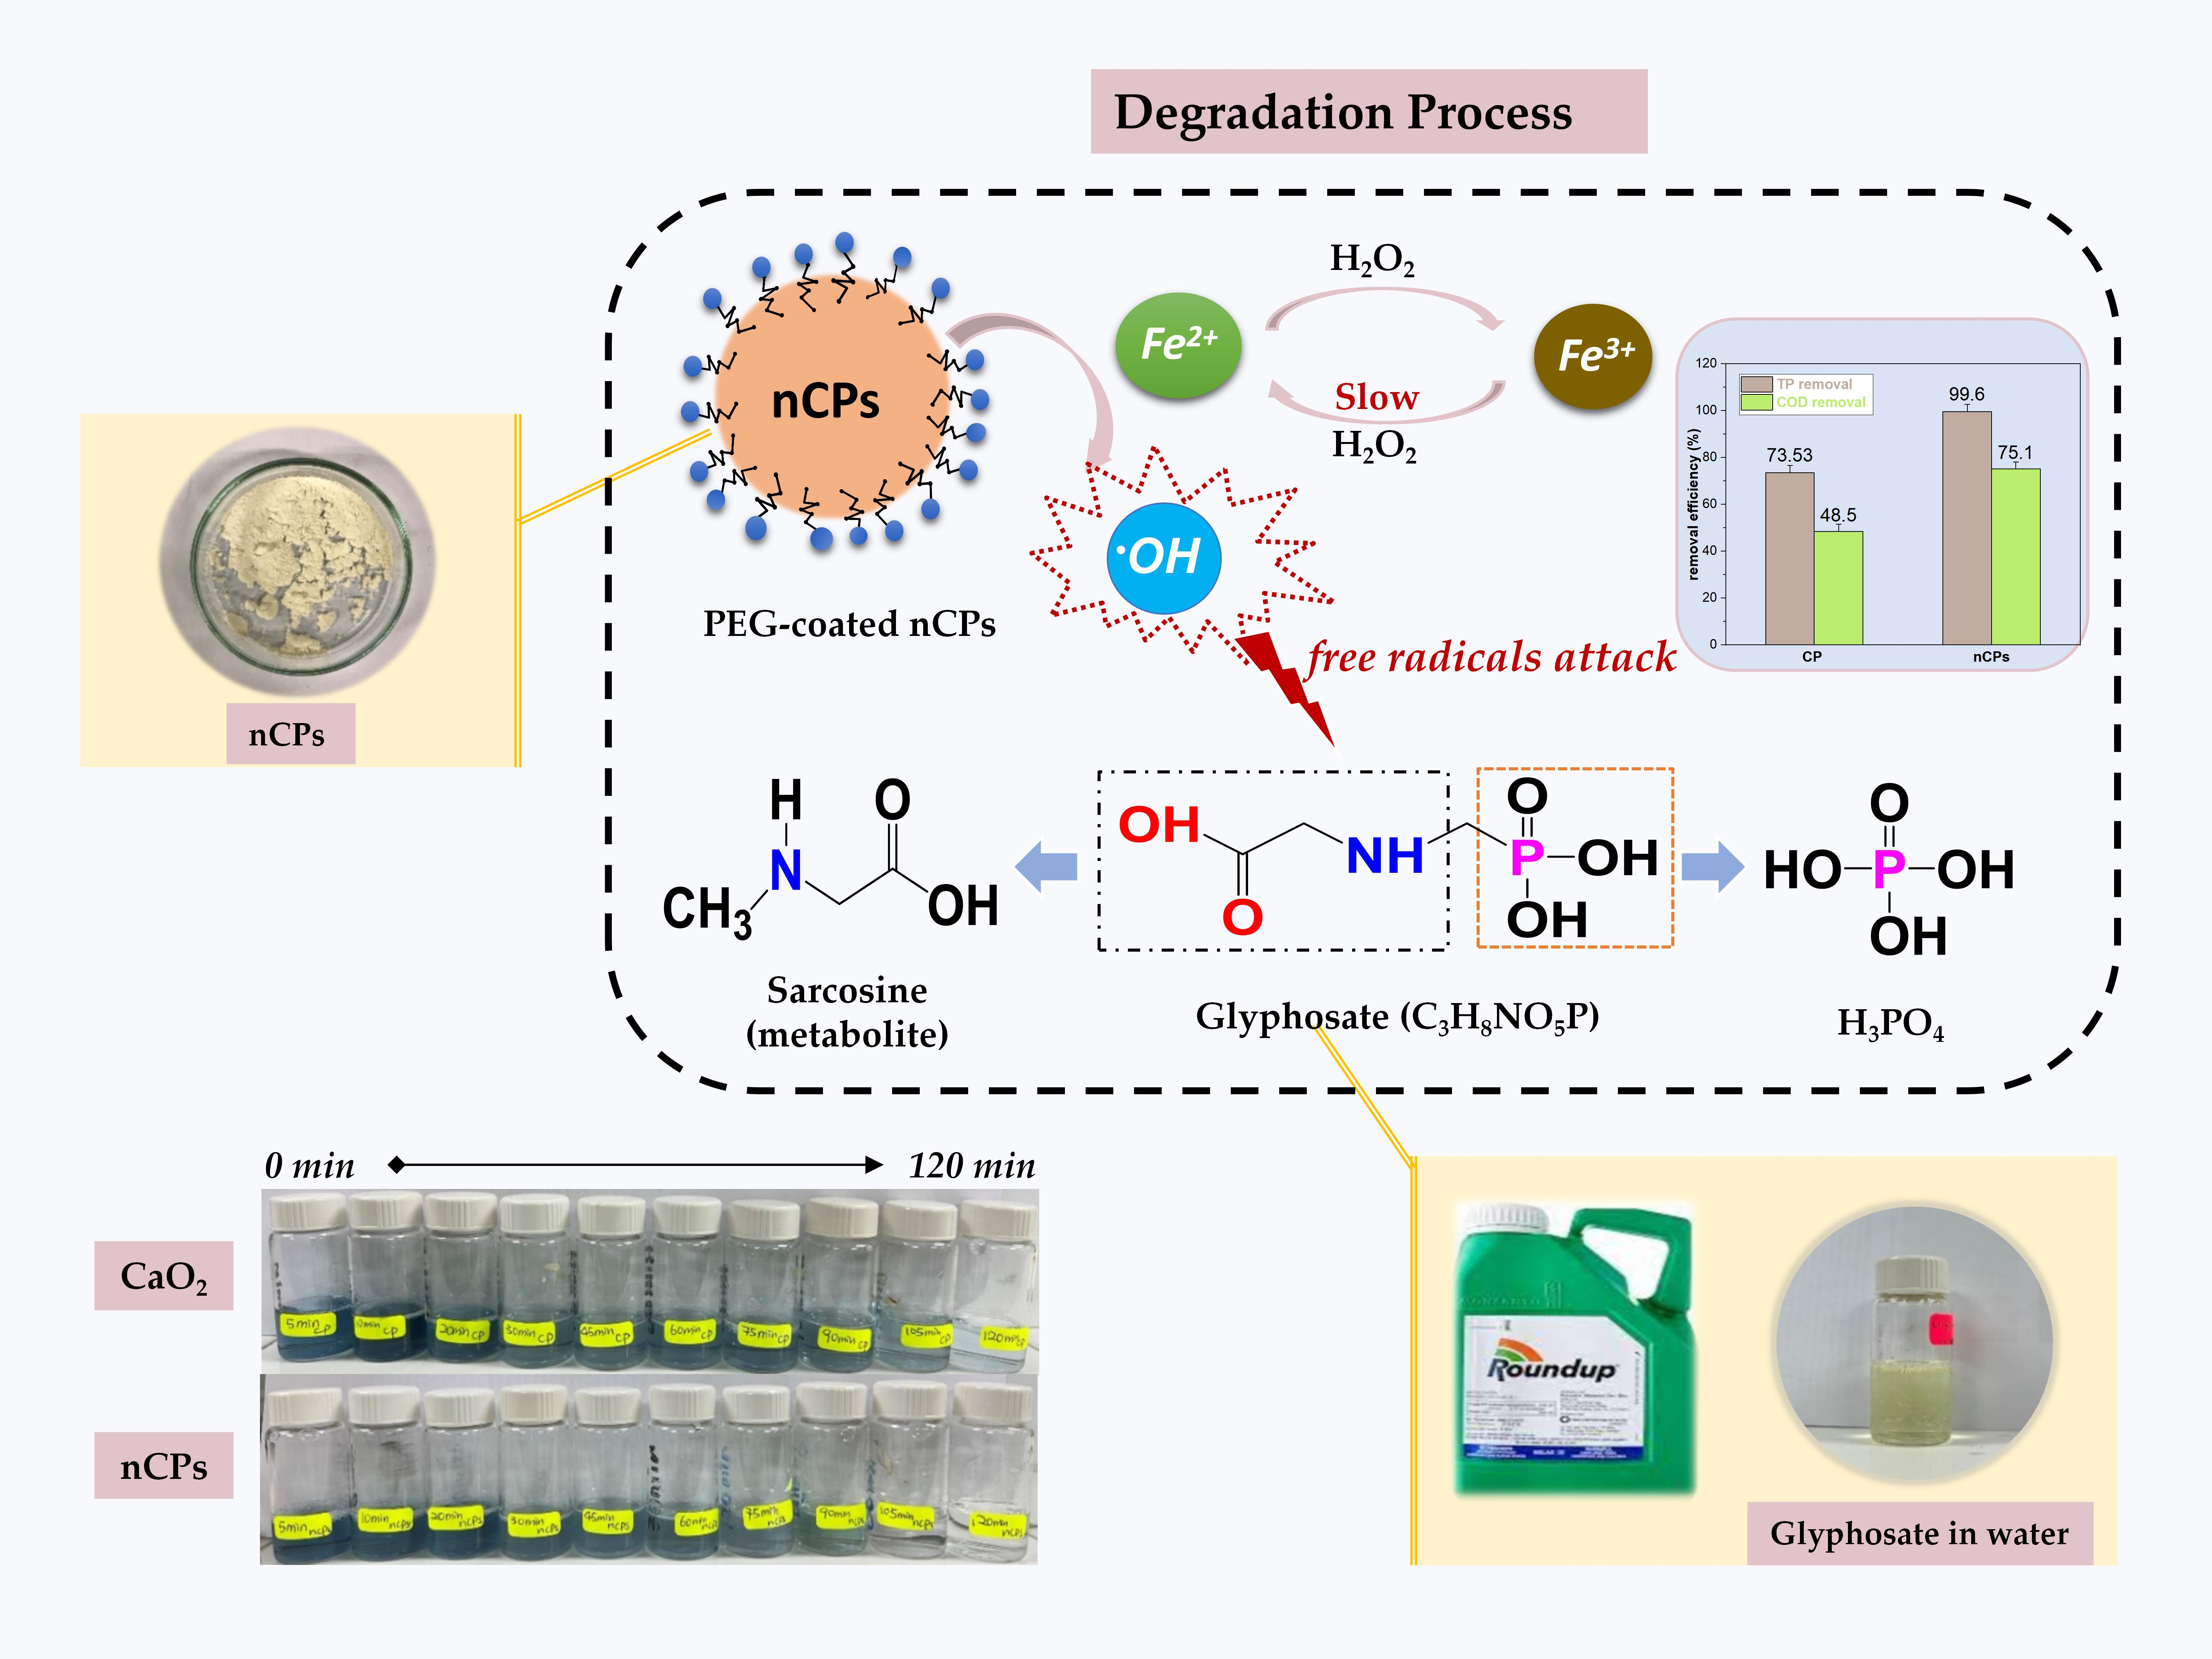
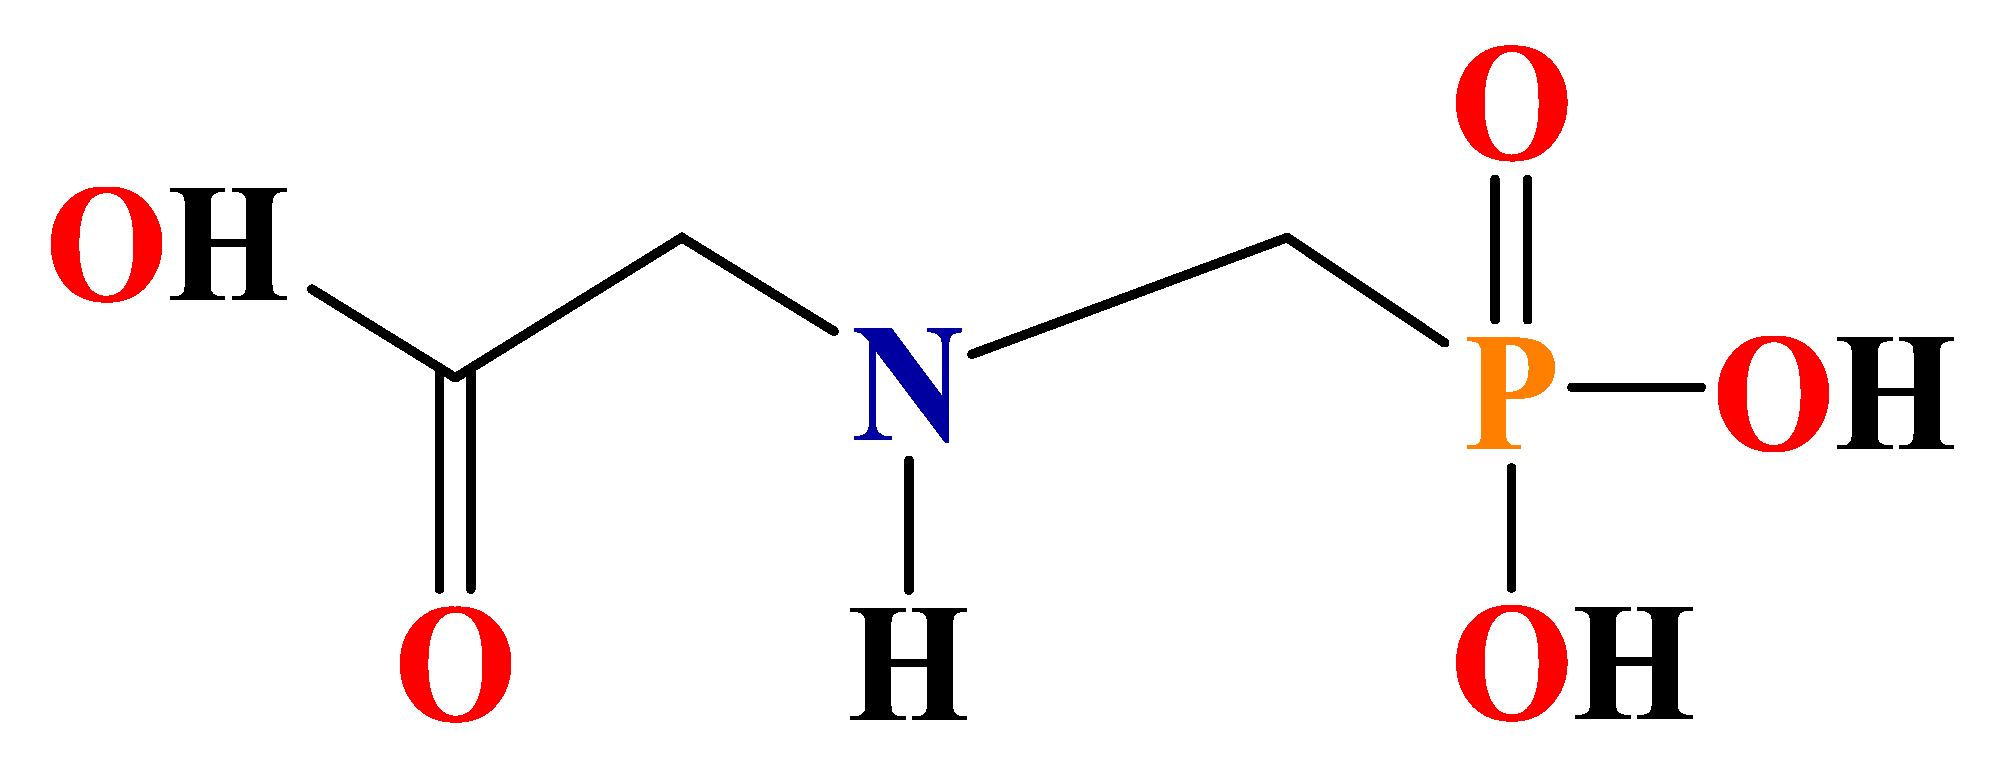
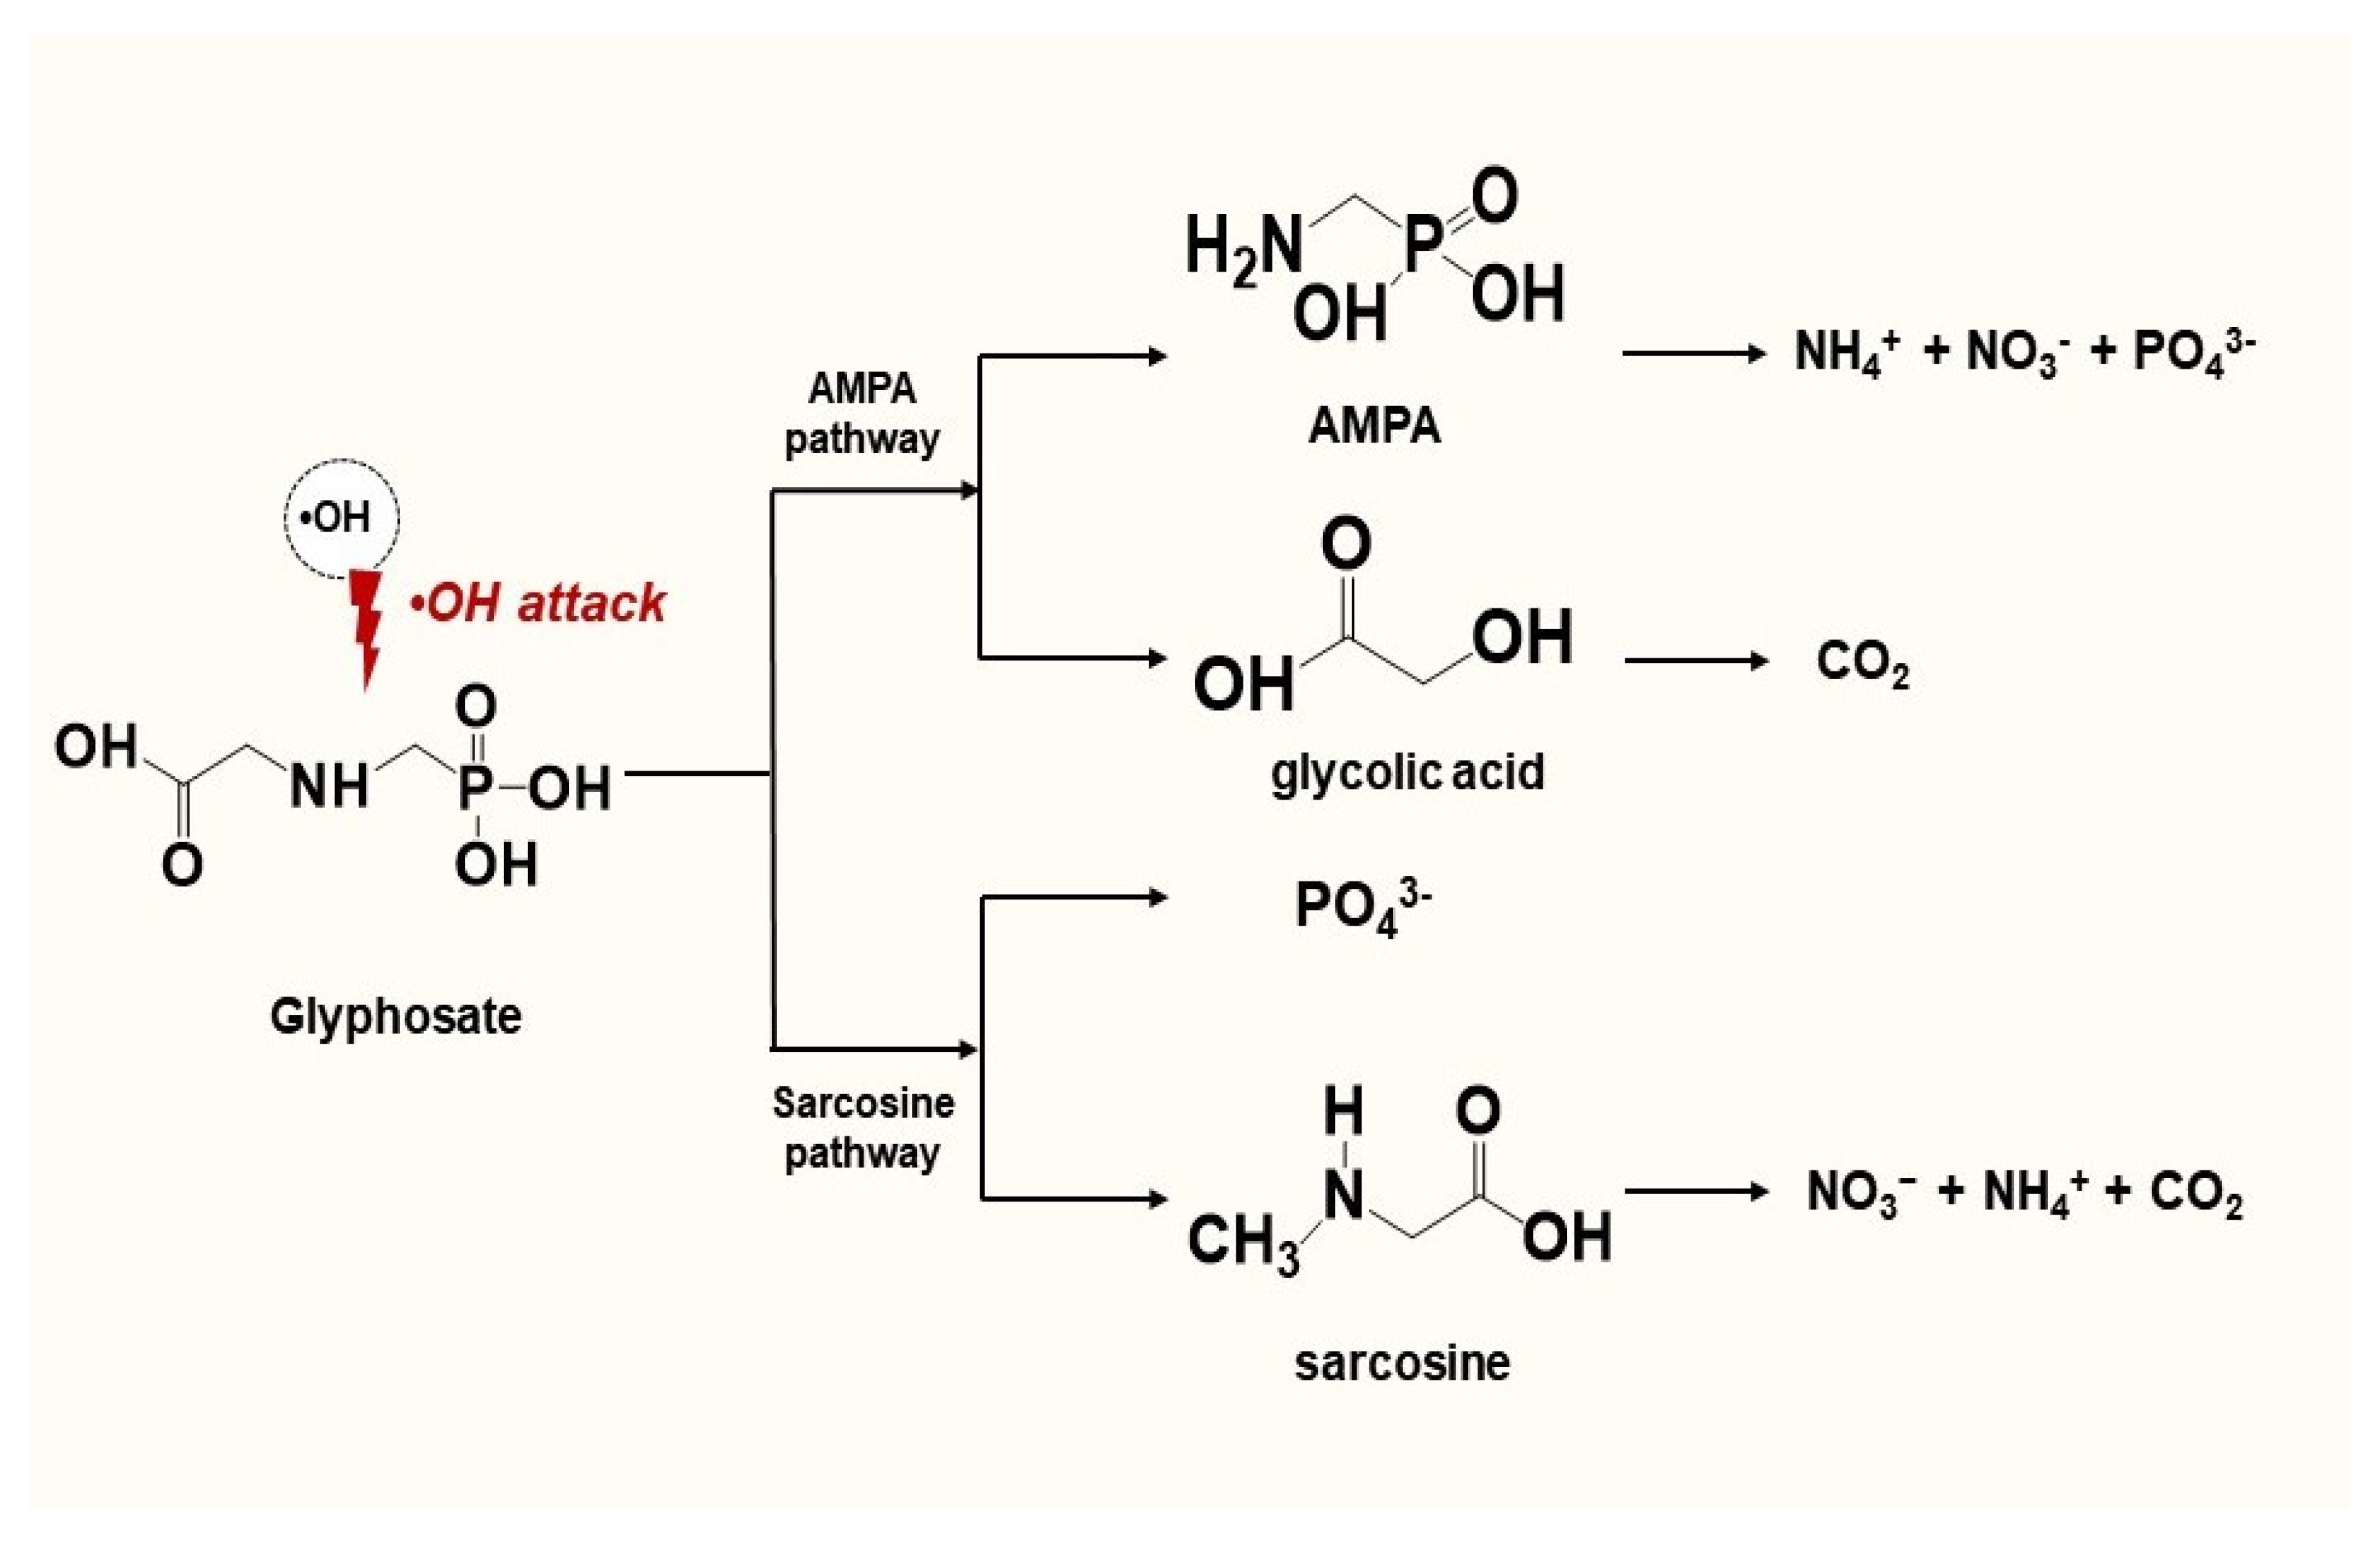
3.6. Proposed Degradation Pathways
4. Conclusions
Author Contributions
Funding
Institutional Review Board Statement
Data Availability Statement
Acknowledgments
Conflicts of Interest
References
- Nicolopoulou-Stamati, P.; Maipas, S.; Kotampasi, C.; Stamatis, P.; Hens, L. Chemical Pesticides and Human Health: The Urgent Need for a New Concept in Agriculture. Front. Public Health 2016, 4, 148. [Google Scholar] [CrossRef]
- Sustainable Water Solutions. Nat. Sustain. 2020, 3, 73. [CrossRef]
- Jia, D.; Liu, M.; Xia, J.; Li, C. Effective Removal of Aqueous Glyphosate Using CuFe2O4@biochar Derived from Phragmites. J. Chem. Technol. Biotechnol. 2020, 95, 196–204. [Google Scholar] [CrossRef]
- Poiger, T.; Keller, M.; Buerge, I.J.; Balmer, M.E. Behavior of Glyphosate in Wastewater Treatment Plants. Chimia 2020, 74, 156–160. [Google Scholar] [CrossRef]
- Mahler, B.J.; Van Metre, P.C.; Burley, T.E.; Loftin, K.A.; Meyer, M.T.; Nowell, L.H. Similarities and Differences in Occurrence and Temporal Fluctuations in Glyphosate and Atrazine in Small Midwestern Streams (USA) during the 2013 Growing Season. Sci. Total Environ. 2017, 579, 149–158. [Google Scholar] [CrossRef]
- Villeneuve, A.; Larroudé, S.; Humbert, J.F. Herbicide Contamination of Freshwater Ecosystems: Impact on Microbial Communities. Pestic. - Formul. Eff. Fate 2011. [Google Scholar] [CrossRef]
- Tóth, G.; Háhn, J.; Szoboszlay, S.; Harkai, P.; Farkas, M.; Radó, J.; Göbölös, B.; Kaszab, E.; Szabó, I.; Urbányi, B.; et al. Spatiotemporal Analysis of Multi-Pesticide Residues in the Largest Central European Shallow Lake, Lake Balaton, and Its Sub-Catchment Area. Environ. Sci. Eur. 2022, 34. [Google Scholar] [CrossRef]
- Espinoza-Montero, P.J.; Vega-Verduga, C.; Alulema-Pullupaxi, P.; Fernández, L.; Paz, J.L. Technologies Employed in the Treatment of Water Contaminated with Glyphosate: A Review. Molecules 2020, 25, 5550. [Google Scholar] [CrossRef]
- Feng, D.; Soric, A.; Boutin, O. Treatment Technologies and Degradation Pathways of Glyphosate: A Critical Review. Sci. Total Environ. 2020, 742, 140559. [Google Scholar] [CrossRef]
- Li, Y.; Zhao, C.; Wen, Y.; Wang, Y.; Yang, Y. Adsorption Performance and Mechanism of Magnetic Reduced Graphene Oxide in Glyphosate Contaminated Water. Environ. Sci. Pollut. Res. 2018, 25, 21036–21048. [Google Scholar] [CrossRef]
- Li, F.; Wang, Y.; Yang, Q.; Evans, D.G.; Forano, C.; Duan, X. Study on Adsorption of Glyphosate (N-Phosphonomethyl Glycine) Pesticide on MgAl-Layered Double Hydroxides in Aqueous Solution. J. Hazard. Mater. 2005, 125, 89–95. [Google Scholar] [CrossRef] [PubMed]
- Zhan, H.; Feng, Y.; Fan, X.; Chen, S. Recent Advances in Glyphosate Biodegradation. Appl. Microbiol. Biotechnol. 2018, 102, 5033–5043. [Google Scholar] [CrossRef]
- Li, F.; Choong, T.S.Y.; Soltani, S.; Chuah Abdullah, L.; Siti Nurul, S.N.A.; Amerhaider Nuar, N.N. Investigation of Glyphosate Removal from Aqueous Solutions Using Fenton-like System Based on Calcium Peroxide. Processes 2022, 10, 2045. [Google Scholar] [CrossRef]
- Amerhaider Nuar, N.N.; Siti Nurul, S.N.A.; Li, F.; Mat Azmi, I.D.; Chiang, P.C.; Choong, T.S.Y. Synthesis of Controlled-Release Calcium Peroxide Nanoparticles Coated with Dextran for Removal of Doxycycline from Aqueous System. Polymers 2022, 14, 3866. [Google Scholar] [CrossRef] [PubMed]
- Wang, J.L.; Xu, L.J. Advanced Oxidation Processes for Wastewater Treatment: Formation of Hydroxyl Radical and Application. Crit. Rev. Environ. Sci. Technol. 2012, 42, 251–325. [Google Scholar] [CrossRef]
- Lu, S.; Zhang, X.; Xue, Y. Application of Calcium Peroxide in Water and Soil Treatment: A Review. J. Hazard. Mater. 2017, 337, 163–177. [Google Scholar] [CrossRef] [PubMed]
- Xue, Y.; Sui, Q.; Brusseau, M.L.; Zhou, W.; Qiu, Z.; Lyu, S. Insight into CaO2-Based Fenton and Fenton-like Systems: Strategy for CaO2-Based Oxidation of Organic Contaminants. Chem. Eng. J. 2019, 361, 919–928. [Google Scholar] [CrossRef]
- Zhang, A.; Wang, J.; Li, Y. Performance of Calcium Peroxide for Removal of Endocrine-Disrupting Compounds in Waste Activated Sludge and Promotion of Sludge Solubilization. Water Res. 2015, 71, 125–139. [Google Scholar] [CrossRef]
- Ali, M.; Farooq, U.; Lyu, S.; Sun, Y.; Li, M.; Ahmad, A.; Shan, A.; Abbas, Z. Synthesis of Controlled Release Calcium Peroxide Nanoparticles (CR-NCPs): Characterizations, H2O2 Liberate Performances and Pollutant Degradation Efficiency. Sep. Purif. Technol. 2020, 241, 116729. [Google Scholar] [CrossRef]
- Sun, Y.; Lyu, S.; Brusseau, M.L.; Tang, P.; Jiang, W.; Gu, M.; Li, M.; Lyu, Y.; Qiu, Z.; Sui, Q. Degradation of Trichloroethylene in Aqueous Solution by Nanoscale Calcium Peroxide in the Fe(II)-Based Catalytic Environments. Sep. Purif. Technol. 2019, 226, 13–21. [Google Scholar] [CrossRef]
- Li, F.; Shean, T.; Choong, Y.; Soltani, S.; Chuah, L.; Nurul, S.; Jamil, A. Kinetic Study of Fenton-Like Degradation of Methylene Blue in Aqueous Solution Using Calcium Peroxide. Pertanika J. Sci. Technol. 2022, 30. [Google Scholar] [CrossRef]
- Wang, H.; Zhao, Y.; Su, Y.; Li, T.; Yao, M.; Qin, C. Fenton-like Degradation of 2,4-Dichlorophenol Using Calcium Peroxide Particles: Performance and Mechanisms. RSC Adv. 2017, 7, 4563–4571. [Google Scholar] [CrossRef]
- Khodaveisi, J.; Banejad, H.; Afkhami, A.; Olyaie, E.; Lashgari, S.; Dashti, R. Synthesis of Calcium Peroxide Nanoparticles as an Innovative Reagent for in Situ Chemical Oxidation. J. Hazard. Mater. 2011, 192, 1437–1440. [Google Scholar] [CrossRef] [PubMed]
- Rastinfard, A.; Nazarpak, M.H.; Moztarzadeh, F. Controlled Chemical Synthesis of CaO2 Particles Coated with Polyethylene Glycol: Characterization of Crystallite Size and Oxygen Release Kinetics. RSC Adv. 2018, 8, 91–101. [Google Scholar] [CrossRef]
- Massalimov, I.A.; Il’yasova, R.R.; Samsonov, M.R.; Mustafin, A.G.; Medvedev, Y.A. Recovery of Heavy Metal Ions with Calcium Peroxide Microparticles. Russ. J. Appl. Chem. 2016, 89, 360–366. [Google Scholar] [CrossRef]
- Garnjanagoonchorn, W.; Changpuak, A. Preparation and Partial Characterization of Eggshell Calcium Chloride. Int. J. Food Prop. 2007, 10, 497–503. [Google Scholar] [CrossRef]
- Huang, M.R.; Li, X.G. Highly Sensing and Transducing Materials for Potentiometric Ion Sensors with Versatile Applicability. Prog. Mater. Sci. 2022, 125, 100885. [Google Scholar] [CrossRef]
- Trovó, A.G.; Senivs, P.; Palmiste, Ü.; Sillanpää, M.; Tang, W.Z. Decolorization Kinetics of Acid Blue 161 by Solid Peroxides Catalyzed by Iron in Aqueous Solution. Desalin. Water Treat. 2016, 57, 19344–19356. [Google Scholar] [CrossRef]
- Madan, S.S.; Wasewar, K.L. Synthesis of CaO2 Nanoparticles for Environmental Remediation. EnergyEnviron. Sel. Proc. ICWEES-2016 2018, 69–76. [Google Scholar] [CrossRef]
- Madan, S.S.; Upwanshi W, A.; Wasewar, K.L. Adsorption of α-Toluic Acid by Calcium Peroxide Nanoparticles. Desalin. Water Treat. 2016, 57, 16507–16513. [Google Scholar] [CrossRef]
- Mosmeri, H.; Alaie, E.; Shavandi, M.; Dastgheib, S.M.M.; Tasharrofi, S. Benzene-Contaminated Groundwater Remediation Using Calcium Peroxide Nanoparticles: Synthesis and Process Optimization. Environ. Monit. Assess. 2017, 189. [Google Scholar] [CrossRef] [PubMed]
- Souza, D.R.D.; Trovõ, A.G.; Filho, N.R.A.; Silva, M.A.A.; Machado, A.E.H. Degradation of the Commercial Herbicide Glyphosate by Photo-Fenton Process: Evaluation of Kinetic Parameters and Toxicity. J. Braz. Chem. Soc. 2013, 24, 1451–1460. [Google Scholar] [CrossRef]
- Behnajady, M.A.; Modirshahla, N.; Ghanbary, F. A Kinetic Model for the Decolorization of C.I. Acid Yellow 23 by Fenton Process. J. Hazard. Mater. 2007, 148, 98–102. [Google Scholar] [CrossRef] [PubMed]
- Ertugay, N.; Acar, F.N. Removal of COD and Color from Direct Blue 71 Azo Dye Wastewater by Fenton’s Oxidation: Kinetic Study. Arab. J. Chem. 2017, 10, S1158–S1163. [Google Scholar] [CrossRef]
- Santana, C.S.; Ramos, M.D.N.; Velloso, C.C.V.; Aguiar, A. Kinetic Evaluation of Dye Decolorization by Fenton Processes in the Presence of 3-Hydroxyanthranilic Acid. Int. J. Environ. Res. Public Health 2019, 16, 1602. [Google Scholar] [CrossRef]
- Bougdour, N.; Sennaoui, A.; Bakas, I.; Assabbane, A. Experimental Evaluation of Reactive Yellow 17 Degradation Using UV Light and Iron Ions Activated Peroxydisulfate: Efficiency and Kinetic Model. Sci. Technol. Mater. 2018, 30, 157–165. [Google Scholar] [CrossRef]
- Zegliński, J.; Piotrowski, G.P.; Piekoś, R. A Study of Interaction between Hydrogen Peroxide and Silica Gel by FTIR Spectroscopy and Quantum Chemistry. J. Mol. Struct. 2006, 794, 83–91. [Google Scholar] [CrossRef]
- Matuana, L.M.; Balatinecz, J.J.; Sodhi, R.N.S.; Park, C.B. Surface Characterization of Esterified Cellulosic Fibers by XPS and FTIR Spectroscopy. Wood Sci. Technol. 2001, 35, 191–201. [Google Scholar] [CrossRef]
- Li, X.; Xie, Y.; Jiang, F.; Wang, B.; Hu, Q.; Tang, Y.; Luo, T.; Wu, T. Enhanced Phosphate Removal from Aqueous Solution Using Resourceable Nano-CaO2/BC Composite: Behaviors and Mechanisms. Sci. Total Environ. 2020, 709, 136123. [Google Scholar] [CrossRef]
- Madan, S.S.; Wasewar, K.L.; Ravi Kumar, C. Adsorption Kinetics, Thermodynamics, and Equilibrium of α-Toluic Acid onto Calcium Peroxide Nanoparticles. Adv. Powder Technol. 2016, 27, 2112–2120. [Google Scholar] [CrossRef]
- Yuan, D.; Zhang, C.; Tang, S.; Li, X.; Tang, J.; Rao, Y.; Wang, Z.; Zhang, Q. Enhancing CaO2 Fenton-like Process by Fe(II)-Oxalic Acid Complexation for Organic Wastewater Treatment. Water Res. 2019, 163, 114861. [Google Scholar] [CrossRef]
- Rahman, M.M.; Shafiullah, A.Z.; Pal, A.; Islam, M.A.; Jahan, I.; Saha, B.B. Study on Optimum Iupac Adsorption Isotherm Models Employing Sensitivity of Parameters for Rigorous Adsorption System Performance Evaluation. Energies 2021, 14, 7478. [Google Scholar] [CrossRef]
- Barreto, F.; Santana, C.S.; Aguiar, A. Behavior of Dihydroxybenzenes and Gallic Acid on the Fenton-Based Decolorization of Dyes. Desalin. Water Treat. 2016, 57, 431–439. [Google Scholar] [CrossRef]
- Xie, Y.; Yang, X.; Li, W.; Li, J.; Wu, T.; Wang, H.; Huang, J.; Xu, F. Enhanced Removal of Glyphosate from Aqueous Solution by Nano-CaO2/AS Composite: Oxidation and Precipitation. Sep. Purif. Technol. 2022, 288, 120349. [Google Scholar] [CrossRef]
- Liao, H.; Tan, B.; Ke, M.; Li, Z.; Lu, J. Pretreatment of Glyphosate Wastewater with Fenton Reagent. Technol. Chem. Ind. 2009, 38, 48–50. [Google Scholar]
- Zhai, J.; Jiang, C.H. Synthesis of Calcium Peroxide Microparticles and Its Application in Glyphosate Wastewater Pretreatment. Adv. Mater. Res. 2014, 881–883, 1139–1143. [Google Scholar] [CrossRef]
- Balci, B.; Oturan, M.A.; Oturan, N.; Sires, I. Decontamination of Aqueous Glyphosate, (Aminomethyl) Phosphonic Acid, and Glufosinate Solutions by Electro-Fenton-Iike Process with Mn2+ as the Catalyst. J. Agric. Food Chem. 2009, 57, 4888–4894. [Google Scholar] [CrossRef] [PubMed]
- Wang, H.; Zhao, Y.; Li, T.; Chen, Z.; Wang, Y.; Qin, C. Properties of Calcium Peroxide for Release of Hydrogen Peroxide and Oxygen: A Kinetics Study. Chem. Eng. J. 2016, 303, 450–457. [Google Scholar] [CrossRef]
- Jönsson, J.; Camm, R.; Hall, T. Removal and Degradation of Glyphosate in Water Treatment: A Review. J. Water Supply Res. Technol. AQUA 2013, 62, 395–408. [Google Scholar] [CrossRef]
- De, W.C.; Cui, Q.I.; Zhao, L.I. Evaluation of Calcium Peroxide as a New Water Purifying and Oxygen Releasing Agent in Aquaculture. Life Sci. Res. 2012. [Google Scholar] [CrossRef]
- Andreozzi, R.; Caprio, V.; Insola, A.; Marotta, R. Advanced Oxidation Processes (AOP) for Water Purification and Recovery. Catal. Today 1999, 53, 51–59. [Google Scholar] [CrossRef]


| Order | Equation Applied | Linear Form by Integration |
|---|---|---|
| Zero-order | ||
| First-order | ||
| Second-order | ||
| BMG model |
| Peak Number | CaO2 (JCPDS-00-003-0865) | Synthesized nCPs | ||||
|---|---|---|---|---|---|---|
| 2θ (Degree) | d-Spacing (Å) | Miller Indices (h k L) | 2θ (Degree) | d-Spacing (Å) | Miller Indices (h k L) | |
| 1 | 30.27 | 2.95 | 0 0 2 | 30.18 | 2.95 | 0 0 2 |
| 2 | 35.60 | 2.52 | 1 1 0 | 35.90 | 2.52 | 1 1 0 |
| 3 | 47.31 | 1.92 | 1 1 2 | 47.20 | 1.92 | 1 1 2 |
| 4 | 51.60 | 1.77 | 2 0 0 | 51.90 | 1.77 | 2 0 0 |
| 5 | 60.89 | 1.52 | 2 0 2 | 60.94 | 1.52 | 2 0 2 |
| Sample | Purity (%) | Surface Area (m2/g) | Pore Size (nm) | Pore Volume (cm3/g) | Surface-Volume Ratio | Average Size (nm) | PDI |
|---|---|---|---|---|---|---|---|
| CP | 65.0% | 3.1079 | 2.365 | 0.3644 | 13.70 | 220.16 | 0.592 |
| nCPs | 75.1% | 28.0860 | 23.1324 | 1.3248 | 21.25 | 40.88 | 0.228 |
| Sample | Removal (%) | Zero-Order | First-Order | Second-Order | BMG Model | |||||
|---|---|---|---|---|---|---|---|---|---|---|
| k0 | R2 | k1 | R2 | k2 | R2 | 1/m | 1/b | R2 | ||
| CP | 73.53 | 0.2993 | 0.8248 | 0.0097 | 0.9385 | 0.0067 | 0.7449 | 0.1218 | 0.9981 | 0.9999 |
| nCPs | 99.60 | 0.3163 | 0.6949 | 0.0555 | 0.9286 | 5.5700 | 0.9411 | 0.4916 | 1.1799 | 0.9930 |
| Average R2 | 0.7598 | 0.9336 | 0.8430 | 0.9965 | ||||||
Disclaimer/Publisher’s Note: The statements, opinions and data contained in all publications are solely those of the individual author(s) and contributor(s) and not of MDPI and/or the editor(s). MDPI and/or the editor(s) disclaim responsibility for any injury to people or property resulting from any ideas, methods, instructions or products referred to in the content. |
© 2023 by the authors. Licensee MDPI, Basel, Switzerland. This article is an open access article distributed under the terms and conditions of the Creative Commons Attribution (CC BY) license (https://creativecommons.org/licenses/by/4.0/).
Share and Cite
Li, F.; Choong, T.S.Y.; Abdullah, L.C.; Md. Jamil, S.N.A.; Amerhaider Nuar, N.N. Effective Removal of Glyphosate from Aqueous Systems Using Synthesized PEG-Coated Calcium Peroxide Nanoparticles: Kinetics Study, H2O2 Release Performance and Degradation Pathways. Polymers 2023, 15, 775. https://doi.org/10.3390/polym15030775
Li F, Choong TSY, Abdullah LC, Md. Jamil SNA, Amerhaider Nuar NN. Effective Removal of Glyphosate from Aqueous Systems Using Synthesized PEG-Coated Calcium Peroxide Nanoparticles: Kinetics Study, H2O2 Release Performance and Degradation Pathways. Polymers. 2023; 15(3):775. https://doi.org/10.3390/polym15030775
Chicago/Turabian StyleLi, Fan, Thomas Shean Yaw Choong, Luqman Chuah Abdullah, Siti Nurul Ain Md. Jamil, and Nurul Nazihah Amerhaider Nuar. 2023. "Effective Removal of Glyphosate from Aqueous Systems Using Synthesized PEG-Coated Calcium Peroxide Nanoparticles: Kinetics Study, H2O2 Release Performance and Degradation Pathways" Polymers 15, no. 3: 775. https://doi.org/10.3390/polym15030775
APA StyleLi, F., Choong, T. S. Y., Abdullah, L. C., Md. Jamil, S. N. A., & Amerhaider Nuar, N. N. (2023). Effective Removal of Glyphosate from Aqueous Systems Using Synthesized PEG-Coated Calcium Peroxide Nanoparticles: Kinetics Study, H2O2 Release Performance and Degradation Pathways. Polymers, 15(3), 775. https://doi.org/10.3390/polym15030775