
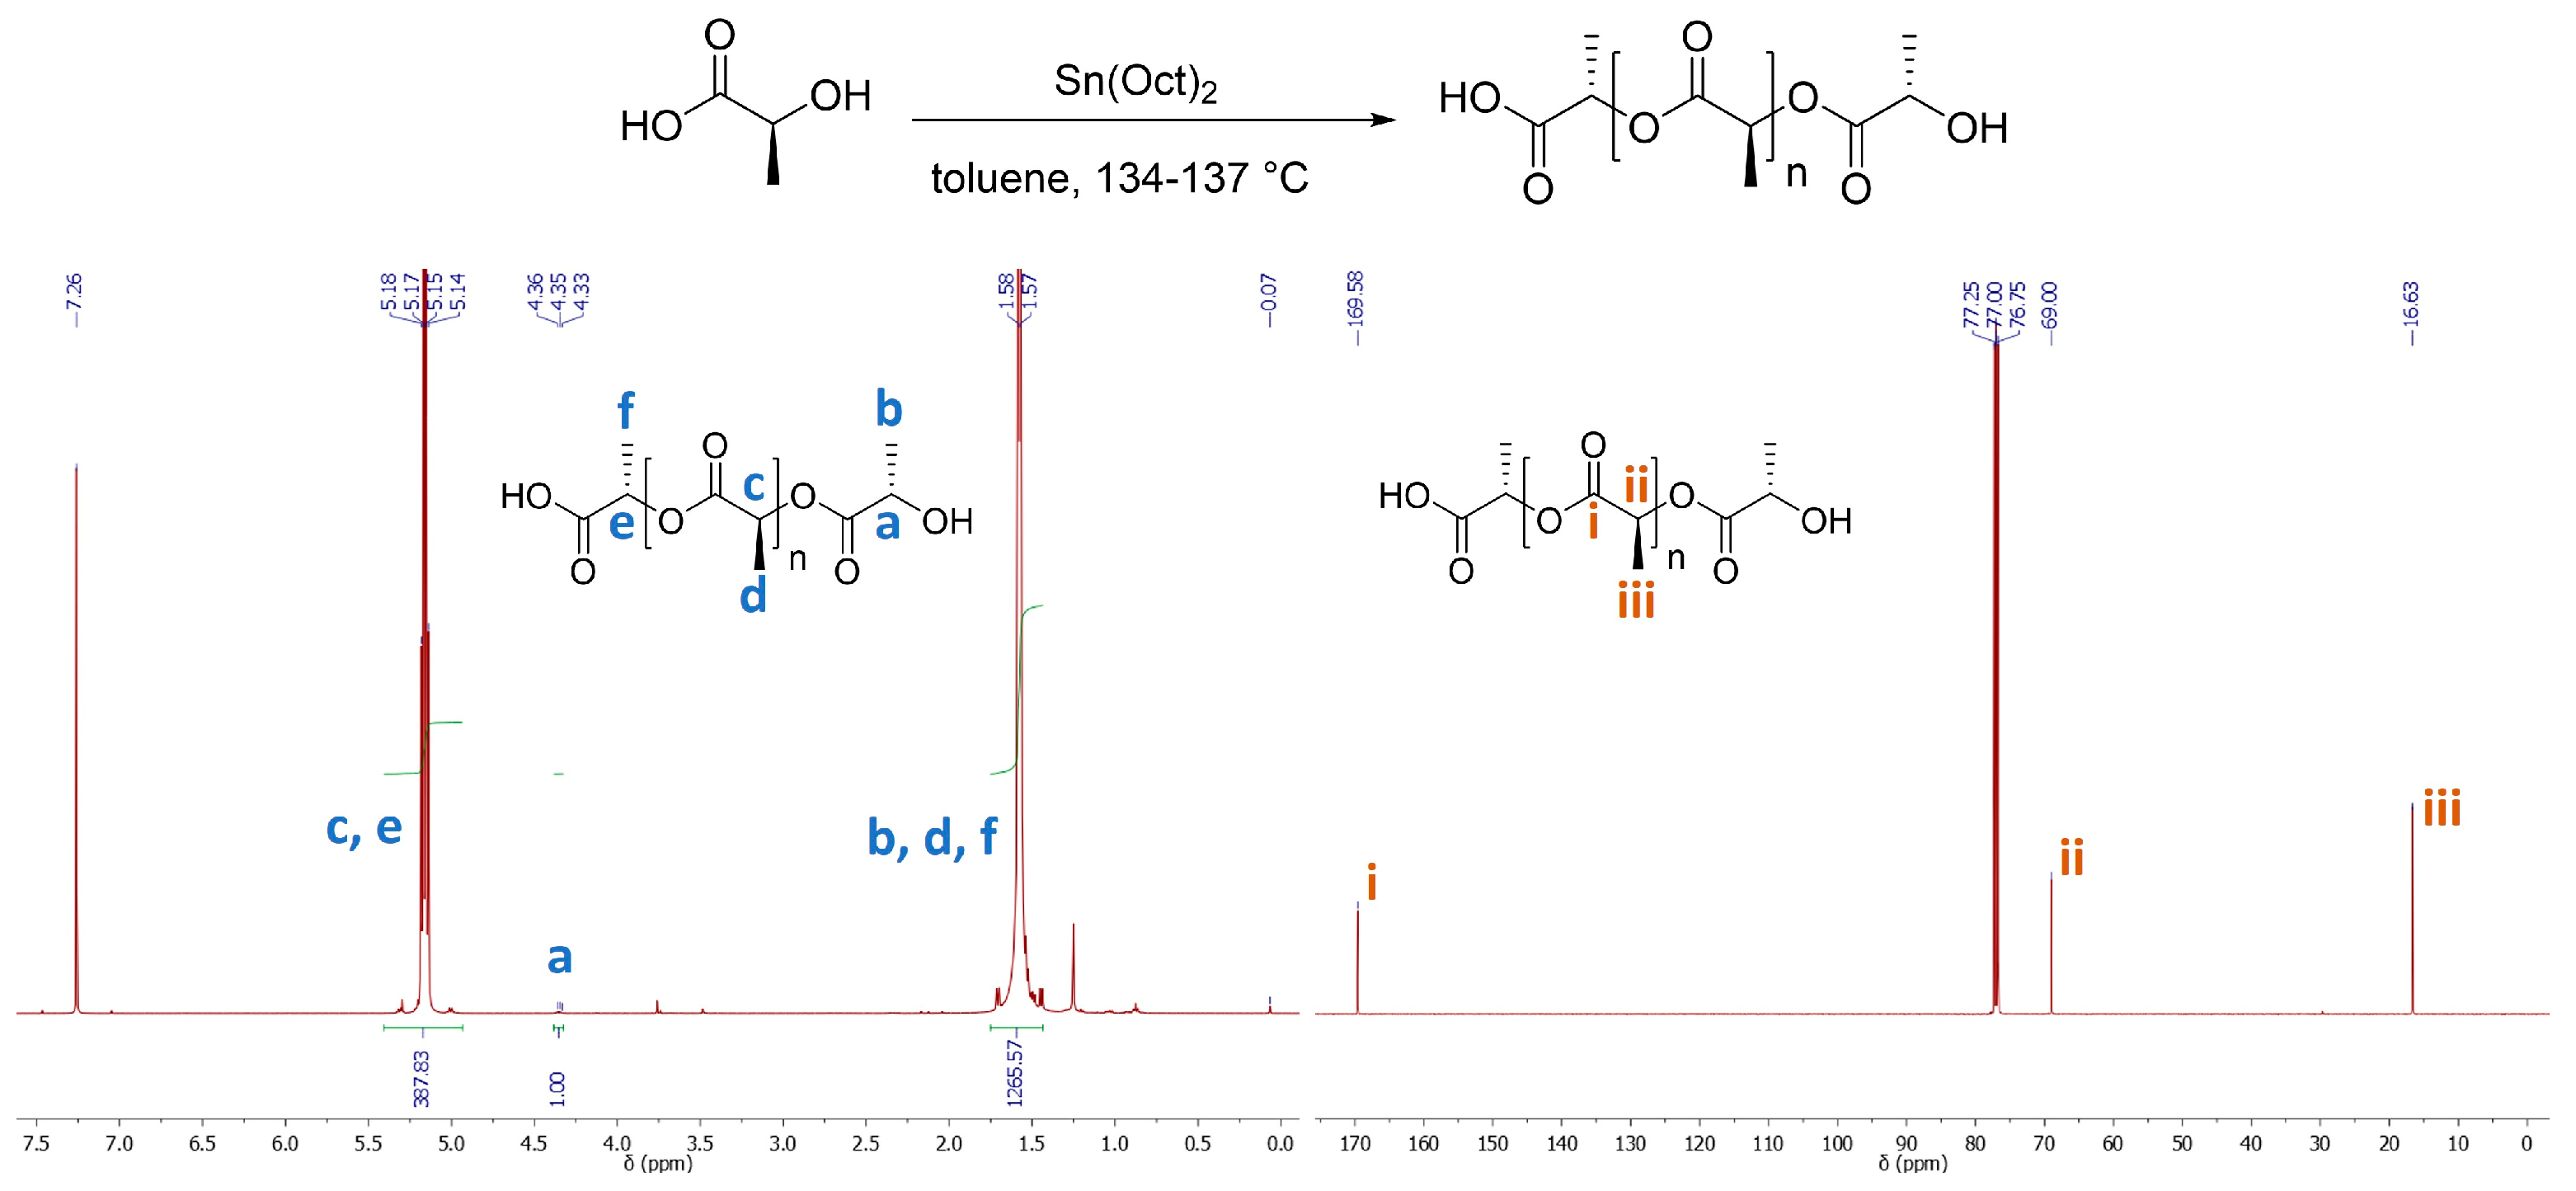
Synthesis and Modeling of Poly(L-lactic acid) via Polycondensation of L-Lactic Acid

 ,
,  ,
,  and
and 
Abstract
:1. Introduction
2. Materials and Methods
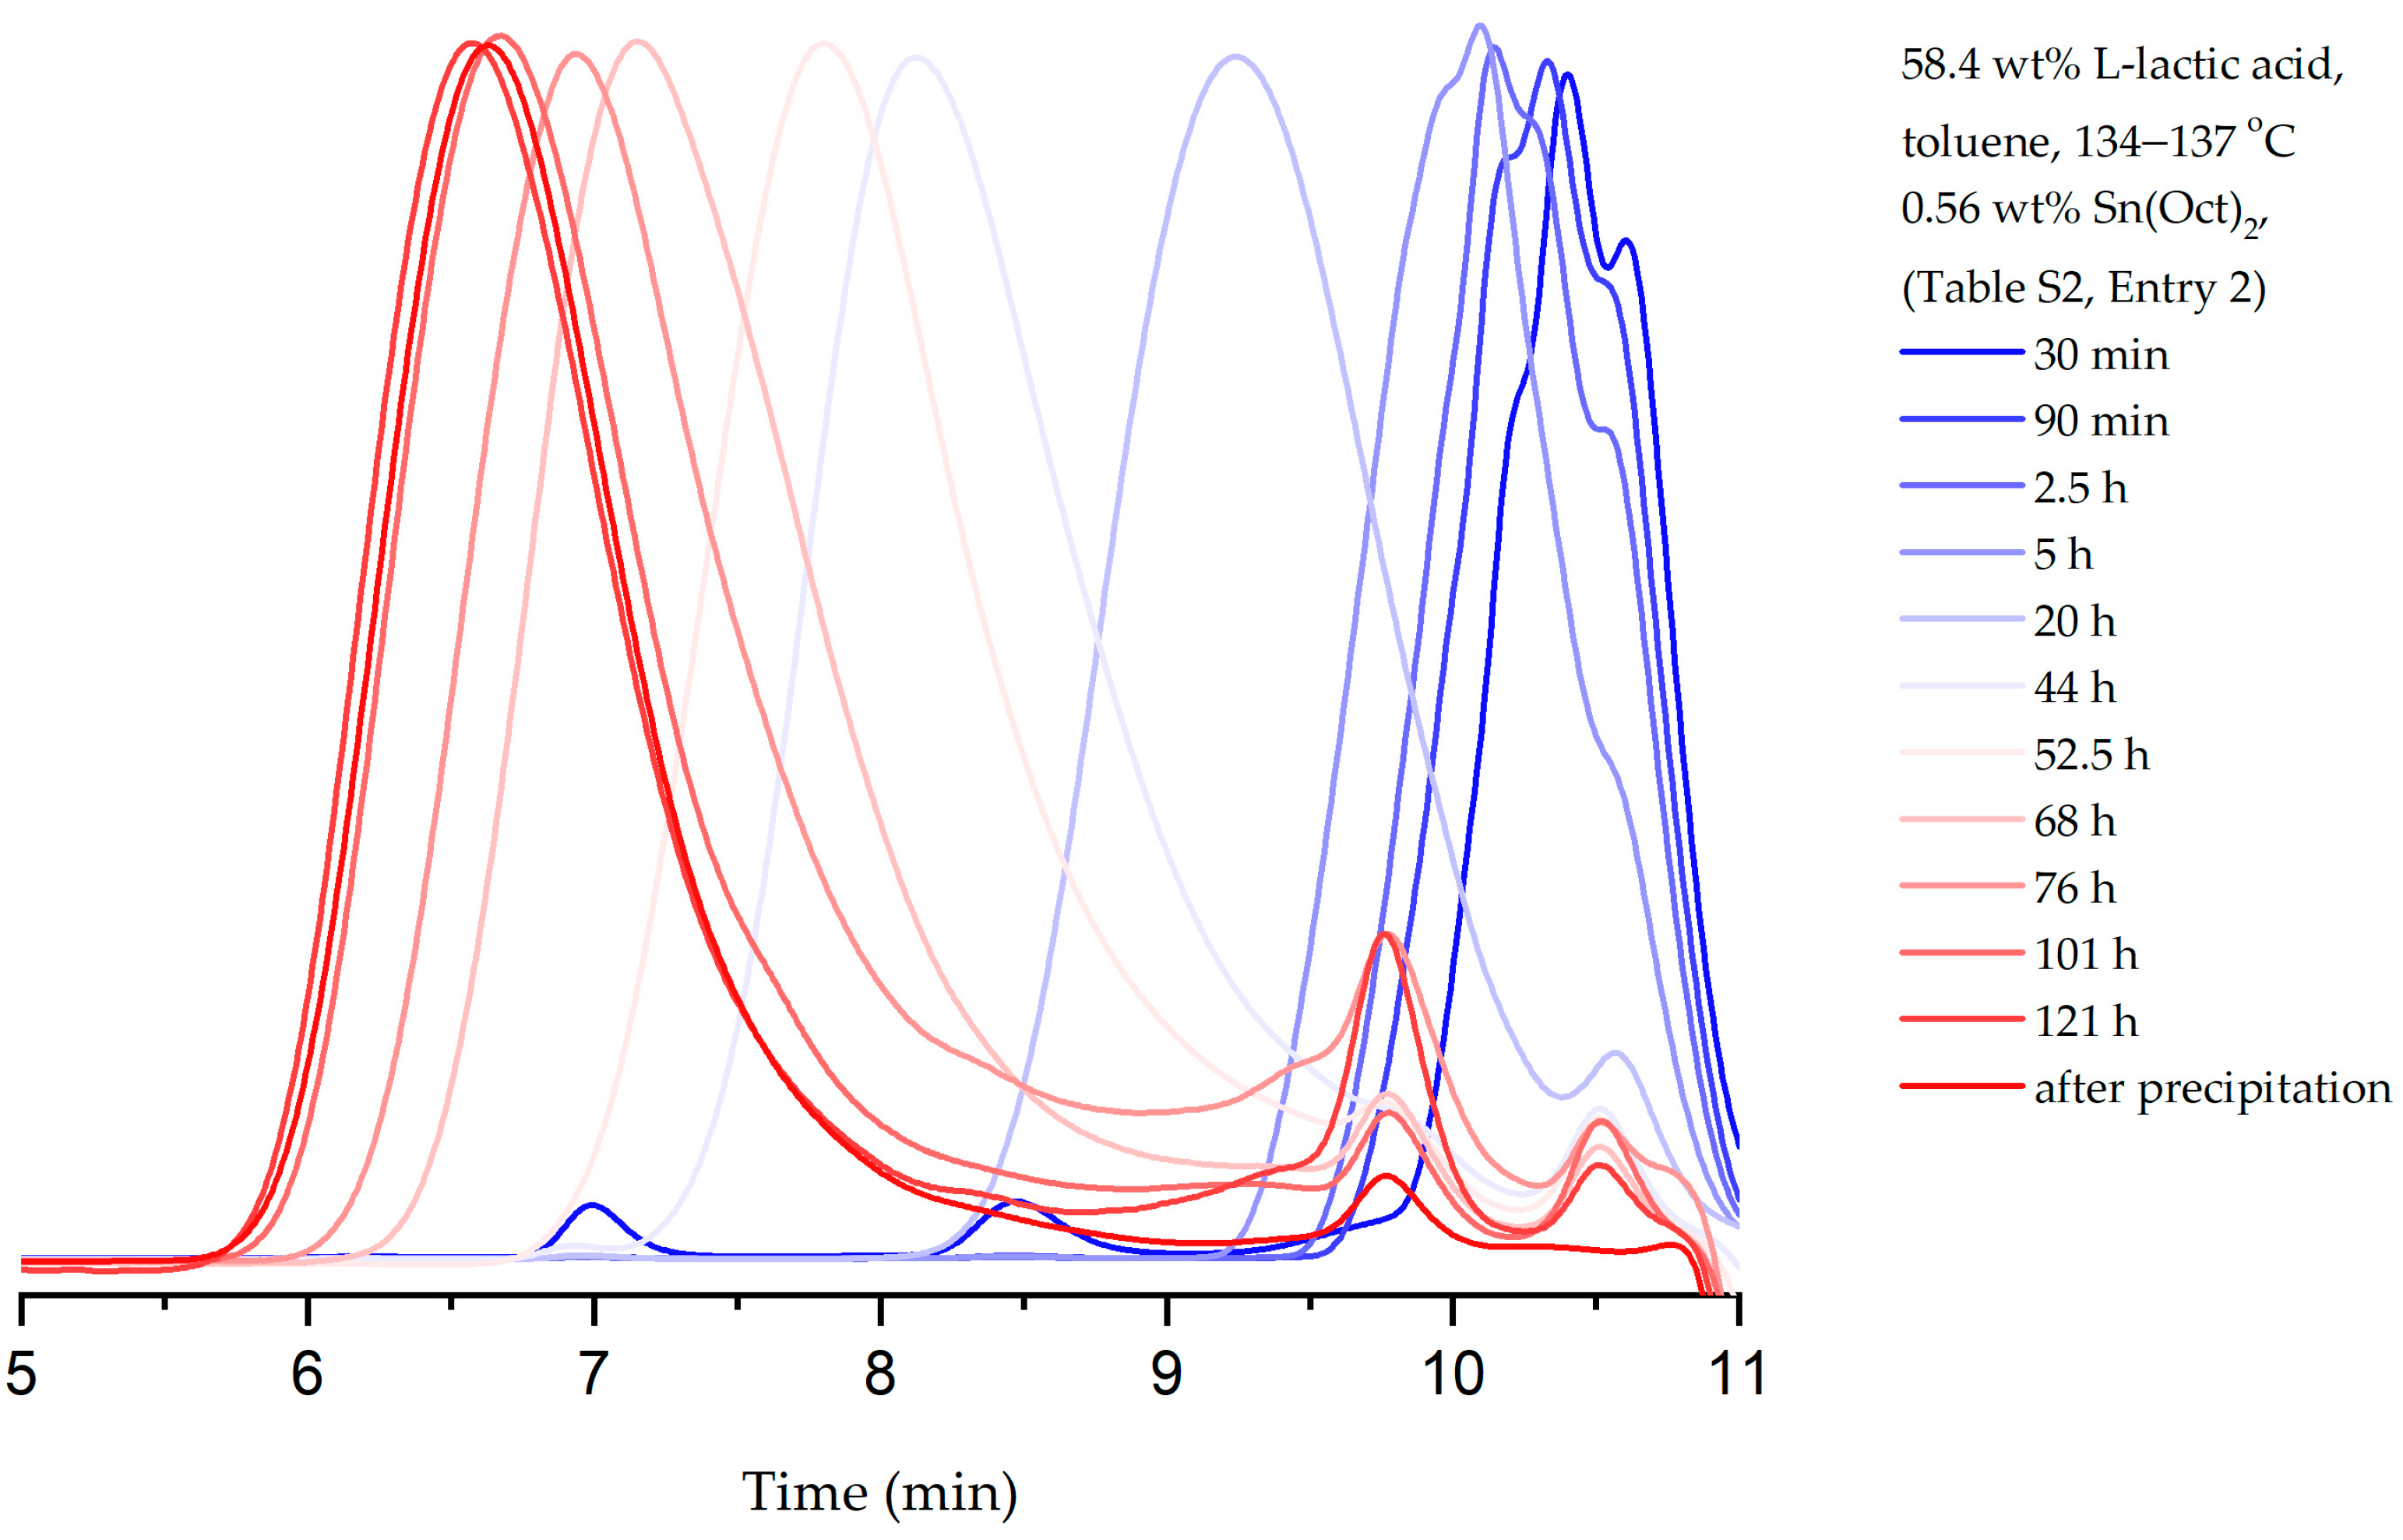
2.1. Experiments
2.2. Kinetic Model
- (a)
- Constants k1 and k−1, are independent of molecular weight, thus reducing the problem size when it comes to the determination of rate constant values that capture the experimental data on polymerization kinetics.
- (b)
- The carboxyl and hydroxyl groups are assumed to be equally reactive; it is also assumed that no autocatalysis occurs, and no side reactions take place.
- (c)
- Moreover, the liquid phase is fully mixed and homogeneous, without temperature or concentration gradients, whereas the volatility of lactic acid and all polymer products is negligible.
- (d)
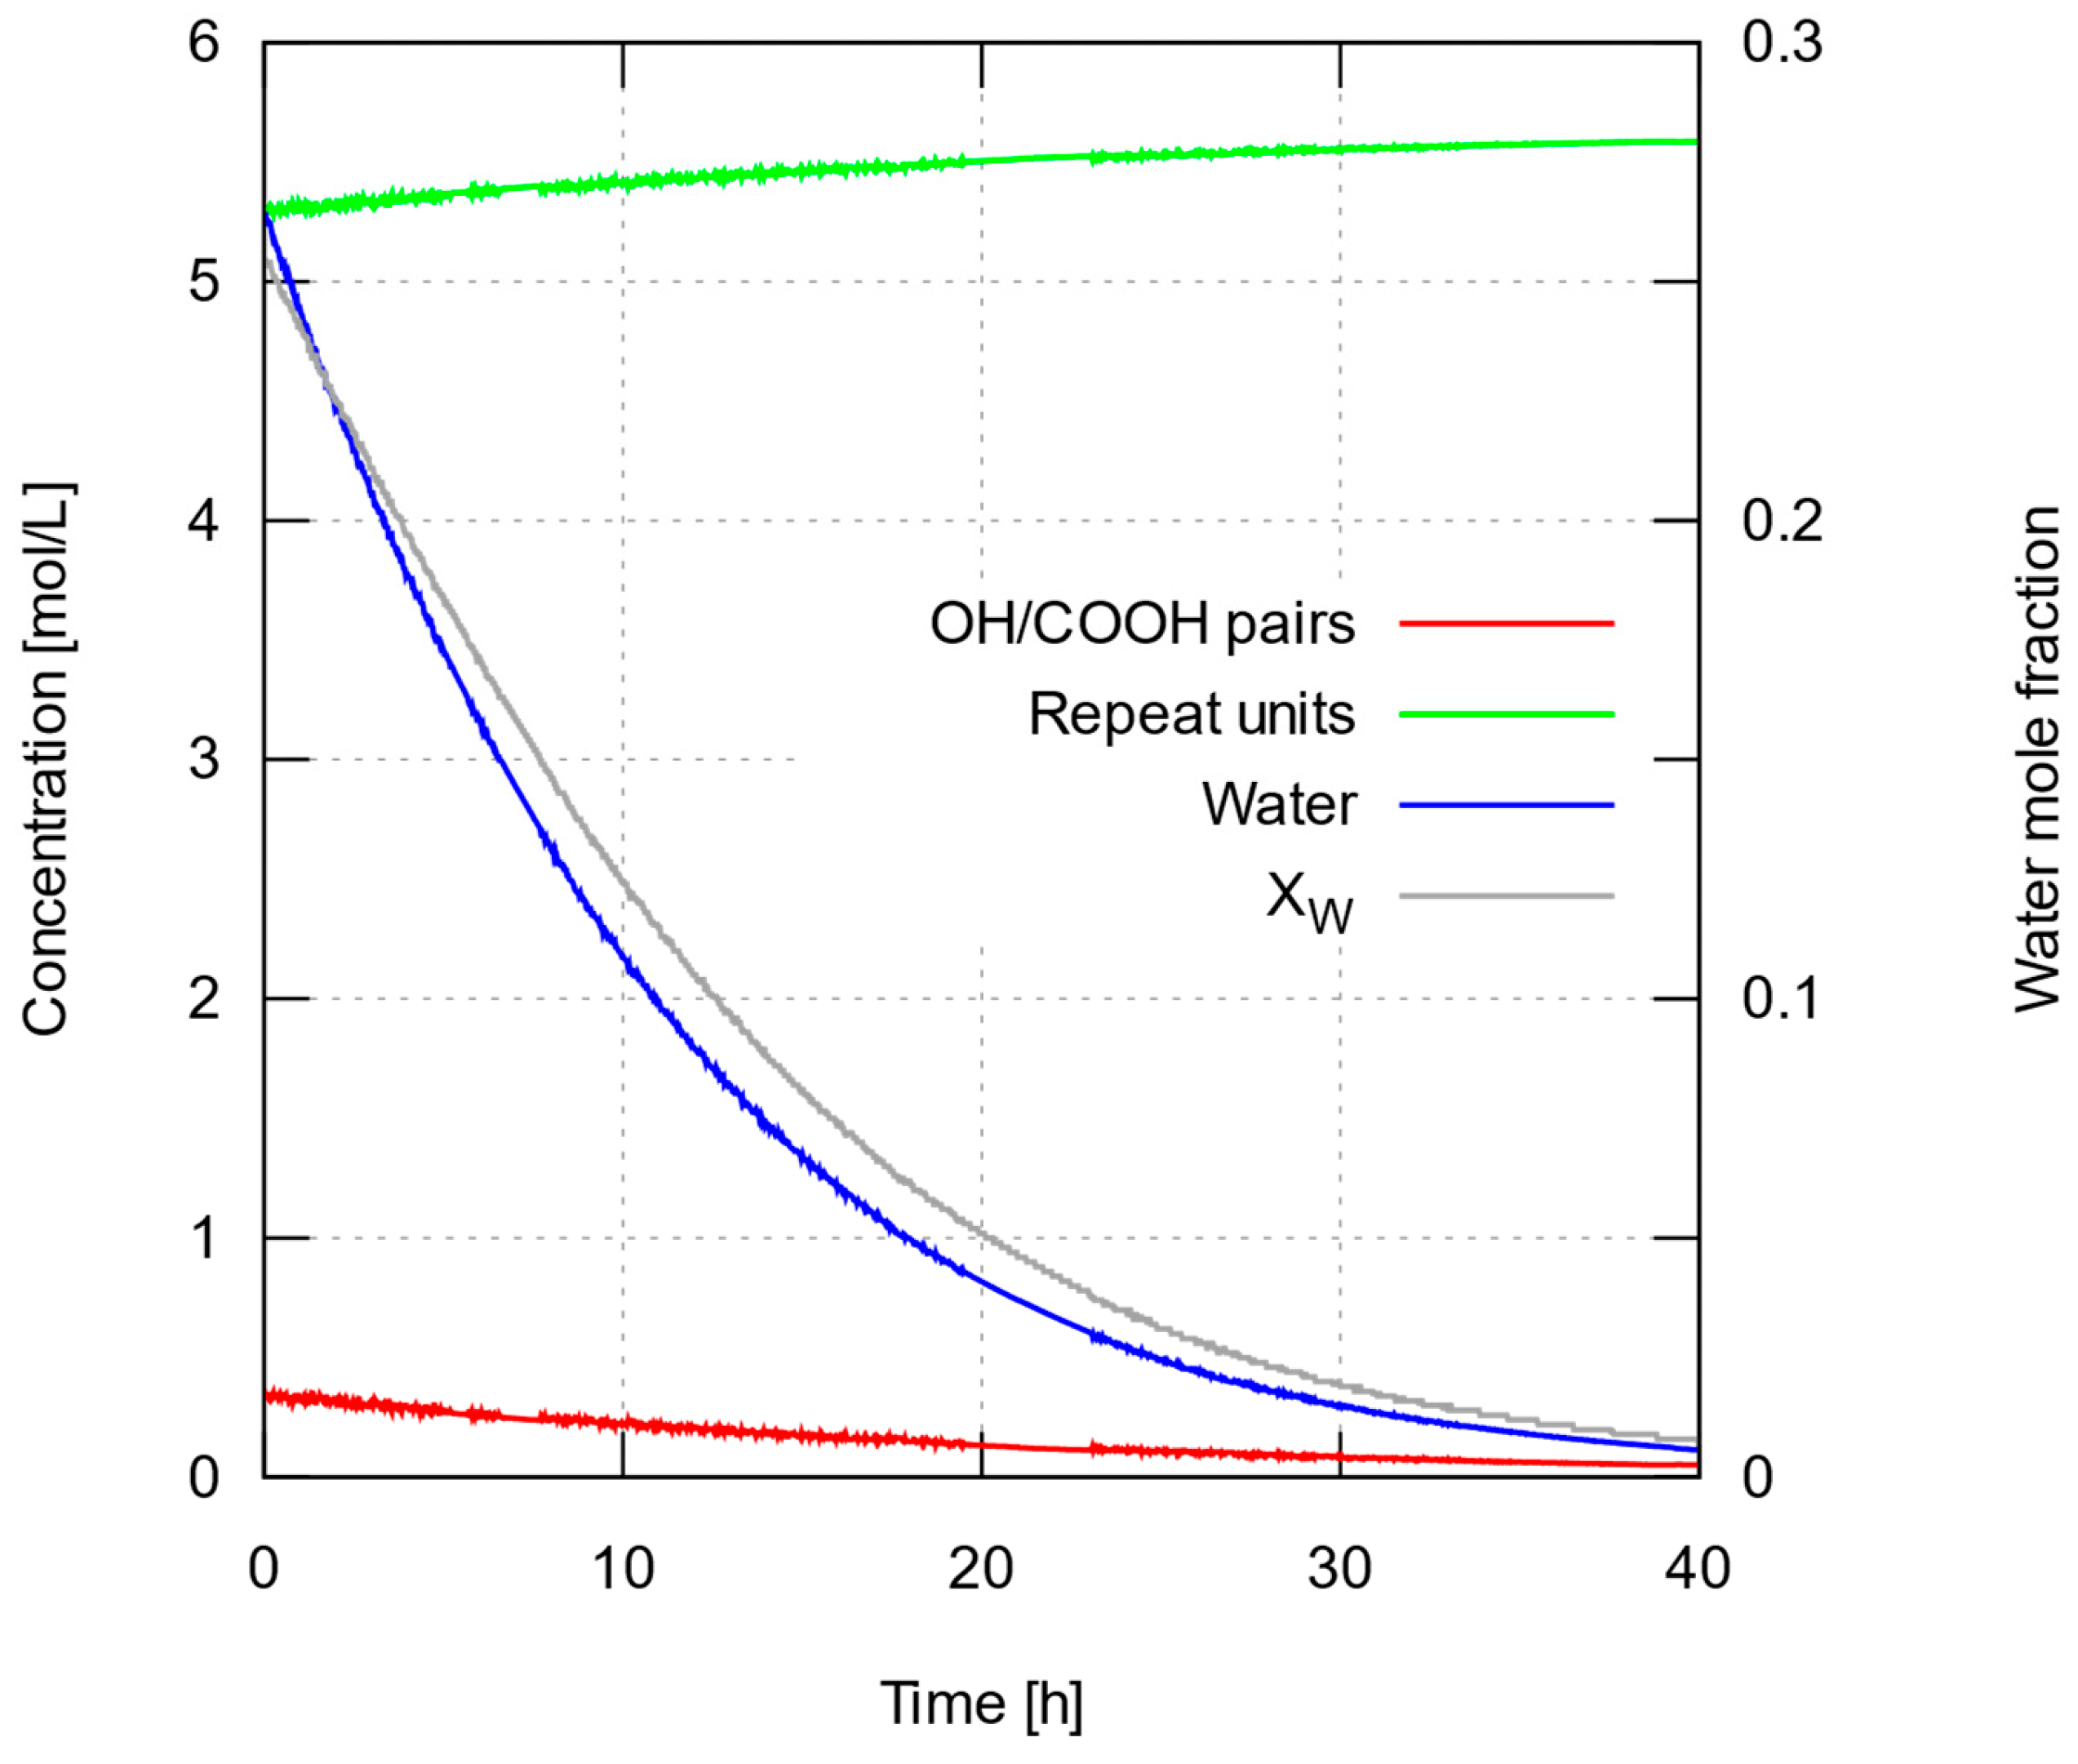
- Finally, we postulate that water is vaporized and removed from the liquid phase at a rate proportional to the liquid’s water mole fraction, xw. Briefly, we assume a driving force proportional to the change in water’s partial pressure between the vapor–liquid interface and the solvent reflux point past the water trap. With the complete removal of water by the water trap, the partial pressure at the reflux point will be zero so the driving force will be proportional to the water’s partial pressure at the liquid–vapor interface. If the water mole fraction in the liquid phase varies within a narrow range of small values during the experiment, then we can assume the vapor’s partial pressure proportional to fugacity, thus to liquid water mole fraction, by a more or less constant coefficient, kw. Under this assumption, the water removal rate becomes independent of the vapor pressure of water and the total pressure of the reactor.
2.3. Simplification
2.4. Numerical Simulations
3. Results and Discussion
3.1. Experiment
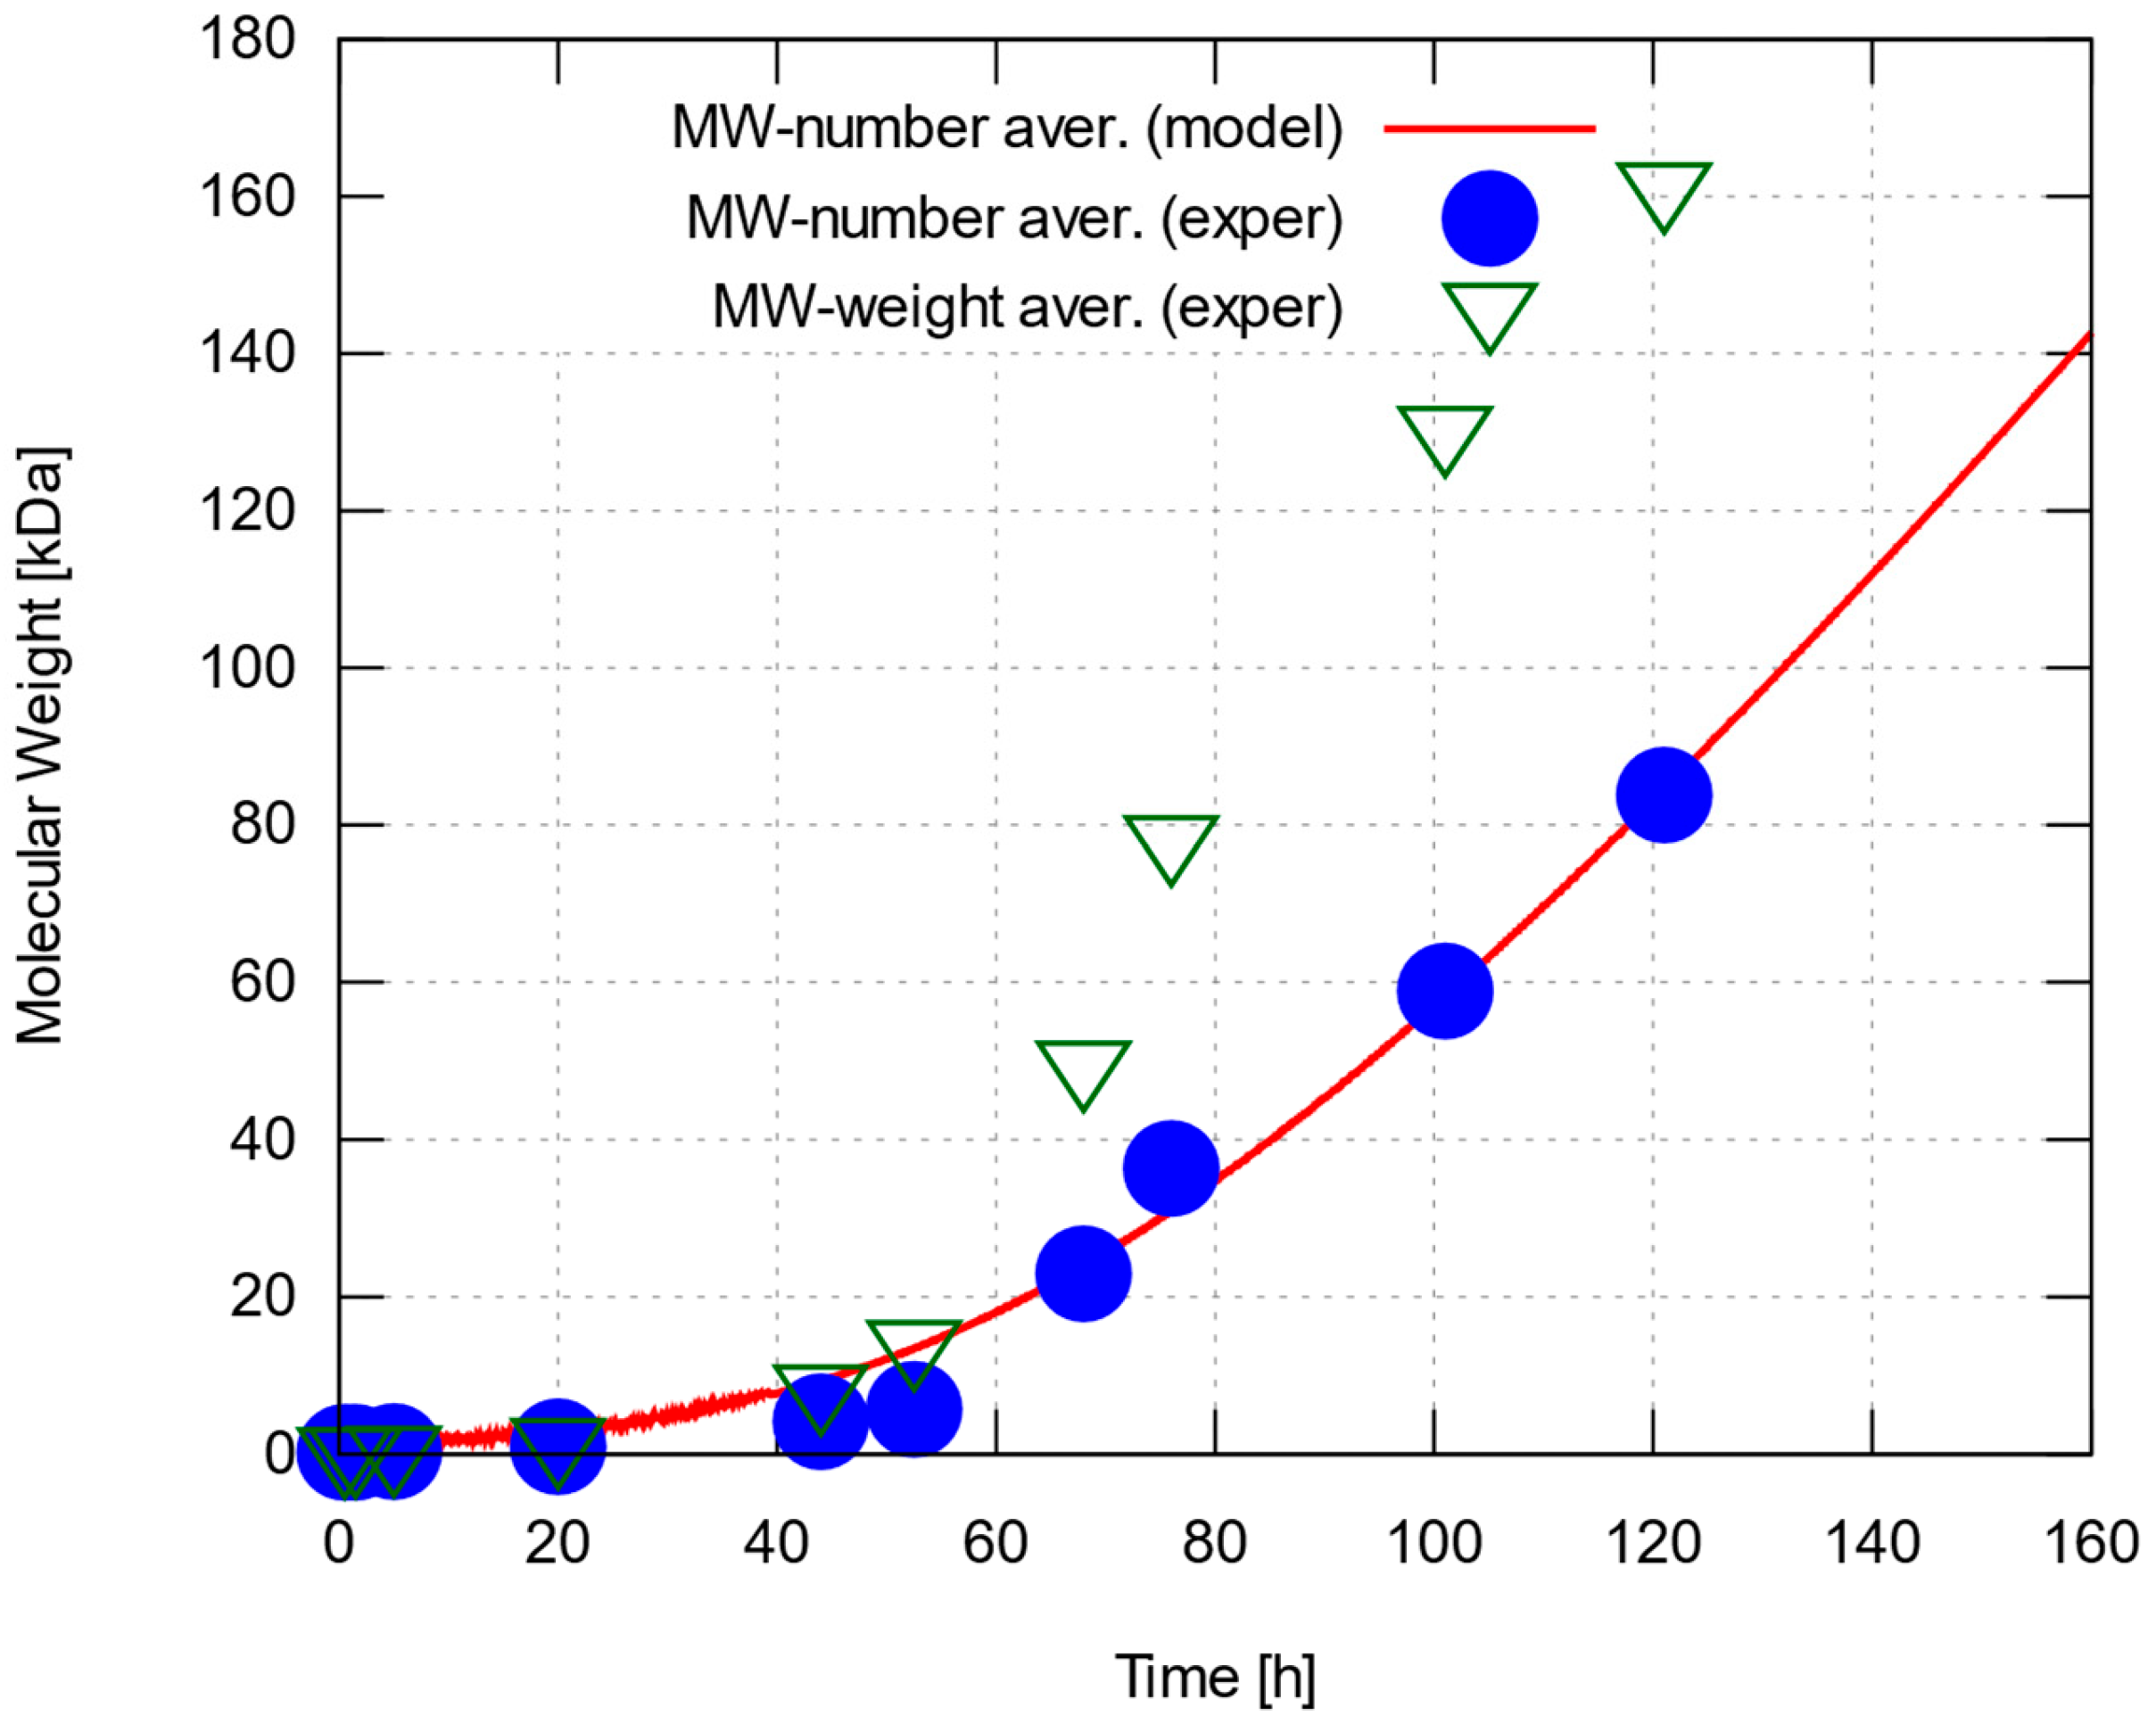
3.2. Modeling
4. Conclusions
Supplementary Materials
Author Contributions
Funding
Institutional Review Board Statement
Data Availability Statement
Conflicts of Interest
Appendix A. Summary of Notation
| Symbol | Meaning | Symbol | Meaning |
| a | Molar concentration of HOOCRi-OH bonds connecting an end hydroxyl group with the rest of a PLA chain | Mn | Number-average molecular weight |
| b | Molar concentration of HORjCOO-H bonds connecting the hydrogen atom of an end carboxyl group with the rest of a PLA chain | Mw | Weight-average molecular weight |
| c | Molar concentration of bonds of a HOOCRi- subchain to a HORjCOO- one, coming about when a HOOCRi-OH bond and a HORjCOO-H one exchange their constituent groups. | N | Number of measurements of molecular weight during PLA polycondensation experiment |
| C | Molar concentration of catalyst in reactant mixture | Pi | Molar concentration of polymer chains with degree of polymerization equal to i. |
| F | Objective function defined as the sum of squares of the deviations of modeling predictions from experimental measurements of number-average molecular weight. | w | Molar concentration of H-OH bonds that link a hydrogen atom with a hydroxyl group to form water, and come about when a HOOCRi-OH bond and a HORjCOO-H one exchange their constituent groups. |
| h | Step used by the numerical solver of the kinetic differential equations | W | Molar concentration of water |
| k1 | Polymerization rate constant | S | Molar concentration of solvent in reactant mixture |
| k−1 | Depolymerization rate constant | xw | Water mole fraction |
| kw | Effective rate constant associated with water removal | t | Time (of experimental measurements and simulation steps, alike) |
References
- Geyer, R.; Jambeck, J.R.; Law, K.L. Production, Use, and Fate of All Plastics Ever Made. Sci. Adv. 2017, 3, e1700782. [Google Scholar] [CrossRef] [PubMed]
- MacLeod, M.; Arp, H.P.H.; Tekman, M.B.; Jahnke, A. The Global Threat from Plastic Pollution. Science 2021, 373, 61–65. [Google Scholar] [CrossRef] [PubMed]
- Horie, K.; Barón, M.; Fox, R.B.; He, J.; Hess, M.; Kahovec, J.; Kitayama, T.; Kubisa, P.; Maréchal, E.; Mormann, W.; et al. Definitions of Terms Relating to Reactions of Polymers and to Functional Polymeric Materials (IUPAC Recommendations 2003). Pure Appl. Chem. 2004, 76, 889–906. [Google Scholar] [CrossRef]
- Sakai, K.; Taniguchi, M.; Miura, S.; Ohara, H.; Matsumoto, T.; Shirai, Y. Making Plastics from Garbage. J. Ind. Ecol. 2003, 7, 63–74. [Google Scholar] [CrossRef]
- Rajendran, N.; Han, J. Integrated Polylactic Acid and Biodiesel Production from Food Waste: Process Synthesis and Economics. Bioresour. Technol. 2022, 343, 126119. [Google Scholar] [CrossRef] [PubMed]
- Avérous, L. Chapter 21—Polylactic Acid: Synthesis, Properties and Applications. In Monomers, Polymers and Composites from Renewable Resources; Belgacem, M.N., Gandini, A., Eds.; Elsevier: Amsterdam, The Netherlands, 2008; pp. 433–450. [Google Scholar] [CrossRef]
- Hiraishi, A. Environmental Applications. In Poly(Lactic Acid); John Wiley & Sons, Ltd.: Hoboken, NJ, USA, 2010; pp. 477–486. [Google Scholar] [CrossRef]
- Ilyas, R.A.; Sapuan, S.M.; Harussani, M.M.; Hakimi, M.Y.a.Y.; Haziq, M.Z.M.; Atikah, M.S.N.; Asyraf, M.R.M.; Ishak, M.R.; Razman, M.R.; Nurazzi, N.M.; et al. Polylactic Acid (PLA) Biocomposite: Processing, Additive Manufacturing and Advanced Applications. Polymers 2021, 13, 1326. [Google Scholar] [CrossRef]
- Ilyas, R.A.; Zuhri, M.Y.M.; Aisyah, H.A.; Asyraf, M.R.M.; Hassan, S.A.; Zainudin, E.S.; Sapuan, S.M.; Sharma, S.; Bangar, S.P.; Jumaidin, R.; et al. Natural Fiber-Reinforced Polylactic Acid, Polylactic Acid Blends and Their Composites for Advanced Applications. Polymers 2022, 14, 202. [Google Scholar] [CrossRef]
- Mochizuki, M. Textile Applications. In Poly(Lactic Acid); John Wiley & Sons, Ltd.: Hoboken, NJ, USA, 2010; pp. 469–476. [Google Scholar] [CrossRef]
- Obuchi, S.; Ogawa, S. Packaging and Other Commercial Applications. In Poly(Lactic Acid); John Wiley & Sons, Ltd.: Hoboken, NJ, USA, 2010; pp. 457–467. [Google Scholar] [CrossRef]
- Suzuki, S.; Ikada, Y. Medical Applications. In Poly(Lactic Acid); John Wiley & Sons, Ltd.: Hoboken, NJ, USA, 2010; pp. 443–456. [Google Scholar] [CrossRef]
- Singhvi, M.S.; Zinjarde, S.S.; Gokhale, D.V. Polylactic Acid: Synthesis and Biomedical Applications. J. Appl. Microbiol. 2019, 127, 1612–1626. [Google Scholar] [CrossRef]
- Bagheri, A.R.; Laforsch, C.; Greiner, A.; Agarwal, S. Fate of So-Called Biodegradable Polymers in Seawater and Freshwater. Glob. Chall. 2017, 1, 1700048. [Google Scholar] [CrossRef]
- Pantani, R.; Sorrentino, A. Influence of Crystallinity on the Biodegradation Rate of Injection-Moulded Poly(Lactic Acid) Samples in Controlled Composting Conditions. Polym. Degrad. Stab. 2013, 98, 1089–1096. [Google Scholar] [CrossRef]
- Iovino, R.; Zullo, R.; Rao, M.A.; Cassar, L.; Gianfreda, L. Biodegradation of Poly(Lactic Acid)/Starch/Coir Biocomposites under Controlled Composting Conditions. Polym. Degrad. Stab. 2008, 93, 147–157. [Google Scholar] [CrossRef]
- Gorrasi, G.; Pantani, R. Hydrolysis and Biodegradation of Poly(Lactic Acid). In Synthesis, Structure and Properties of Poly(lactic acid); Di Lorenzo, M.L., Androsch, R., Eds.; Advances in Polymer Science; Springer International Publishing: Cham, Switzerland, 2018; pp. 119–151. [Google Scholar] [CrossRef]
- Narayan, R. Carbon Footprint of Bioplastics Using Biocarbon Content Analysis and Life-Cycle Assessment. MRS Bull. 2011, 36, 716–721. [Google Scholar] [CrossRef]
- Polylactic Acid Market. Available online: https://www.futuremarketinsights.com/reports/polylactic-acid-market (accessed on 2 February 2023).
- Yu, J.; Xu, S.; Liu, B.; Wang, H.; Qiao, F.; Ren, X.; Wei, Q. PLA Bioplastic Production: From Monomer to the Polymer. Eur. Polym. J. 2023, 193, 112076. [Google Scholar] [CrossRef]
- Chen, G.-Q.; Patel, M.K. Plastics Derived from Biological Sources: Present and Future: A Technical and Environmental Review. Chem. Rev. 2012, 112, 2082–2099. [Google Scholar] [CrossRef] [PubMed]
- Casalini, T.; Rossi, F.; Castrovinci, A.; Perale, G. A Perspective on Polylactic Acid-Based Polymers Use for Nanoparticles Synthesis and Applications. Front. Bioeng. Biotechnol. 2019, 7, 259. [Google Scholar] [CrossRef]
- Pholharn, D.; Srithep, Y.; Morris, J. Effect of Initiators on Synthesis of Poly(L-Lactide) by Ring Opening Polymerization. IOP Conf. Ser. Mater. Sci. Eng. 2017, 213, 012022. [Google Scholar] [CrossRef]
- Lee, H.W.; Insyani, R.; Prasetyo, D.; Prajitno, H.; Sitompul, J.P. Molecular Weight and Structural Properties of Biodegradable PLA Synthesized with Different Catalysts by Direct Melt Polycondensation. J. Eng. Technol. Sci. 2015, 47, 364–373. [Google Scholar] [CrossRef]
- Gruber, P.R.; Hall, E.S.; Kolstad, J.J.; Iwen, M.L.; Benson, R.D.; Borchardt, R.L. Continuous Process for the Manufacture of Lactide and Lactide Polymers. U.S. Patent US6326458B1, 4 December 2001. Available online: https://patents.google.com/patent/US6326458B1/en (accessed on 2 February 2023).
- Degée, P.; Dubois, P.; Jérǒme, R.; Jacobsen, S.; Fritz, H.-G. New Catalysis for Fast Bulk Ring-Opening Polymerization of Lactide Monomers. Macromol. Sympos. 1999, 144, 289–302. [Google Scholar] [CrossRef]
- Omay, D.; Guvenilir, Y. Synthesis and Characterization of Poly(D,L-Lactic Acid) via Enzymatic Ring Opening Polymerization by Using Free and Immobilized Lipase. Biocatal. Biotransform. 2013, 31, 132–140. [Google Scholar] [CrossRef]
- Pivsa-Art, S.; Tong-ngok, T.; Junngam, S.; Wongpajan, R.; Pivsa-Art, W. Synthesis of Poly(D-Lactic Acid) Using a 2-Steps Direct Polycondensation Process. Energy Procedia 2013, 34, 604–609. [Google Scholar] [CrossRef]
- Chafran, L.S.; Paiva, M.F.; França, J.O.C.; Sales, M.J.A.; Dias, S.C.L.; Dias, J.A. Preparation of PLA Blends by Polycondensation of D,L-Lactic Acid Using Supported 12-Tungstophosphoric Acid as a Heterogeneous Catalyst. Heliyon 2019, 5, e01810. [Google Scholar] [CrossRef] [PubMed]
- Kim, K.W.; Woo, S.I. Synthesis of High-Molecular-Weight Poly(L-Lactic Acid) by Direct Polycondensation. Macromol. Chem. Phys. 2002, 203, 2245–2250. [Google Scholar] [CrossRef]
- Dutkiewicz, S.; Grochowska-Łapienis, D.; Tomaszewski, W. Synthesis of Poly(L(+) Lactic Acid) by Polycondensation Method in Solution. Fibres Text. East. Eur. 2003, 11, 66–70. [Google Scholar]
- Ajioka, M.; Enomoto, K.; Suzuki, K.; Yamaguchi, A. The Basic Properties of Poly(Lactic Acid) Produced by the Direct Condensation Polymerization of Lactic Acid. J. Environ. Polym. Degrad. 1995, 3, 225–234. [Google Scholar] [CrossRef]
- Cadar, O.; Cadar, S.; Senila, M.; Majdik, C.; Roman, C. Synthesis of Poly(l-Lactic Acid) by Direct Polycondensation. Stud. Univ. Babeș-Bolyai. Chem. 2011, 56, 57–64. [Google Scholar]
- Dubois, P.; Jacobs, C.; Jerome, R.; Teyssie, P. Macromolecular Engineering of Polylactones and Polylactides. 4. Mechanism and Kinetics of Lactide Homopolymerization by Aluminum Isopropoxide. Macromolecules 1991, 24, 2266–2270. [Google Scholar] [CrossRef]
- Witzke, D.R.; Narayan, R.; Kolstad, J.J. Reversible Kinetics and Thermodynamics of the Homopolymerization of L-Lactide with 2-Ethylhexanoic Acid Tin(II) Salt. Macromolecules 1997, 30, 7075–7085. [Google Scholar] [CrossRef]
- Dubey, S.P.; Abhyankar, H.; Marchante, V.; Brighton, J.; Bergmann, B. Mathematical Modeling for Continuous Reactive Extrusion of Poly Lactic Acid Formation by Ring Opening Polymerization Considering Metal/Organic Catalyst and Alternative Energies. World Acad. Sci. Eng. Technol. 2015, 9, 329–333. [Google Scholar] [CrossRef]
- Dubey, S.P.; Abhyankar, H.A.; Marchante, V.; Brighton, J.L.; Blackburn, K.; Temple, C.; Bergmann, B.; Trinh, G.; David, C. Modelling and Validation of Synthesis of Poly Lactic Acid Using an Alternative Energy Source through a Continuous Reactive Extrusion Process. Polymers 2016, 8, 164. [Google Scholar] [CrossRef]
- Mehta, R.; Kumar, V.; Upadhyay, S.N. Mathematical Modeling of the Poly(Lactic Acid) Ring–Opening Polymerization Kinetics. Polym. Plast. Technol. Eng. 2007, 46, 257–264. [Google Scholar] [CrossRef]
- Dotson, N.A.; Galvan, R.; Laurence, R.L.; Tirrell, M. Polymerization Process Modeling; John Wiley & Sons, Ltd.: Hoboken, NJ, USA, 1996. [Google Scholar]
- Harshe, Y.M.; Storti, G.; Morbidelli, M.; Gelosa, S.; Moscatelli, D. Polycondensation Kinetics of Lactic Acid. Macromol. React. Eng. 2007, 1, 611–621. [Google Scholar] [CrossRef]
- Nelder, J.A.; Mead, R. A Simplex Method for Function Minimization. Comput. J. 1965, 7, 308–313. [Google Scholar] [CrossRef]
- Papageorgiou, D.G.; Demetropoulos, I.N.; Lagaris, I.E. MERLIN-3.1.1. A New Version of the Merlin Optimization Environment. Comput. Phys. Commun. 2004, 159, 70–71. [Google Scholar] [CrossRef]
- Ramis-Ramos, G. ANTIOXIDANTS/Synthetic Antioxidants. In Encyclopedia of Food Sciences and Nutrition, 2nd ed.; Caballero, B., Ed.; Academic Press: Oxford, UK, 2003; pp. 265–275. [Google Scholar] [CrossRef]
- Ghadamyari, M.; Chaemchuen, S.; Zhou, K.; Dusselier, M.; Sels, B.F.; Mousavi, B.; Verpoort, F. One-Step Synthesis of Stereo-Pure l,l Lactide from l-Lactic Acid. Catal. Commun. 2018, 114, 33–36. [Google Scholar] [CrossRef]
- Wang, Y.; Steinhoff, B.; Brinkmann, C.; Alig, I. In-Line Monitoring of the Thermal Degradation of Poly(l-Lactic Acid) during Melt Extrusion by UV–Vis Spectroscopy. Polymer 2008, 49, 1257–1265. [Google Scholar] [CrossRef]
- Feng, L.; Feng, S.; Bian, X.; Li, G.; Chen, X. Pyrolysis Mechanism of Poly(Lactic Acid) for Giving Lactide under the Catalysis of Tin. Polym. Degrad. Stab. 2018, 157, 212–223. [Google Scholar] [CrossRef]
- Ramírez-Herrera, C.A.; Flores-Vela, A.I.; Torres-Huerta, A.M.; Domínguez-Crespo, M.A.; Palma-Ramírez, D. PLA Degradation Pathway Obtained from Direct Polycondensation of 2-Hydroxypropanoic Acid Using Different Chain Extenders. J. Mater. Sci. 2018, 53, 10846–10871. [Google Scholar] [CrossRef]
- Garlotta, D. A Literature Review of Poly(Lactic Acid). J. Polym. Environ. 2001, 9, 63–84. [Google Scholar] [CrossRef]
- Singh, S.K.; Anthony, P. High Molecular Weight Polylactic Acid Synthesized by Applying Different Binary Catalyst. Int. J. Chem. Pharm. Sci. 2016, 4, 517–521. [Google Scholar] [CrossRef]
- Liu, C.; Jia, Y.; He, A. Preparation of Higher Molecular Weight Poly (L-Lactic Acid) by Chain Extension. Int. J. Polym. Sci. 2013, 2013, e315917. [Google Scholar] [CrossRef]
- Jalali, A.; Huneault, M.A.; Elkoun, S. Effect of Thermal History on Nucleation and Crystallization of Poly(Lactic Acid). J. Mater. Sci. 2016, 51, 7768–7779. [Google Scholar] [CrossRef]
- Fehri, S.; Cinelli, P.; Coltelli, M.-B.; Anguillesi, I.; Lazzeri, A. Thermal Properties of Plasticized Poly (Lactic Acid) (PLA) Containing Nucleating Agent. IJCEA 2016, 7, 85–88. [Google Scholar] [CrossRef]
- Murmu, U.K.; Adhikari, J.; Naskar, A.; Dey, D.; Roy, A.; Ghosh, A.; Ghosh, M. Mechanical Properties of Crystalline and Semicrystalline Polymer Systems. In Encyclopedia of Materials: Plastics and Polymers; Hashmi, M.S.J., Ed.; Elsevier: Oxford, UK, 2022; pp. 917–927. [Google Scholar] [CrossRef]
- Ahmed, A.K.; Atiqullah, M.; Pradhan, D.R.; Al-Harthi, M.A. Crystallization and Melting Behavior of I-PP: A Perspective from Flory’s Thermodynamic Equilibrium Theory and DSC Experiment. RSC Adv. 2017, 7, 42491–42504. [Google Scholar] [CrossRef]
- Yasuniwa, M.; Sakamo, K.; Ono, Y.; Kawahara, W. Melting Behavior of Poly(l-Lactic Acid): X-Ray and DSC Analyses of the Melting Process. Polymer 2008, 49, 1943–1951. [Google Scholar] [CrossRef]
- Zhou, H.; Green, T.B.; Joo, Y.L. The Thermal Effects on Electrospinning of Polylactic Acid Melts. Polymer 2006, 47, 7497–7505. [Google Scholar] [CrossRef]
- Yasuniwa, M.; Tsubakihara, S.; Iura, K.; Ono, Y.; Dan, Y.; Takahashi, K. Crystallization Behavior of Poly(l-Lactic Acid). Polymer 2006, 47, 7554–7563. [Google Scholar] [CrossRef]
- Dorgan, J.R.; Williams, J.S.; Lewis, D.N. Melt rheology of poly(lactic acid): Entanglement and chain architecture effects. J. Rheol. 1999, 43, 1141–1151. [Google Scholar] [CrossRef]


| Polymerization Rate Constant, k1 [L mol−1 s−1] [a] | Depolymerization Rate Constant, k−1 [L mol−1 s−1] [a] | Equilibrium Constant keq = k1/k−1 | Water Removal Effective Coefficient, kw |
|---|---|---|---|
| For lower bound of estimated initial dry LA mass (5.58 g) | |||
| ≤15.94 | ≤6.48 × 10⁻² | 246.0 | 4.34 × 10⁻⁴ |
| For intermediate estimated initial dry LA mass (6.75 g) | |||
| ≤16.47 | ≤7.14 × 10⁻² | 230.7 | 4.76 × 10⁻⁴ |
| For upper bound of estimated initial dry LA mass (7.11 g) | |||
| ≤15.06 | <6.47 × 10⁻² | 232.8 | 4.85 × 10⁻⁴ |
Disclaimer/Publisher’s Note: The statements, opinions and data contained in all publications are solely those of the individual author(s) and contributor(s) and not of MDPI and/or the editor(s). MDPI and/or the editor(s) disclaim responsibility for any injury to people or property resulting from any ideas, methods, instructions or products referred to in the content. |
© 2023 by the authors. Licensee MDPI, Basel, Switzerland. This article is an open access article distributed under the terms and conditions of the Creative Commons Attribution (CC BY) license (https://creativecommons.org/licenses/by/4.0/).
Share and Cite
Theodorou, A.; Raptis, V.; Baltzaki, C.I.M.; Manios, T.; Harmandaris, V.; Velonia, K. Synthesis and Modeling of Poly(L-lactic acid) via Polycondensation of L-Lactic Acid. Polymers 2023, 15, 4569. https://doi.org/10.3390/polym15234569
Theodorou A, Raptis V, Baltzaki CIM, Manios T, Harmandaris V, Velonia K. Synthesis and Modeling of Poly(L-lactic acid) via Polycondensation of L-Lactic Acid. Polymers. 2023; 15(23):4569. https://doi.org/10.3390/polym15234569
Chicago/Turabian StyleTheodorou, Alexis, Vasilios Raptis, Chrissie Isabella Maria Baltzaki, Thrassyvoulos Manios, Vagelis Harmandaris, and Kelly Velonia. 2023. "Synthesis and Modeling of Poly(L-lactic acid) via Polycondensation of L-Lactic Acid" Polymers 15, no. 23: 4569. https://doi.org/10.3390/polym15234569
APA StyleTheodorou, A., Raptis, V., Baltzaki, C. I. M., Manios, T., Harmandaris, V., & Velonia, K. (2023). Synthesis and Modeling of Poly(L-lactic acid) via Polycondensation of L-Lactic Acid. Polymers, 15(23), 4569. https://doi.org/10.3390/polym15234569