
Composites with Re-Entrant Lattice: Effect of Filler on Auxetic Behaviour


Abstract
:1. Introduction
2. Materials and Methods
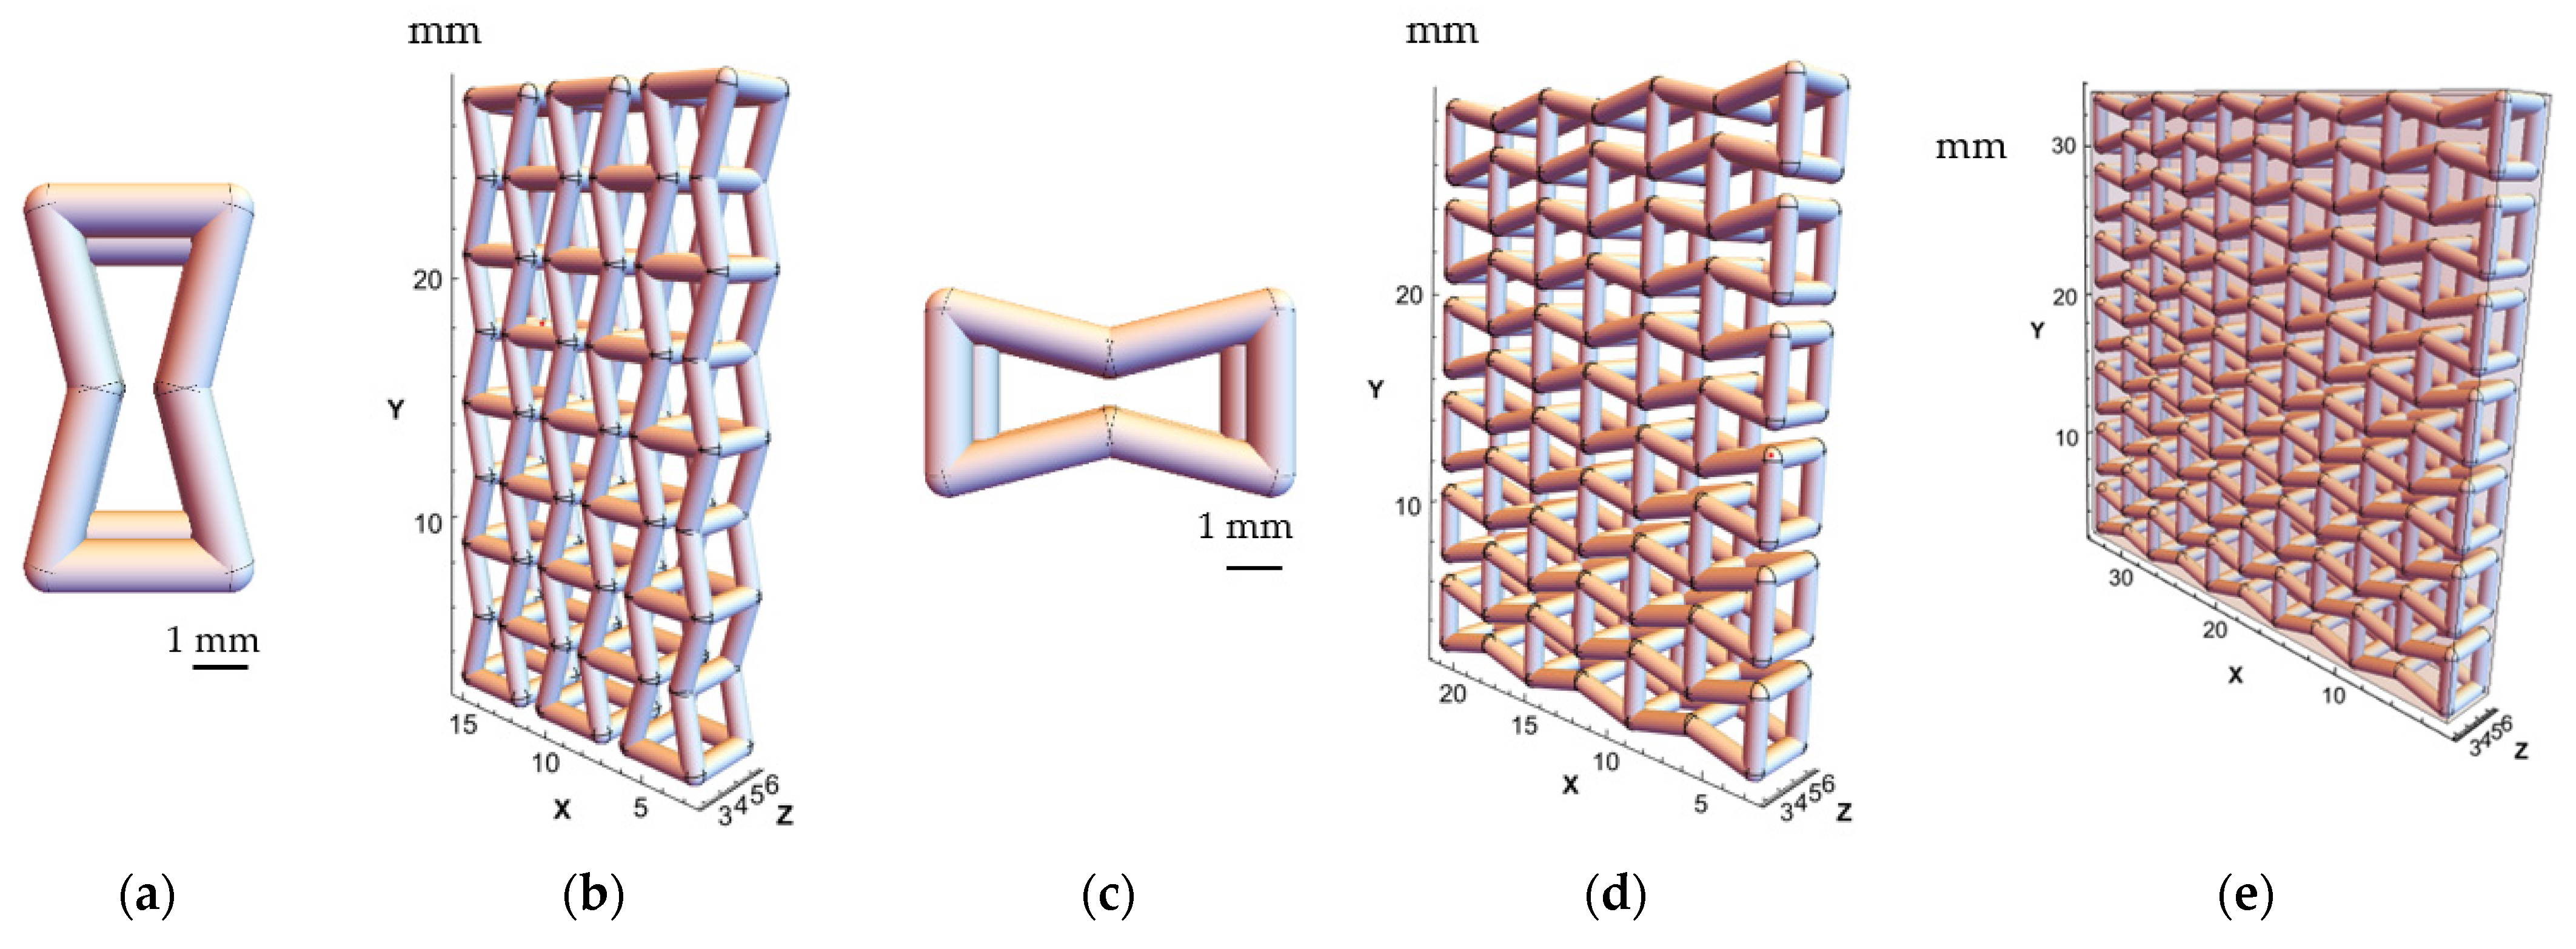
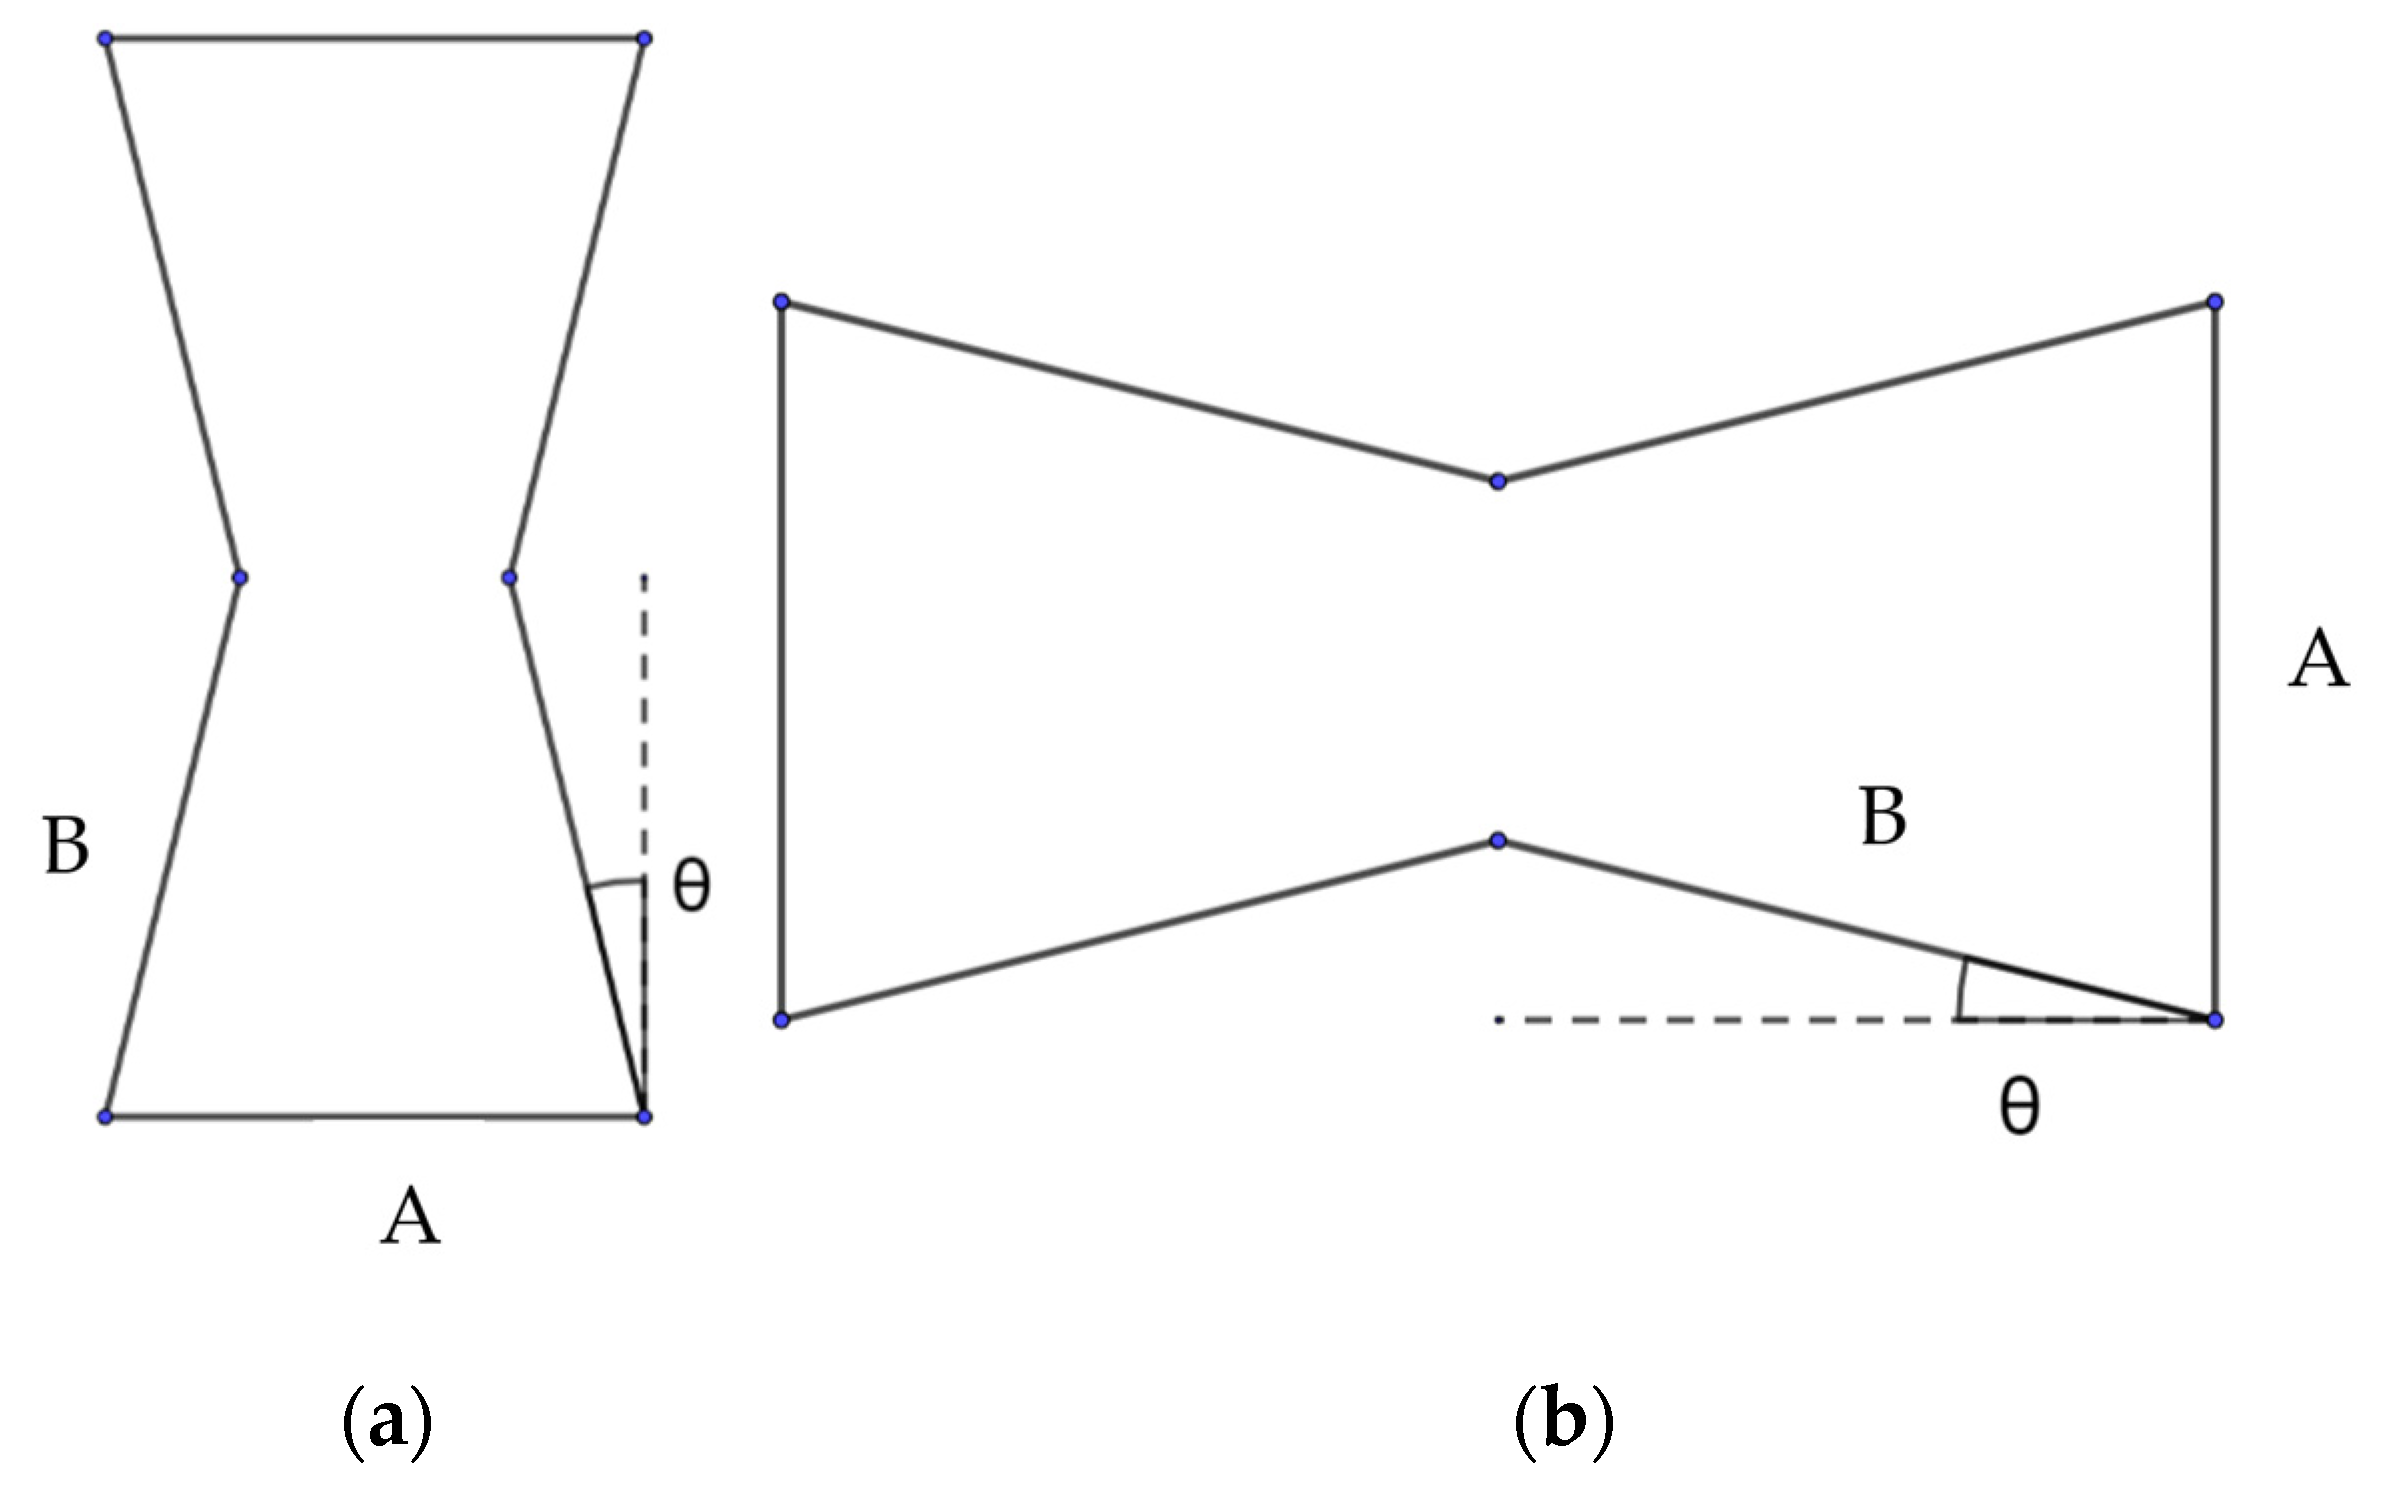
2.1. Design of Auxetic Structures
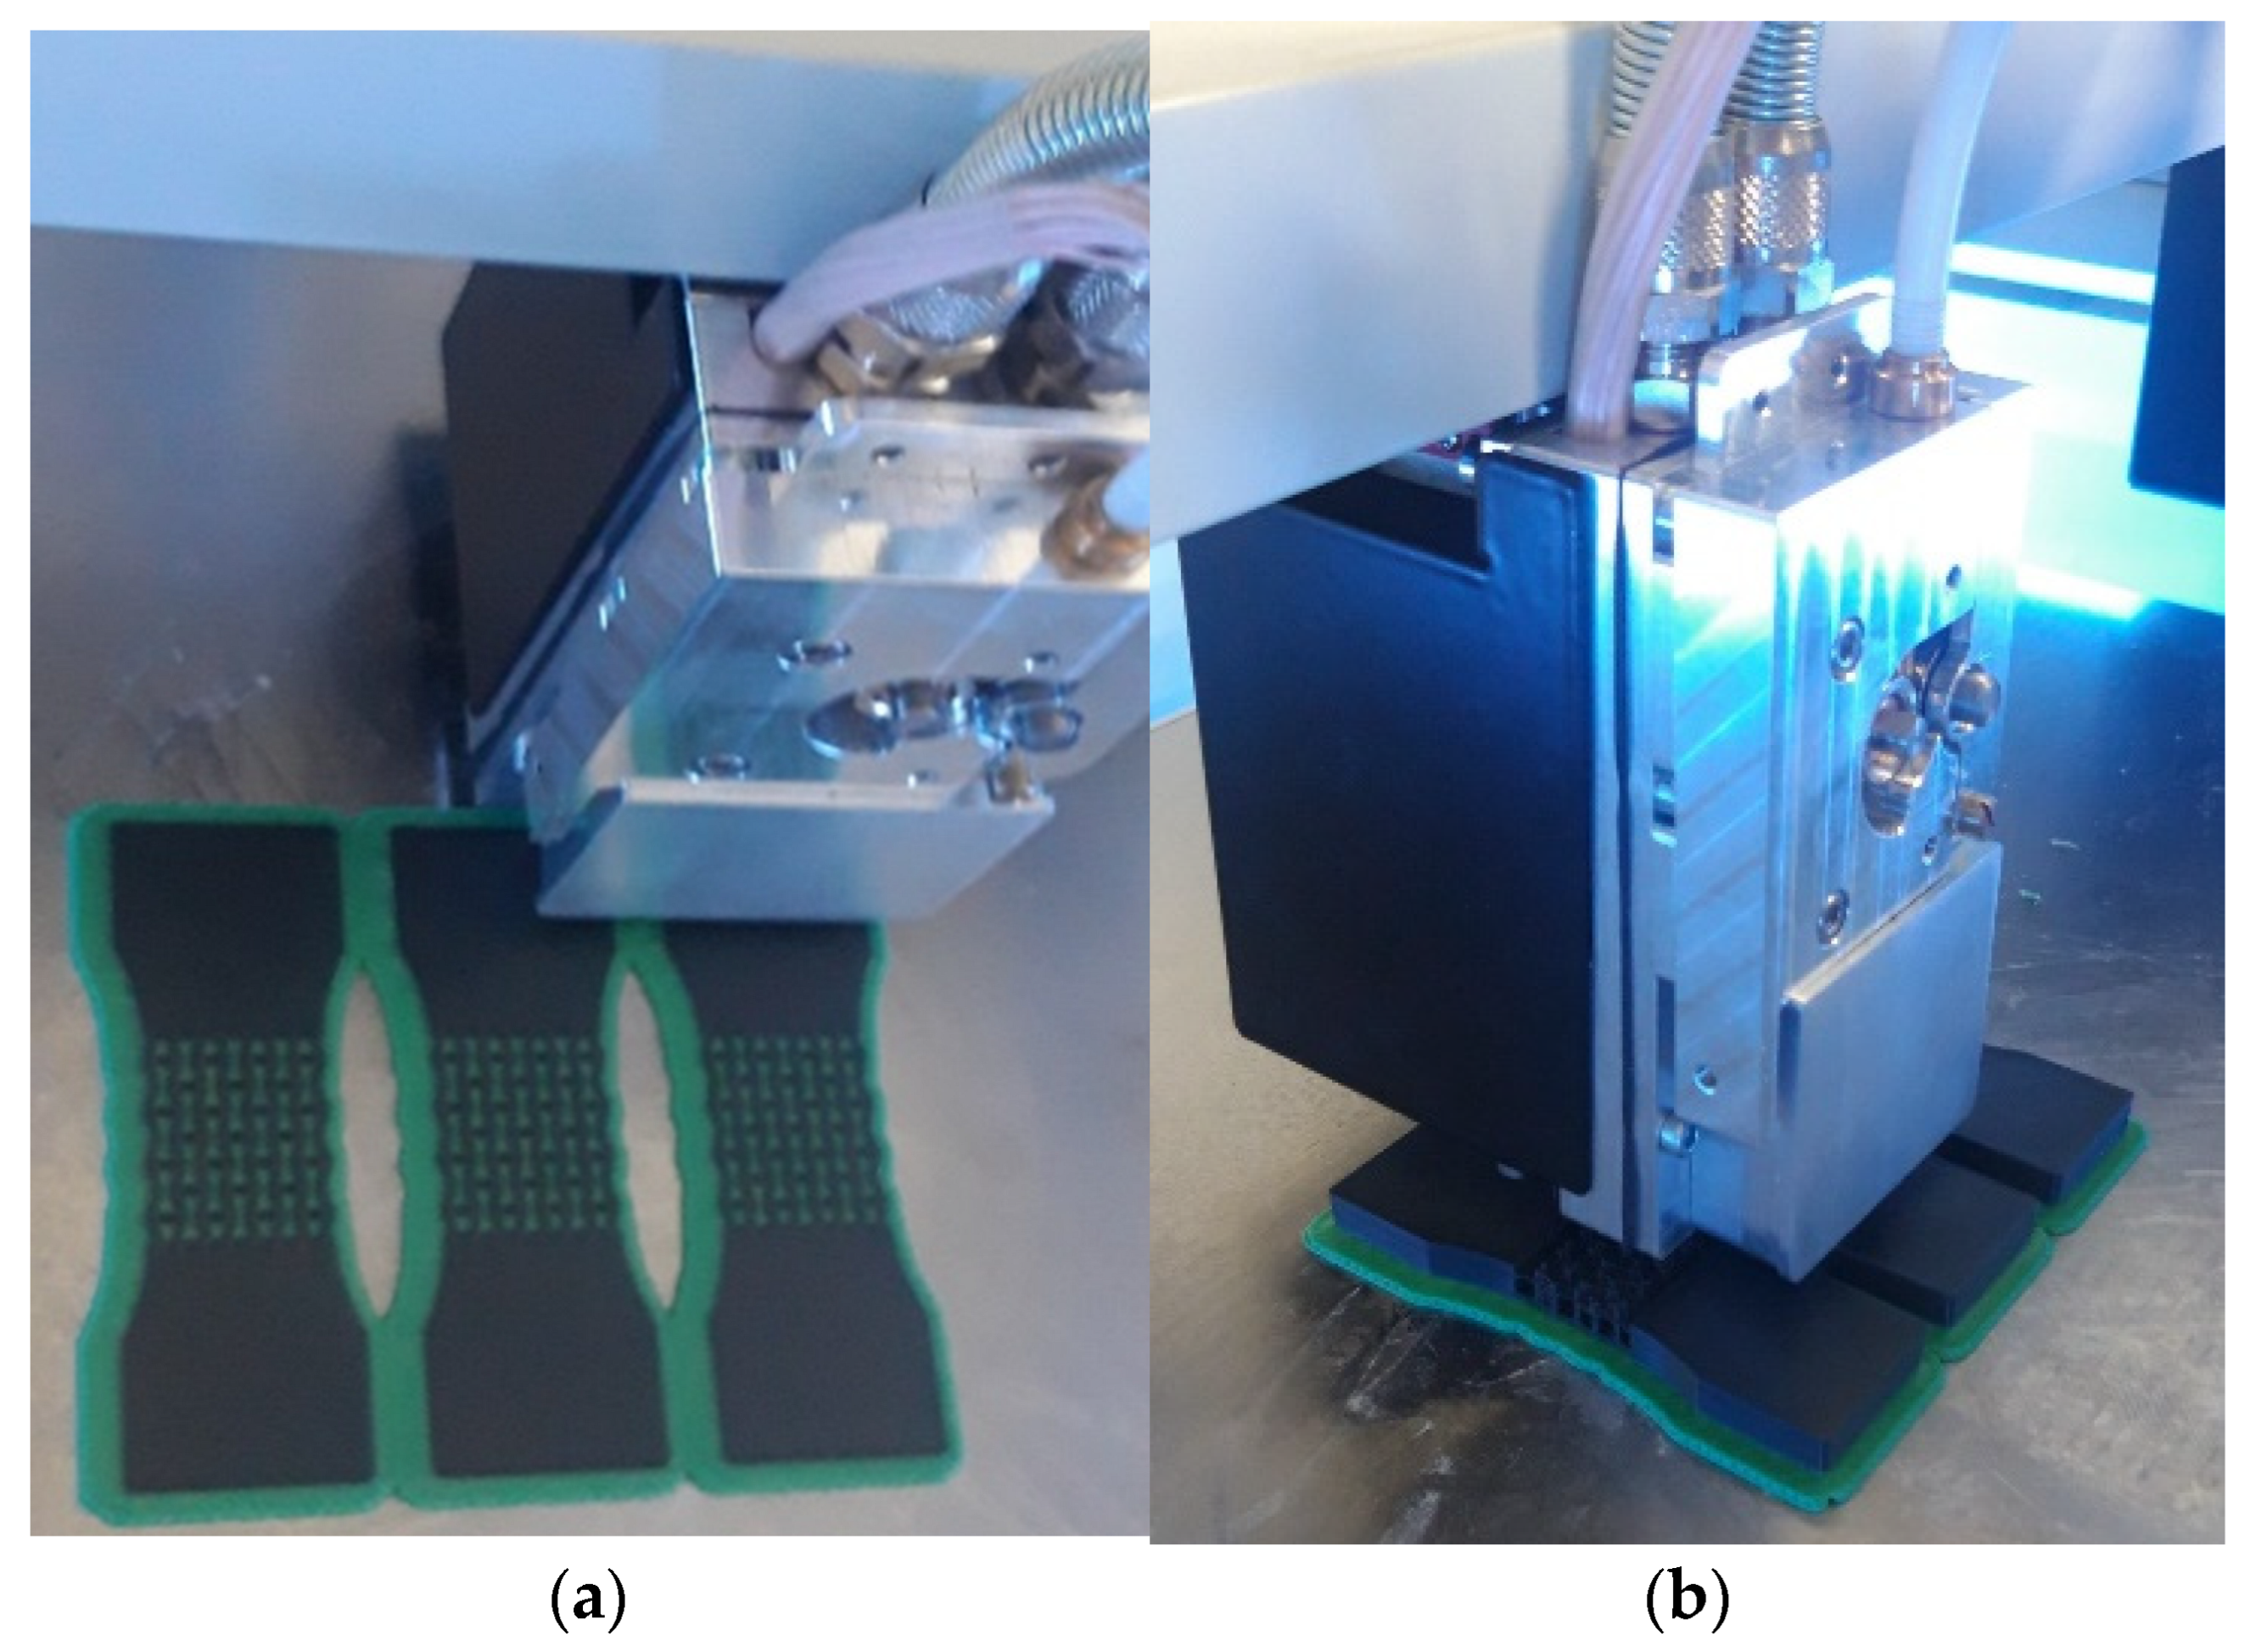
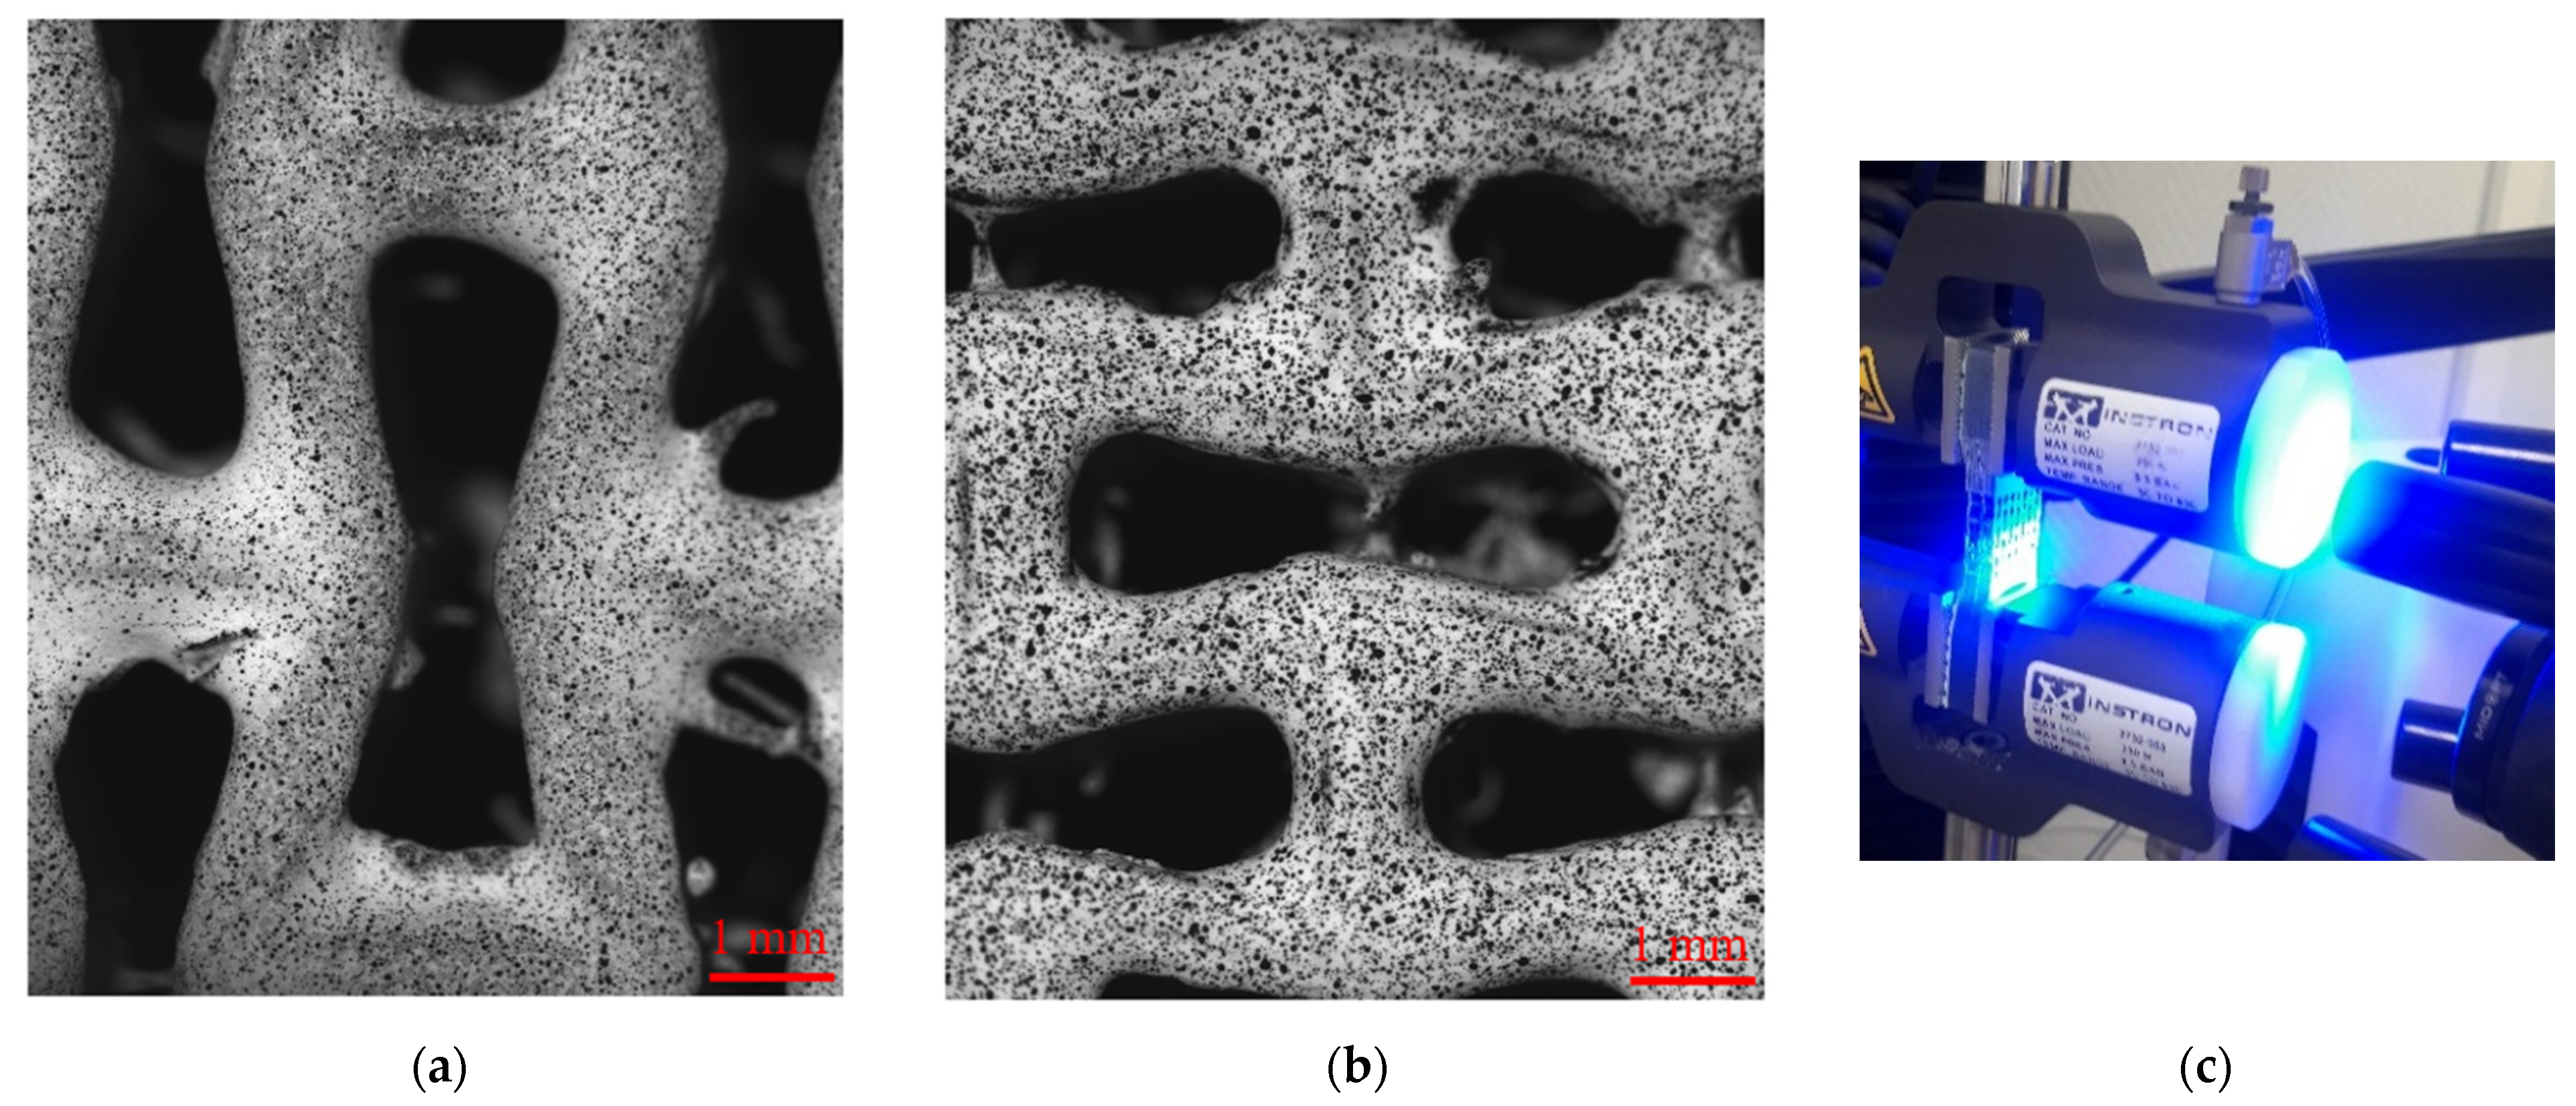
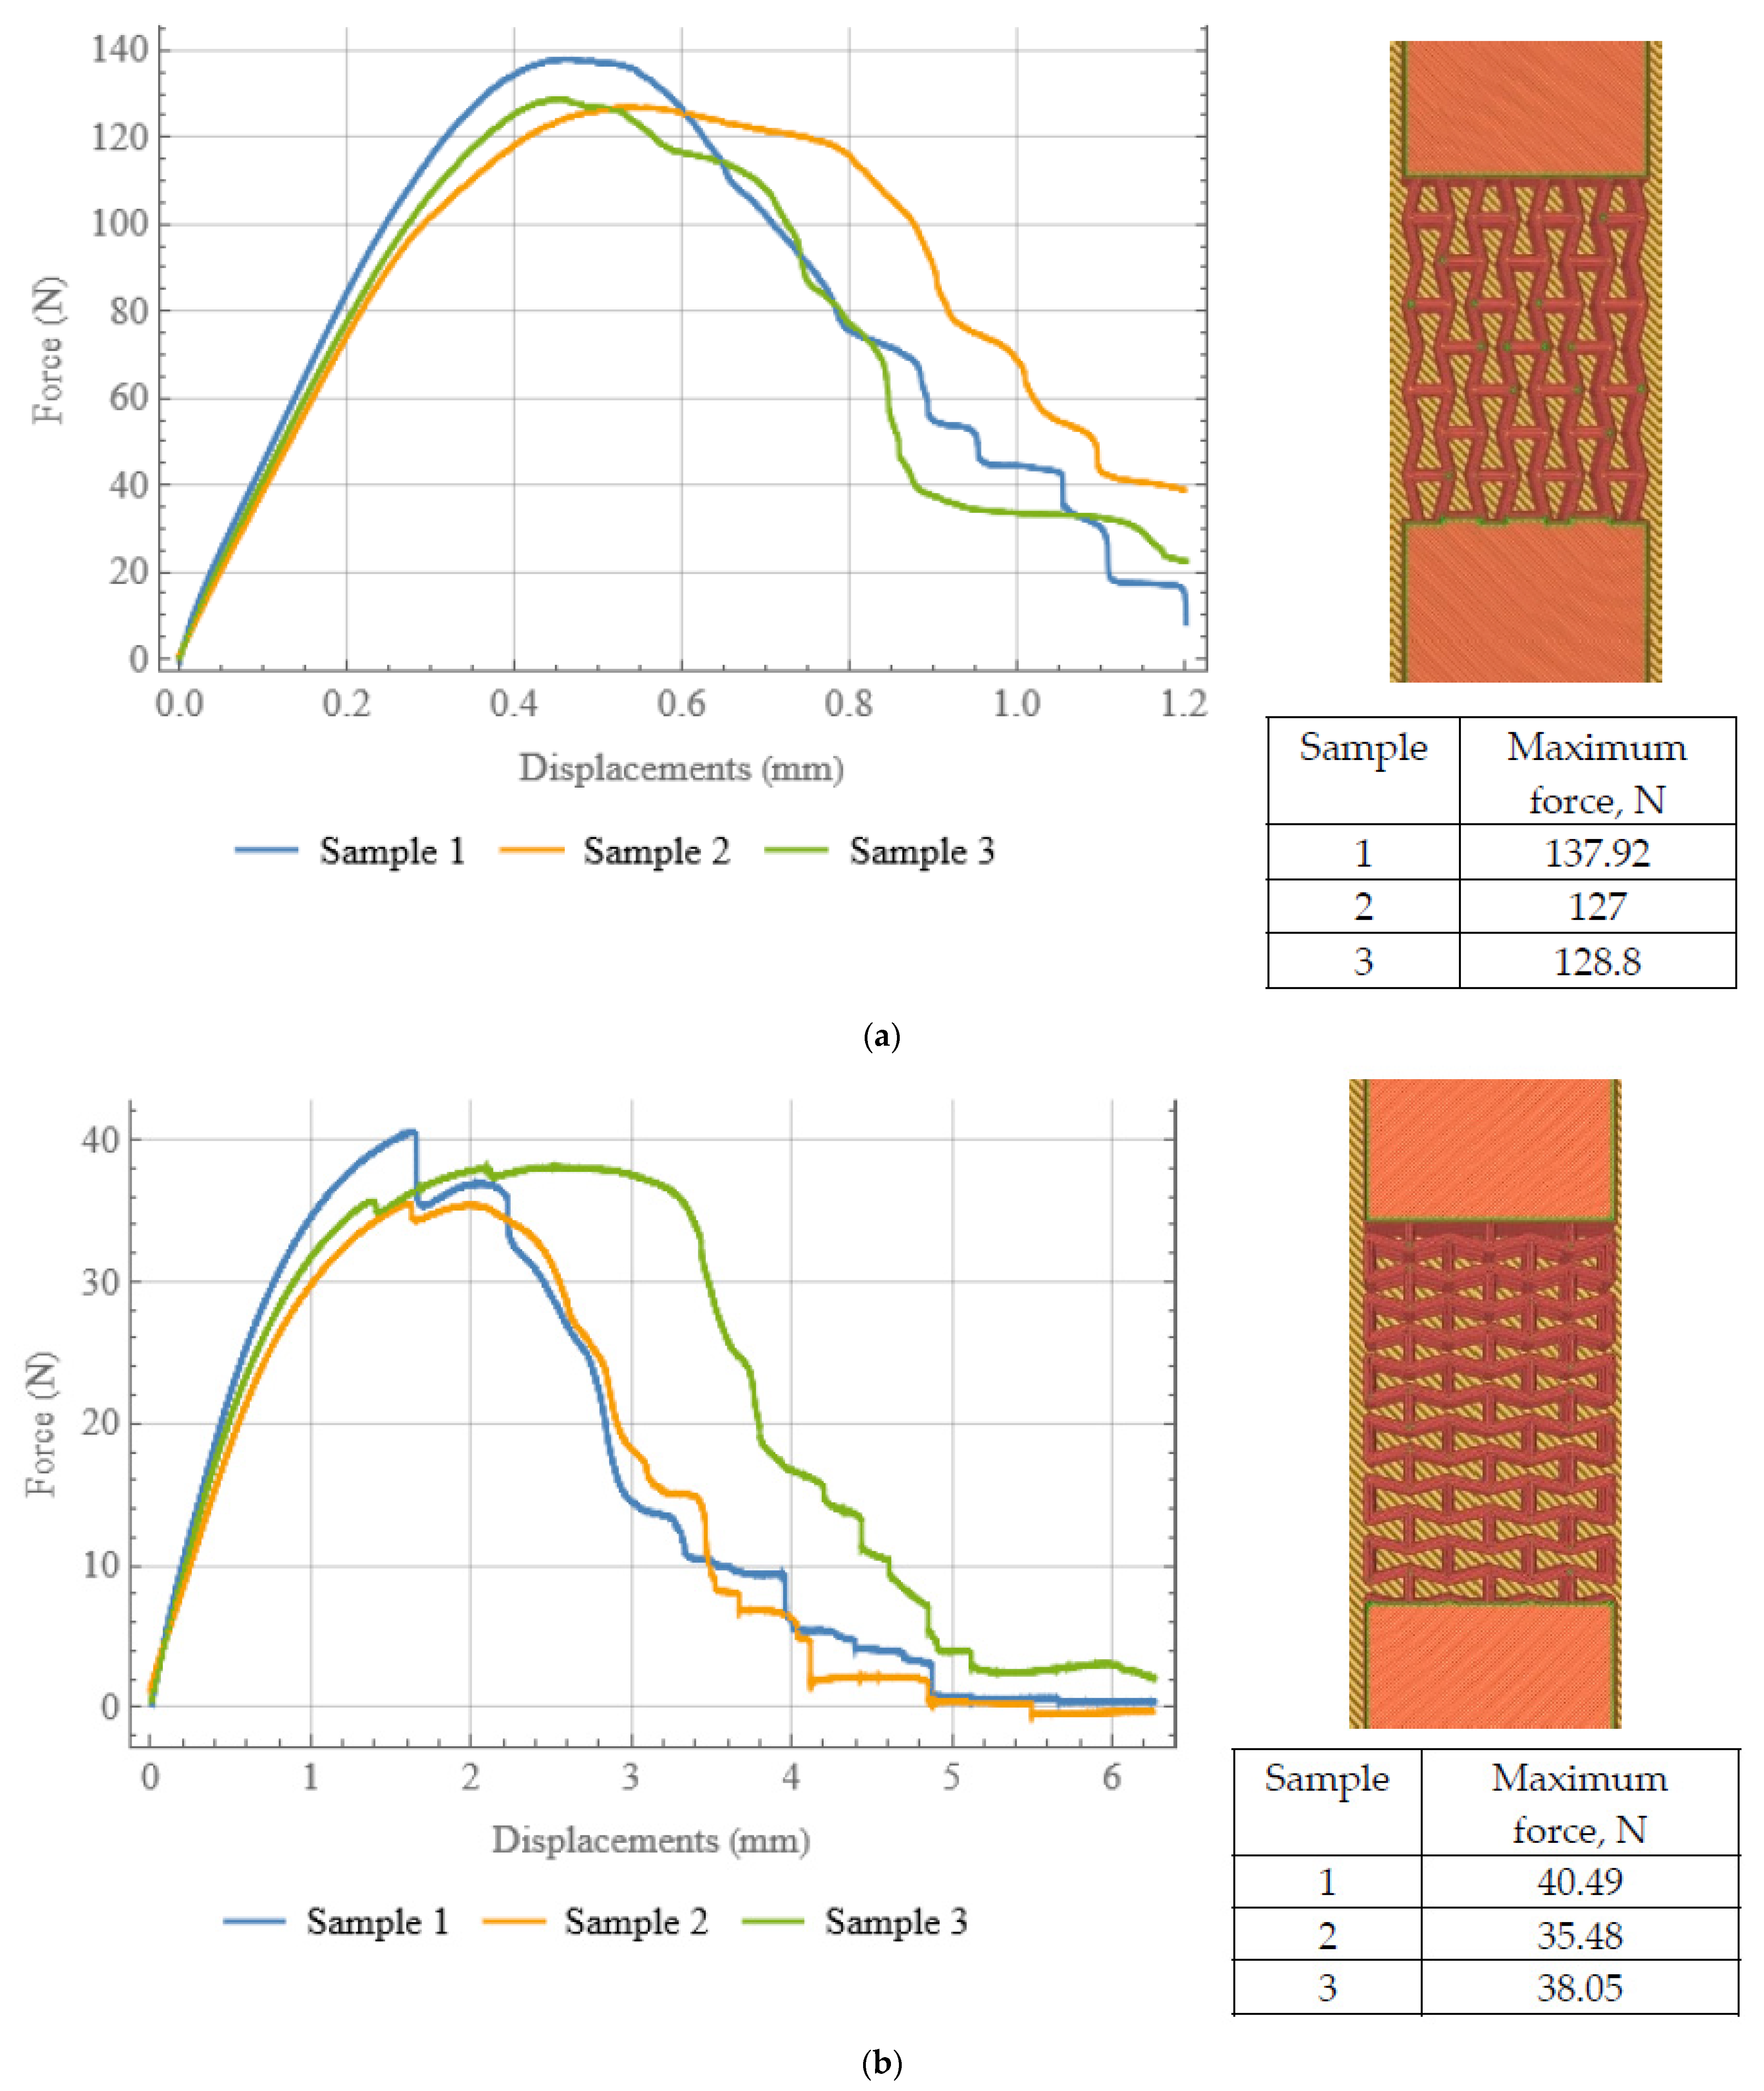
2.2. Additive Manufacturing and Mechanical Testing of Auxetic Structures
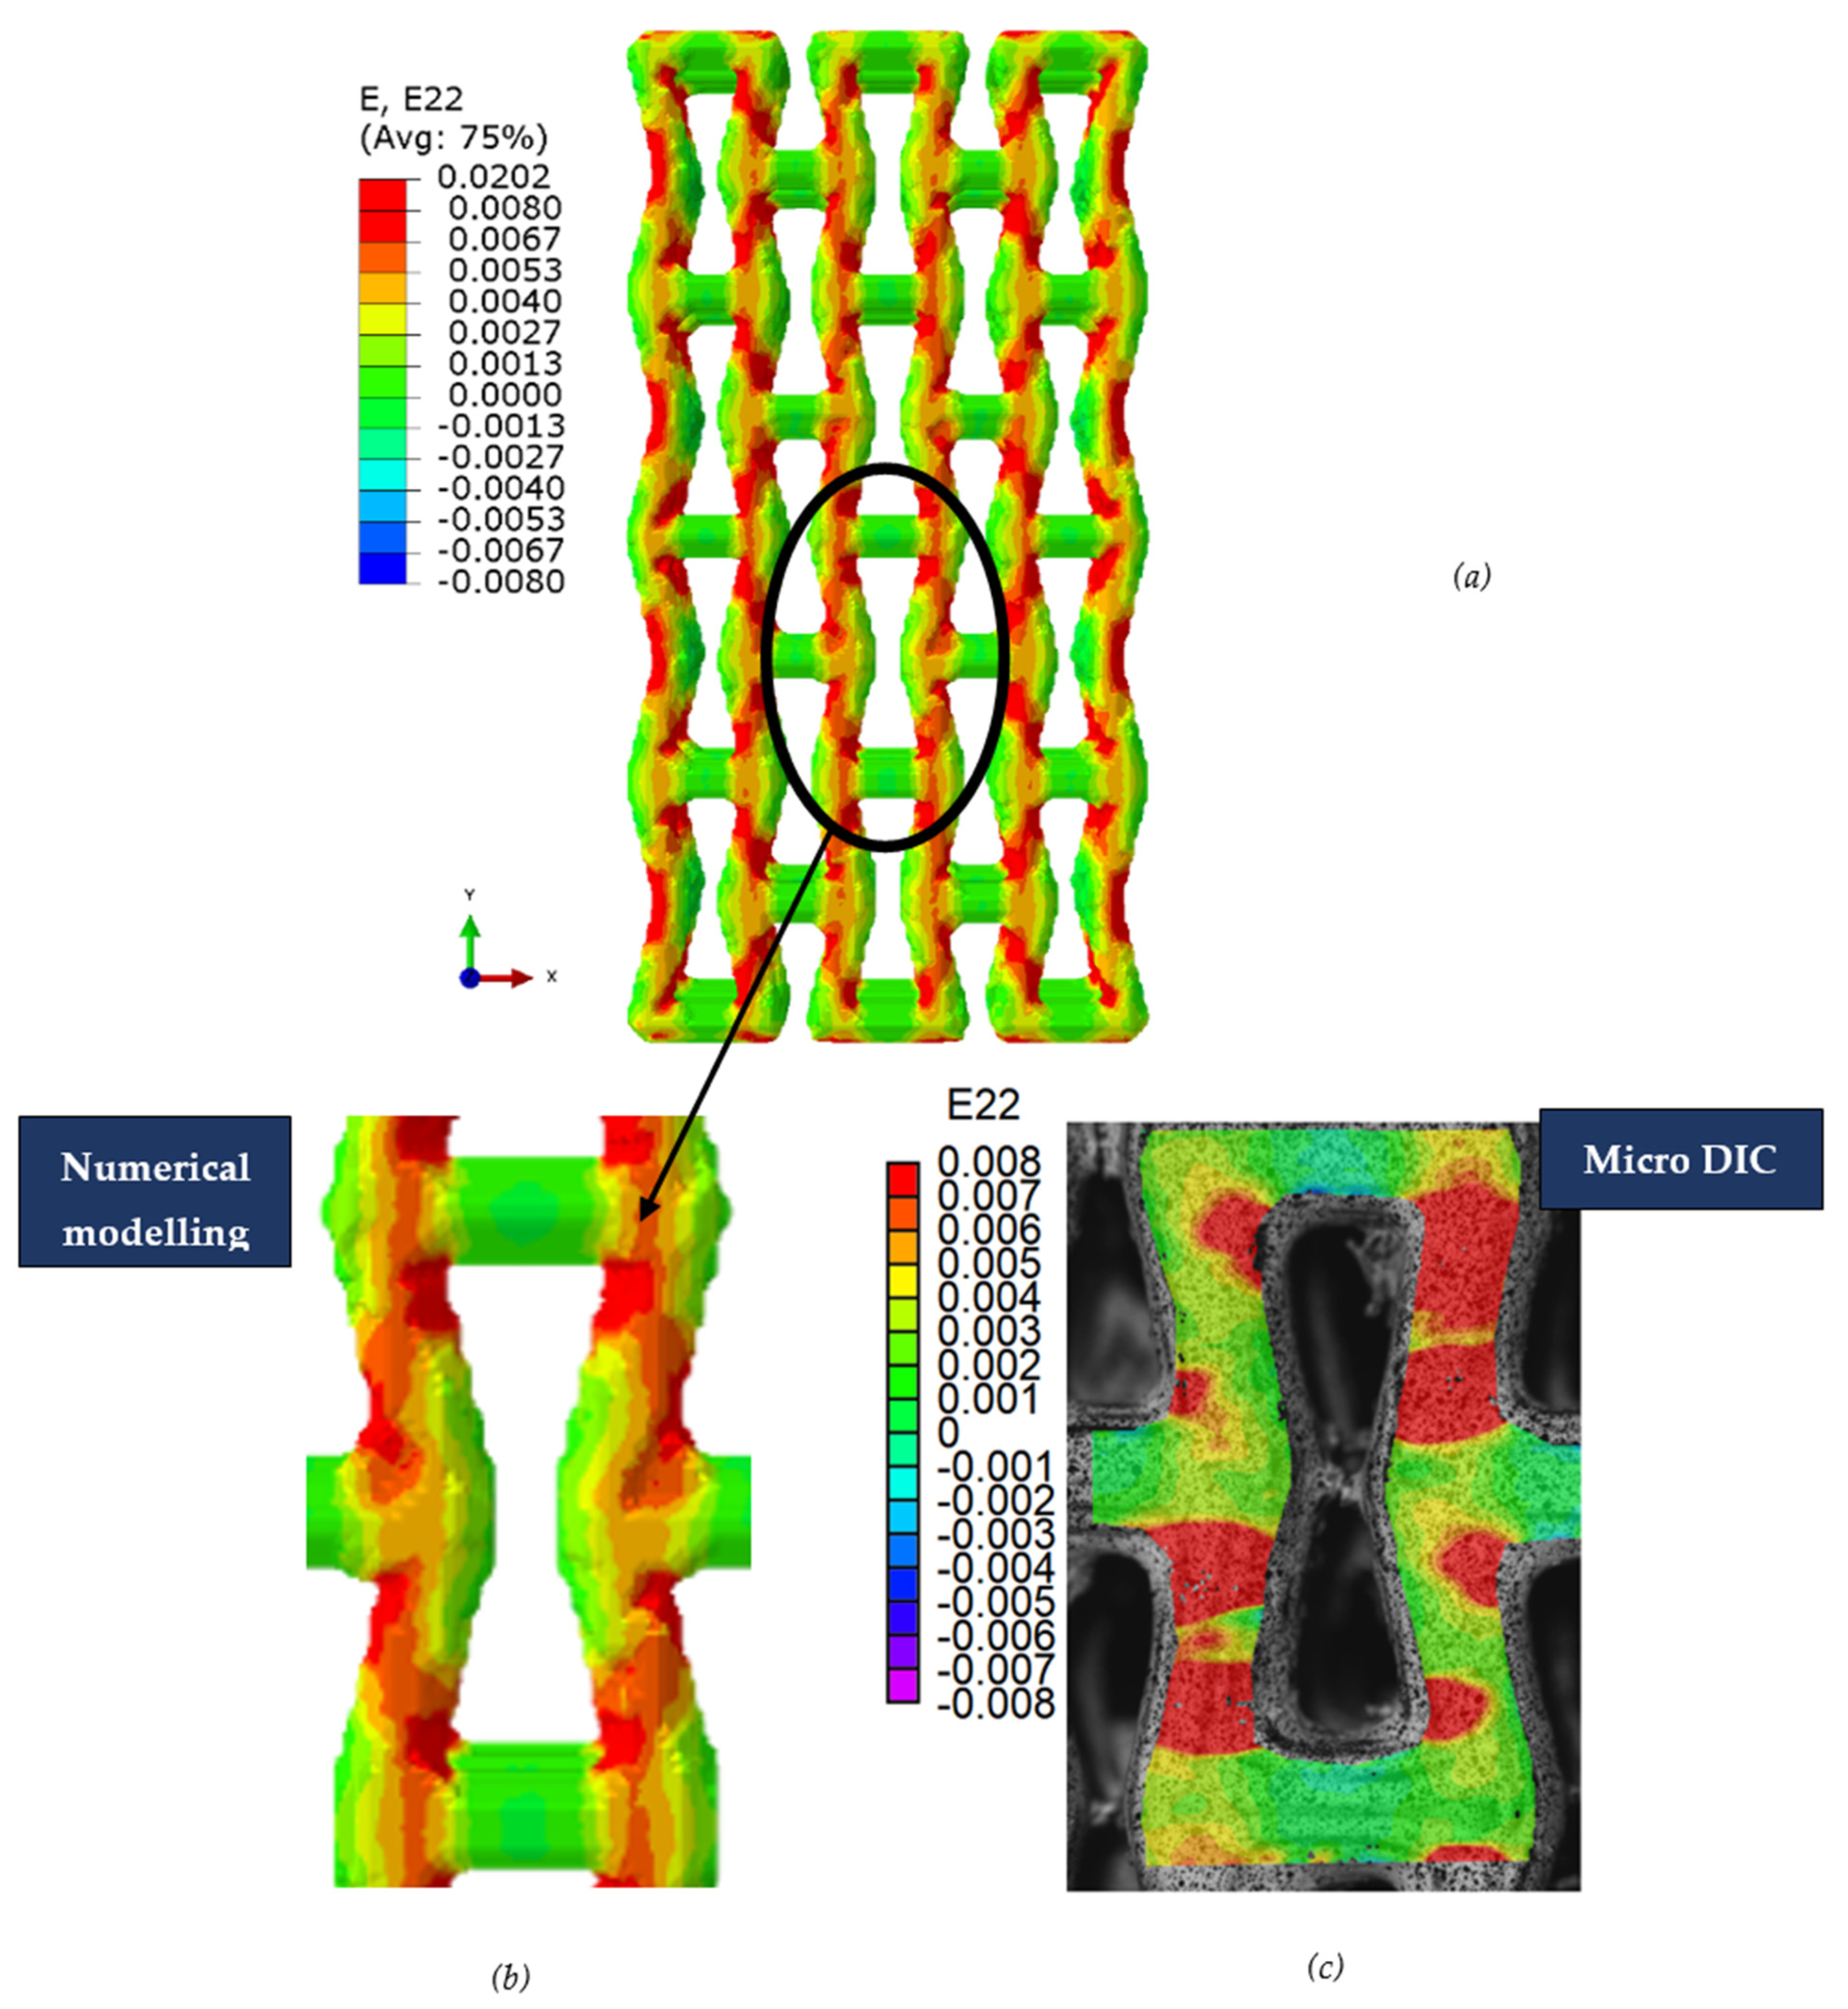
2.3. Digital Image Correlation
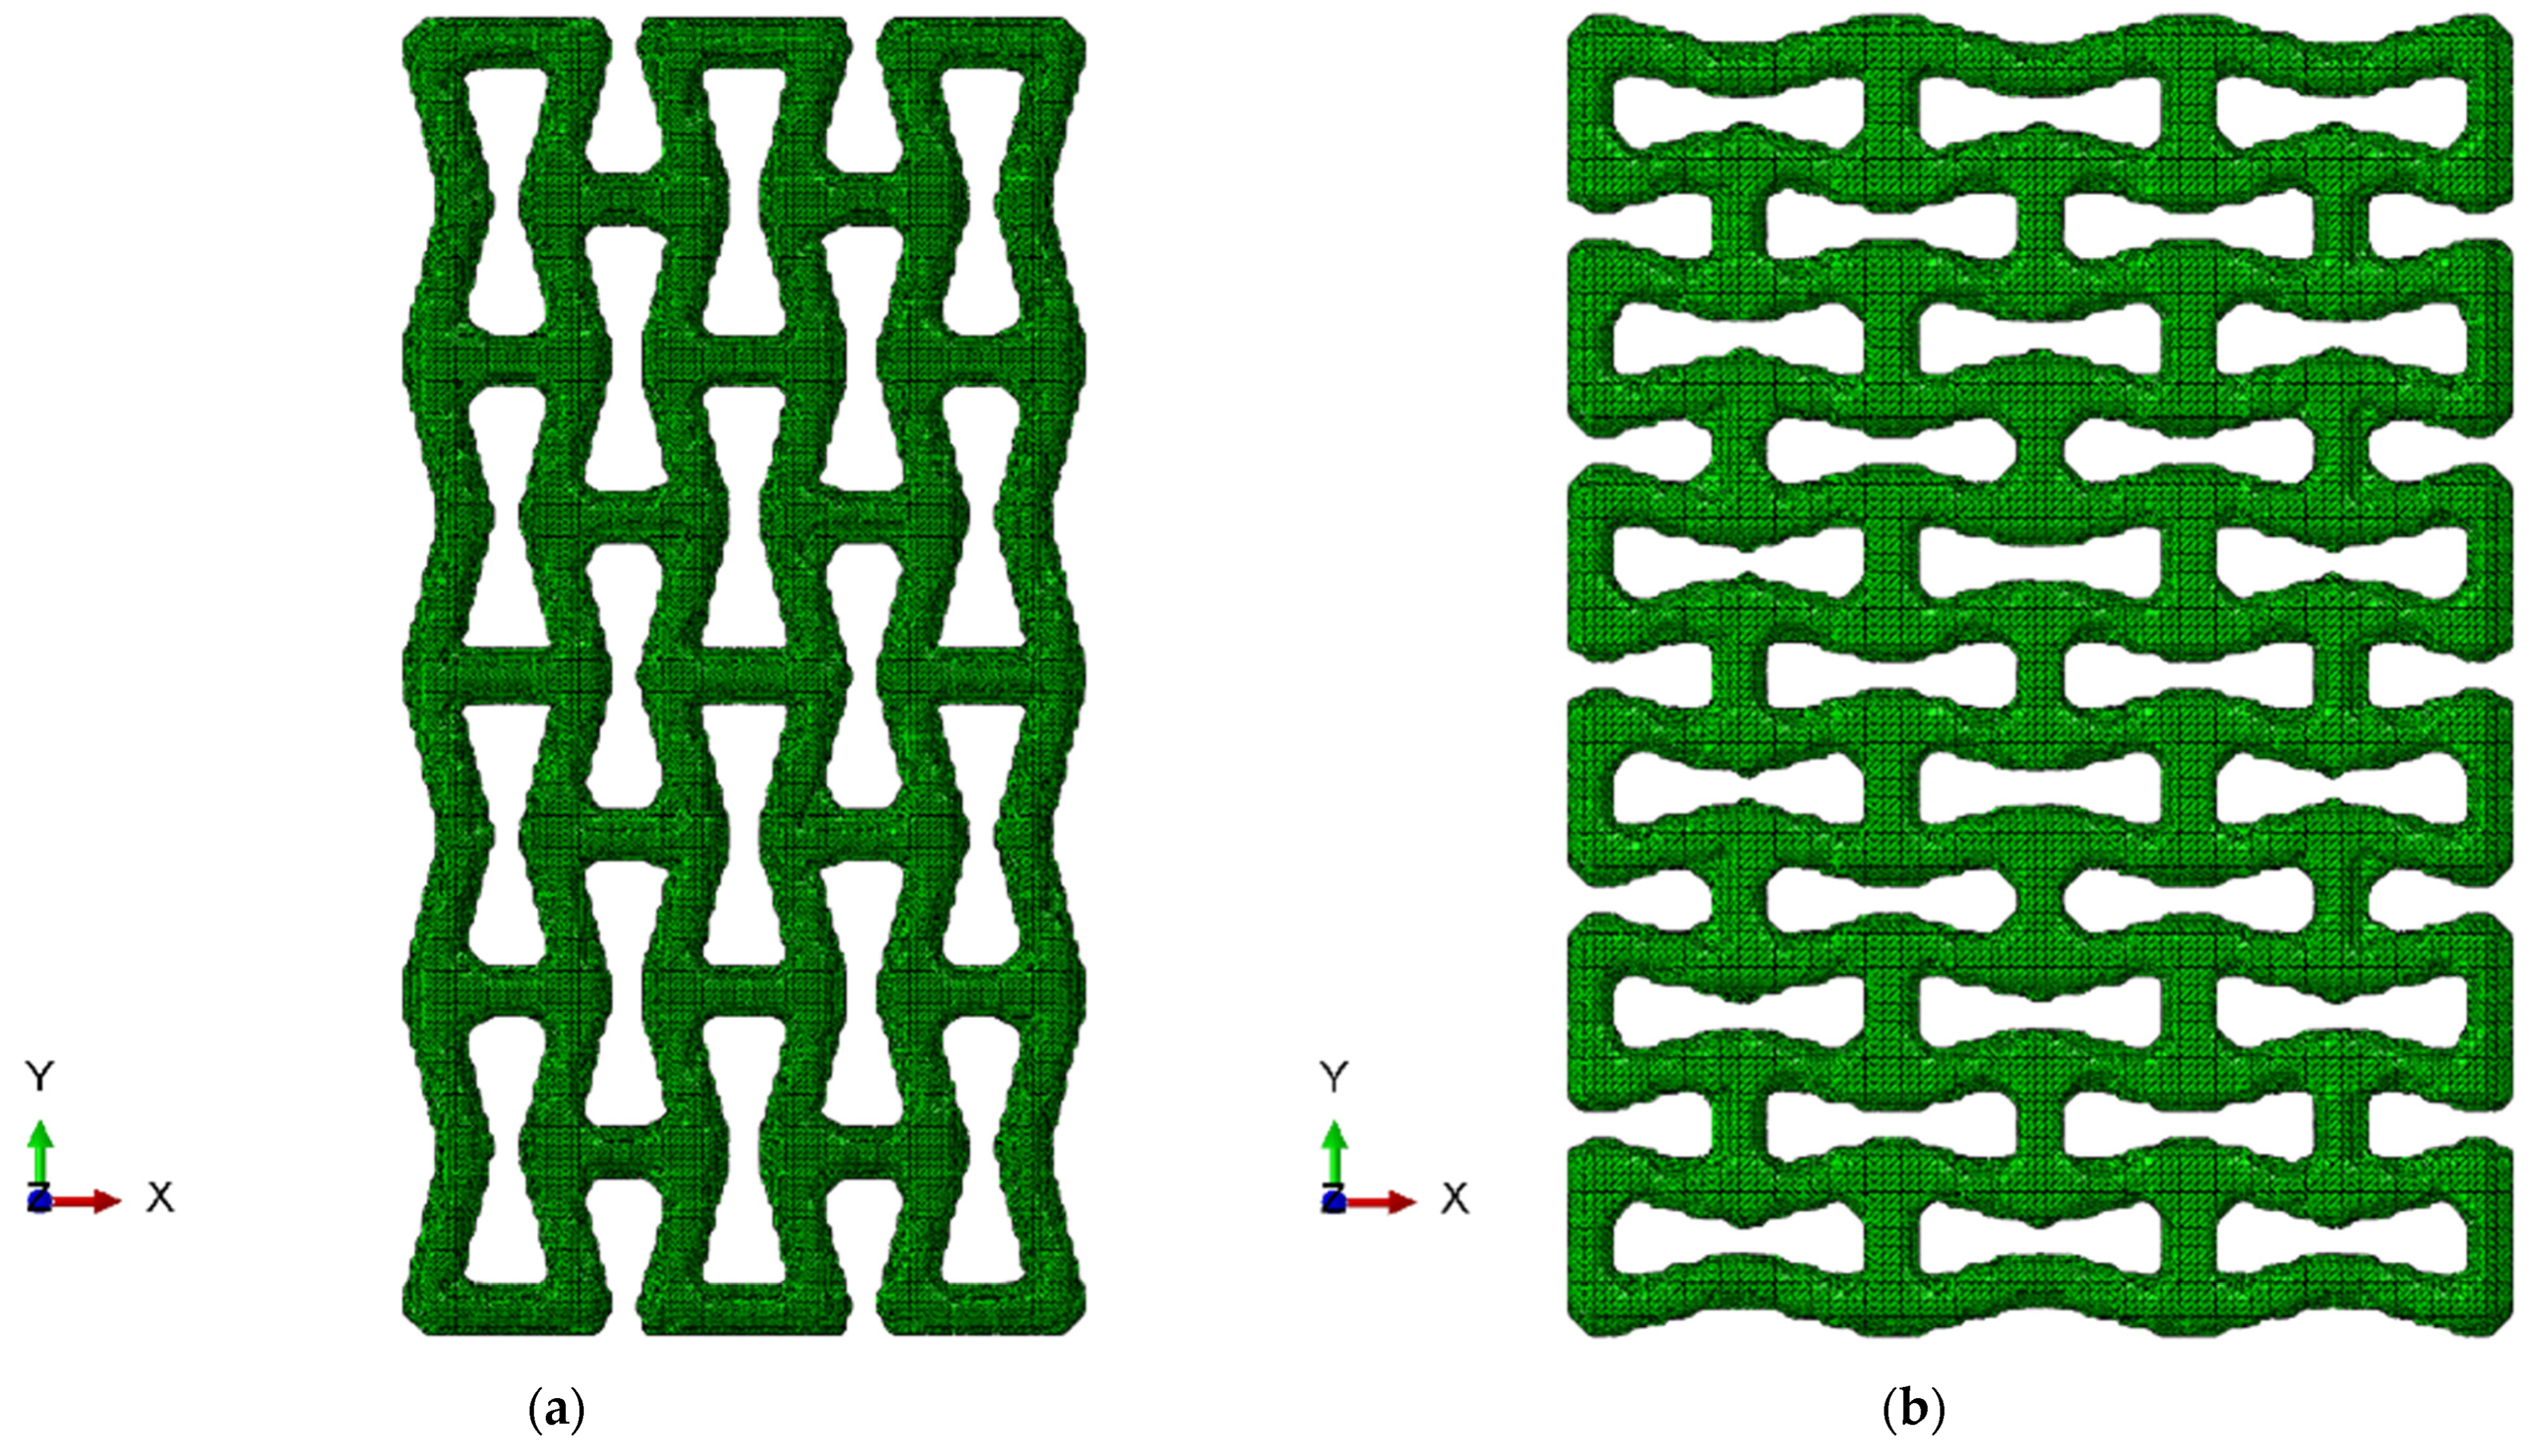
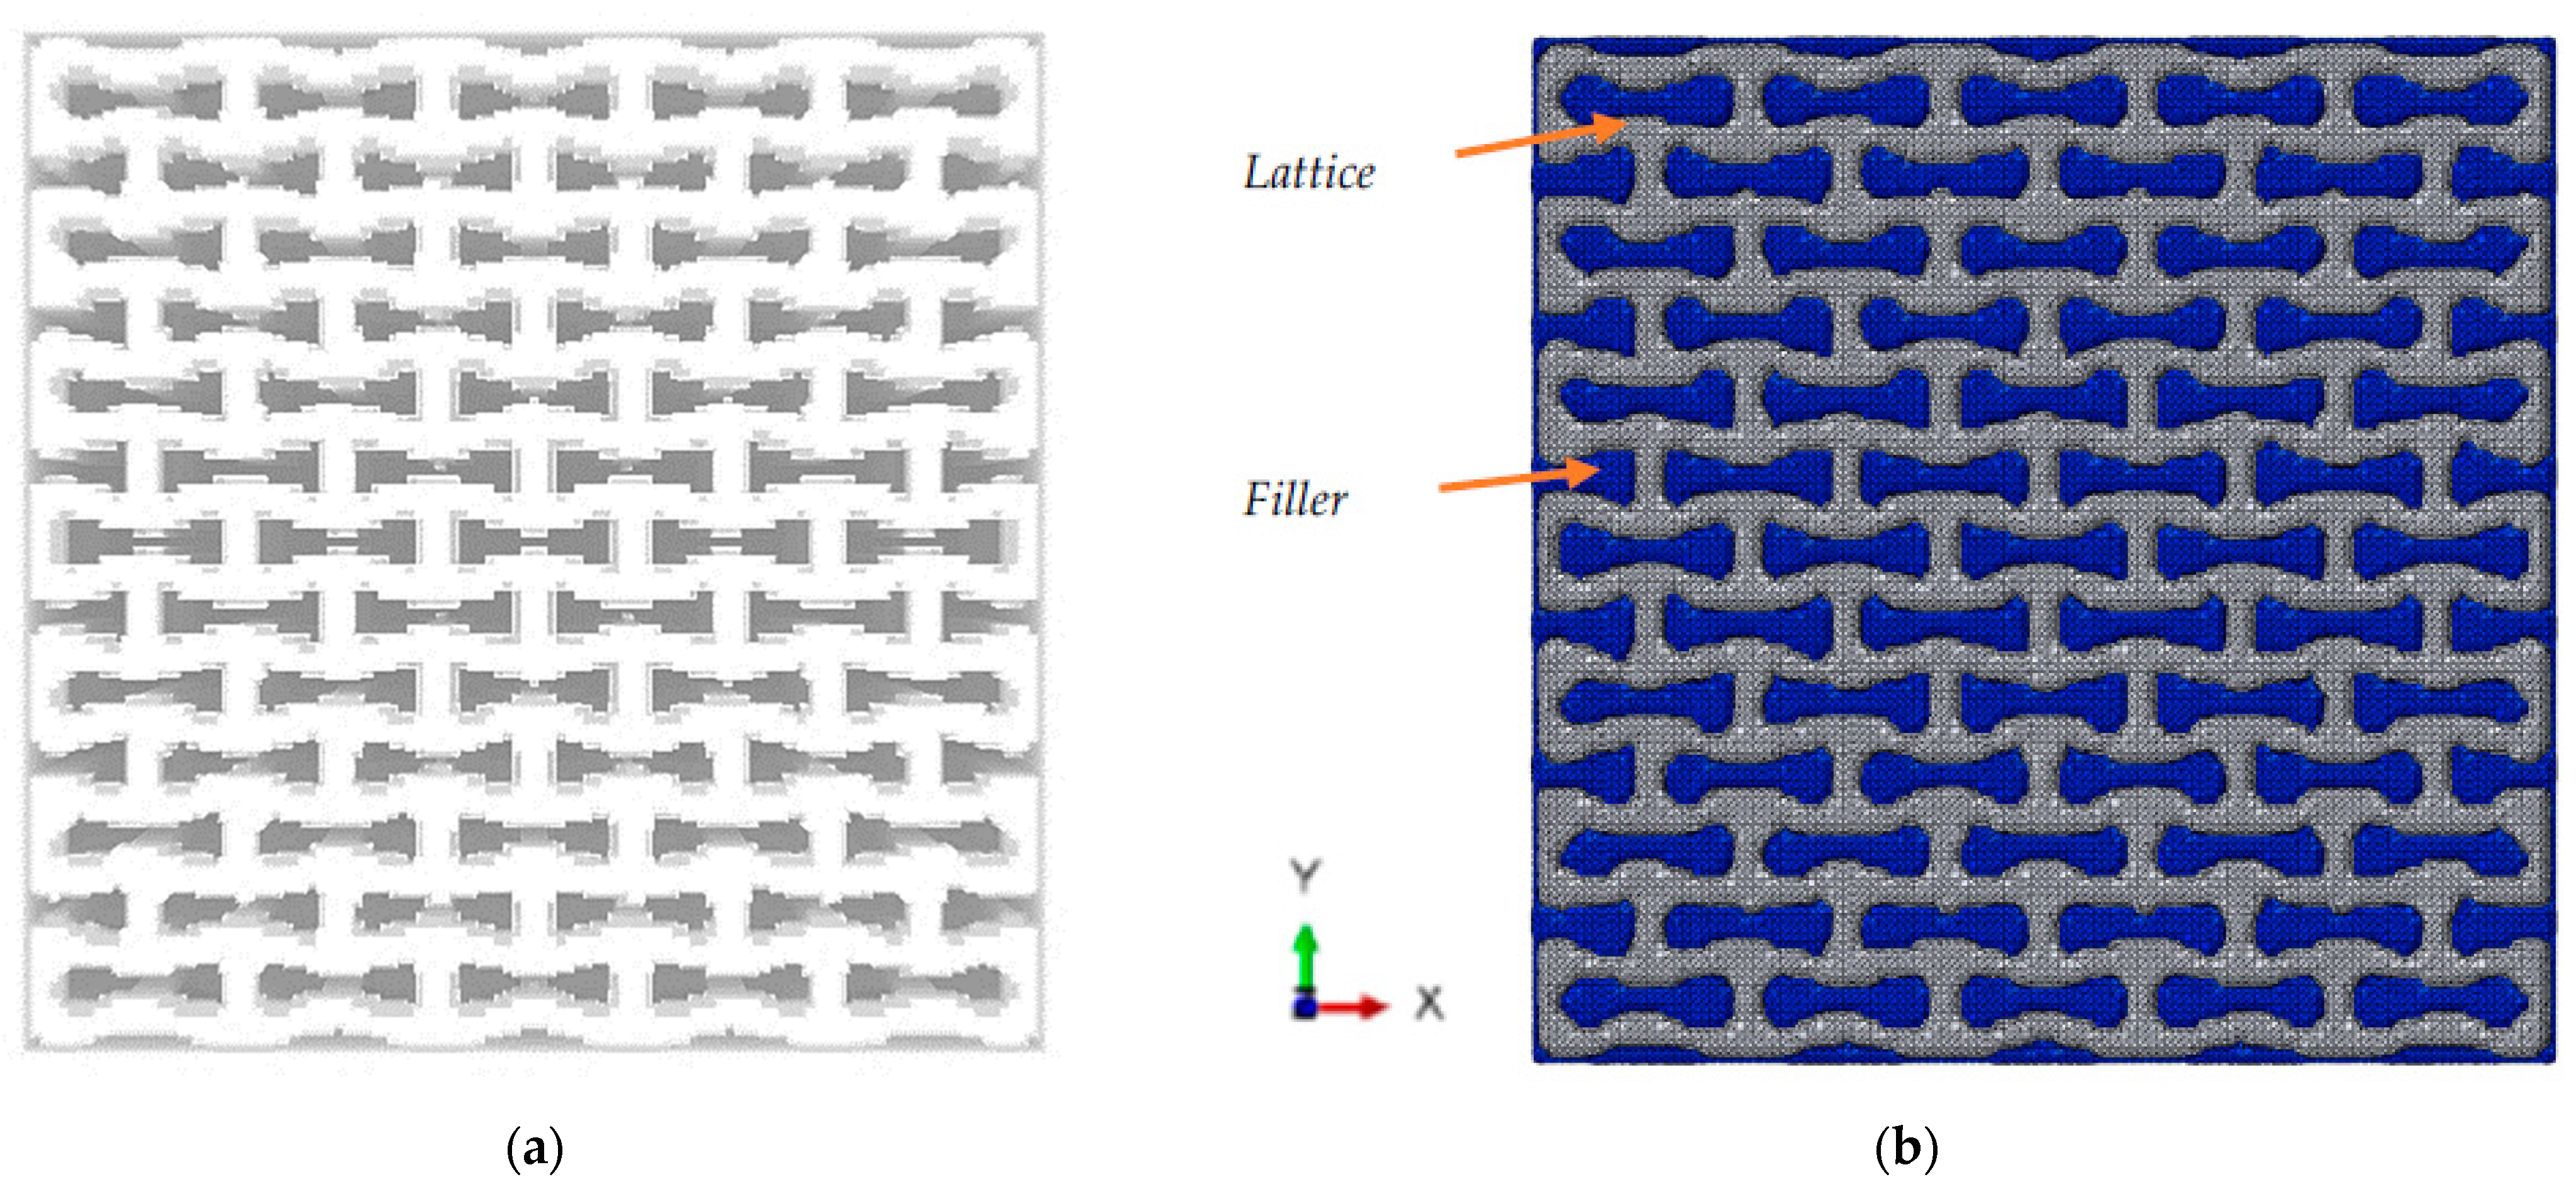
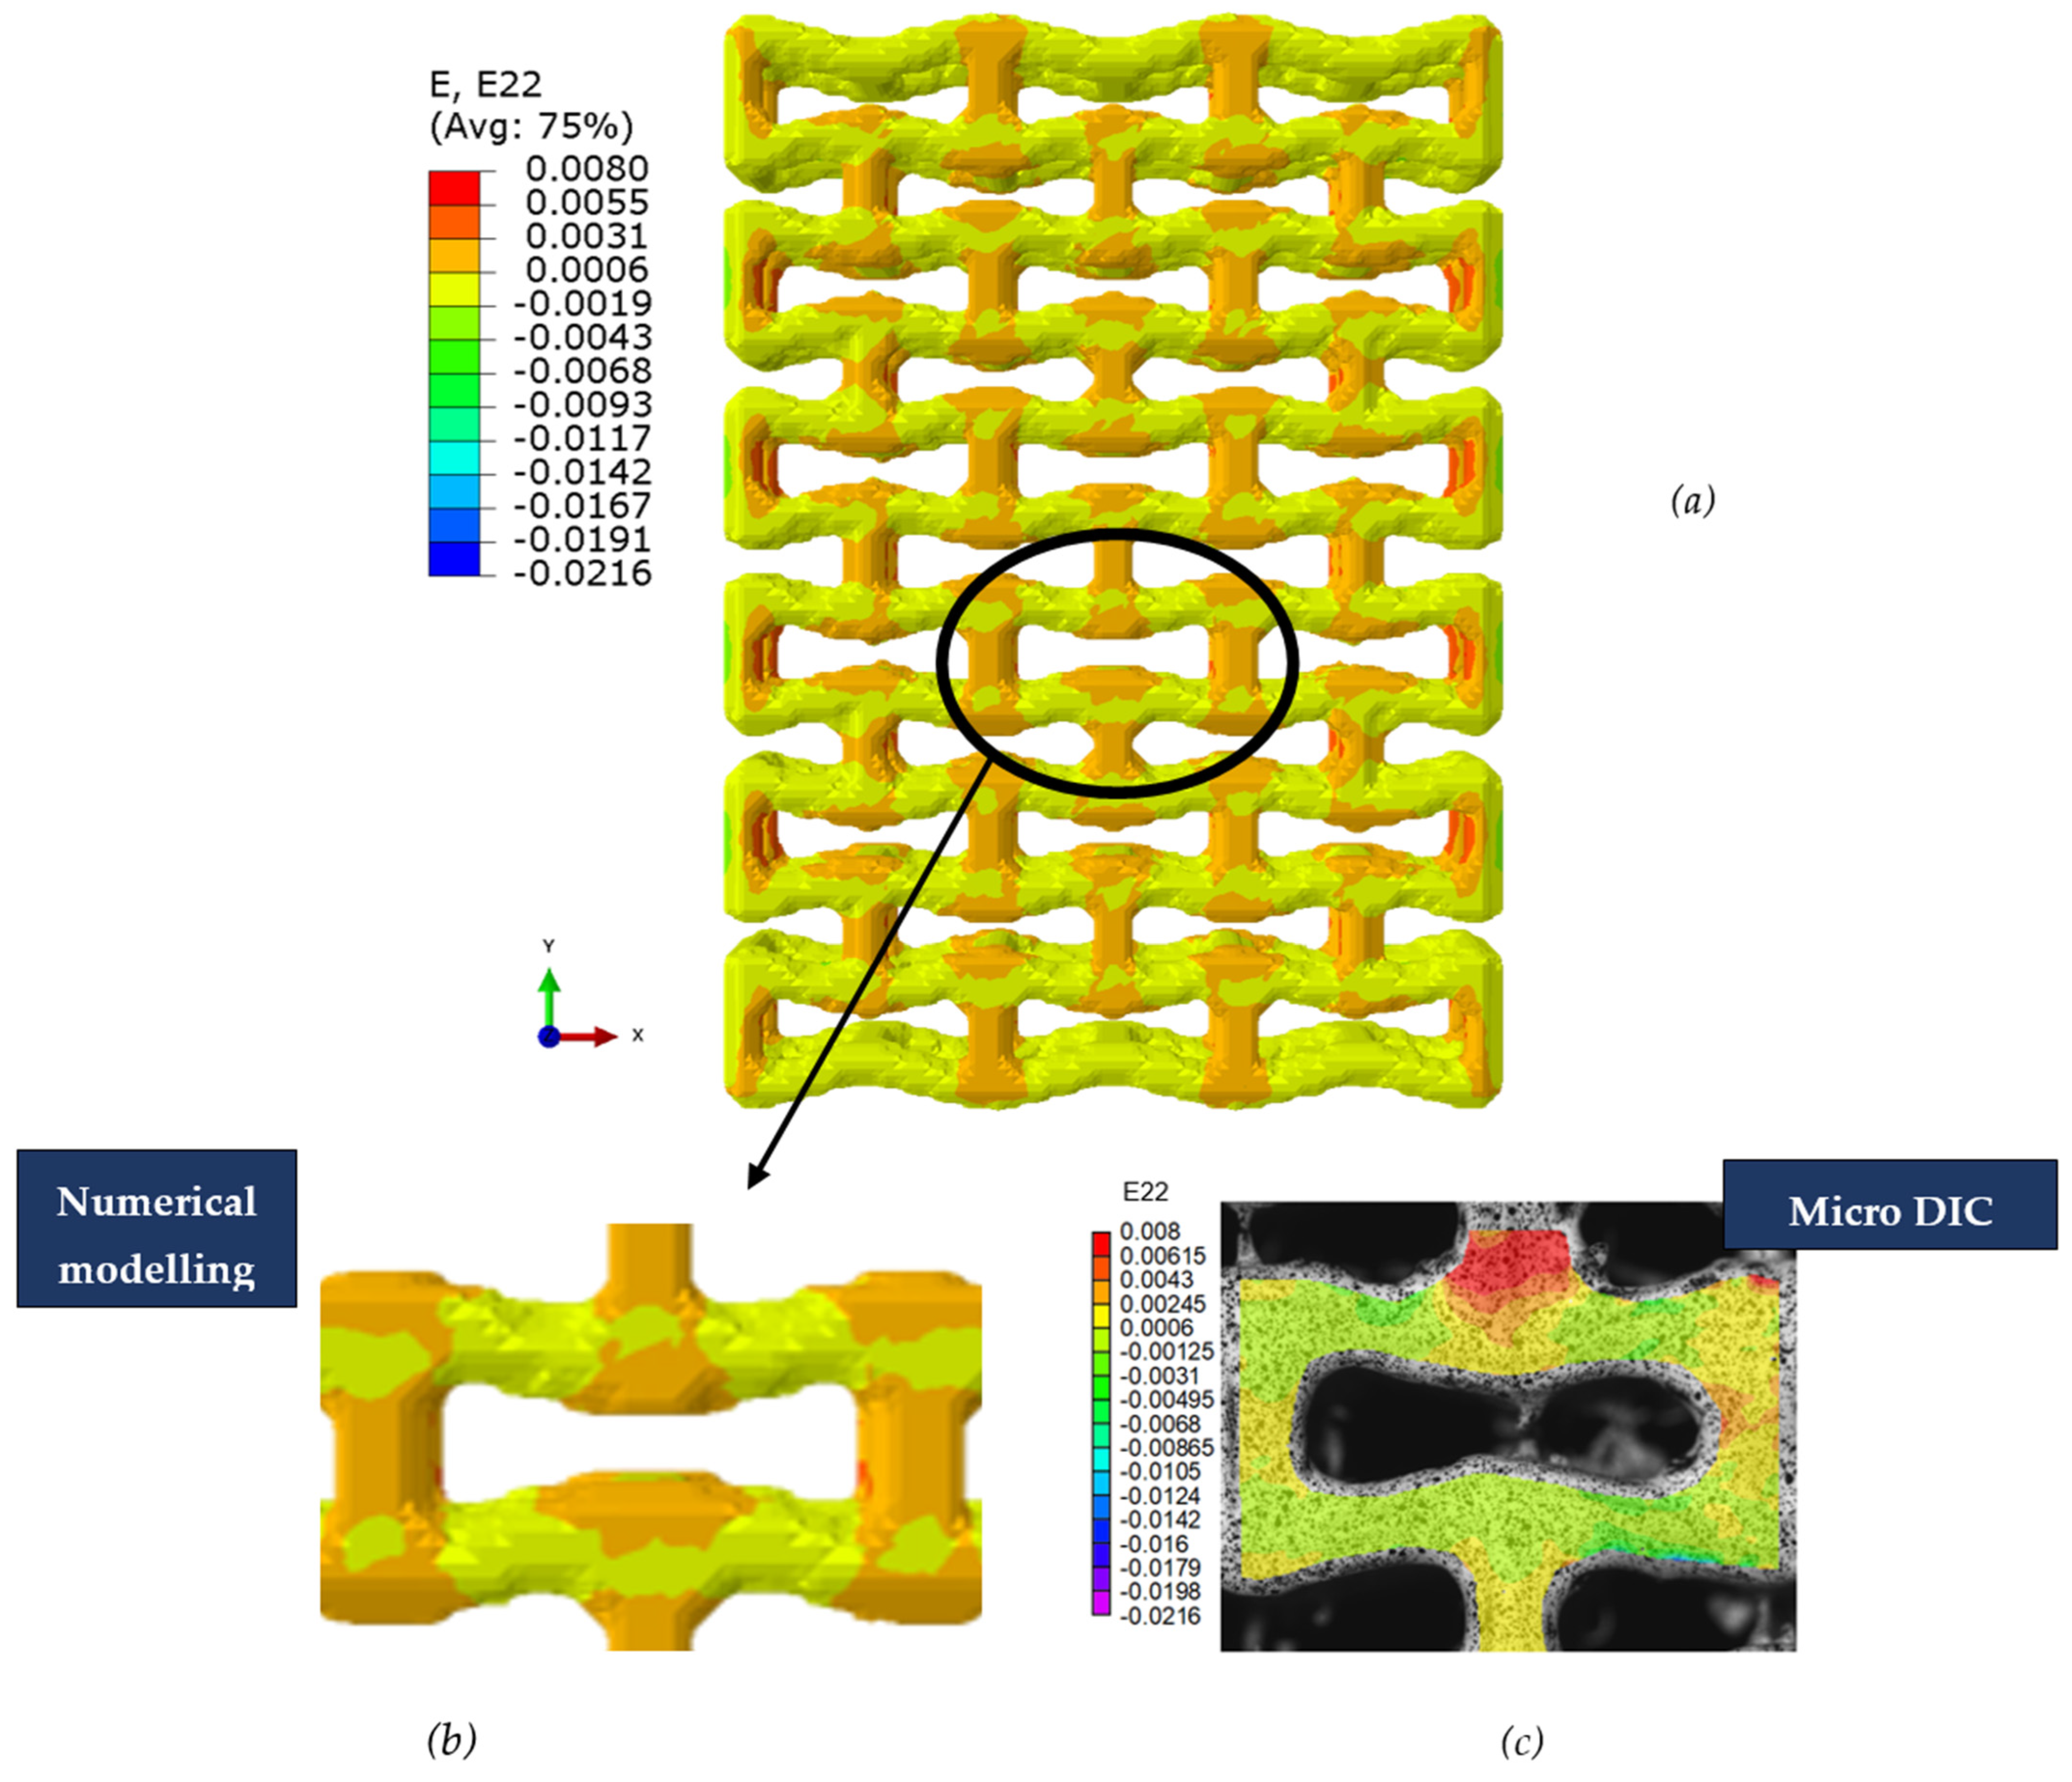
2.4. Finite-Element Analysis
2.5. Statistical Analysis
3. Results
3.1. FE Simulations of Porous Lattice Structure
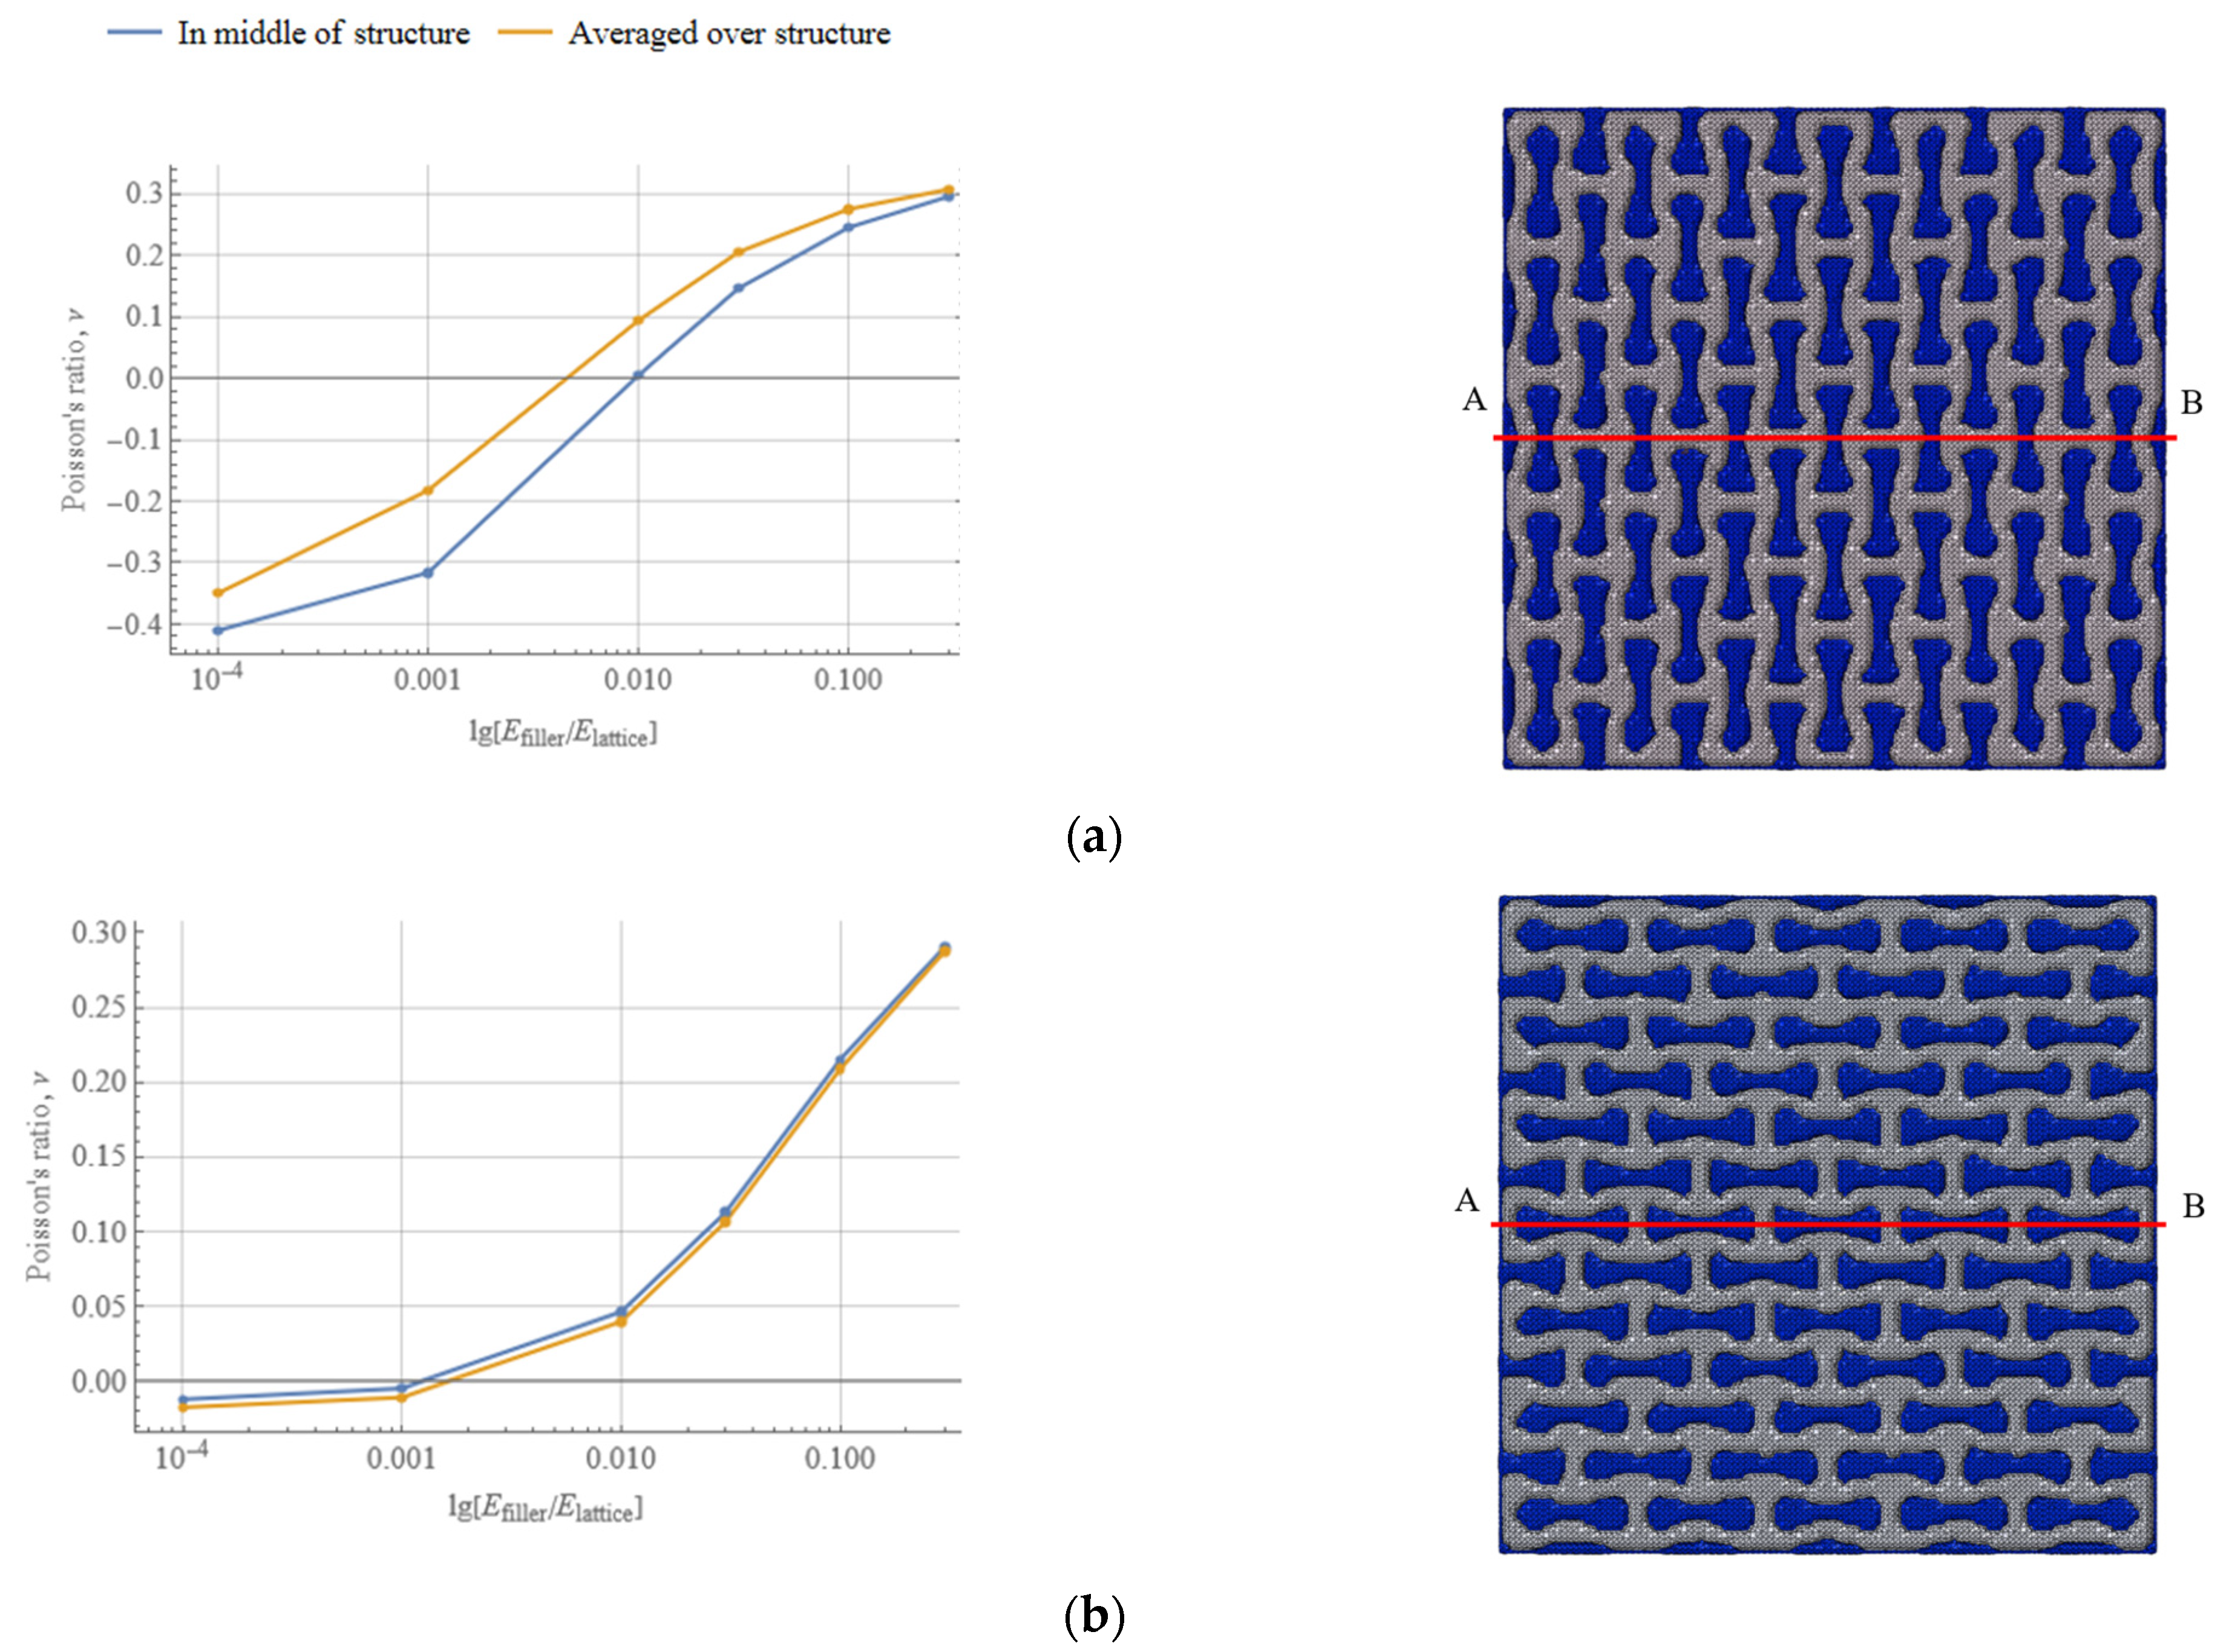
3.2. Effect of Filler on NPR
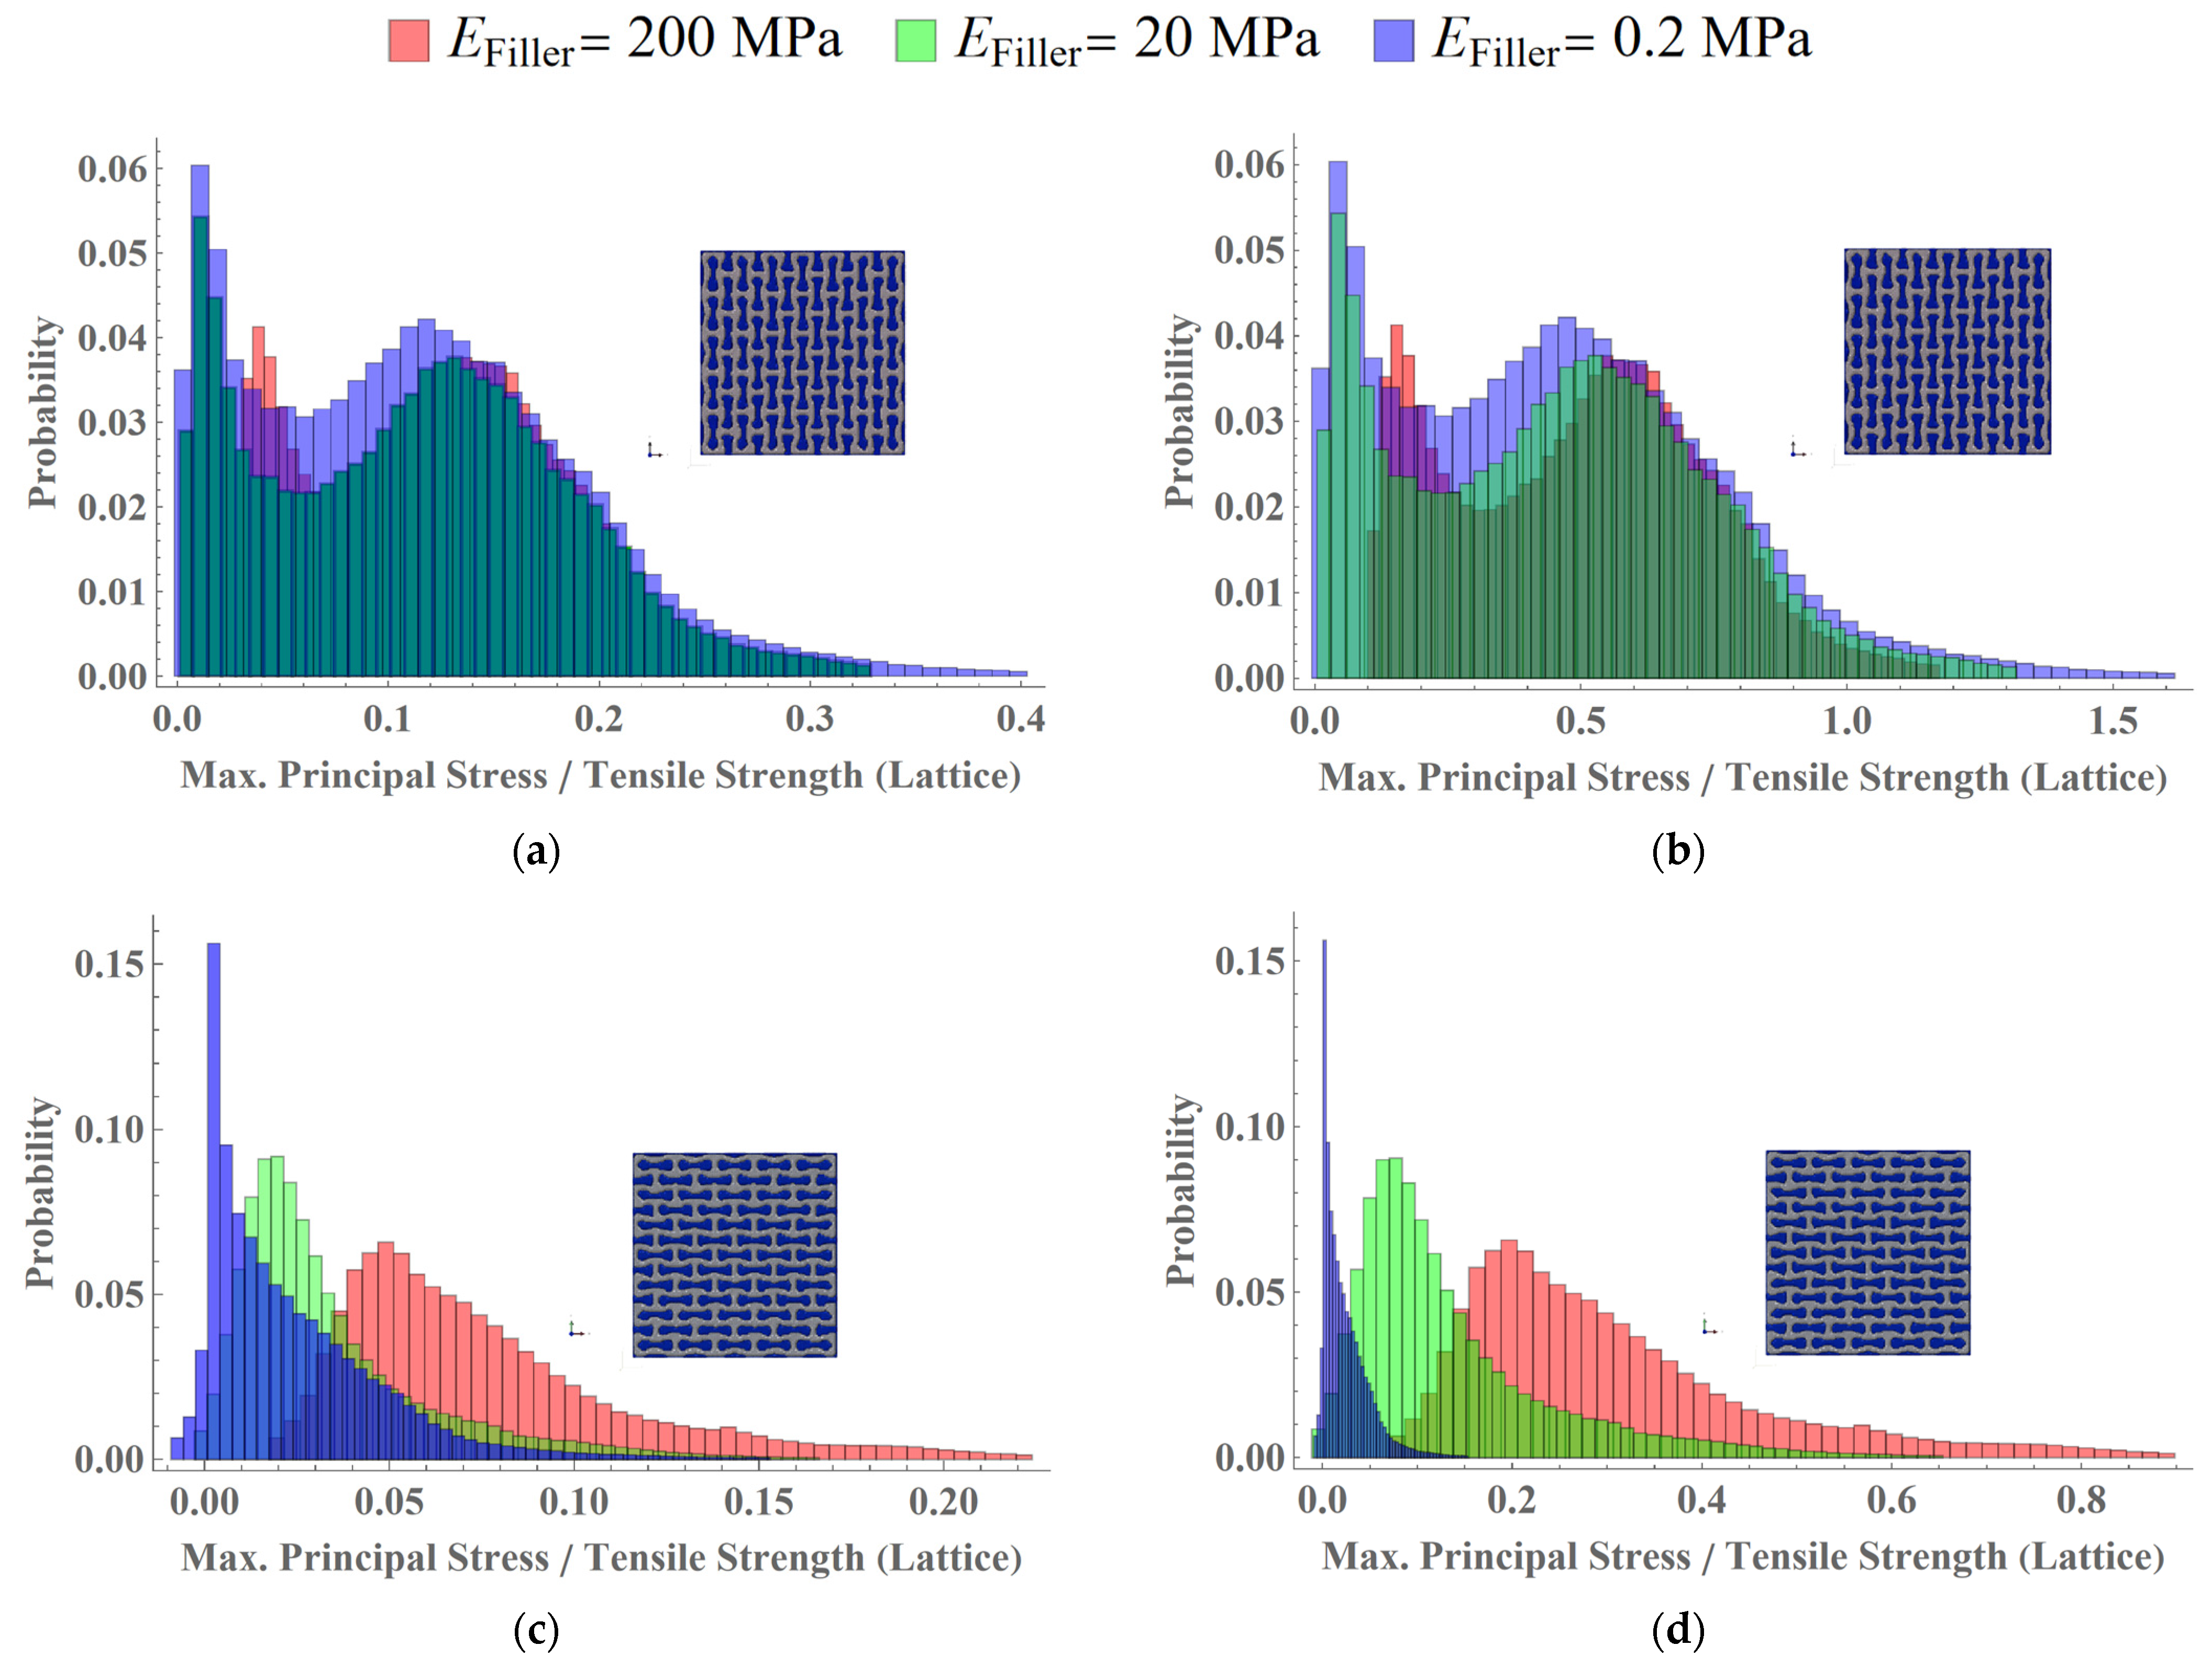
3.3. Analysis of Stress Distributions in Lattice
4. Conclusions
Author Contributions
Funding
Institutional Review Board Statement
Data Availability Statement
Conflicts of Interest
References
- Kushwaha, Y.S.; Hemanth, N.S.; Badgayan, N.D.; Sahu, S.K. Free Vibration Analysis of PLA Based Auxetic Metamaterial Structural Composite Using Finite Element Analysis. Mater. Today Proc. 2022, 56, 1063–1067. [Google Scholar] [CrossRef]
- Airoldi, A.; Bettini, P.; Panichelli, P.; Oktem, M.F.; Sala, G. Chiral Topologies for Composite Morphing Structures—Part I: Development of a Chiral Rib for Deformable Airfoils. Phys. Status Solidi Basic Res. 2015, 252, 1435–1445. [Google Scholar] [CrossRef]
- Ali, M.N.; Rehman, I.U. An Auxetic Structure Configured as Oesophageal Stent with Potential to Be Used for Palliative Treatment of Oesophageal Cancer; Development and in Vitro Mechanical Analysis. J. Mater. Sci. Mater. Med. 2011, 22, 2573–2581. [Google Scholar] [CrossRef]
- Al-Dulimi, Z.; Wallis, M.; Tan, D.K.; Maniruzzaman, M.; Nokhodchi, A. 3D Printing Technology as Innovative Solutions for Biomedical Applications. Drug Discov. Today 2021, 26, 360–383. [Google Scholar] [CrossRef] [PubMed]
- Zheng, X.; Guo, X.; Watanabe, I. A Mathematically Defined 3D Auxetic Metamaterial with Tunable Mechanical and Conduction Properties. Mater. Des. 2021, 198, 109313. [Google Scholar] [CrossRef]
- Qi, C.; Jiang, F.; Remennikov, A.; Pei, L.Z.; Liu, J.; Wang, J.S.; Liao, X.W.; Yang, S. Quasi-Static Crushing Behavior of Novel Re-Entrant Circular Auxetic Honeycombs. Compos. Part B Eng. 2020, 197, 108117. [Google Scholar] [CrossRef]
- Airoldi, A.; Bettini, P.; Panichelli, P.; Sala, G. Chiral Topologies for Composite Morphing Structures—Part II: Novel Configurations and Technological Processes. Phys. Status Solidi Basic Res. 2015, 252, 1446–1454. [Google Scholar] [CrossRef]
- Duncan, O.; Shepherd, T.; Moroney, C.; Foster, L.; Venkatraman, P.D.; Winwood, K.; Allen, T.; Alderson, A. Review of Auxetic Materials for Sports Applications: Expanding Options in Comfort and Protection. Appl. Sci. 2018, 8, 941. [Google Scholar] [CrossRef]
- Weng, L.; Zhou, J.; Cai, R. Analytical Model of Li-Ion Diffusion-Induced Stress in Nanowire and Negative Poisson’s Ratio Electrode under Different Operations. Int. J. Mech. Sci. 2018, 141, 245–261. [Google Scholar] [CrossRef]
- Kolken, H.M.A.; Janbaz, S.; Leeflang, S.M.A.; Lietaert, K.; Weinans, H.H.; Zadpoor, A.A. Rationally Designed Meta-Implants: A Combination of Auxetic and Conventional Meta-Biomaterials. Mater. Horiz. 2018, 5, 28–35. [Google Scholar] [CrossRef]
- Kolken, H.M.A.; Lietaert, K.; van der Sloten, T.; Pouran, B.; Meynen, A.; Van Loock, G.; Weinans, H.; Scheys, L.; Zadpoor, A.A. Mechanical Performance of Auxetic Meta-Biomaterials. J. Mech. Behav. Biomed. Mater. 2020, 104, 103658. [Google Scholar] [CrossRef] [PubMed]
- Kolken, H.M.A.; Garcia, A.F.; Du Plessis, A.; Rans, C.; Mirzaali, M.J.; Zadpoor, A.A. Fatigue Performance of Auxetic Meta-Biomaterials. Acta Biomater. 2021, 126, 511–523. [Google Scholar] [CrossRef] [PubMed]
- Kolken, H.M.A.; Garcia, A.F.; Du Plessis, A.; Meynen, A.; Rans, C.; Scheys, L.; Mirzaali, M.J.; Zadpoor, A.A. Mechanisms of Fatigue Crack Initiation and Propagation in Auxetic Meta-Biomaterials. Acta Biomater. 2022, 138, 398–409. [Google Scholar] [CrossRef] [PubMed]
- Wu, W.; Song, X.; Liang, J.; Xia, R.; Qian, G.; Fang, D. Mechanical Properties of Anti-Tetrachiral Auxetic Stents. Compos. Struct. 2018, 185, 381–392. [Google Scholar] [CrossRef]
- Yuan, X.; Chen, M.; Yao, Y.; Guo, X.; Huang, Y.; Peng, Z.; Xu, B.; Lv, B.; Tao, R.; Duan, S.; et al. Recent Progress in the Design and Fabrication of Multifunctional Structures Based on Metamaterials. Curr. Opin. Solid State Mater. Sci. 2021, 25, 100883. [Google Scholar] [CrossRef]
- Su, Y.; Xu, X.; Shi, J.; Huang, G. A 3D Mechanism-Driven Hexagonal Metamaterial: Evaluation of Auxetic Behavior. Int. J. Mech. Sci. 2021, 209, 106699. [Google Scholar] [CrossRef]
- Wei, Y.L.; Yang, Q.S.; Liu, X.; Tao, R. Multi-Bionic Mechanical Metamaterials: A Composite of FCC Lattice and Bone Structures. Int. J. Mech. Sci. 2022, 213, 106857. [Google Scholar] [CrossRef]
- Askari, M.; Hutchins, D.A.; Thomas, P.J.; Astolfi, L.; Watson, R.L.; Abdi, M.; Ricci, M.; Laureti, S.; Nie, L.; Freear, S.; et al. Additive Manufacturing of Metamaterials: A Review. Addit. Manuf. 2020, 36, 101562. [Google Scholar] [CrossRef]
- Wang, X.T.; Wang, B.; Li, X.W.; Ma, L. Mechanical Properties of 3D Re-Entrant Auxetic Cellular Structures. Int. J. Mech. Sci. 2017, 131–132, 396–407. [Google Scholar] [CrossRef]
- Mizzi, L.; Mahdi, E.M.; Titov, K.; Gatt, R.; Attard, D.; Evans, K.E.; Grima, J.N.; Tan, J.C. Mechanical Metamaterials with Star-Shaped Pores Exhibiting Negative and Zero Poisson’s Ratio. Mater. Des. 2018, 146, 28–37. [Google Scholar] [CrossRef]
- Wu, W.; Hu, W.; Qian, G.; Liao, H.; Xu, X.; Berto, F. Mechanical Design and Multifunctional Applications of Chiral Mechanical Metamaterials: A Review. Mater. Des. 2019, 180, 107950. [Google Scholar] [CrossRef]
- Xu, W.; Liu, Z.; Wang, L.; Zhu, P. 3D Chiral Metamaterial Modular Design with Highly-Tunable Tension-Twisting Properties. Mater. Today Commun. 2022, 30, 103006. [Google Scholar] [CrossRef]
- Morvaridi, M.; Carta, G.; Bosia, F.; Gliozzi, A.S.; Pugno, N.M.; Misseroni, D.; Brun, M. Hierarchical Auxetic and Isotropic Porous Medium with Extremely Negative Poisson’s Ratio. Extrem. Mech. Lett. 2021, 48, 101405. [Google Scholar] [CrossRef]
- Yao, J.; Sun, R.; Scarpa, F.; Remillat, C.; Gao, Y.; Su, Y. Two-Dimensional Graded Metamaterials with Auxetic Rectangular Perforations. Compos. Struct. 2021, 261, 113313. [Google Scholar] [CrossRef]
- Gao, Y.; Wei, X.; Han, X.; Zhou, Z.; Xiong, J. Novel 3D Auxetic Lattice Structures Developed Based on the Rotating Rigid Mechanism. Int. J. Solids Struct. 2021, 233, 111232. [Google Scholar] [CrossRef]
- Li, X.; Fan, R.; Fan, Z.; Lu, Y. Programmable Mechanical Metamaterials Based on Hierarchical Rotating Structures. Int. J. Solids Struct. 2021, 216, 145–155. [Google Scholar] [CrossRef]
- Boldrin, L.; Hummel, S.; Scarpa, F.; Di Maio, D.; Lira, C.; Ruzzene, M.; Remillat, C.D.L.; Lim, T.C.; Rajasekaran, R.; Patsias, S. Dynamic Behaviour of Auxetic Gradient Composite Hexagonal Honeycombs. Compos. Struct. 2016, 149, 114–124. [Google Scholar] [CrossRef]
- Hou, Y.; Tai, Y.H.; Lira, C.; Scarpa, F.; Yates, J.R.; Gu, B. The Bending and Failure of Sandwich Structures with Auxetic Gradient Cellular Cores. Compos. Part A Appl. Sci. Manuf. 2013, 49, 119–131. [Google Scholar] [CrossRef]
- Wu, X.; Su, Y.; Shi, J. In-Plane Impact Resistance Enhancement with a Graded Cell-Wall Angle Design for Auxetic Metamaterials. Compos. Struct. 2020, 247, 112451. [Google Scholar] [CrossRef]
- Wu, W.; Liu, P.; Kang, Z. A Novel Mechanical Metamaterial with Simultaneous Stretching- and Compression-Expanding Property. Mater. Des. 2021, 208, 109930. [Google Scholar] [CrossRef]
- Wei, Y.L.; Yang, Q.S.; Tao, R. SMP-Based Chiral Auxetic Mechanical Metamaterial with Tunable Bandgap Function. Int. J. Mech. Sci. 2021, 195, 106267. [Google Scholar] [CrossRef]
- Duan, S.; Xi, L.; Wen, W.; Fang, D. A Novel Design Method for 3D Positive and Negative Poisson’s Ratio Material Based on Tension-Twist Coupling Effects. Compos. Struct. 2020, 236, 111899. [Google Scholar] [CrossRef]
- Zhou, H.; Jia, K.; Wang, X.; Xiong, M.X.; Wang, Y. Experimental and Numerical Investigation of Low Velocity Impact Response of Foam Concrete Filled Auxetic Honeycombs. Thin-Walled Struct. 2020, 154, 106898. [Google Scholar] [CrossRef]
- Peng, X.; Soyarslan, C.; Bargmann, S. Phase Contrast Mediated Switch of Auxetic Mechanism in Composites of Infilled Re-Entrant Honeycomb Microstructures. Extrem. Mech. Lett. 2020, 35, 100641. [Google Scholar] [CrossRef]
- Xue, Y.; Wang, W.; Han, F. Enhanced Compressive Mechanical Properties of Aluminum Based Auxetic Lattice Structures Filled with Polymers. Compos. Part B Eng. 2019, 171, 183–191. [Google Scholar] [CrossRef]
- Gao, Q.; Liao, W.H. Energy Absorption of Thin Walled Tube Filled with Gradient Auxetic Structures-Theory and Simulation. Int. J. Mech. Sci. 2021, 201, 106475. [Google Scholar] [CrossRef]
- Simpson, J.; Kazancı, Z. Crushing Investigation of Crash Boxes Filled with Honeycomb and Re-Entrant (Auxetic) Lattices. Thin-Walled Struct. 2020, 150, 106676. [Google Scholar] [CrossRef]
- Gao, Q.; Liao, W.H.; Huang, C. Theoretical Predictions of Dynamic Responses of Cylindrical Sandwich Filled with Auxetic Structures under Impact Loading. Aerosp. Sci. Technol. 2020, 107, 106270. [Google Scholar] [CrossRef]
- Xue, Y.; Mu, J.; Huang, Y.; Zhou, L.; Shi, Z. Compressive Mechanical Properties of Ex-Situ Auxetic Composite-Filled Tubes. J. Mater. Res. Technol. 2021, 14, 1644–1654. [Google Scholar] [CrossRef]
- Mohsenizadeh, S.; Ahmad, Z. Auxeticity Effect on Crushing Characteristics of Auxetic Foam-Filled Square Tubes under Axial Loading. Thin-Walled Struct. 2019, 145, 106379. [Google Scholar] [CrossRef]
- Zhang, K.; Zhang, X.; Gao, Q.; Chan, M.; Zhang, S.; Li, J.; Liao, W.H. Ultrahigh Energy-Dissipation and Multifunctional Auxetic Polymeric Foam Inspired by Balloon Art. Compos. Part A Appl. Sci. Manuf. 2023, 167, 107435. [Google Scholar] [CrossRef]
- Kim, E.; Zhang, H.; Lee, J.H.; Chen, H.; Zhang, H.; Javed, M.H.; Shen, X.; Kim, J.K. MXene/Polyurethane Auxetic Composite Foam for Electromagnetic Interference Shielding and Impact Attenuation. Compos. Part A Appl. Sci. Manuf. 2021, 147, 106430. [Google Scholar] [CrossRef]
- Airoldi, A.; Novak, N.; Sgobba, F.; Gilardelli, A.; Borovinšek, M. Foam-Filled Energy Absorbers with Auxetic Behaviour for Localized Impacts. Mater. Sci. Eng. A 2020, 788, 139500. [Google Scholar] [CrossRef]
- Ren, X.; Zhang, Y.; Han, C.Z.; Han, D.; Zhang, X.Y.; Zhang, X.G.; Xie, Y.M. Mechanical Properties of Foam-Filled Auxetic Circular Tubes: Experimental and Numerical Study. Thin-Walled Struct. 2022, 170, 108584. [Google Scholar] [CrossRef]
- McCormick, N.; Lord, J. Digital Image Correlation. Mater. Today 2010, 13, 52–54. [Google Scholar] [CrossRef]
- Open CASCADE Technology, 3D Modeling & Numerical Simulation. 2008. Available online: http//www.opencascade.org (accessed on 1 March 2010).
- Nielson, G.M. Dual Marching Cubes. In Proceedings of the IEEE Visualization 2004, Washington, DC, USA, 10–15 October 2004; IEEE Computer Society: Washington, DC, USA, 2004; pp. 489–496. [Google Scholar]
- Cohen-Or, D.; Kadosh, A.; Levin, D.; Yagel, R. Smooth Boundary Surfaces from Binary 3D Datasets. In Volume Graphics; Springer: London, UK, 2000. [Google Scholar]
- Elenskaya, N.; Tashkinov, M. Modeling of Deformation Behavior of Gyroid and I-WP Polymer Lattice Structures with a Porosity Gradient. Procedia Struct. Integr. 2021, 32, 253–260. [Google Scholar] [CrossRef]
- Tashkinov, M.A. Methods of Stochastic Mechanics for Characterization of Deformation in Randomly Reinforced Composite Materials. In Mechanics of Advanced Materials; Silberschmidt, V.V., Matveenko, V.P., Eds.; Springer: Cham, Switzerland, 2015; pp. 43–78. ISBN 978-3-319-17118-0; 978-3-319-17117-3. [Google Scholar]
- Tashkinov, M. Statistical Characteristics of Structural Stochastic Stress and Strain Fields in Polydisperse Heterogeneous Solid Media. Comput. Mater. Sci. 2014, 94, 44–50. [Google Scholar] [CrossRef]
- Tashkinov, M.A. Multipoint Stochastic Approach to Localization of Microscale Elastic Behavior of Random Heterogeneous Media. Comput. Struct. 2021, 249, 106474. [Google Scholar] [CrossRef]
- Tashkinov, M. Micro-Scale Modeling of Phase-Level Elastic Fields of SiC Reinforced Metal Matrix Multiphase Composites Using Statistical Approach. Comput. Mater. Sci. 2016, 116, 113–121. [Google Scholar] [CrossRef]
- Allum, J.; Gleadall, A.; Silberschmidt, V.V. Fracture of 3D-Printed Polymers: Crucial Role of Filament-Scale Geometric Features. Eng. Fract. Mech. 2020, 224, 106818. [Google Scholar] [CrossRef]


| Elastic Modulus of Auxetic-Lattice, , Mpa | Elastic Modulus of Filler, , MPa | Ratio between Elastic Moduli, |
|---|---|---|
| 2000 | 600 | 0.3 |
| 200 | 0.1 | |
| 60 | 0.03 | |
| 20 | 0.01 | |
| 2 | 0.001 | |
| 0.2 | 0.0001 |
| Elastic modulus of filler , MPa | 600 | 200 | 60 | 20 | 2 | 0.2 | 0 |
| Relation between elastic moduli | 0.3 | 0.1 | 0.03 | 0.01 | 0.001 | 0.0001 | 0 |
| Axial orientation of structure |  |  |  |  | 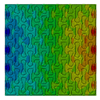 |  | 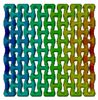 |
| Transversal orientation of structure | 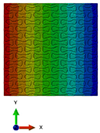 |  |  | 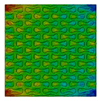 | 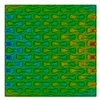 |  | 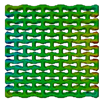 |
| Non-auxetic | Auxetic | ||||||
| Modulus of Filler, MPa | Poisson’s Ratios | Global Poisson’s Ratio | ||
|---|---|---|---|---|
| 200 (0.1) | 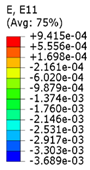 |  | 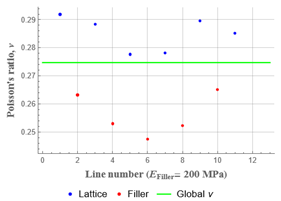 | 0.27 |
| 20 (0.01) | 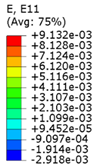 | 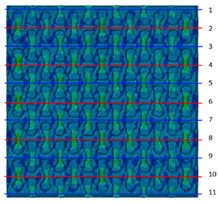 | 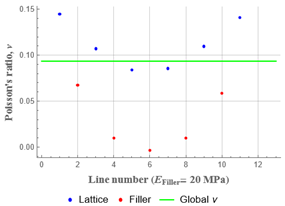 | 0.09 |
| 0.2 (10−4) | 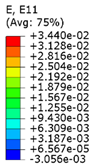 | 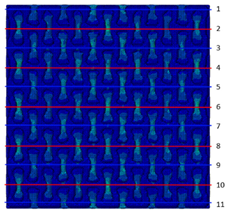 | 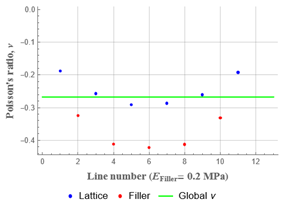 | −0.27 |
| Modulus of Filler, MPa | Poisson’s Ratio | Global Poisson’s Ratio | ||
|---|---|---|---|---|
| 200 (0.1) | 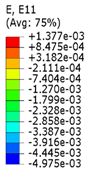 | 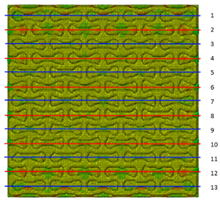 | 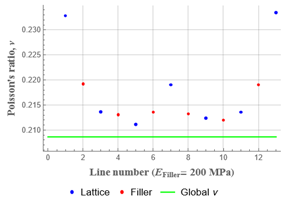 | 0.21 |
| 2 (10−3) |  | 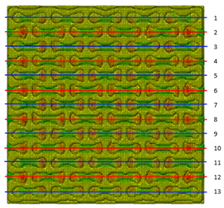 |  | −0.01 |
| 0.2 (10−4) | 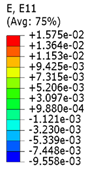 | 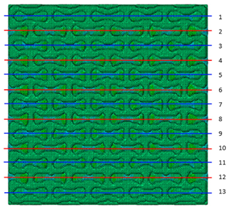 |  | −0.02 |
Disclaimer/Publisher’s Note: The statements, opinions and data contained in all publications are solely those of the individual author(s) and contributor(s) and not of MDPI and/or the editor(s). MDPI and/or the editor(s) disclaim responsibility for any injury to people or property resulting from any ideas, methods, instructions or products referred to in the content. |
© 2023 by the authors. Licensee MDPI, Basel, Switzerland. This article is an open access article distributed under the terms and conditions of the Creative Commons Attribution (CC BY) license (https://creativecommons.org/licenses/by/4.0/).
Share and Cite
Tashkinov, M.; Tarasova, A.; Vindokurov, I.; Silberschmidt, V.V. Composites with Re-Entrant Lattice: Effect of Filler on Auxetic Behaviour. Polymers 2023, 15, 4076. https://doi.org/10.3390/polym15204076
Tashkinov M, Tarasova A, Vindokurov I, Silberschmidt VV. Composites with Re-Entrant Lattice: Effect of Filler on Auxetic Behaviour. Polymers. 2023; 15(20):4076. https://doi.org/10.3390/polym15204076
Chicago/Turabian StyleTashkinov, Mikhail, Anastasia Tarasova, Ilia Vindokurov, and Vadim V. Silberschmidt. 2023. "Composites with Re-Entrant Lattice: Effect of Filler on Auxetic Behaviour" Polymers 15, no. 20: 4076. https://doi.org/10.3390/polym15204076
APA StyleTashkinov, M., Tarasova, A., Vindokurov, I., & Silberschmidt, V. V. (2023). Composites with Re-Entrant Lattice: Effect of Filler on Auxetic Behaviour. Polymers, 15(20), 4076. https://doi.org/10.3390/polym15204076