Article

Investigation of Hole-Transfer Dynamics through Simple EL De-Convolution in Non-Fullerene Organic Solar Cells

1
Department of Semiconductor Physics and EHSRC, University of Ulsan, Ulsan 44610, Republic of Korea
2
Advanced Photonics Research Institute, Gwangju Institute of Science and Technology, Gwangju 61005, Republic of Korea
3
Department of Energy Engineering, School of Energy and Chemical Engineering, Ulsan National Institute of Science and Technology (UNIST), Ulsan 44919, Republic of Korea
*
Author to whom correspondence should be addressed.
These authors contributed equally to this work.
Polymers 2023, 15(20), 4042; https://doi.org/10.3390/polym15204042
Submission received: 6 September 2023 / Revised: 5 October 2023 / Accepted: 6 October 2023 / Published: 10 October 2023
(This article belongs to the Section Polymer Analysis and Characterization)

Abstract

:
In conventional fullerene-based organic photovoltaics (OPVs), in which the excited electrons from the donor are transferred to the acceptor, the electron charge transfer state (eECT) that electrons pass through has a great influence on the device’s performance. In a bulk-heterojunction (BHJ) system based on a low bandgap non-fullerene acceptor (NFA), however, a hole charge transfer state (hECT) from the acceptor to the donor has a greater influence on the device’s performance. The accurate determination of hECT is essential for achieving further enhancement in the performance of non-fullerene organic solar cells. However, the discovery of a method to determine the exact hECT remains an open challenge. Here, we suggest a simple method to determine the exact hECT level via deconvolution of the EL spectrum of the BHJ blend (ELB). To generalize, we have applied our ELB deconvolution method to nine different BHJ systems consisting of the combination of three donor polymers (PM6, PBDTTPD-HT, PTB7-Th) and three NFAs (Y6, IDIC, IEICO-4F). Under the conditions that (i) absorption of the donor and acceptor are separated sufficiently, and (ii) the onset part of the external quantum efficiency (EQE) is formed solely by the contribution of the acceptor only, ELB can be deconvoluted into the contribution of the singlet recombination of the acceptor and the radiative recombination via hECT. Through the deconvolution of ELB, we have clearly decided which part of the broad ELB spectrum should be used to apply the Marcus theory. Accurate determination of hECT is expected to be of great help in fine-tuning the energy level of donor polymers and NFAs by understanding the charge transfer mechanism clearly.

Graphical Abstract

1. Introduction

Organic photovoltaic cells (OPVs) based on the bulk-heterojunction (BHJ) blend of semiconducting polymers and small molecule acceptors are considered the most promising candidate as a future mobile energy source due to their advantages, including light weight, flexibility, and low-cost fabrication process [1,2,3,4,5]. The power conversion efficiency (PCE) of single-junction polymer solar cells has steadily increased and recently exceeded 18%. This was due to the introduction of non-fullerene acceptors (NFAs) [6,7,8]. The major advantage of NFAs is their relatively low energy loss, which can be as low as 0.4–0.5 eV [9,10]. It is generally believed that this energy loss is associated with the small charge transfer offset required to drive charge separation. In other words, charge separation efficiency is directly influenced by charge transfer offsets. Therefore, finding accurate information about the charge transfer (CT) state is essential for improving photovoltaic performance.
In the BHJ system based on a fullerene acceptor (f-BHJ), the electron transfer state (eECT) was determined by Marcus theory, which is based on the mirror image relationship between the photovoltaic external quantum efficiency (EQEPV) and electroluminescence (EL) emission [11,12]. All the charges that contribute to the onset part of the EQEPV are initially excited at the donor site, and then electrons are transferred to the acceptor through the eECT. Thus, if the EQEPV is measured with a very sensitive tool such as Fourier transform photocurrent spectroscopy EQE (FTPS-EQE), it is expected that the CT-bands are visible in the low-energy part of the EQEPV (see Figure 1a) [13,14]. In this framework, eECT was extracted by fitting the CT-band from the EQEPV and projecting it on the EL spectrum (Figure S1 and Table S1). In the BHJ system based on a low bandgap non-fullerene acceptor (nf-BHJ), however, the electron density excited in the acceptor itself is already high, and the low-energy onset part of EQEPV is also formed only by the contribution of the acceptor. Therefore, eECT created near the lowest unoccupied molecular orbital (LUMO) levels of donor and acceptor has little influence on the device performance, and there is no CT-band feature in the EQEPV onset (see Figure 1b) [13]. Rather, in this non-fullerene acceptor system, the energy offset associated with the hole transfer occurring on the highest occupied molecular orbital (HOMO) side of the donor and acceptor is more important. Accordingly, many previous studies to date have discussed the hole transfer on the HOMO side rather than electron transfer on the LUMO side [15,16,17,18,19]. Of course, there may be a change in photocurrent due to the influence of eECT in operation under the saturation mode, but the influence of eECT is negligible because there are no electrons transferring from the donor in the VOC formation near the EQE onset we consider.
A study by J. Zhang et al. [20] showed that the minimum HOMO offset needed to achieve the most efficient exciton dissociation and photovoltaic performance was ~40 meV, and the method for relative comparison of HOMO offset energy was demonstrated by Y. Xie et al. [21]. However, the former was just an estimate of the minimum value obtained through a simple comparison of the HOMO level difference and photovoltaic performance [20], and the latter was a relative comparison of estimated values obtained by determining EQEEL difference [21]. Thus, the discovery of a method to determine hole transport energy offsets by accurately measuring the ECT on the HOMO side (hECT) remains an open challenge. In recent research by J. Wu et al., it was pointed out that the key factor of the high efficiency of the PM6:Y6 system was because of the low energetic disorder due to the low energy offset [22]. Therefore, the accurate determination of hECT is essential for achieving further enhancements in the non-fullerene organic solar cell since it can be a guideline for the design of a higher-performing novel material.
In this work, we suggest a simple method to determine the exact hECT level via deconvolution of the EL spectrum of the BHJ blend (ELB). In general, the onset part of the EQE of the BHJ blend with NFA is formed solely by the contribution of the acceptor itself. In an EL measurement, electrons are injected directly into the acceptor LUMO, and holes are initially injected into the HOMO of the donor and then transferred to the acceptor through hECT. Thus, ELB has constraints on both the singlet recombination of the acceptor and the radiative recombination via hECT. Therefore, by deconvolution of ELB, it is possible to extract out the part of CT-band contribution. Through this, we can clearly decide which part of the broad ELB spectrum should be used to apply the Marcus theory. To generalize, we have applied our ELB deconvolution method to nine different BHJ systems consisting of the combination of three donor polymers (PM6, PBDTTPD-HT, PTB7-Th) and three NFAs (Y6, IDIC, IEICO-4F).

2. Materials and Methods

2.1. Device Fabrication

All organic solar cell devices were fabricated with an inverted structure of ITO/ZnO/BHJ/MoO3/Ag. Patterned indium tin oxide (ITO) on glass was was purchased from AMG (Seoul, Republic of Korea). It was cleaned in an ultrasonic bath of detergent, acetone (99.9%), and isopropyl alcohol (IPA, 99.9%) for 10 min each and UV-ozone treated for 60 min. A 0.75 M ZnO sol-gel was prepared with 3.28 g of zinc acetate dihydrate (Zn(CH3COO)2∙2H2O, 98%), 1 mL of ethanolamine (NH2CH2CH2OH, 99.5%), and 20 mL of 2-methoxyethanol (CH3OCH2CH2OH, 99.9%). The ZnO sol-gel was spin-coated on ITO glass at 5000 rpm for 30 s under ambient conditions and thermally annealed at 200 °C. The employed BHJs are as follows: PM6: Y6 (D:A = 1:1.2, 16.5 mg/mL in chloroform (CF, 99%) with 0.5 v/v% of chloronaphthalene (CN, ≥90%) additive), PM6: IDIC (D:A = 1:1, 18 mg/mL in CF with 0.5 v/v% 1,8-diiodooctane (DIO, 98%) additive), PM6: IEICO-4F (D:A = 1:1.5, 18 mg/mL in CF with 0.5 v/v% of CN additive), PBDTTPD-HT: Y6 (D:A = 1:1.4, 20 mg/mL in CF with 0.5 v/v% of DIO additive), PBDTTPD-HT: IDIC (D:A = 1:1.4, 18 mg/mL in CF with 0.8 v/v% of DIO additive), PBDTTPD-HT: IEICO-4F (D:A = 1:1.5, 20 mg/mL in CF with 0.5 v/v% of CN additive), PTB7-Th: Y6 (D:A = 1:1.5, 20 mg/mL in CF with 0.5 v/v% of CN additive), PTB7-Th: IDIC (D:A = 1:1.5, 20 mg/mL in CF with 0.5 v/v% of DIO additive), and PTB7-Th: IEICO-4F (D:A = 1:1.5, 20 mg/mL in CF with 3 v/v% of CN additive).The BHJs were spin-coated at 5000 rpm for 30 s on the ZnO layer and moved to a vacuum chamber. The hole-transport layer (MoO3, 99.9%, 5.5 nm) and metal electrode (Ag, 99.99%, 100 nm) were deposited via thermal evaporation under a vacuum of 2 × 10⁻⁶ Torr. All materials except donor and acceptor materials were purchased from Sigma Aldrich (St. Louis, MO, USA). Detailed information on PM6, PBDTTPD-HT, and Y6 can be found in our previous works [23,24]. PTB7-Th, IDIC, and IEICO-4F were procured from 1-Material Inc. (Dorval, Quebec, Canada). The device area was 0.13 cm2.

2.2. Device Characterization

The power conversion efficiencies of the devices were measured by current density-voltage (J-V) curves using a Keithley 2401 (Keithley instruments, Cleveland, OH, USA) source measurement unit under AM 1.5 G (100 mW/cm2) illumination from a solar simulator (McScience, Suwon, Republic of Korea). The simulated light intensity was calibrated using a standard Si solar cell. External quantum efficiency (EQE) was measured using a solar cell spectral response/QE/IPCE (IQE-200B, Newport Co., Irvine, CA, USA). The light intensity at each wavelength was calibrated using a standard Si solar cell.
The absorption spectra of each BHJ layer were measured by using a UV-Vis spectrophotometer (Cary 5000, Agilent Technologies Inc., Santa Clara, CA, USA). Electroluminescence (EL) signals passed through the integral sphere and were recorded by using a high-sensitivity spectrophotometer (MAYA 2000 Pro, Ocean Insight Inc., Orlando, FL, USA). The wavelength of the PL excitation source was 632 nm. The integral sphere and spectrophotometer were calibrated to collect the radiated photon flux from the device by using a standard halogen calibration light source (HL-3-plus-INT-CAL, Ocean Insight Inc., FL, USA).
Fourier transform photocurrent spectroscopy (FTPS) was used to perform measurements in an FTPS setup built in-house, which consisted of a Fourier-transform infrared spectrometer (INVENIO-R, Bruker Co., Billerica, MA, USA) equipped with quartz beam splitter. The photocurrent produced by the solar cell under illumination was amplified using a low-noise preamplifier (SR570, Stanford Research Systems, Sunnyvale, CA, USA) and fed back into the external detector port of the FTIR.
The steady-state photoluminescence (PL) spectra were obtained using a multichannel spectrophotometer (QEPro, Ocean Insight Inc., FL, USA). In PL measurements, acceptors and BHJs were excited from active layer side using a continuous wave diode laser (Nd-YAG tuned at 532 nm). To calculate the hole-transfer yields, PL spectra were divided by the absorption intensity at the 532 nm. Femtosecond transient absorption (TA) spectra were obtained using a homemade TA measurement system comprising a femtosecond Ti:sapphire regenerative amplifier system (Hurricane, Spectra-Physics Inc., Milpitas, CA, USA) with a 1 kHz repetition rate, an optical parametric amplifier (OPA-800CF, Spectra-Physics Inc., CA, USA), and multichannel spectrometers (QEPro and NIRQUEST, Ocean Insight Inc., FL, USA). The pump pulse wavelength was 630 nm with a power density of ~1 µJ/cm2.

3. Result and Discussion

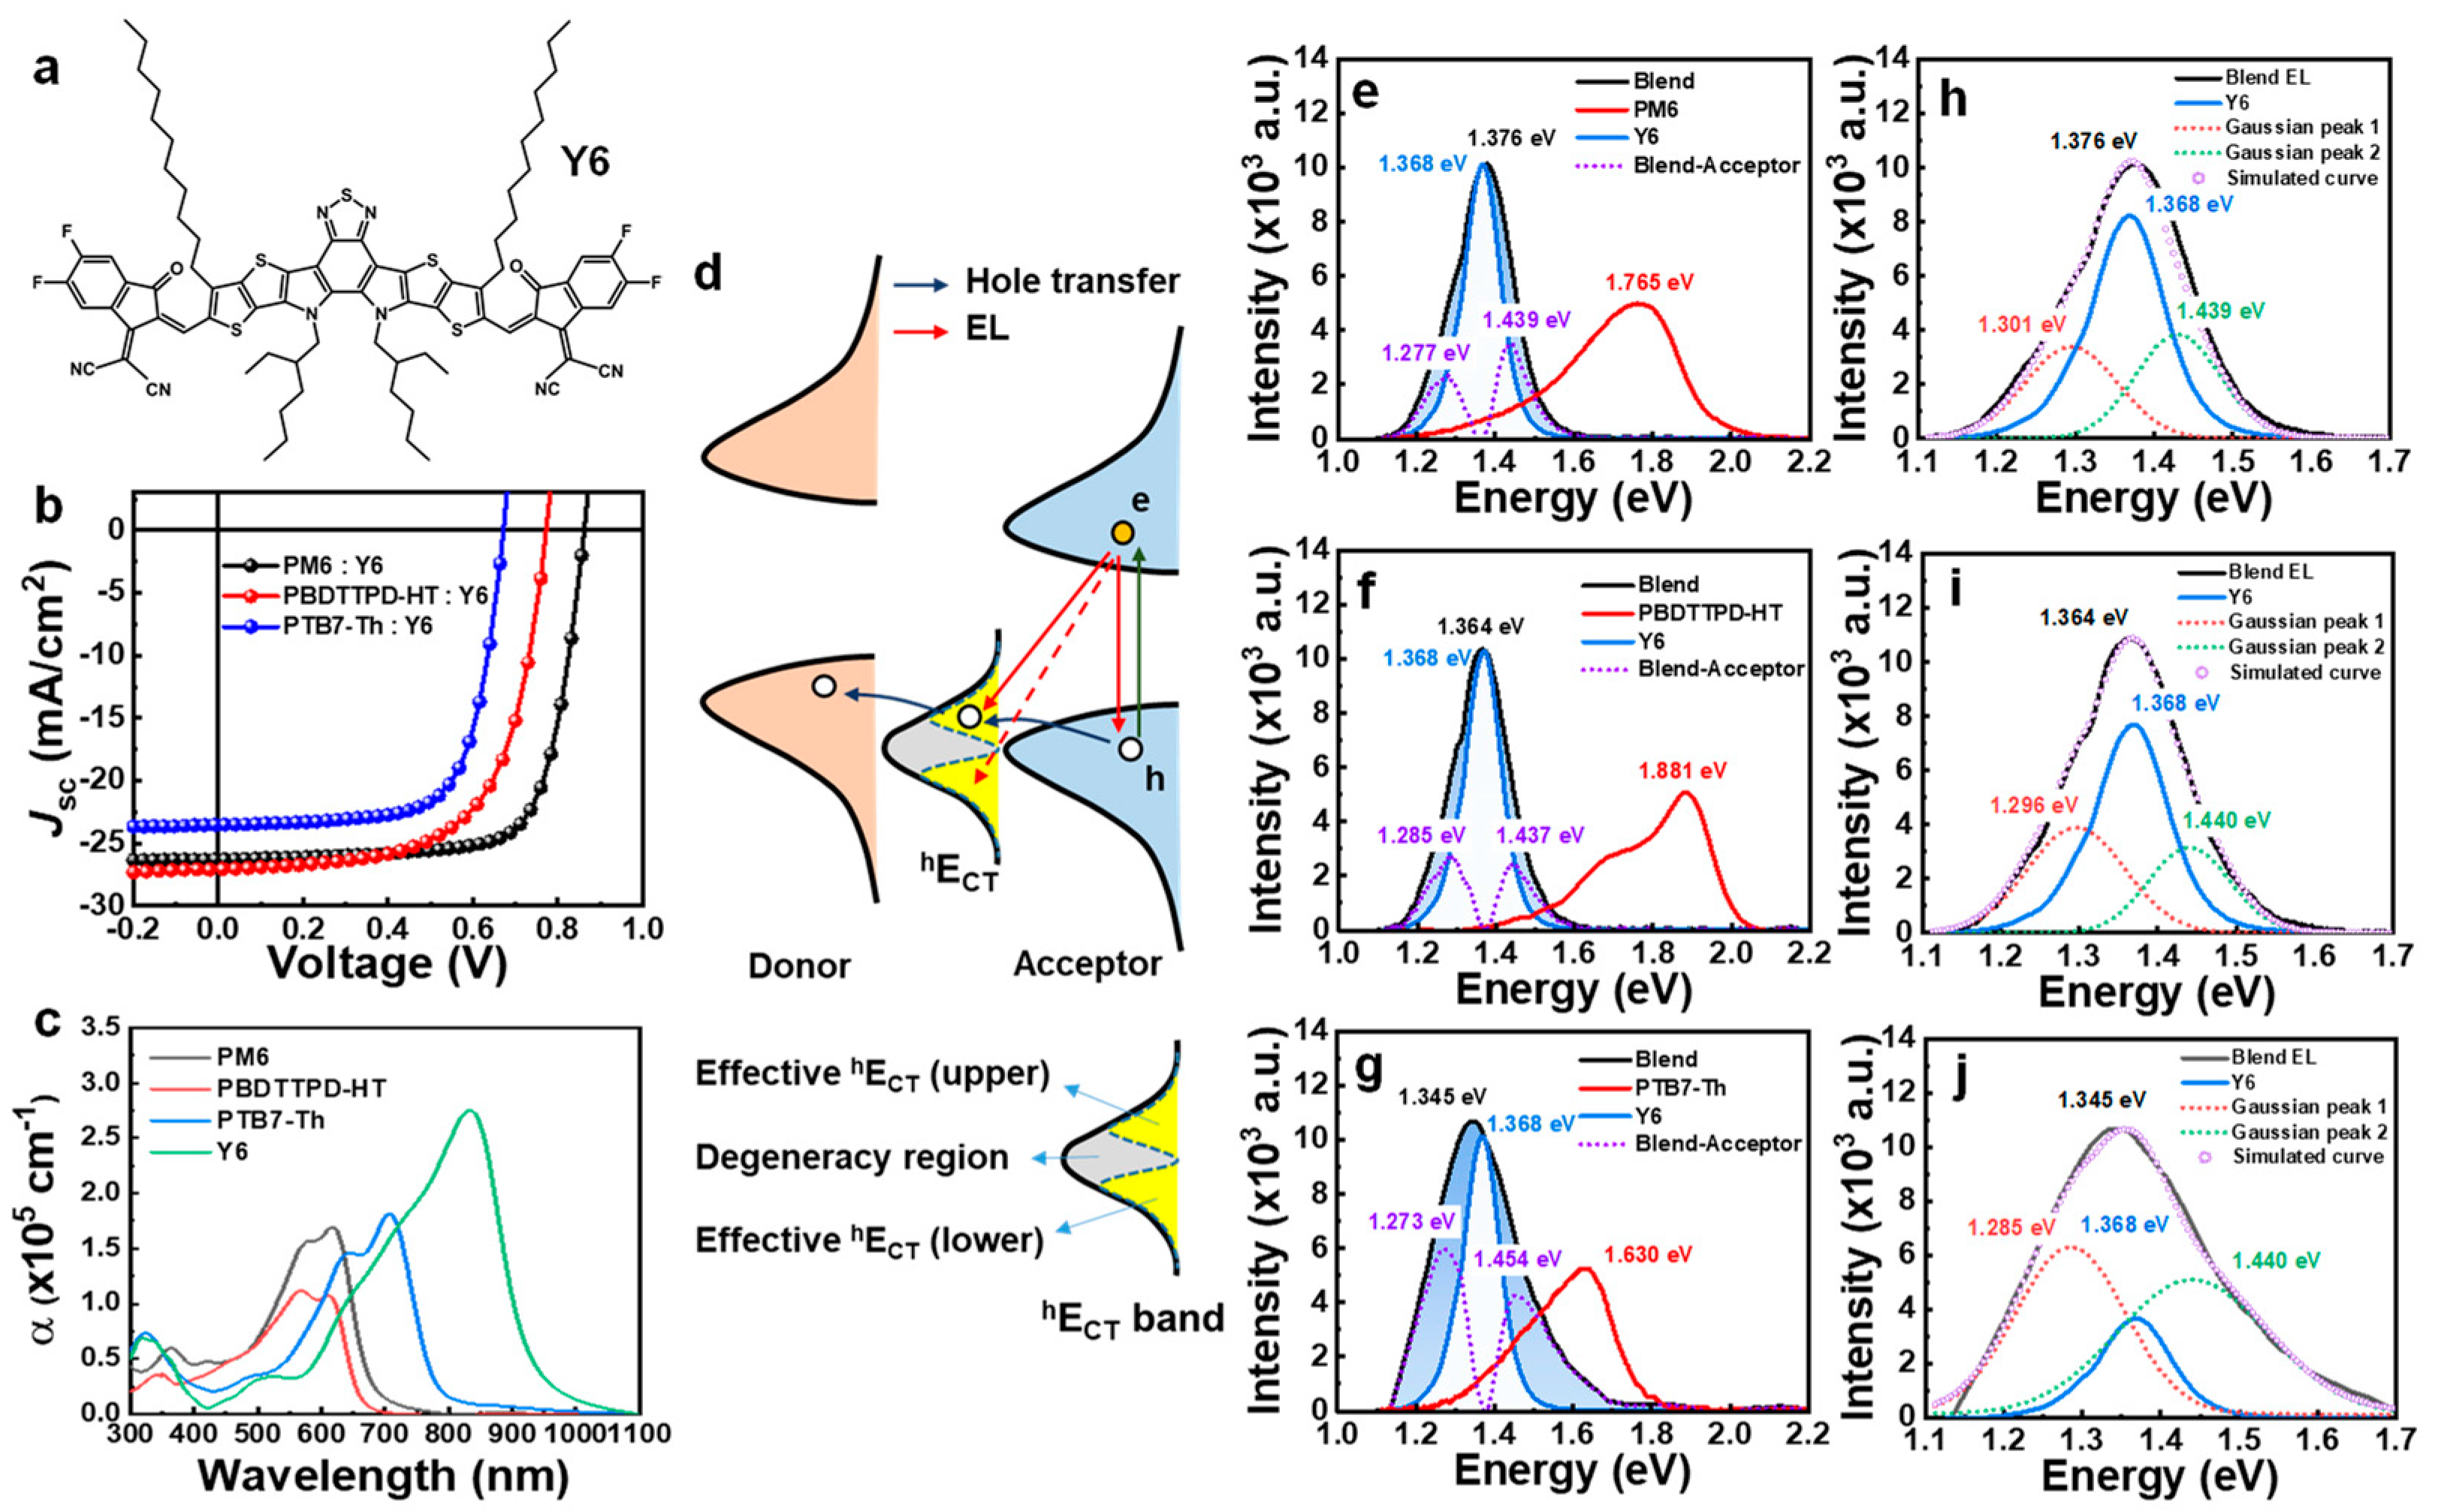
3.1. Y6 Acceptor Based nf-BHJ Systems

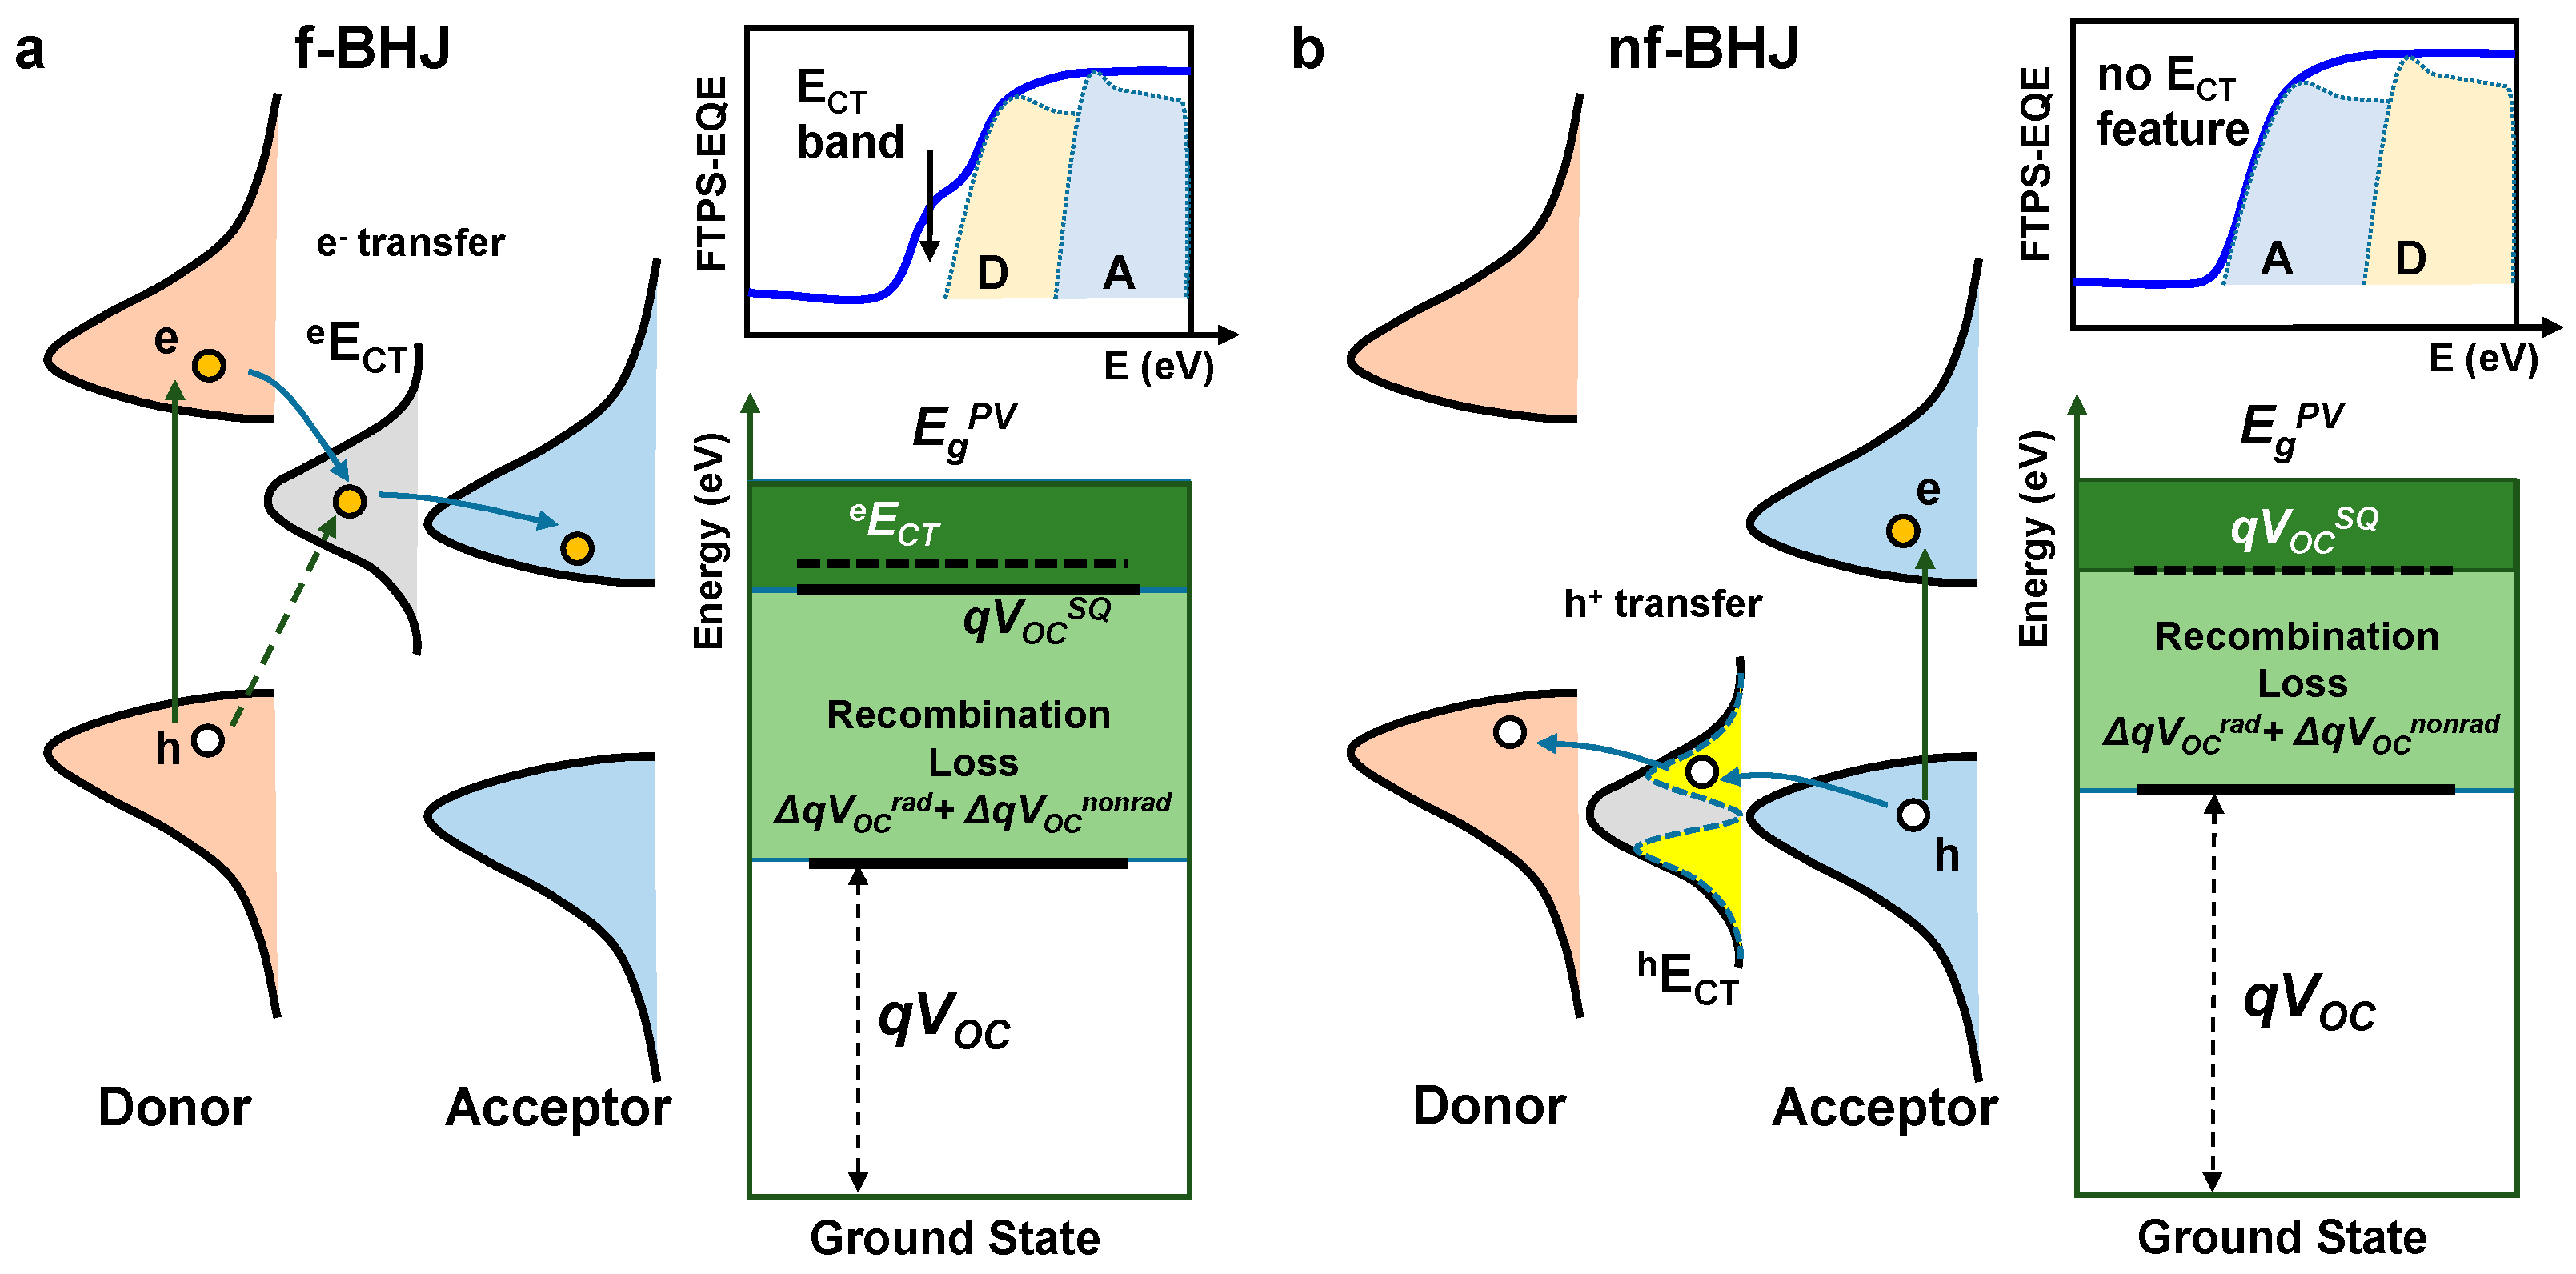
3.1.1. Background of hECT Determination

We first analyzed the BHJ systems based on the representative non-fullerene acceptor Y6 (Figure 2a) with three donor polymers: PM6, PBDTTPD-HT, and PTB7-Th (Figure S2). Figure 2b shows the current density (J)–voltage (V) characteristics of OPVs. The parameters related to the performance of these OPVs are listed in Table S2. The acceptor Y6 has a lower bandgap and higher absorption coefficient than those of the three donors we used, as shown in Figure 2c. Thus, in the low-energy onset part of EQE spectra, there is no photocurrent contribution from the donor. All the contributions originated from Y6 only (Figure S4), which means that all photoexcited electrons are created in the acceptor and then extracted to the cathode directly. In the case of holes, they would be transferred to the donor through the hECT level and then extracted to the anode electrode (Figure 2d). Therefore, as similar to the FTPS-EQE onset of the f-BHJ system in which electrons generated from the donor are transferred to the acceptor has the information eECT, the FTPS-EQE onset of nf-BHJ system will have information on hECT. In the case of the f-BHJ system, since the eECT bands are quite visible in the low-energy part of the FTPS-EQE spectrum, after determining the reorganization energy (λ) by fitting the eECT signal of the EQE, the fitting can be applied to the EL spectrum (Figure S1). However, in the case of the nf-BHJ systems, since there is no CT band feature in FTPS-EQE onset, we designed a way to secure the information of the hECT band from the EL spectrum and reflect it to FTPS-EQE.
Under the EL measurement mode, the electrons are directly injected into the LUMO of the acceptor, while the holes are injected into the HOMO of the donor and transferred to the acceptor through hECT. Thus, the hole injection can be hindered because the HOMO offset acts as a potential barrier. In ELB, of course, the EL emission from the singlet of the acceptor will be dominant. However, since there is the possibility of radiative recombination between electrons at LUMO of acceptor and holes at the hECT, both radiative charge recombination from singlet excitons and hECT states are superimposed in the ELB spectrum. Our first goal is to extract the contribution of the hECT in ELB to apply the Marcus theory from EL to FTPS-EQE. To achieve this, the exact position of hECT emission should be addressed. To estimate the underlying contribution from hECT, we have simply subtracted the acceptor EL (ELA) spectrum from ELB. Figure 2e–g shows the difference in the EL spectrum obtained from PM6:Y6, PBDTTPD-HT:Y6, and PTB7-Th:Y6, respectively. The difference in the EL spectrum (shaded blue area) represents the EL contribution from hECT.

3.1.2. EL Deconvolution

To determine the exact peak position, Gaussian fittings for ELB were performed based on the information about the components obtained from ELB-ELA. In the case of PM6:Y6 ELB (Figure 2h), the spectrum was deconvoluted into three components. The peak in the center (1.372 eV) is obviously the singlet radiative recombination between the LUMO and HOMO of the acceptor. The peaks on both the low- and high-energy side are caused by the effective hECT band. It is likely that hECT does not exist at a finite level. It has a broad distribution near the acceptor’s HOMO. The hECT levels near the acceptor’s HOMO are like a degenerate state, so it will be indistinguishable. Therefore, the hECT band can be divided into three regions (Figure 2d). What we are interested in is the energy range that is lower than the acceptor’s HOMO (higher effective hECT), which affects energy loss. The hECT levels in the energy region that is higher than the acceptor’s HOMO (lower effective hECT) will be excluded from the analysis because this part has no effect on the energy loss of the solar cells. Moreover, there is some overlap with the tail of the donor’s EL (ELD). The results of the same Gaussian fittings for PBDTTPD-HT and PTB7-Th are shown in Figure 2i,j, respectively. In the case of the PBDTTPD-HT:Y6 blend, EL spectrum features are similar to the PM6:Y6 blend due to the similar energy band configurations. However, in the case of the PTB7-Th:Y6 system, it was determined that the contribution of singlet excitons was lower than that of hECT. Simply put, this means that the energy loss caused by hECT is greater in the PTB7-Th:Y6 blend.

3.1.3. Marcus Theory and Energy Loss Model

Now, we can apply the Marcus theory (Appendix A) to determine the exact ΔhECT (=EgPVhECT), where EgPV is the photovoltaic gap determined from the derivatives of EQEPV [25]. Based on the hECT position obtained through ELB deconvolution, it required as much reorganization energy (λ) to match the onset part of FTPS-EQE (Figure 3). The ΔhECT values obtained in this analysis were 0.030 eV for PM6:Y6, 0.058 eV for PBDTTPD-HT:Y6, and 0.044 eV for PTB7-Th:Y6. In many previous studies, ECT determination was performed using the maximum peak of ELB [26,27,28]. However, as confirmed in the previous discussion, the maximum peak region of the ELB contains a lot of the singlet contribution of the acceptor. Although a Gaussian fit can be matched to the FTPS-EQE spectrum, even if the CT state is analyzed based on the maximum of ELB, the extracted CT state value was nearly the same as or even larger than the bandgap of the Y6 acceptor (see Figure S5 and Table S3). Furthermore, many researchers simply considered ECT to be the same as qVOC in the Shockley–Queisser (SQ) limit (qVOCSQ). However, these two values have different theoretical backgrounds [29,30,31,32]. In our study, we compared the qVOCSQ values obtained through energy loss analysis with hECT (Figure S6). The results clearly showed that hECT and qVOCSQ have different values (Table S4). The results of the total energy loss analysis indicate that PM6:Y6 forms a large VOC compared to PBDTTPD-HT:Y6, which has similar energy band configuration due to the low ΔhECT, radiative energy loss (ΔE2 = qVOCSQqVOCrad, where qVOCrad is qVOC in the radiative limit), and non-radiative energy loss (ΔE3 = qVOCradqVOCnonrad, where qVOCnonrad is qVOC in the non-radiative limit; details are presented in Appendix B). In the case of PTB7-Th:Y6, although hole transfer is slightly better than the PBDTTPD-HT:Y6 due to the lower ΔhECT, PTB7-Th:Y6 has a large VOC loss due to relatively large values of ΔE2 and ΔE3.
In general, two methods are mainly utilized to determine ΔE3. When qVOCSQ and qVOCrad are derived theoretically based on measured JSC and FTPS-EQE, ΔE3 is determined by simply subtracting the qVOCrad from the VOC of the solar cells. Alternatively, ΔE3 can also be calculated using the theoretical approach given by ΔE3 = −kBTln(EQEEL), where kB is the Boltzmann constant, T is temperature, and EQEEL is the external radiative efficiency. Considering that the ELB of the nf-BHJ system consists of EL from the acceptor’s single recombination and EL from hECT, once EQEEL obtained based on ELB is used, both the contribution of the acceptor and the contribution of hECT are already included in the ΔE3 calculation. The fact that the non-radiative voltage loss can be further split into these two contributions was already recognized and reported in previous studies [20]. However, the problem is to accurately extract the contribution of the acceptor from only ELB. It is expected to be very difficult to extract only the contribution of acceptors in a general situation where ELA and hECT bands overlap each other. In particular, since there is also a degeneracy part between the hECT band and acceptor HOMO, it is currently impossible to completely separate the two components. Therefore, to obtain the exact ΔhECT, the application of Marcus theory through our EL deconvolution is the most accurate method so far. The effect of hECT on energy loss is already included in recombination loss (ΔE3) if ELB is used to extract EQEEL. On the other hand, the effect of eECT on energy loss is mainly reflected in ΔE1. ΔE1 should be selected with the larger of eECT and qVOCSQ (see Figure 1a). Of course, since there is a possibility of recombination between an electron at the eECT level and a hole at the HOMO of the donor, the effect of eECT is also included in ΔE3 if ELB is used to extract EQEEL.

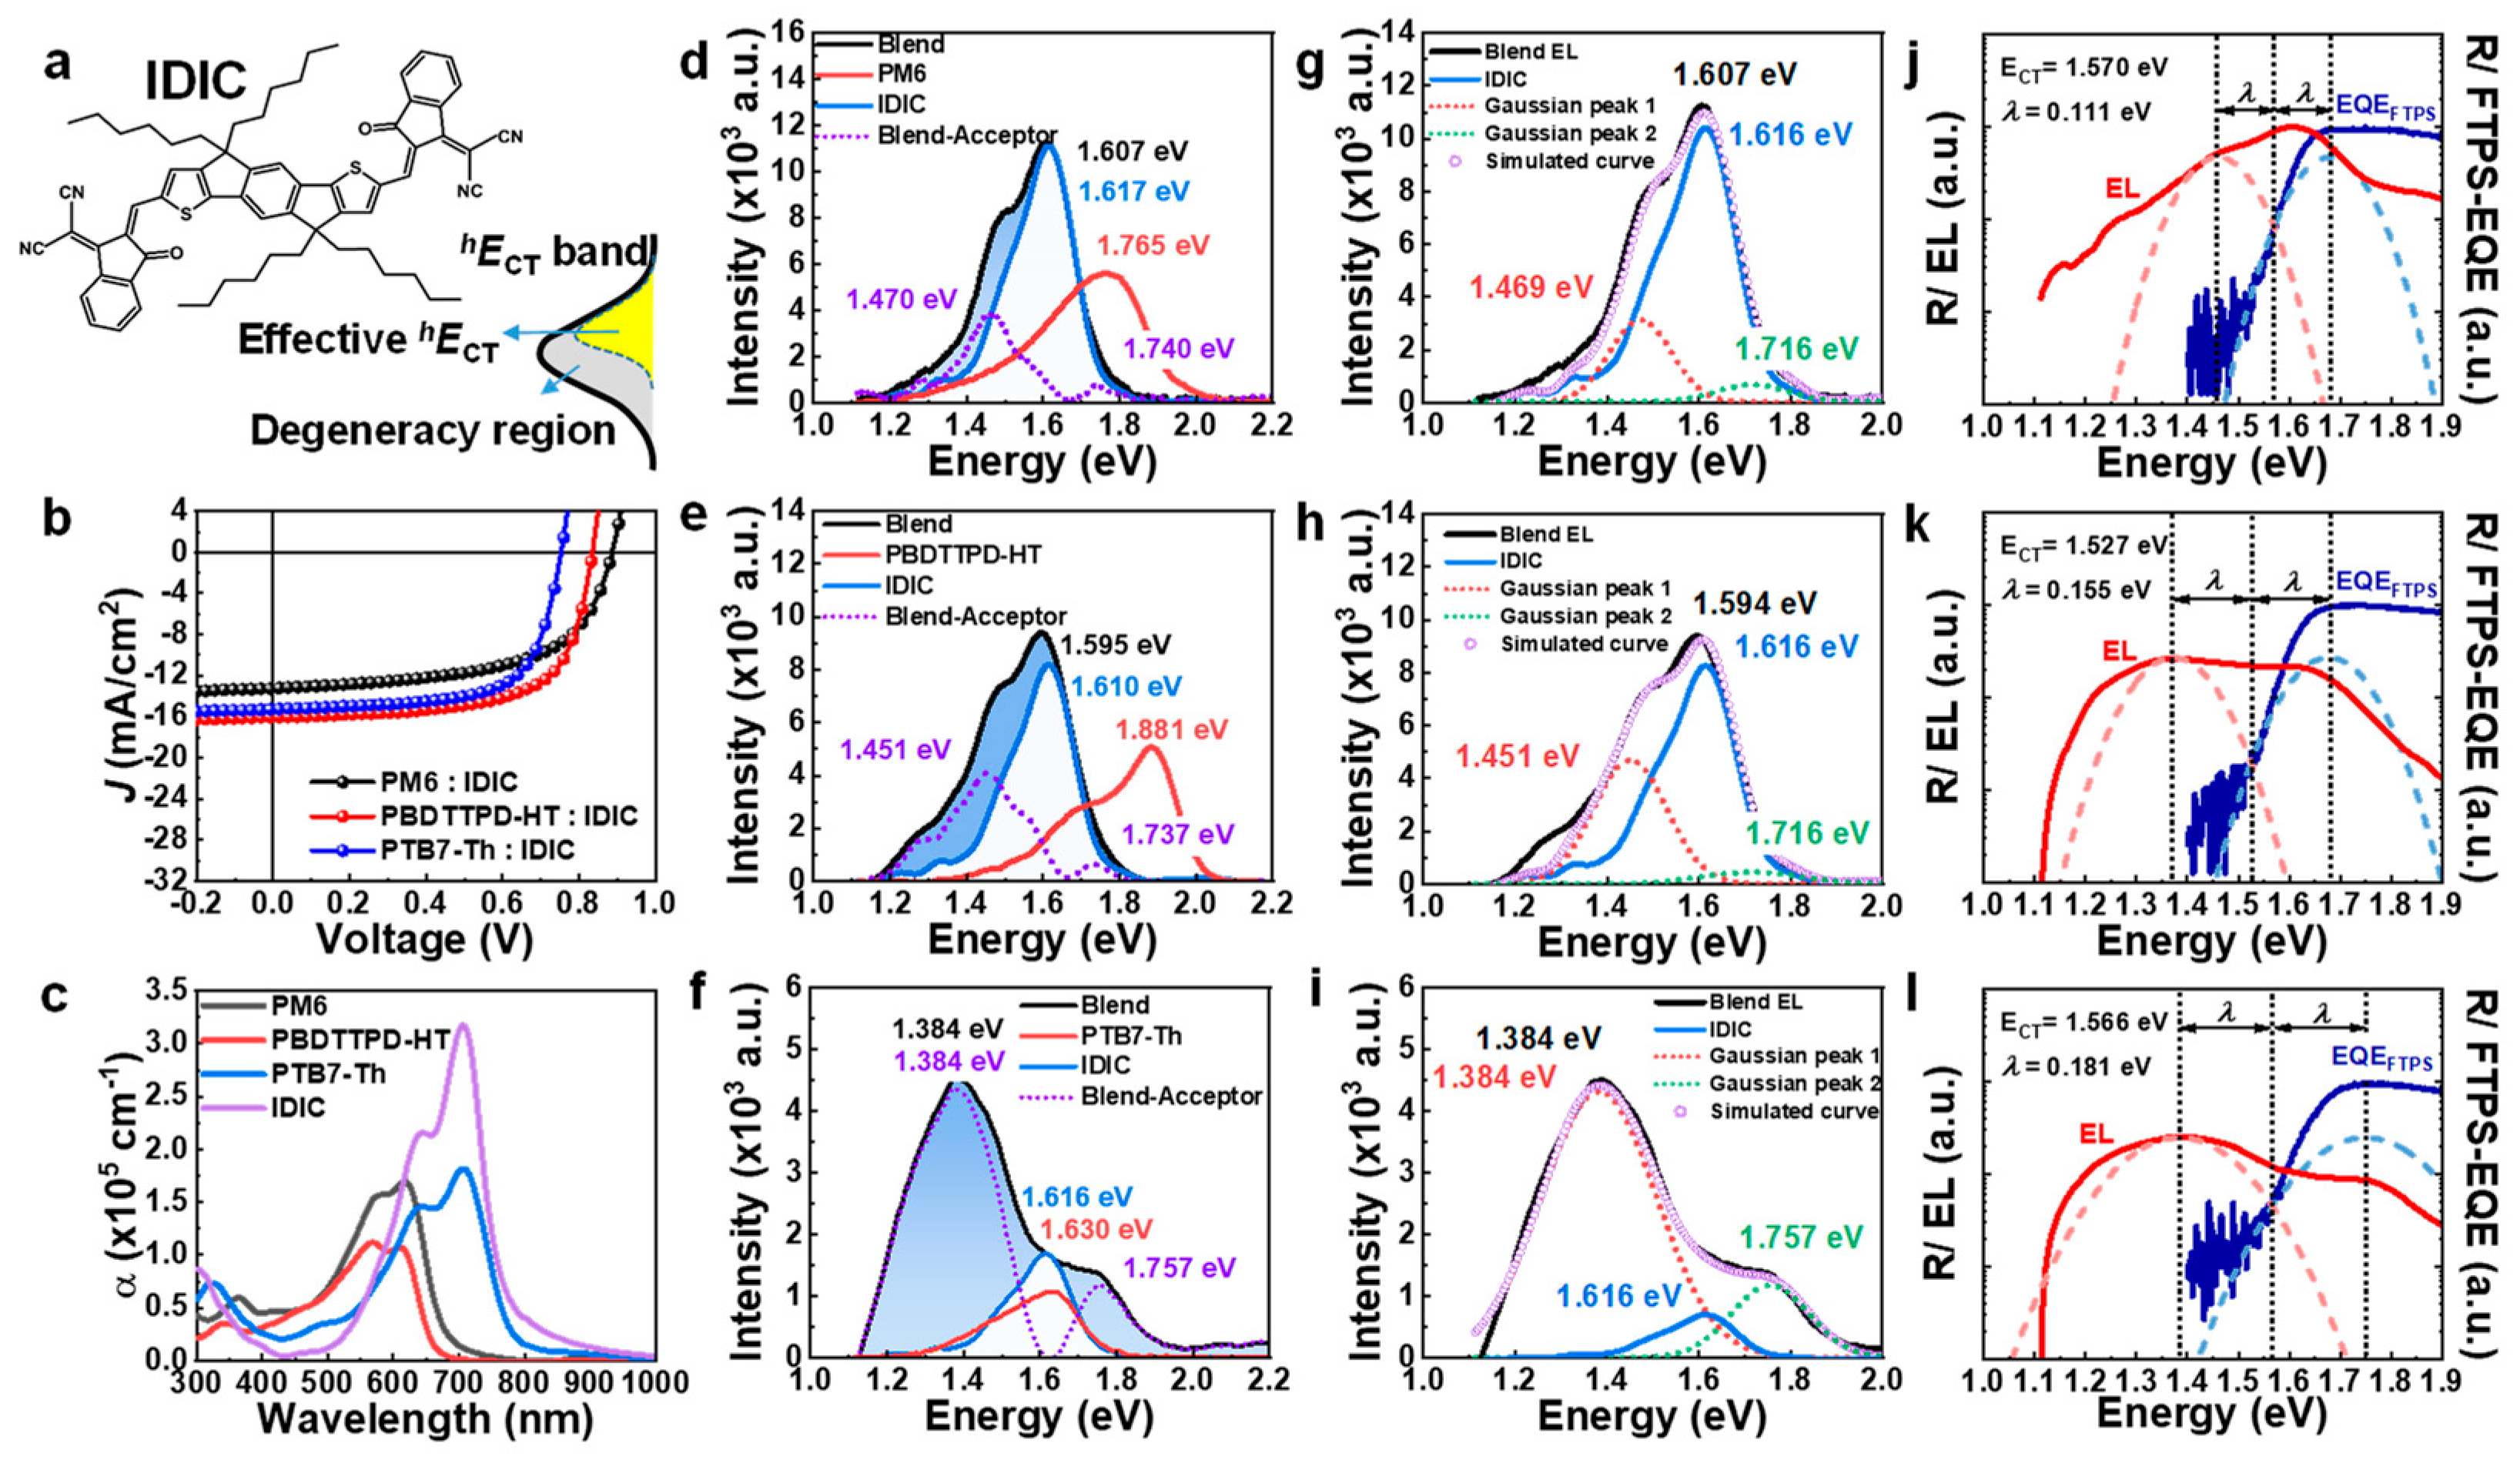
3.2. IDIC-Acceptor-Based nf-BHJ Systems (Larger HOMO Offset)

Next, we applied the EL deconvolution method to another NFA system, a BHJ blend with IDIC. The chemical structure and J-V characteristics of the IDIC system are shown in Figure 4a,b. The HOMO level of IDIC is similar to that of Y6, but it has a larger bandgap. Therefore, the absorption of IDIC largely overlaps with the donor polymers (Figure 4c). In particular, the absorption of IDIC completely overlaps with PTB7-Th absorption. These characteristics are directly reflected in the composition of EQE (Figure S7). For PM6:IDIC and PBDTTPD-HT:IDIC, though, the onset of EQEPV is based on the photo-carriers created by the absorption of the acceptors. In the case of the PTB7-Th:IDIC, both donor and acceptor appear to be involved. Figure 4d–f shows the difference between ELB and ELA. The peculiar point is that the contribution of the effective hECT was symmetric with respect to the HOMO of the acceptor in the case of Y6, whereas the IDIC system has an asymmetric shape where the lower-energy side is dominant. Thus, the effective hECT region is formed only on the upper side of the CT-band. In the case of PM6:IDIC and PBDTTPD-HT:IDIC, the maximum peak of ELB was the same as that of ELA, but in the case of PTB7-Th:IDIC, the maximum part of ELB was completely different from that of ELA. It can be seen that the CT-band contribution is much larger in PTB7-Th:IDIC only by a simple comparison of these EL deconvolutions. With this simple EL deconvolution analysis, it can be simply confirmed that the hECT band contribution in PTB7-Th:IDIC is much larger compared to PM6:IDIC and PBDTTPD-HT:IDIC. Exact ΔhECT obtained through accurate Gaussian fitting (Figure 4g–i) and Marcus theory (Figure 4j–l) for PM6:IDIC, PBDTTPD-HT:IDIC are shown in Table 1. The overall energy loss analysis results for the IDIC system are summarized in Figure S8 and Table S5. Note that it is impossible to distinguish whether it is ΔhECT or ΔeECT only with the current method in the case of PTB7-Th:IDIC blend. Of course, this discernment is also not possible with the conventional method (Gaussian fitting of FTPS-EQE and then matching to the maximum of ELB). The conventional method also gave unacceptable values (Figure S9 and Table S6).

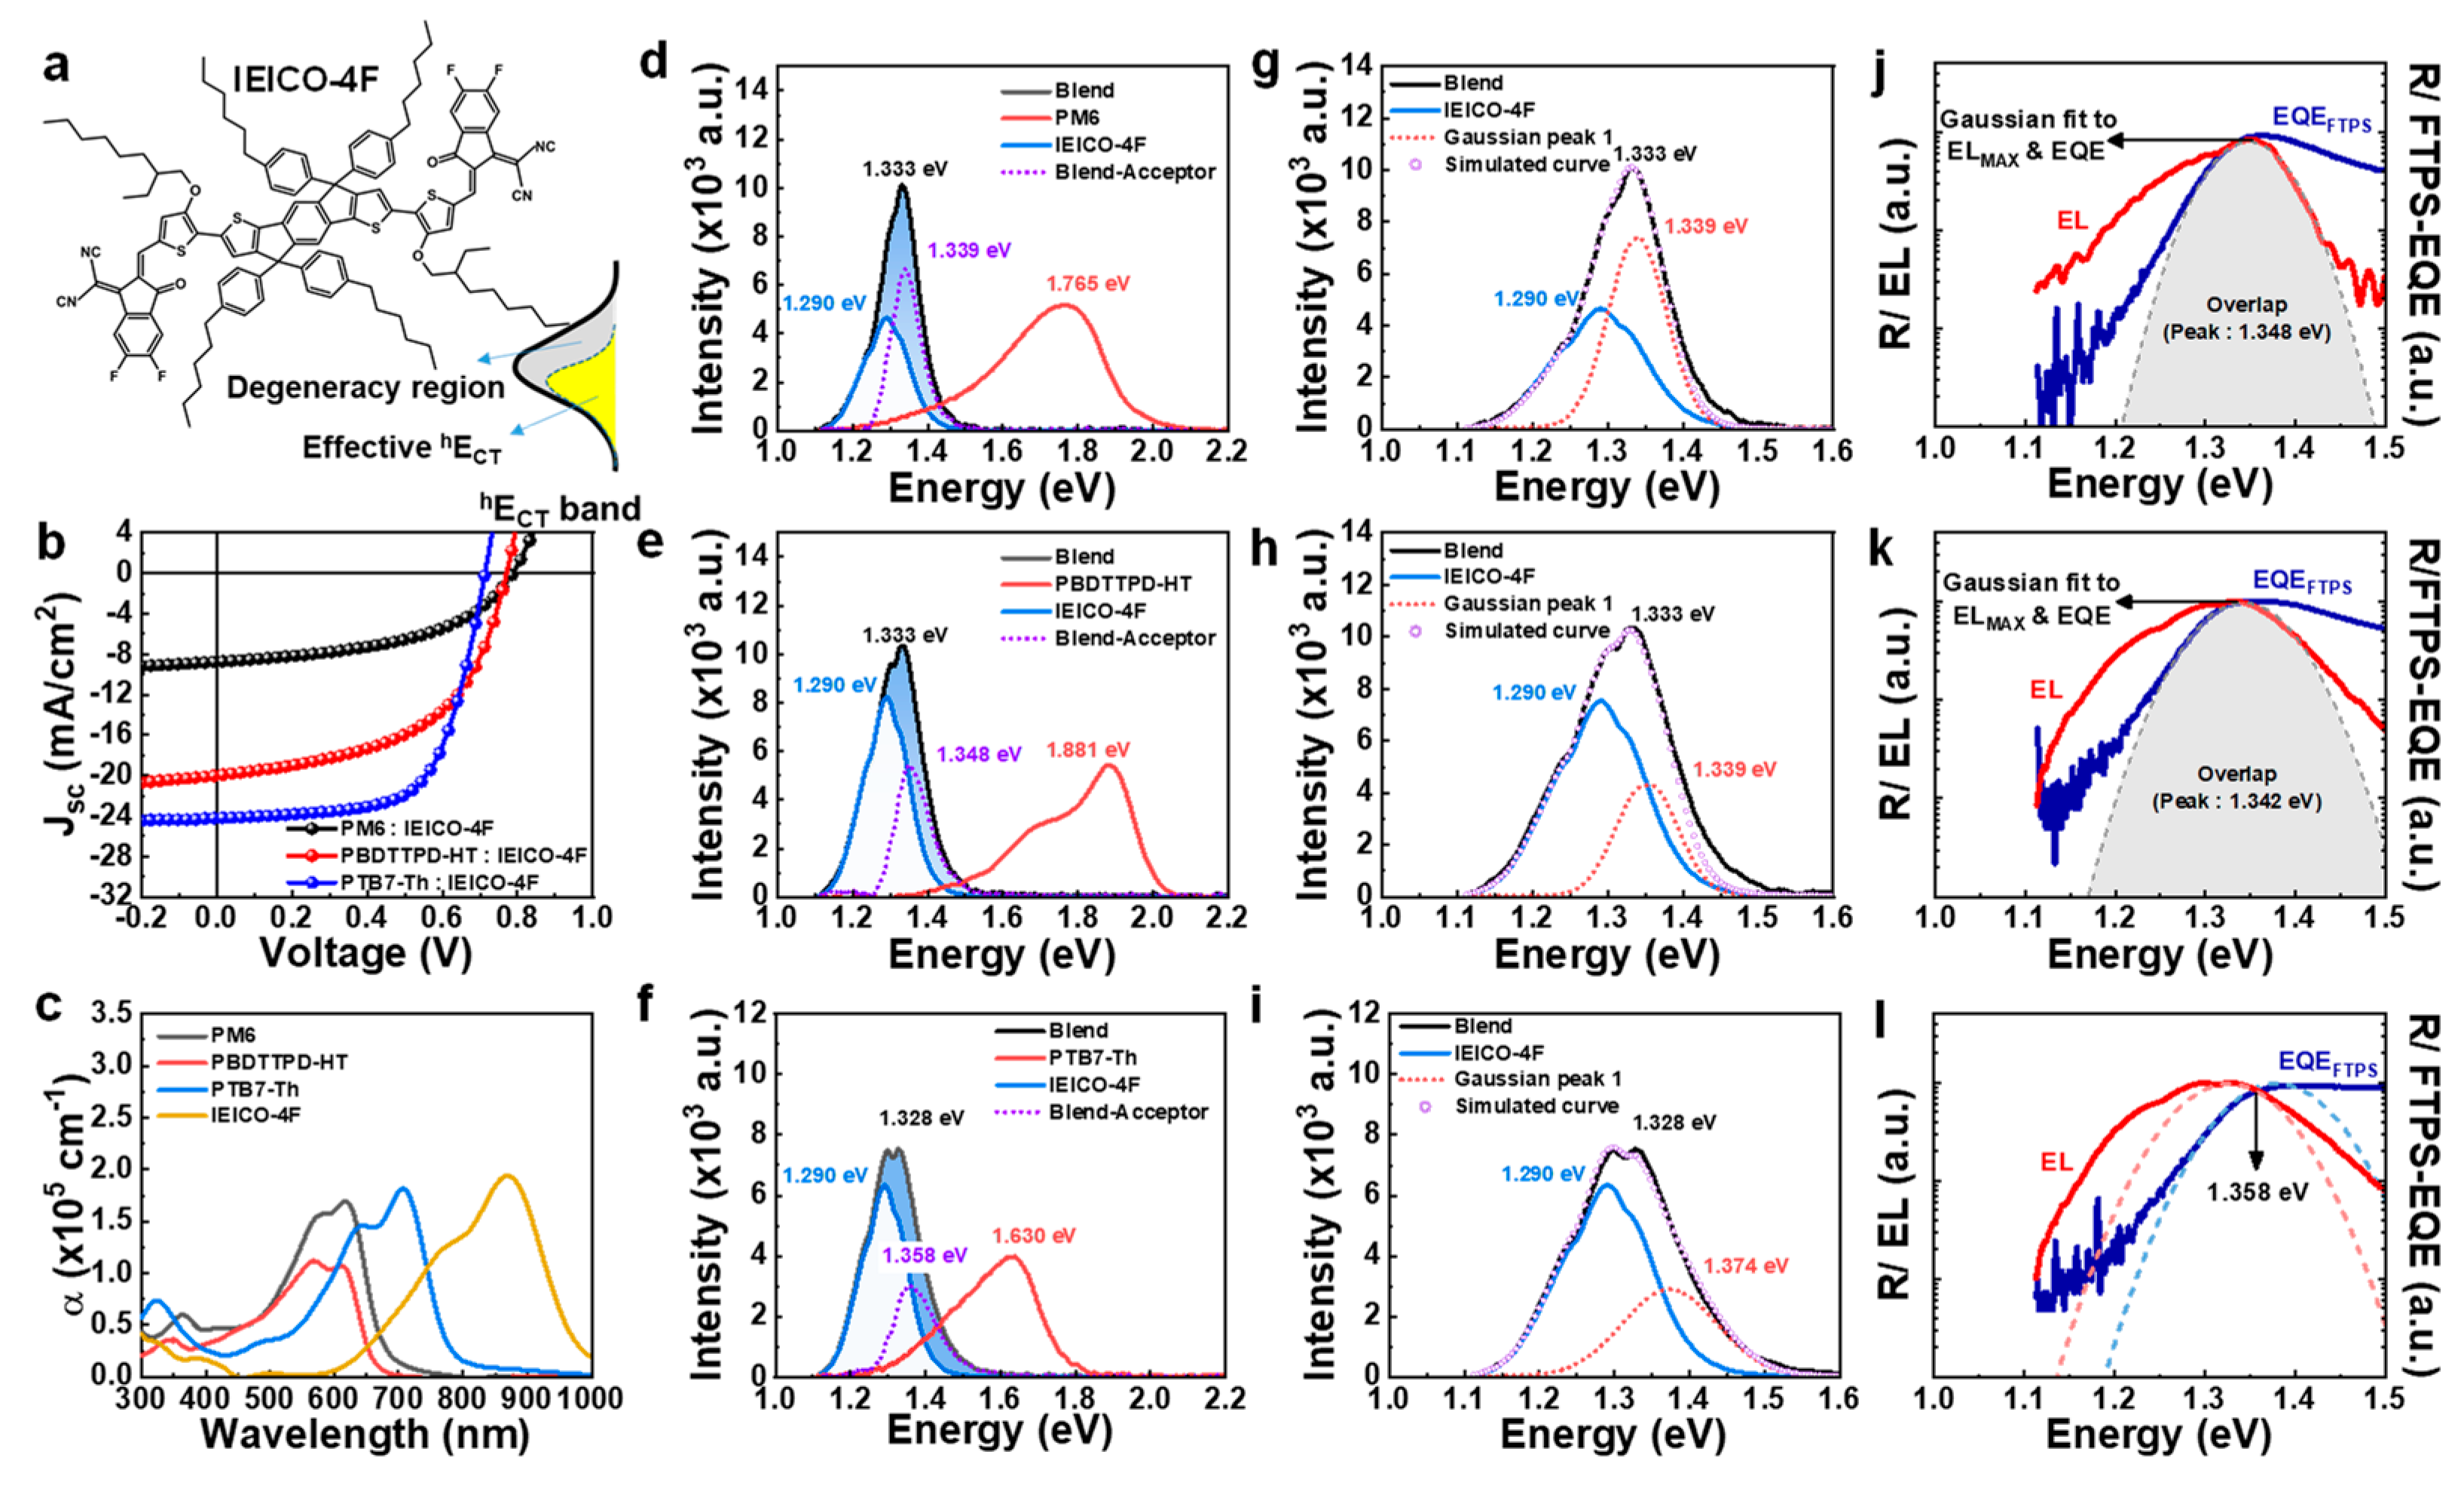
3.3. IEICO-4F-Acceptor-Based BHJ Systems (Smaller HOMO Offset)

What if the acceptor’s HOMO is lower than the donor’s HOMO while having a low bandgap? We selected IEICO-4F as a material that satisfies these conditions (Supplementary Figure S3). The chemical structures and J-V characteristics of the IEICO-4F system are shown in Figure 5a,b. Since IEICO-4F has a lower bandgap than Y6, there is no overlap with that of absorption of the donor like Y6 (Figure 5c), and the ELB and ELD are also separated. In the IEICO-4F system, the onset of EQE is formed by only the contribution from the acceptor. Figure 5d–f shows the difference between ELB and ELA. In the case of IEICO-4F, unlike IDIC, the difference between ELB and ELA does not appear at low energy but is formed in a higher-energy region (Figure 5d–f). The low-energy part of ELB exactly overlaps with the ELA. Thus, the effective hECT region is formed only on the lower side of the CT band. The ELB is perfectly simulated with the ELA spectrum and one additional Gaussian (Figure 5g–i). The absence of the low-energy CT-band leads to a complete overlap of EQE fitting and EL fitting in Marcus theory analysis for PM6:IEICO-4F and PBDTTPD-HT:IEICO-4F, as shown in Figure 5j,k. The lower effective hECT than the HOMO of the acceptor indicates an insufficient HOMO offset for charge separation. The low JSC in PM6:IEICO-4F and PBDTTPD-HT:IEICO-4F are attributed to this charge-separation problem. Only PTB7-Th:IEICO-4F has a proper condition for hECT formation. As a result, PTB7-Th:IEICO-4F shows the best photovoltaic performance. In fact, the values of JSC are quite predictable by simple comparison of the lower effective hECT size. For PM6:IEICO-4F, which has a relatively large size of lower effective hECT, the smallest JSC was shown, and in PTB7-Th:IEICO-4F, which has a relatively small size of lower effective hECT, the largest JSC was formed. Sufficient hole transfer seems to be made through the degeneracy region. It is possible that in nf-BHJ, a certain level of hole offset may not be a prerequisite. Lastly, the overall energy loss composition of PTB7-Th:IEICO-4F was similar to that of PM6:Y6. Nevertheless, the lower photovoltaic performance of PTB7-Th:IEICO-4F relative to that of PM6:Y6 is attributed to the fact that the absorption coefficient of IEICO-4F itself is lower than that of Y6.

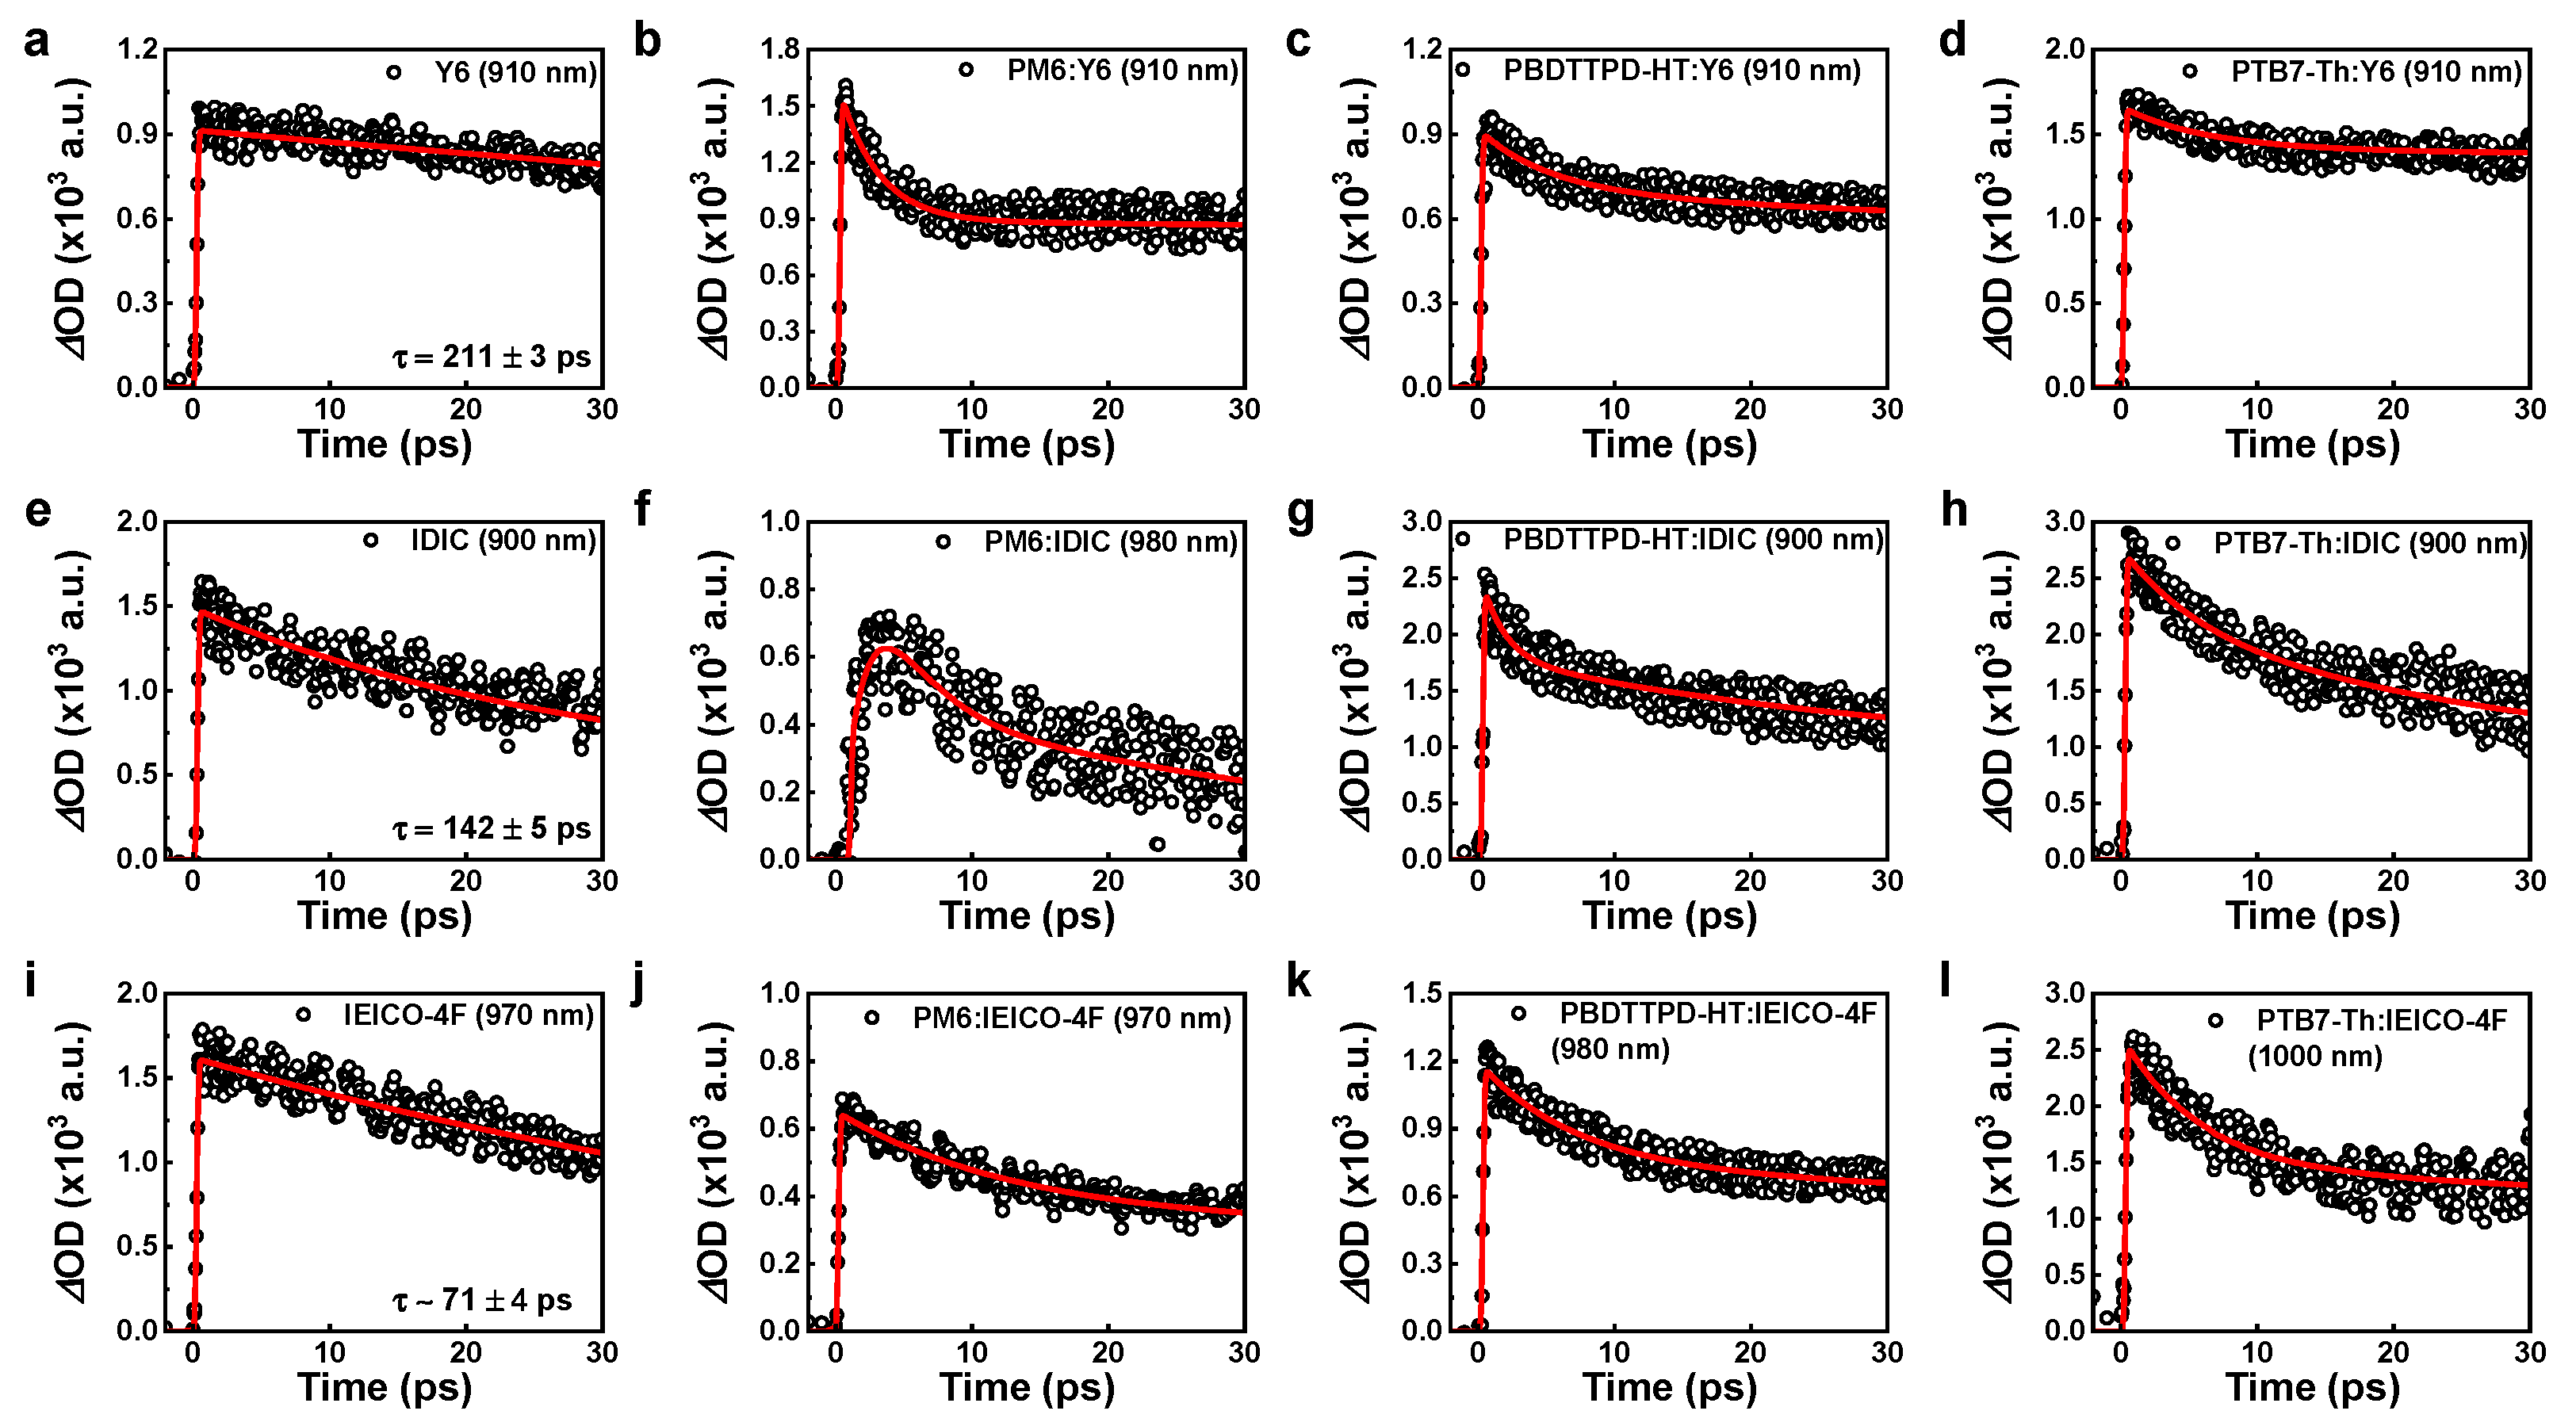
3.4. Hole Decay and Transfer Time at hECT

The effect of the configuration change of the hole-transfer state on the hole-transfer time was investigated through transient absorption (TA) measurement. Figure 6 shows the decay profiling of the hole-transfer time obtained from the TA measurements for acceptors and BHJ films used in this study. Detailed values of the hole-transfer time and PL-quenching efficiency are listed in Table 2. In the case of the BHJ system with a Y6 acceptor, the measured hole-transfer time was much faster than the TA decay time of the Y6 film (~211 ps). The hole-transfer time was the fastest in PM6:Y6 (~2.8 ps), became slower in PBDTTPD-HT:Y6 (~5.1 ps), and showed the lowest value in PTB7-Th:Y6 (~7.0 ps). This order of hole-transfer time is well correlated with the order of the hECT area size obtained in EL deconvolution (see Figure 2h–j). The fast hole-transfer property delivers a lower recombination rate. Thus, the PL-quenching efficiency was the highest in PM6:Y6 (93%), and it was the lowest in PTB7-Th:Y6 (78%), which has the slowest hole-transfer rate (Figure S18). In the BHJ system with the IDIC acceptor (Figure 6e–h), the PBDTTPD-HT:IDIC exhibited the fastest hole-transfer time of ~1.8 ps, even faster than PM6:Y6. This is probably because the upper hECT region acting as an obstruction region of hole transfer is smaller. However, the overall PCE was lower than that of Y6-based devices. This is because of the decreased JSC due to the large bandgap characteristics of IDIC. The longest hole-transfer time and the lowest PL-quenching efficiency were observed in PTB7-Th:IDIC, with the largest upper hECT region. For the BHJ systems with IEICO-4F, a prolonged hole-transfer time of ~13.0 ps was observed for PM6:IEICO-4F, and even the hole-transfer time of pristine IEICO-4F was remarkably faster (~71 ps) than other acceptors (Figure 6i). This is because of the relatively large upper hECT and the small degeneracy region, as predicted by the EL deconvolution result. Since most of the hole-transfer levels were created on the upper hECT region that causes hole-transfer retardation, the hole-transfer characteristics were significantly degraded compared to other acceptor systems. However, PTB7-Th: IEICO-4F, with a relatively small upper hECT region, showed a fast hole-transfer time and high hole-quenching efficiency. Thereby, PTB7-Th: IEICO-4F exhibited relatively higher performance within BHJ systems based on the IEICO-4F acceptor.

4. Conclusions

In summary, we have presented a more accurate analysis method that can obtain the exact value of ΔhECT in NFA-based OPV by extracting information on hECT through ELB deconvolution. We have applied our ELB deconvolution method on nine BHJ systems consisting of a combination of three donor polymers (PM6, PBDTTPD-HT, PTB7-Th) and three NFAs (Y6, IDIC, IEICO-4F). To extract the exact ΔhECT, the following conditions must be satisfied to apply our ELB deconvolution method. (i) Absorption of the donor and acceptor must be separated sufficiently. Accordingly, (ii) the composition of EQE should be clearly divided into donor and acceptor contribution parts. In particular, the initial EQEPV onset of an OPV with NFA should be formed only by the contribution of the acceptor. If these conditions are satisfied, through ELB deconvolution, it is possible to specify exactly which part of the broad ELB should be used to apply the Marcus theory, and based on the information on hECT, we were able to obtain a fairly accurate ΔhECT. Accurate determination of hECT is very important to understand the overall charge dynamics of NFAs-based OPVs. Since improved performance and stability are required for the commercialization of OPVs, it is expected that our method can be implemented for the development of better photoactive layer materials with improved performance in the future.

Supplementary Materials

The following supporting information can be downloaded at: https://www.mdpi.com/article/10.3390/polym15204042/s1, Figure S1: ECT determination of PM6:PC71BM based on the Marcus theory; Figure S2: Chemical structures of polymer donors used in this study; Figure S3: Energy-level diagram of polymer donors and non-fullerene acceptors; Figure S4: EQEPV spectra of donor, acceptor, and BHJs where the acceptor is Y6; Figure S5: Example of incorrect ECT determination using the maximum peak of ELB; Figure S6: Energy-loss analysis of BHJs with Y6 based on the detailed balance and reciprocity theorem; Figure S7: EQEPV spectra of donor, acceptor, and BHJs where the acceptor is IDIC; Figure S8: Energy-loss analysis of BHJs with IDIC based on the detailed balance and reciprocity theorem; Figure S9: Example of incorrect ECT determination using the maximum peak of ELB; Figure S10: EQEPV spectra of donor, acceptor, and BHJs where the acceptor is IEICO-4F; Figure S11: Energy-loss analysis of BHJs with IEICO-4F based on the detailed balance and reciprocity theorem; Figure S12: Absorption and PL spectra of polymer donors and non-fullerene acceptors; Figure S13: Absorption coefficient spectra of BHJ systems; Figure S14: Bandgap distribution of BHJs obtained from the derivatives of EQEPV; Figure S15: Transient absorption spectra of Y6 and Y6-based BHJ films; Figure S16: Transient absorption spectra of IDIC and IDIC-based BHJ films; Figure S17: Transient absorption spectra of IEICO-4F and IEICO-4F-based BHJ films; Figure S18: PL spectra of acceptor and BHJ films used in this study; Table S1: ECT values of PM6:PC71BM where the Marcus theory is applied to CT feature at the onset of FTPS-EQE (A) or maximum peak of FTPS-EQE (B) in Figure S1; Table S2: Photovoltaic performance of BHJs used in this study; Table S3: Example of incorrection ΔECT determination of BHJs with Y6; Table S4: Energy-loss results of BHJs with Y6; Table S5: Energy-loss results of BHJs with IDIC; Table S6: Example of incorrect energy-loss results of BHJs with IDIC; Table S7: Energy-loss results of BHJs with IEICO-4F.

Author Contributions

S.C. and S.-Y.J. designed and supervised the project. The experiments were performed by D.L. and D.H.K.; under the guidance of S.C. and S.P.; contributed to the performance analysis of the solar cells based on the fullerene acceptor. PM6, Y6, IDIC, and PBDTTPD-HT were synthesized by N.V.K. and F.T.A.W.; under the guidance of S.-Y.J., C.-M.O. and I.-W.H.; contributed to TA measurement. The manuscript was written by D.L., D.H.K. and S.C., with comments from S.-Y.J. All authors have read and agreed to the published version of the manuscript.

Funding

This work was supported by the National Research Foundation of Korea (2020R1A2C1003929, 2019R1A6A1A11053838, 2020M1A2A2080746, 2021R1A6A3A01088822).

Institutional Review Board Statement

Not applicable.

Data Availability Statement

The data presented in this study are available on request from the corresponding author.

Conflicts of Interest

The authors declare no conflict of interest.

Appendix A

Marcus Theory

According to the Frank–Condon principle, the absorption and emission have to be exactly symmetric for the lowest vibronic state (cross point) because the electronic transitions are swift compared with nuclear motions. Similarly, this can be determined by the Marcus theory, which explains the rates of electron transfer reactions, and the spectral regions of CT absorption and emission are expressed as follows [32]:
EQE ( E ) · E = α absorption 4 π λ k B T exp E CT + λ E 2 4 λ k B T
I f E = α emission 4 π λ k B T exp E CT λ E 2 4 λ k B T
where α is the coupling constant, λ is the reorganization energy, k B is Boltzmann’s constant, T is temperature, If is the emission rate, and E is the corresponding energy to the absorption/emission spectrum.

Appendix B

Appendix B.1. Energy Loss Model

The energy loss based on the detailed balance and reciprocity can be expressed as the sum of three components, as follows [31]:
E loss = Δ E 1 + Δ E 2 + Δ E 3 = E g q V OC SQ + qV OC SQ qV OC rad + ( qV OC rad qV OC )
where qV OC rad is radiative limited qV OC in consideration of EQE, and V OC is open-circuit voltage measured from the current density–voltage (J-V) curve. Δ E 1 is voltage loss due to mismatches in the angle between incident sunlight and emission and carrier concentration between generation and the radiation from the cell. Δ E 2 is the radiative voltage loss due to the imperfection of EQE since q V OC SQ considers the assumption of 100% of EQE, and Δ E 3 is non-radiative voltage loss due to the non-radiative recombination.

Radiative Limit Open-Circuit Voltage

Referring to the reciprocity theorem [33], qV OC rad states the radiative limit including the EQE of solar cells:
qV OC rad = k B T q l n J sc J 0 , rad + 1 = k B T q l n q 0 Ω PV E ϕ sun E d E q 0 Ω PV E ϕ BB E d E + 1 .
where
ϕ BB E = 2 π E 2 h 3 c 2 exp E k B T
is the blackbody radiation from the semiconductor and Ω PV E is the EQE of the solar cell. Herein, V oc rad must be the VOC of the solar cell in the situation that radiative recombination in the only process in the total recombination. Thus, the non-radiative energy loss is defined as the difference between V oc rad and real VOC, as described in Equation (A3). By the definition of total energy loss, Δ E 3 is the residual value of voltage losses above, i.e.,
Δ E 3 = E loss ( Δ E 1 + Δ E 2 ) = qV OC rad qV OC
Meanwhile, EQEEL is defined as the radiative recombination current divided by the injected current for EL emission:
EQE EL = J emitted   ( V ) J injected   ( V ) = J rad   ( V ) J rad V + J non rad   ( V )
Because EQEEL refers how the radiative recombination possesses in total recombination, Δ E 3 is proportional to -ln(EQEEL) [33]:
Δ E 3 = q V OC rad qV OC k B T q l n EQE EL

References

  1. Brabec, C.J.; Gowrisanker, S.; Halls, J.J.M.; Laird, D.; Jia, S.; Williams, S.P. Polymer–Fullerene Bulk-Heterojunction Solar Cells. Adv. Mater. 2010, 22, 3839–3856. [Google Scholar] [CrossRef]
  2. Park, S.H.; Roy, A.; Beaupré, S.; Cho, S.; Coates, N.; Moon, J.S.; Moses, D.; Leclerc, M.; Lee, K.; Heeger, A.J. Bulk heterojunction solar cells with internal quantum efficiency approaching 100%. Nat. Photonics 2009, 3, 297–302. [Google Scholar] [CrossRef]
  3. Lu, L.; Zheng, T.; Wu, Q.; Schneider, A.M.; Zhao, D.; Yu, L. Recent Advances in Bulk Heterojunction Polymer Solar Cells. Chem. Rev. 2015, 115, 12666–12731. [Google Scholar] [CrossRef]
  4. Kaltenbrunner, M.; White, M.S.; Głowacki, E.D.; Sekitani, T.; Someya, T.; Sariciftci, N.S.; Bauer, S. Ultrathin and lightweight organic solar cells with high flexibility. Nat. Commun. 2012, 3, 770. [Google Scholar] [CrossRef] [PubMed]
  5. Sun, C.; Pan, F.; Bin, H.; Zhang, J.; Xue, L.; Qiu, B.; Wei, Z.; Zhang, Z.-G.; Li, Y. A low cost and high performance polymer donor material for polymer solar cells. Nat. Commun. 2018, 9, 743. [Google Scholar] [CrossRef] [PubMed]
  6. Yuan, J.; Zhang, Y.; Zhou, L.; Zhang, G.; Yip, H.-L.; Lau, T.-K.; Lu, X.; Zhu, C.; Peng, H.; Johnson, P.A.; et al. Single-Junction Organic Solar Cell with over 15% Efficiency Using Fused-Ring Acceptor with Electron-Deficient Core. Joule 2019, 3, 1140–1151. [Google Scholar] [CrossRef]
  7. Liu, Q.; Jiang, Y.; Jin, K.; Qin, J.; Xu, J.; Li, W.; Xiong, J.; Liu, J.; Xiao, Z.; Sun, K.; et al. 18% Efficiency organic solar cells. Sci. Bull. 2020, 65, 272–275. [Google Scholar] [CrossRef]
  8. Ma, R.; Jiang, X.; Fu, J.; Zhu, T.; Yan, C.; Wu, K.; Müller-Buschbaum, P.; Li, G. Revealing the underlying solvent effect on film morphology in high-efficiency organic solar cells through combined ex situ and in situ observations. Energy Environ. Sci. 2023, 16, 2316–2326. [Google Scholar] [CrossRef]
  9. Zhu, L.; Zhang, M.; Zhou, G.; Hao, T.; Xu, J.; Wang, J.; Qiu, C.; Prine, N.; Ali, J.; Feng, W.; et al. Efficient Organic Solar Cell with 16.88% Efficiency Enabled by Refined Acceptor Crystallization and Morphology with Improved Charge Transfer and Transport Properties. Adv. Energy Mater. 2020, 10, 1904234. [Google Scholar] [CrossRef]
  10. Yuan, J.; Huang, T.; Cheng, P.; Zou, Y.; Zhang, H.; Yang, J.L.; Chang, S.-Y.; Zhang, Z.; Huang, W.; Wang, R.; et al. Enabling low voltage losses and high photocurrent in fullerene-free organic photovoltaics. Nat. Commun. 2019, 10, 570. [Google Scholar] [CrossRef]
  11. Vandewal, K.; Tvingstedt, K.; Gadisa, A.; Inganäs, O.; Manca, J.V. Relating the open-circuit voltage to interface molecular properties of donor:acceptor bulk heterojunction solar cells. Phys. Rev. B 2010, 81, 125204. [Google Scholar] [CrossRef]
  12. Marcus, R.A. Electron transfer reactions in chemistry theory and experiment. J. Electroanal. Chem. 1997, 438, 251–259. [Google Scholar] [CrossRef]
  13. Liu, S.; Yuan, J.; Deng, W.; Luo, M.; Xie, Y.; Liang, Q.; Zou, Y.; He, Z.; Wu, H.; Cao, Y. High-efficiency organic solar cells with low non-radiative recombination loss and low energetic disorder. Nat. Photonics 2020, 14, 300–305. [Google Scholar] [CrossRef]
  14. Zhou, Z.; Xu, S.; Song, J.; Jin, Y.; Yue, Q.; Qian, Y.; Liu, F.; Zhang, F.; Zhu, X. High-efficiency small-molecule ternary solar cells with a hierarchical morphology enabled by synergizing fullerene and non-fullerene acceptors. Nat. Energy 2018, 3, 952–959. [Google Scholar] [CrossRef]
  15. Perdigón-Toro, L.; Zhang, H.; Markina, A.; Yuan, J.; Hosseini, S.M.; Wolff, C.M.; Zuo, G.; Stolterfoht, M.; Zou, Y.; Gao, F.; et al. Barrierless Free Charge Generation in the High-Performance PM6:Y6 Bulk Heterojunction Non-Fullerene Solar Cell. Adv. Mater. 2020, 32, 1906763. [Google Scholar] [CrossRef] [PubMed]
  16. Karuthedath, S.; Gorenflot, J.; Firdaus, Y.; Chaturvedi, N.; Castro, C.S.P.D.; Harrison, G.T.; Khan, J.I.; Markina, A.; Balawi, A.H.; Peña, T.A.D.; et al. Intrinsic efficiency limits in low-bandgap non-fullerene acceptor oragnic solar cells. Nat. Mater. 2021, 20, 378–384. [Google Scholar] [CrossRef]
  17. Chen, Z.; Chen, X.; Jia, Z.; Zhou, G.; Xu, J.; Wu, Y.; Xia, X.; Li, X.; Zhang, X.; Deng, C.; et al. Triplet exciton formation for non-radiative voltage in high-efficiency nonfullerene oragnic solar cells. Joule 2021, 5, 1832–1844. [Google Scholar] [CrossRef]
  18. Liu, Y.; Zuo, L.; Shi, X.; Jen, A.K.-Y.; Ginger, D.S. Unexpectedly Slow Yet Efficient Picosecond to Nanosecond Photoinduced Hole-Transfer Occurs in a Polymer/Nonfullerene Acceptor Organic Photovoltaic Blend. ACS Energy Lett. 2018, 3, 2396–2403. [Google Scholar] [CrossRef]
  19. Jasiūnas, R.; Zhang, H.; Devižis, A.; Franckevičius, M.; Gao, F.; Gulbinas, V. Thermally Activated Reverse Electron Transfer Limits Carrier Generation Efficiency in PM6:Y6 Non-Fullerene Organic Solar Cells. Sol. RRL 2022, 6, 2100963. [Google Scholar] [CrossRef]
  20. Zhang, J.; Liu, W.; Zhou, G.; Yi, Y.; Xu, S.; Liu, F.; Zhu, H.; Zhu, X. Accurate Determination of the Minimum HOMO Offset for Efficient Charge Generation using Organic Semiconducting Alloys. Adv. Energy Mater. 2020, 10, 1903298. [Google Scholar] [CrossRef]
  21. Xie, Y.; Wang, W.; Huang, W.; Lin, F.; Li, T.; Liu, S.; Zhan, X.; Liang, Y.; Gao, C.; Wu, H.; et al. Assessing the energy offset at the electron donor/ acceptor interface in organic solar cells through radiative efficiency measurements. Energy Environ. Sci. 2019, 12, 3556–3566. [Google Scholar] [CrossRef]
  22. Wu, J.; Lee, J.; Chin, Y.-C.; Yao, H.; Cha, H.; Luke, J.; Hou, J.; Kim, J.-S.; Durrant, J.R. Exceptionally low charge trapping enables highly efficient organic bulk heterojunction solar cells. Energy Environ. Sci. 2020, 13, 2422–2430. [Google Scholar] [CrossRef]
  23. Hadmojo, W.T.; Wibowo, F.T.A.; Ryu, D.Y.; Jung, I.W.; Jang, S.-Y. Fullerene-Free Organic Solar Cells with an Efficiency of 10.2% and an Energy Loss of 0.59 eV Based on a Thieno[3,4-c]Pyrrole-4,6-dione-Containing Wide Band Gap Polymer Donor. ACS Appl. Mater. Interfaces 2017, 9, 32939–32945. [Google Scholar] [CrossRef] [PubMed]
  24. Park, S.J.; Wibowo, F.T.A.; Krishna, N.V.; Ryu, J.; Lee, H.; Lee, J.H.; Yoon, Y.J.; Kim, J.Y.; Seo, J.H.; Oh, S.-H.; et al. Importance of interface engineering between the hole transport layer and the indium-tin-oxide electrode for highly efficient polymer solar cells. J. Mater. Chem. A 2021, 9, 15394–15403. [Google Scholar] [CrossRef]
  25. Rau, U.; Blank, B.; Müller, T.C.M.; Kirchartz, T. Efficiency Potential of Photovoltaic Materials and Devices Unveiled by Detailed-Balance Analysis. Phys. Rev. Appl. 2017, 7, 044016. [Google Scholar] [CrossRef]
  26. Fu, H.; Wang, Y.; Meng, D.; Ma, Z.; Li, Y.; Gao, F.; Wang, Z.; Sun, Y. Suppression of Recombination Energy Losses by Decreasing the Energetic Offsets in Perylene Diimide-Based Nonfullerene Organic Solar Cells. ACS Energy Lett. 2018, 3, 2729–2735. [Google Scholar] [CrossRef]
  27. Hofinger, J.; Putz, C.; Mayr, F.; Gugujonovic, K.; Wielend, D.; Scharber, M.C. Understanding the low voltage losses in high-performace non-fullerene acceptor-based organic solar cells. Mater. Adv. 2021, 2, 4291. [Google Scholar] [CrossRef]
  28. Liu, Y.; Li, M.; Yang, J.; Xue, W.; Feng, S.; Song, J.; Tang, Z.; Ma, W.; Bo, Z. High-Efficiency As-Cast Organic Solar Cells Based on Acceptors with Steric Hindrance Induced Planar Terminal Group. Adv. Energy Mater. 2019, 9, 1901280. [Google Scholar] [CrossRef]
  29. Shockley, W.; Queisser, H.J. Detailed Balance Limit of Efficiency of p-n Junction Solar Cells. J. Appl. Phys. 1961, 32, 510. [Google Scholar] [CrossRef]
  30. Kirchartz, T.; Rau, U. Electroluminescence analysis of high efficiency Cu(In,Ga)Se2 solar cells. J. Appl. Phys. 2007, 102, 104510. [Google Scholar] [CrossRef]
  31. Menke, S.M.; Ran, N.A.; Bazan, G.C.; Friend, R.H. Organic Solar Cells: Toward a New Efficiency Regime. Joule 2018, 2, 25–35. [Google Scholar] [CrossRef]
  32. Marcus, R.A. Relation between Charge Transfer Absorption and Fluorescence Spectra and the Inverted Region. J. Phys. Chem. 1989, 93, 3078–3086. [Google Scholar] [CrossRef]
  33. Kirchartz, T.; Rau, U. Detailed balance and reciprocity in solar cells. Phys. Stat. Sol. (A) 2008, 205, 2737–2751. [Google Scholar] [CrossRef]
Figure 1. Difference between fullerene-based OSCs and non-fullerene-based OSCs near EQE onset (flat-band VOC condition). (a) Electrons are initially excited at donor polymer and then transferred to acceptor in f-BHJ OSCs. ECT level is visible in sensitive FTPS-EQE measurement. (b) Electrons are initially excited at acceptor near EQE onset. Holes are transferred to donor in nf-BHJ OSCs. ECT level is invisible even in sensitive FTPS-EQE measurement.
Polymers 15 04042 g001
Figure 2. EL deconvolution analysis of the BHJ systems based on the Y6 acceptor. (a) Chemical structure of Y6 acceptor. (b) J-V characteristics of BHJ OPVs fabricated using Y6 acceptor. (c) Absorption coefficient spectra of polymer donors and Y6. (d) The schematic diagram of hole transfer in PV mode and charge recombination in EL mode. In EL mode, radiative recombination can occur in three ways: (i) recombination with acceptor singlet (mono-molecular recombination), (ii) recombination with holes at upper effective hECT, or (iii) recombination with holes at lower effective hECT. (eg) EL spectra of BHJ blend, donor only, and acceptor only; shaded blue area (ELB-ELA) represents the EL contribution by hECT. (hj) Simulation of EL spectrum using Gaussian function and ELA.
Polymers 15 04042 g002
Figure 3. ΔhECT was determined based on the Marcus theory for (a) PM6:Y6, (b) PBDTTPD-HT:Y6, and (c) PTB7-Th:Y6 BHJs. The position of hECT emission was obtained from ELB deconvolution and then fit to FTPS-EQE onset part. The CT absorption (blue dotted line) and CT emission (red dotted line) were fitted using Gaussian function.
Polymers 15 04042 g003
Figure 4. EL deconvolution analysis of the BHJ systems based on the IDIC acceptor. (a) Chemical structure of IDIC acceptor. (b) J-V characteristics of OPVs fabricated using IDIC acceptor. (c) Absorption coefficient spectra of PM6, PBDTTPD-HT, PTB7-Th, and IDIC. (df) EL spectrum of blend, donor, and acceptor; the difference in EL spectrum (shaded blue area) represents the EL contribution by hECT. (gi) Simulation of EL spectrum using Gaussian function and ELA. (jl) ΔhECT determination based on the Marcus theory. The CT absorption (blue dotted line) and CT emission (red dotted line) were fitted using Gaussian function.
Polymers 15 04042 g004
Figure 5. EL deconvolution analysis of the BHJ systems based on the IEICO-4F acceptor. (a) Chemical structure of IEICO-4F acceptor. (b) J-V characteristics of BHJ OPVs fabricated with IEICO-4F acceptor. (c) Absorption coefficient spectra of PM6, PBDTTPD-HT, PTB7-Th, and IEICO-4F. (df) EL spectrum of blend, donor, acceptor, and the difference in EL spectrum. (gi) Simulation of EL spectrum using Gaussian function and ELA. One Gaussian fitting was obtained from ELB-ELA. (jl) ΔhECT determination based on the Marcus theory. The CT absorption (blue dotted line) and CT emission (red dotted line) were fitted using Gaussian function, but indistinguishable from singlet band.
Polymers 15 04042 g005
Figure 6. The decay profiling of hole-transfer time obtained from the TA measurements. (a) Pristine Y6, (b) PM6:Y6, (c) PBDTTPD-HT:Y6, (d) PTB7-Th:Y6, (e) pristine IDIC, (f) PM6: IDIC, (g) PBDTTPD-HT: IDIC, (h) PTB7-Th: IDIC, (i) pristine IEICO-4F, (j) PM6: IEICO-4F, (k) PBDTTPD-HT: IEICO-4F, (l) PTB7-Th: IEICO-4F.
Polymers 15 04042 g006
Table 1. Extracted hECT values of each BHJ system obtained using ELB deconvolution method.
BHJEghECTΔhECT
PM6: Y61.4181.3880.030
PBDTTPD-HT: Y61.4311.3730.058
PTB7-Th: Y61.4011.3570.044
PM6: IDIC1.6011.5700.031
PBDTTPD-HT: IDIC1.5731.5270.046
PTB7-Th: IDIC1.6111.5660.045
PM6: IEICO-4F1.323n/an/a
PBDTTPD-HT: IEICO-4F1.333n/an/a
PTB7-Th: IEICO-4F1.3301.358n/a (−0.028)
Unit: eV.
Table 2. Hole-transfer time and PL-quenching efficiency of BHJ used in this study.
BlendHole-Transfer Time
(ps)
η PL * (%)
PM6:Y62.8 ± 0.393
PBDTTPD-HT:Y65.1 ± 0.581
PTB7-Th:Y67.0 ± 0.478
PM6:IDIC2.4 ± 0.775
PBDTTPD-HT:IDIC1.8 ± 0.481
PTB7-Th:IDIC6.0 ± 0.454
PM6:IEICO-4F13.0 ± 1.772
PBDTTPD-HT:IEICO-4F7.8 ± 0.783
PTB7-Th:IEICO-4F5.2 ± 0.896
* η PL : PL-quenching efficiency.
Disclaimer/Publisher’s Note: The statements, opinions and data contained in all publications are solely those of the individual author(s) and contributor(s) and not of MDPI and/or the editor(s). MDPI and/or the editor(s) disclaim responsibility for any injury to people or property resulting from any ideas, methods, instructions or products referred to in the content.

