
Nanocomposites Based on Polyethylene and Nickel Ferrite: Preparation, Characterization, and Properties

 ,
,  , , ,
, , ,  ,
,
Abstract
:1. Introduction
2. Materials and Methods
2.1. Materials
2.2. Preparation of Precursor and Composites
2.3. Equipment and Measurement
3. Results and Discussion
4. Conclusions
Author Contributions
Funding
Institutional Review Board Statement
Informed Consent Statement
Data Availability Statement
Conflicts of Interest
References
- Demirors, M. The History of Polyethylene. In 100+ Years of Plastics. Leo Baekeland and Beyond; ACS Symposium Series; American Chemical Society: Washington, DC, USA, 2011; Volume 1080, pp. 115–145. ISBN 978-0-8412-2677-7. [Google Scholar]
- Paxton, N.C.; Allenby, M.C.; Lewis, P.M.; Woodruff, M.A. Biomedical Applications of Polyethylene. Eur. Polym. J. 2019, 118, 412–428. [Google Scholar] [CrossRef]
- Janczak, K.; Kosmalska, D.; Kaczor, D.; Raszkowska-Kaczor, A.; Wedderburn, L.; Malinowski, R. Bactericidal and Fungistatic Properties of LDPE Modified with a Biocide Containing Metal Nanoparticles. Materials 2021, 14, 4228. [Google Scholar] [CrossRef] [PubMed]
- da Costa, B.S.; Bresolin, J.D.; Sivieri, K.; Ferreira, M.D. Low-Density Polyethylene Films Incorporated with Silver Nanoparticles to Promote Antimicrobial Efficiency in Food Packaging. Food Sci. Technol. Int. 2020, 26, 353–366. [Google Scholar] [CrossRef]
- Haghniaz, R.; Rabbani, A.; Vajhadin, F.; Khan, T.; Kousar, R.; Khan, A.R.; Montazerian, H.; Iqbal, J.; Libanori, A.; Kim, H.-J.; et al. Anti-bacterial and Wound Healing-promoting Effects of Zinc Ferrite Nanoparticles. J. Nanobiotechnol. 2021, 19, 38. [Google Scholar] [CrossRef] [PubMed]
- Srinivasan, S.Y.; Paknikar, K.M.; Bodas, D.; Gajbhiye, V. Applications of Cobalt Ferrite Nanoparticles in Biomedical Nanotechnology. Nanomedicine 2018, 13, 1221–1238. [Google Scholar] [CrossRef] [PubMed]
- Arumugham, N.; Mariappan, A.; Eswaran, J.; Daniel, S.; Kanthapazham, R.; Kathirvel, P. Nickel Ferrite-Based Composites and Its Photocatalytic Application—A Review. J. Hazard. Mater. Adv. 2022, 8, 100156. [Google Scholar] [CrossRef]
- Janudin, N.; Kasim, N.A.M.; Feizal Knight, V.; Norrrahim, M.N.F.; Razak, M.A.I.A.; Abdul Halim, N.; Mohd Noor, S.A.; Ong, K.K.; Yaacob, M.H.; Ahmad, M.Z.; et al. Fabrication of a Nickel Ferrite/Nanocellulose-Based Nanocomposite as an Active Sensing Material for the Detection of Chlorine Gas. Polymers 2022, 14, 1906. [Google Scholar] [CrossRef] [PubMed]
- Manohar, A.; Vijayakanth, V.; Vattikuti, S.V.P.; Kim, K.H. A Mini-Review on AFe2O4 (A = Zn, Mg, Mn, Co, Cu, and Ni) Nanoparticles: Photocatalytic, Magnetic Hyperthermia and Cytotoxicity Study. Mater. Chem. Phys. 2022, 286, 126117. [Google Scholar] [CrossRef]
- Kefeni, K.K.; Msagati, T.A.M.; Mamba, B.B. Ferrite Nanoparticles: Synthesis, Characterisation and Applications in Electronic Device. Mater. Sci.Eng. B 2017, 215, 37–55. [Google Scholar] [CrossRef]
- Romero-Fierro, D.; Bustamante-Torres, M.; Bravo-Plascencia, F.; Magaña, H.; Bucio, E. Polymer-Magnetic Semiconductor Nanocomposites for Industrial Electronic Applications. Polymers 2022, 14, 2467. [Google Scholar] [CrossRef]
- Bustamante-Torres, M.; Romero-Fierro, D.; Estrella-Nuñez, J.; Arcentales-Vera, B.; Chichande-Proaño, E.; Bucio, E. Polymeric Composite of Magnetite Iron Oxide Nanoparticles and Their Application in Biomedicine: A Review. Polymers 2022, 14, 752. [Google Scholar] [CrossRef] [PubMed]
- Amiri, M.; Eskandari, K.; Salavati-Niasari, M. Magnetically Retrievable Ferrite Nanoparticles in the Catalysis Application. Adv. Colloid Interface Sci. 2019, 271, 101982. [Google Scholar] [CrossRef] [PubMed]
- Amiri, M.; Salavati-Niasari, M.; Akbari, A. Magnetic Nanocarriers: Evolution of Spinel Ferrites for Medical Applications. Adv. Colloid Interface Sci. 2019, 265, 29–44. [Google Scholar] [CrossRef] [PubMed]
- Suresh, R.; Rajendran, S.; Kumar, P.S.; Vo, D.-V.N.; Cornejo-Ponce, L. Recent Advancements of Spinel Ferrite Based Binary Nanocomposite Photocatalysts in Wastewater Treatment. Chemosphere 2021, 274, 129734. [Google Scholar] [CrossRef] [PubMed]
- Vu, D.L.; Ahn, K.K. Triboelectric Enhancement of Polyvinylidene Fluoride Membrane Using Magnetic Nanoparticle for Water-Based Energy Harvesting. Polymers 2022, 14, 1547. [Google Scholar] [CrossRef] [PubMed]
- Gupta, N.; Jain, P.; Rana, R.; Shrivastava, S. Current Development in Synthesis and Characterization of Nickel Ferrite Nanoparticle. Mater. Today Proc. 2017, 4, 342–349. [Google Scholar] [CrossRef]
- Prokopenko, S.L.; Mazurenko, R.V.; Gunja, G.M.; Abramov, N.V.; Makhno, S.M.; Gorbyk, P.P. Electrophysical Properties of Polymeric Nanocomposites Based on Cobalt and Nickel Ferrites Modified with Copper Iodide. J. Magn. Magn. Mater. 2020, 494, 165824. [Google Scholar] [CrossRef]
- Gubin, S.P.; Koksharov, Y.A.; Khomutov, G.B.; Yurkov, G.Y. Magnetic Nanoparticles: Preparation, Structure and Properties. Russ. Chem. Rev. 2005, 74, 489. [Google Scholar] [CrossRef]
- Pettigrew, K.A.; Long, J.W.; Carpenter, E.E.; Baker, C.C.; Lytle, J.C.; Chervin, C.N.; Logan, M.S.; Stroud, R.M.; Rolison, D.R. Nickel Ferrite Aerogels with Monodisperse Nanoscale Building Blocks—The Importance of Processing Temperature and Atmosphere. ACS Nano 2008, 2, 784–790. [Google Scholar] [CrossRef]
- Karpova, T.S.; Vasiliev, V.G.; Vladimirova, E.V.; Nosov, A.P. Synthesis of NiFe2O4 Ferroshpinel by Thermohydrolysis and Its Magnetic Properties. Perspect. Mater. 2011, 4, 18–24. [Google Scholar]
- Rana, G.; Dhiman, P.; Kumar, A.; Vo, D.-V.N.; Sharma, G.; Sharma, S.; Naushad, M. Recent Advances on Nickel Nano-Ferrite: A Review on Processing Techniques, Properties and Diverse Applications. Chem. Eng. Res. Des. 2021, 175, 182–208. [Google Scholar] [CrossRef]
- Kefeni, K.K.; Mamba, B.B. Photocatalytic Application of Spinel Ferrite Nanoparticles and Nanocomposites in Wastewater Treatment: Review. Sustain. Mater. Technol. 2020, 23, e00140. [Google Scholar] [CrossRef]
- Dippong, T.; Levei, E.A.; Cadar, O. Recent Advances in Synthesis and Applications of MFe2O4 (M = Co, Cu, Mn, Ni, Zn) Nanoparticles. Nanomaterials 2021, 11, 1560. [Google Scholar] [CrossRef] [PubMed]
- Liandi, A.R.; Cahyana, A.H.; Kusumah, A.J.F.; Lupitasari, A.; Alfariza, D.N.; Nuraini, R.; Sari, R.W.; Kusumasari, F.C. Recent Trends of Spinel Ferrites (MFe2O4: Mn, Co, Ni, Cu, Zn) Applications as an Environmentally Friendly Catalyst in Multicomponent Reactions: A Review. Case Stud. Chem. Environ. Eng. 2023, 7, 100303. [Google Scholar] [CrossRef]
- Njoroge, M.A.; Kirimi, N.M.; Kuria, K.P. Spinel Ferrites Gas Sensors: A Review of Sensing Parameters, Mechanism and the Effects of Ion Substitution. Crit. Rev. Solid State Mater. Sci. 2022, 47, 807–836. [Google Scholar] [CrossRef]
- Khoso, W.A.; Haleem, N.; Baig, M.A.; Jamal, Y. Synthesis, Characterization and Heavy Metal Removal Efficiency of Nickel Ferrite Nanoparticles (NFN’s). Sci. Rep. 2021, 11, 3790. [Google Scholar] [CrossRef] [PubMed]
- Boon, M.S.; Serena Saw, W.P.; Mariatti, M. Magnetic, Dielectric and Thermal Stability of Ni–Zn Ferrite-Epoxy Composite Thin Films for Electronic Applications. J. Magn. Magn. Mater. 2012, 324, 755–760. [Google Scholar] [CrossRef]
- Zhao, H.; Zheng, Z.; Wong, K.W.; Wang, S.; Huang, B.; Li, D. Fabrication and Electrochemical Performance of Nickel Ferrite Nanoparticles as Anode Material in Lithium Ion Batteries. Electrochem. Commun. 2007, 9, 2606–2610. [Google Scholar] [CrossRef]
- Yurkov, G.; Koksharov, Y.; Fionov, A.; Taratanov, N.; Kolesov, V.; Kirillov, V.; Makeev, M.; Mikhalev, P.; Ryzhenko, D.; Solodilov, V. Polymer Nanocomposite Containing Palladium Nanoparticles: Synthesis, Characterization, and Properties. Polymers 2022, 14, 3795. [Google Scholar] [CrossRef]
- Zhukov, A.M.; Solodilov, V.I.; Tretyakov, I.V.; Burakova, E.A.; Yurkov, G.Y. The Effect of the Structure of Iron-Containing Nanoparticles on the Functional Properties of Composite Materials Based on High-Density Polyethylene. Russ. J. Phys. Chem. B 2022, 16, 926–932. [Google Scholar] [CrossRef]
- Matsnev, M.E.; Rusakov, V.S. SpectrRelax: An Application for Mössbauer Spectra Modeling and Fitting. AIP Conf. Proc. 2012, 1489, 178–185. [Google Scholar] [CrossRef]
- Kochubei, D.I.; Babanov, Y.A.; Zamaraev, K.I.; Mazalov, L.N. X-Ray Spectral Method for Studying the Structure of Amorphous Bodies: EXAFS Spectroscopy. Available online: https://www.studmed.ru/kochubey-di-i-dr-rentgenospektralnyy-metod-izucheniya-struktury-amorfnyh-tel-exafs-spektroskopiya_8152d012155.html (accessed on 5 June 2023).
- Newville, M. EXAFS Analysis Using FEFF and FEFFIT. J. Synchrotron Rad. 2001, 8, 96–100. [Google Scholar] [CrossRef] [PubMed]
- Zabinsky, S.I.; Rehr, J.J.; Ankudinov, A.; Albers, R.C.; Eller, M.J. Multiple-Scattering Calculations of x-Ray-Absorption Spectra. Phys. Rev. B 1995, 52, 2995–3009. [Google Scholar] [CrossRef] [PubMed]
- Gibart, P.; Suran, G. Epitaxial NiFe2O4 Films Deposited on Nd3Ga5O12 Substrate. AIP Conf. Proc. 1976, 29, 578–580. [Google Scholar] [CrossRef]
- Chkoundali, S.; Ammar, S.; Jouini, N.; Fiévet, F.; Molinié, P.; Danot, M.; Villain, F.; Grenèche, J.-M. Nickel Ferrite Nanoparticles: Elaboration in Polyol Medium via Hydrolysis, and Magnetic Properties. J. Phys. Condens. Matter 2004, 16, 4357. [Google Scholar] [CrossRef]
- Moumen, N.; Pileni, M.P. New Syntheses of Cobalt Ferrite Particles in the Range 2−5 Nm: Comparison of the Magnetic Properties of the Nanosized Particles in Dispersed Fluid or in Powder Form. Chem. Mater. 1996, 8, 1128–1134. [Google Scholar] [CrossRef]
- Kuchma, E.; Kubrin, S.; Soldatov, A. The Local Atomic Structure of Colloidal Superparamagnetic Iron Oxide Nanoparticles for Theranostics in Oncology. Biomedicines 2018, 6, 78. [Google Scholar] [CrossRef] [PubMed]
- Vandenberghe, R.E.; De Grave, E. Mössbauer Effect Studies of Oxidic Spinels. In Mössbauer Spectroscopy Applied to Inorganic Chemistry; Long, G.J., Grandjean, F., Eds.; Modern Inorganic Chemistry; Springer: Boston, MA, USA, 1989; pp. 59–182. ISBN 978-1-4899-2289-2. [Google Scholar]
- Srinivasamurthy, K.M.; Angadi, V.J.; Kubrin, S.P.; Matteppanavar, S.; Sarychev, D.A.; Kumar, P.M.; Azale, H.W.; Rudraswamy, B. Tuning of Ferrimagnetic Nature and Hyperfine Interaction of Ni2+ Doped Cobalt Ferrite Nanoparticles for Power Transformer Applications. Ceram. Int. 2018, 44, 9194–9203. [Google Scholar] [CrossRef]


| Composition | NiFe2O4 |
| Spatial group | Fd-3m |
| Syngony | cubic |
| Parameters, a, Å | 8.338 |
| Bragg factor | 2.73 |
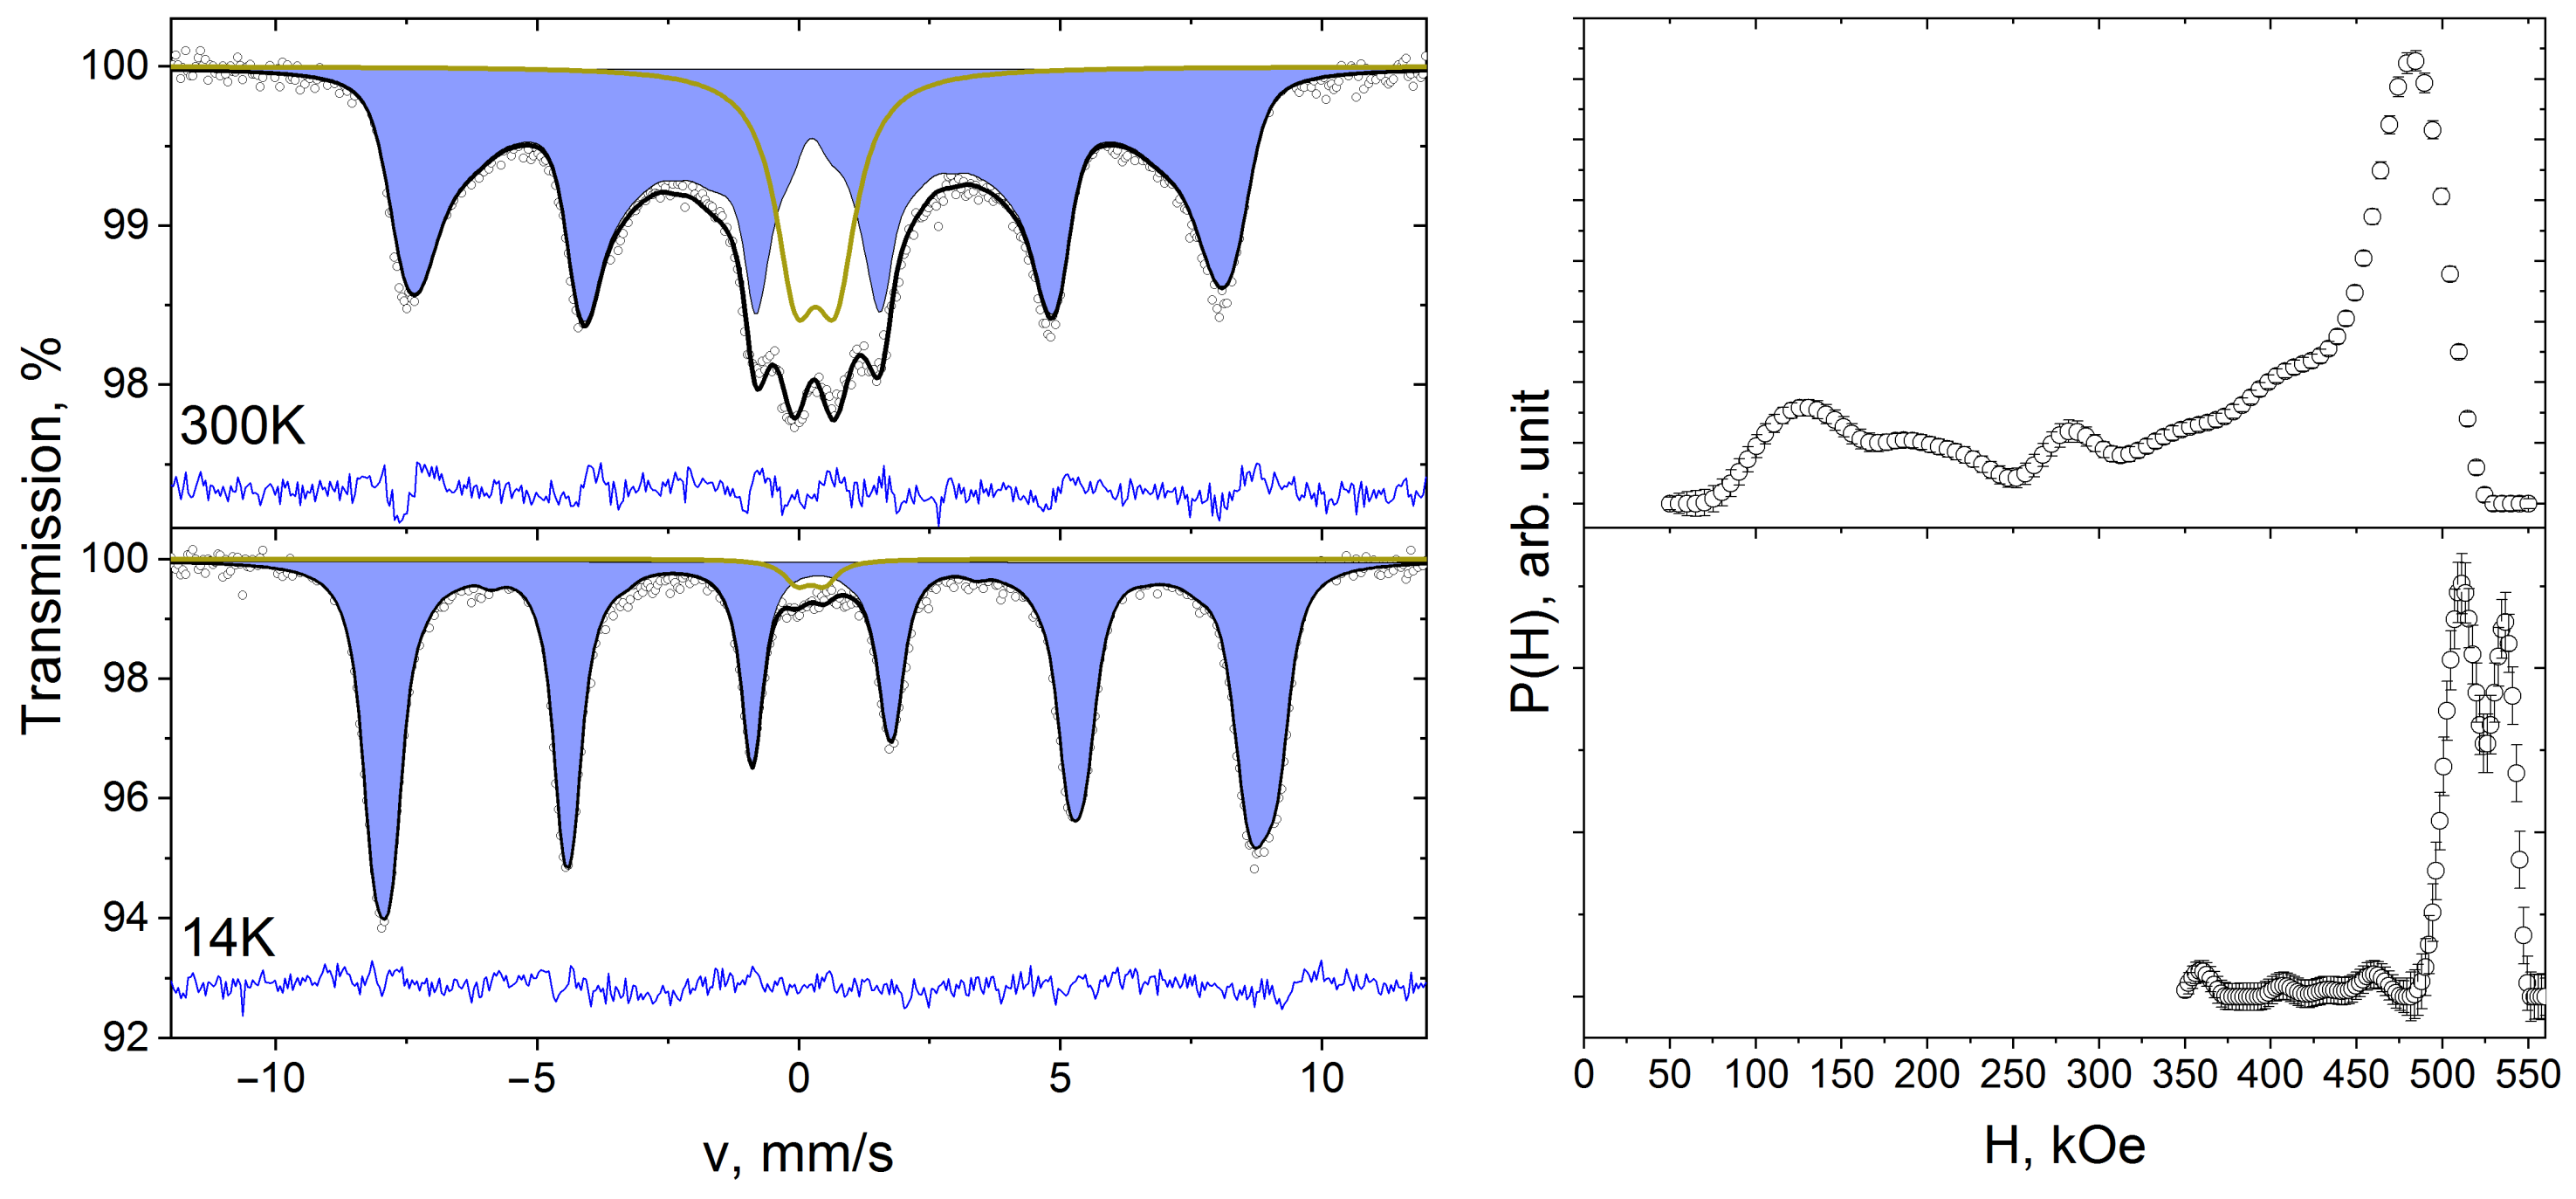
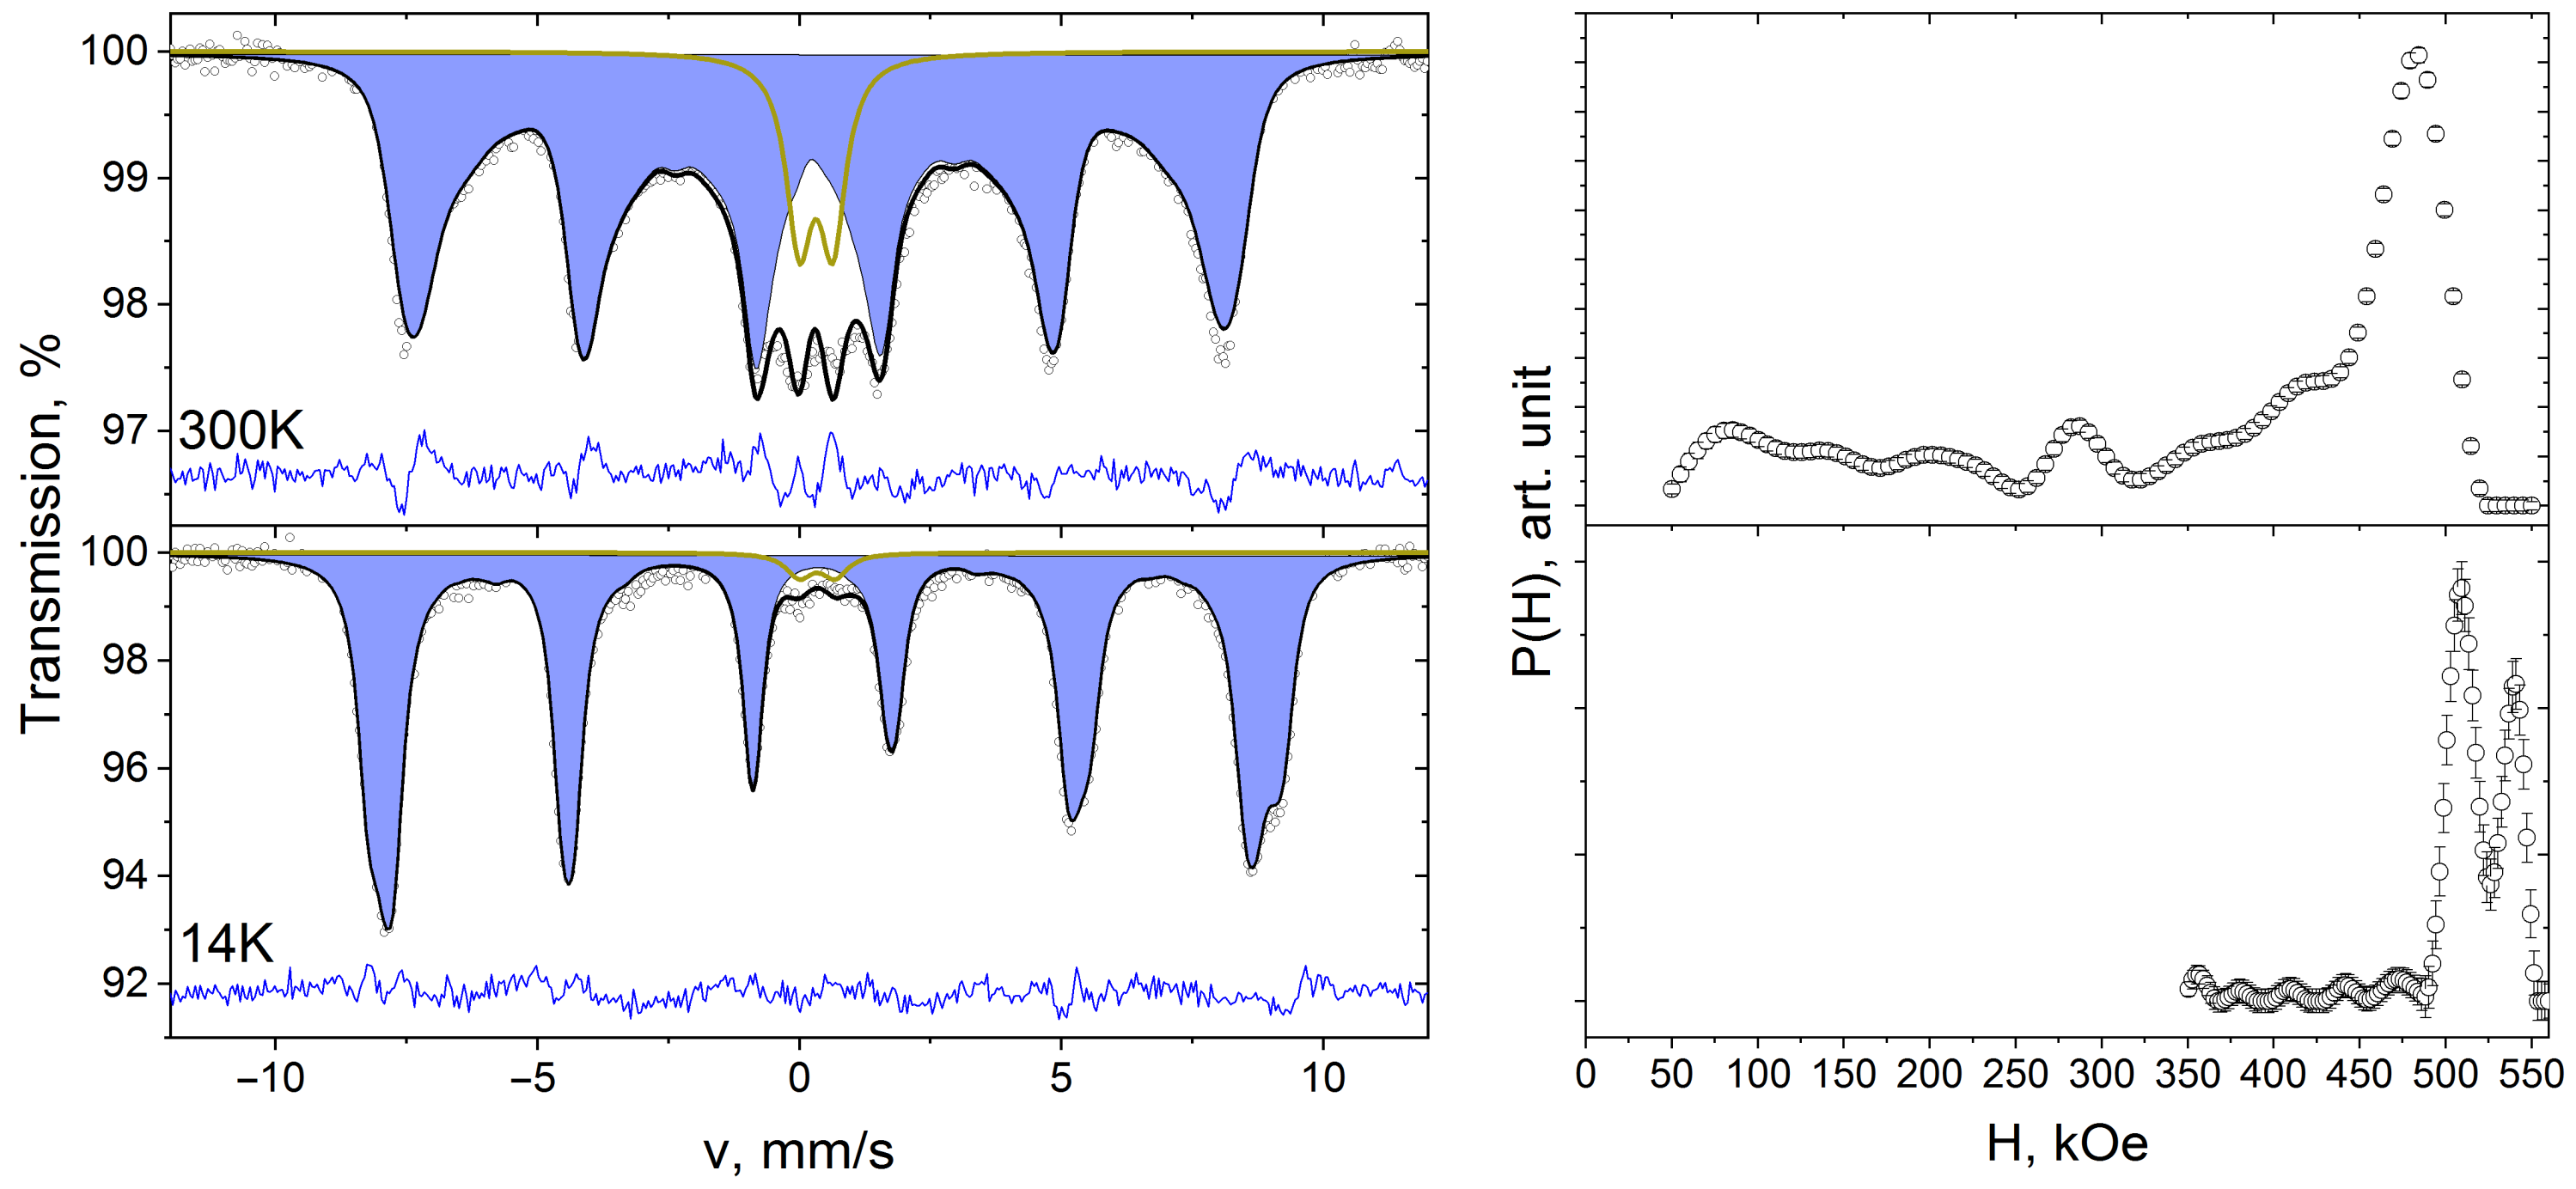
| Samples | Component | δ ± 0.02, mm/s | Δ/ε ± 0.02, mm/s | H ± 1, kOe | Γ ± 0.02, mm/s | A ± 1, % |
|---|---|---|---|---|---|---|
| 1 | D | 0.45 | 0.82 | 0.60 | 7 | |
| DP | 1.23 | 2.80 | 0.60 | 4 | ||
| SA | 0.40 | −0.01 | 506 | 0.53 | 45 | |
| SB | 0.50 | 0.01 | 530 | 0.53 | 44 | |
| 2 | D | 0.39 | 0.66 | 0.54 | 2 | |
| SA | 0.40 | −0.01 | 509 | 0.58 | 52 | |
| SB | 0.49 | 0.01 | 533 | 0.58 | 46 | |
| 3 | D | 0.40 | 0.68 | 0.57 | 2 | |
| SA | 0.40 | −0.01 | 509 | 0.48 | 64 | |
| SB | 0.50 | −0.01 | 538 | 0.48 | 34 |
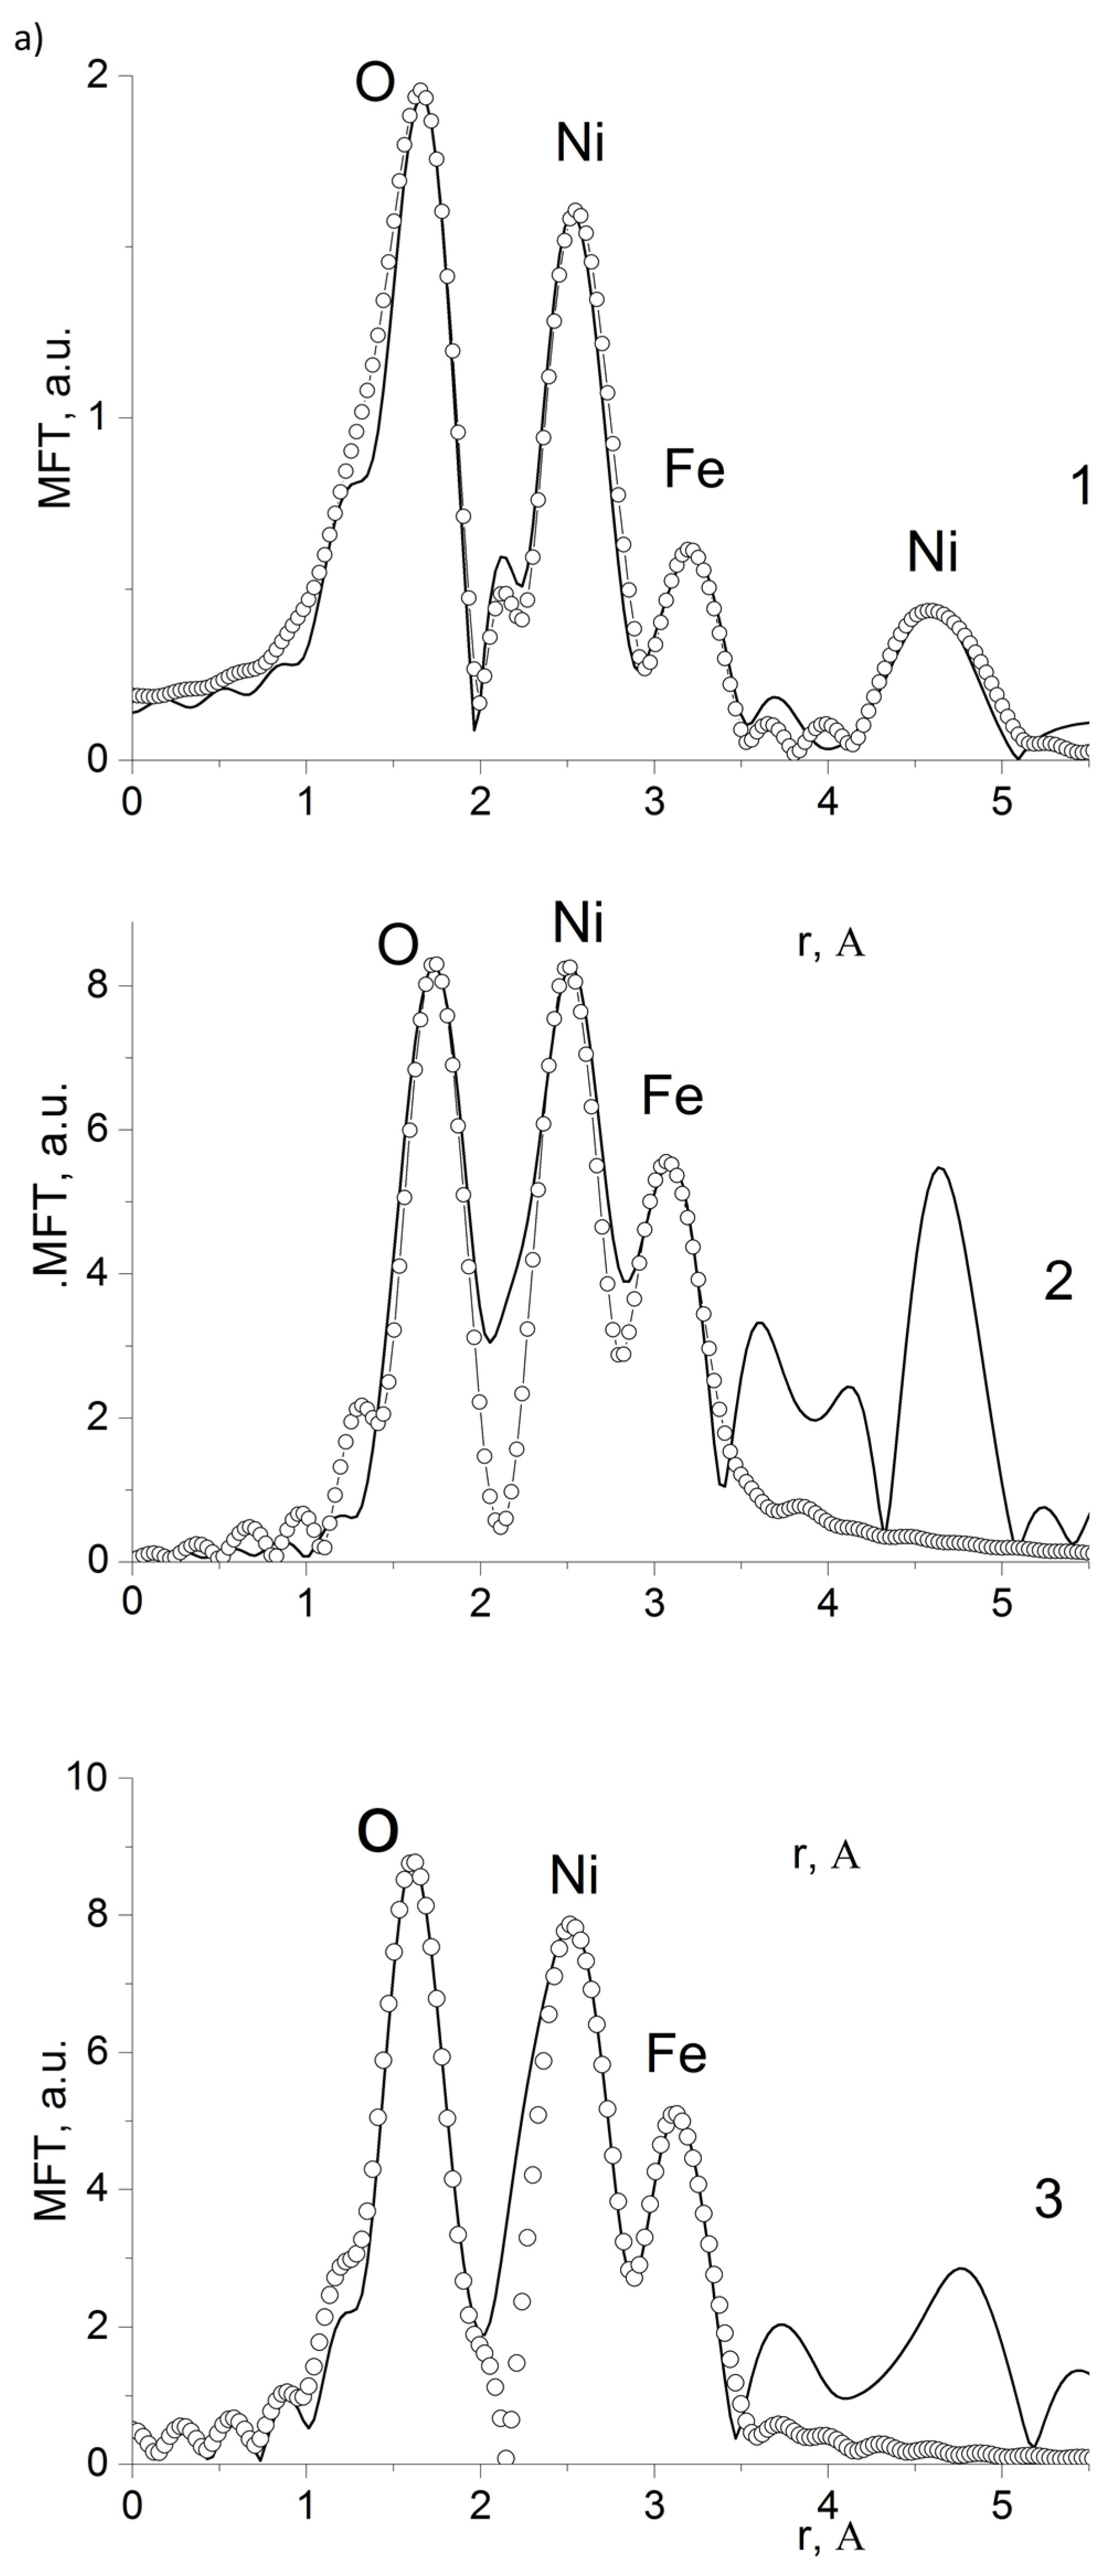
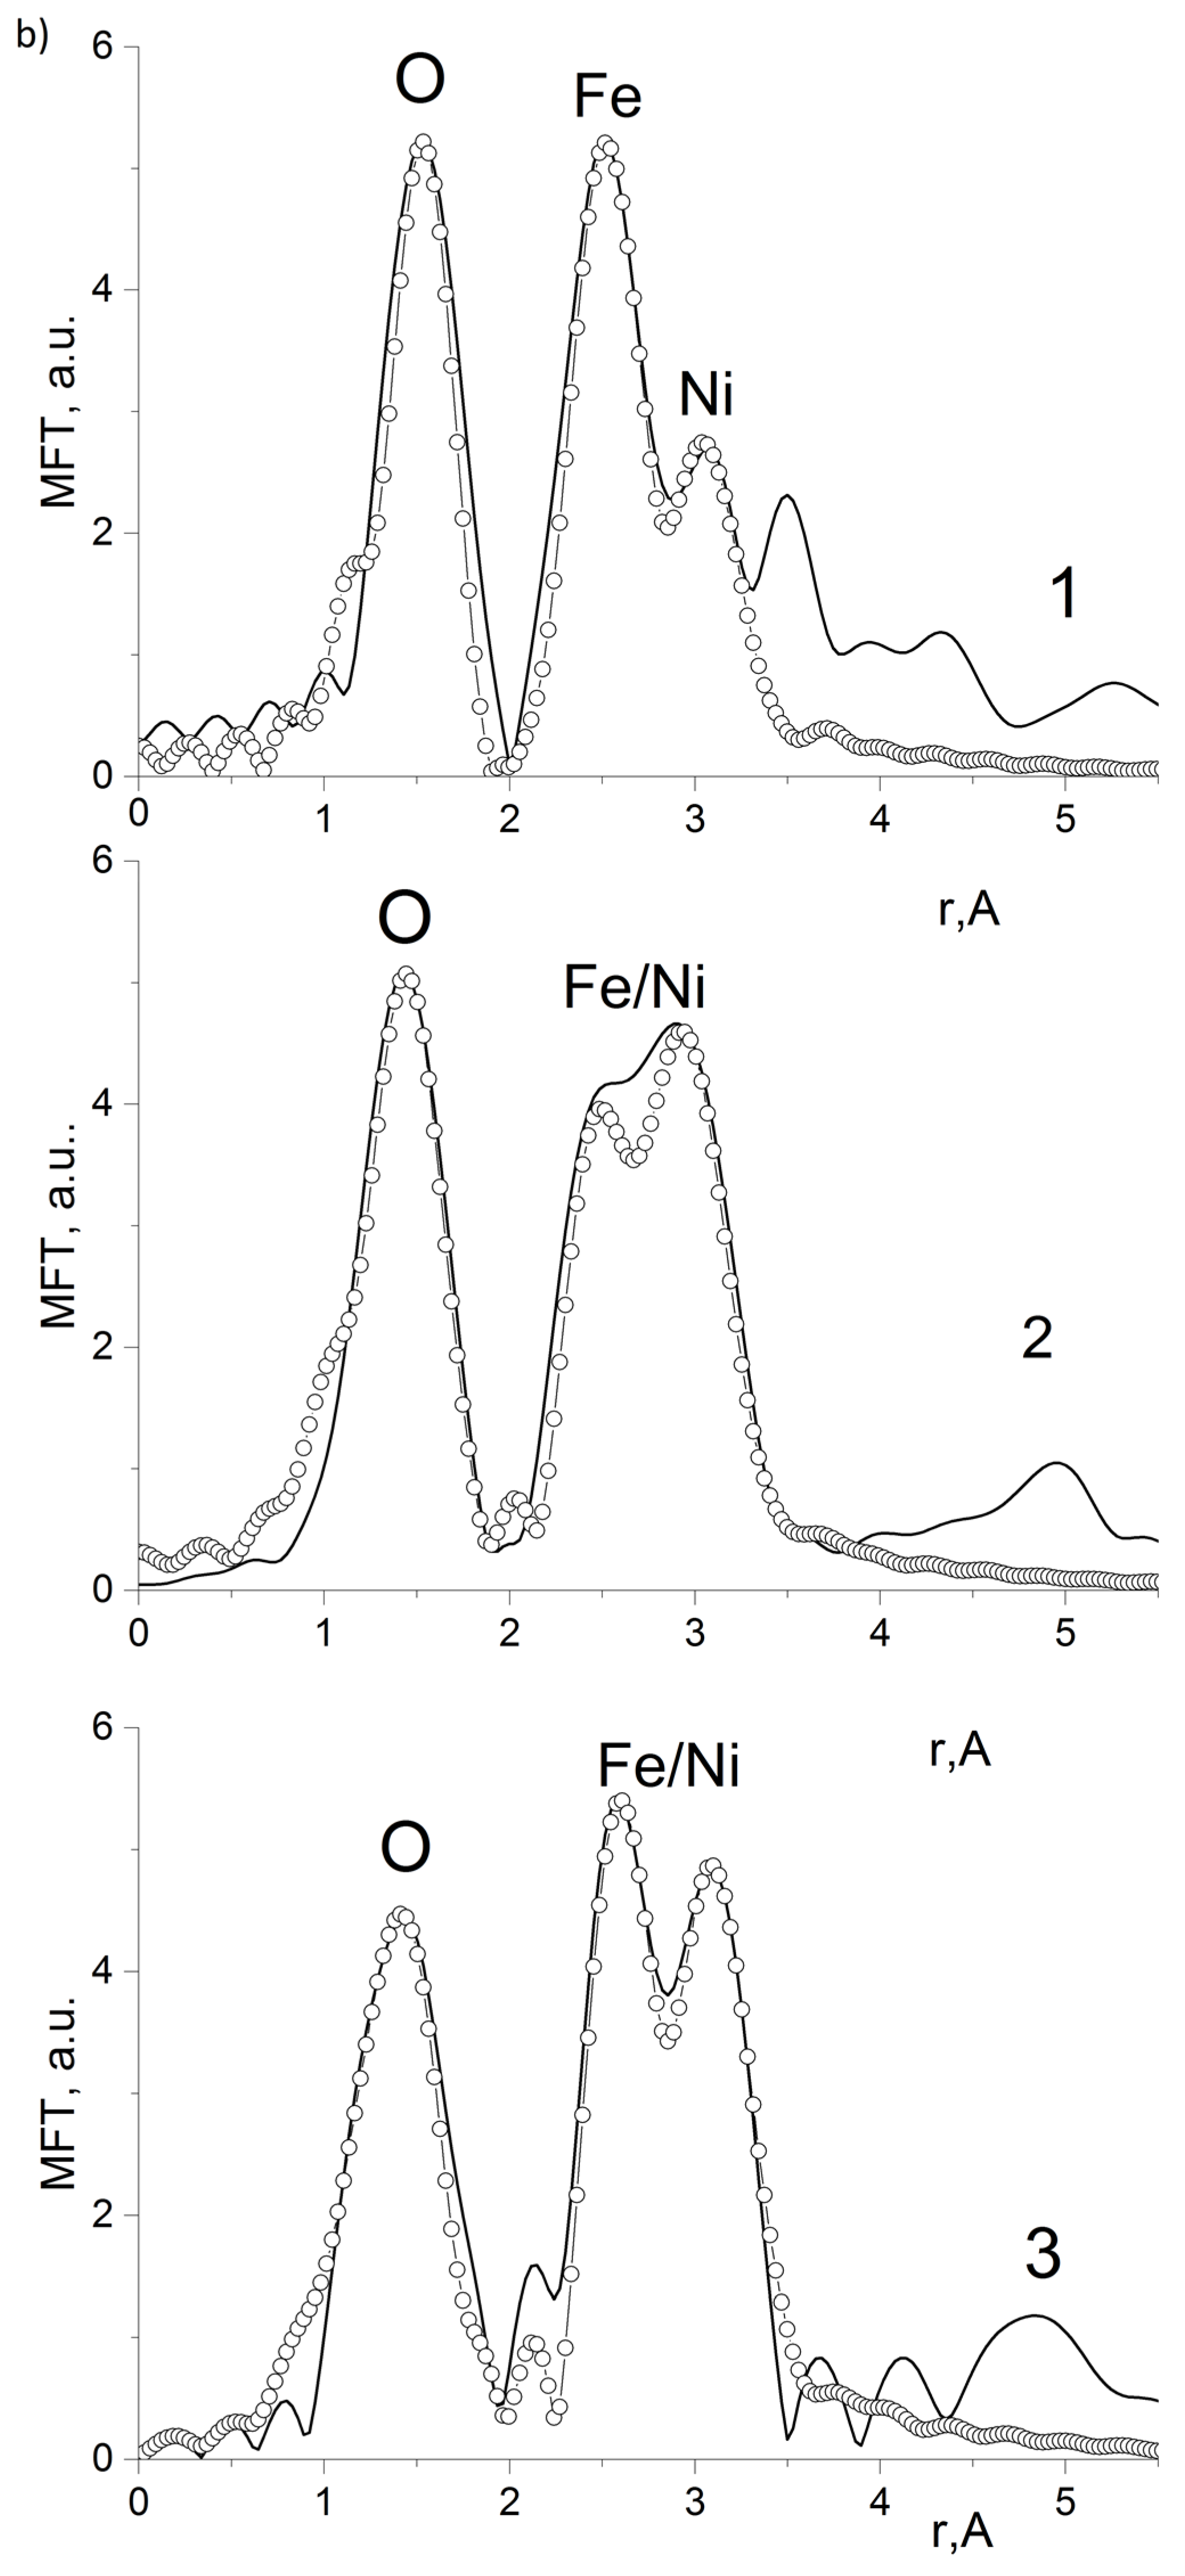
| Edge and Composite | N | R, Ǻ | σ2, Ǻ2 | Edge Structure | Q, % |
|---|---|---|---|---|---|
| Fe K-edge 10%NiFe2O4@HPPE | 1.5 | 1.91 | 0.0035 | O (tetra) | 4.0 * |
| 1.5 | 2.05 | 0.0035 | O (octahedron) | ||
| 1.6 | 2.92 | 0.0045 | Fe | ||
| 1.3 | 3.39 | 0.0045 | Ni | ||
| Ni K-edge 10%NiFe2O4@HPPE | 5.4 | 2.08 | 0.0040 | O (octahedron) | 6.4 ** |
| 4.2 | 2.97 | 0.0050 | Ni | ||
| 3.2 | 3.41 | 0.0050 | Fe | ||
| Fe K-edge 20%NiFe2O4@HPPE | 1.6 | 1.89 | 0.0035 | O (tetra) | 7.8 ** |
| 1.5 | 2.01 | 0.0035 | O (octahedron) | ||
| 1.6 | 2.98 | 0.0045 | Fe | ||
| 3.3 | 3.44 | 0.0045 | Ni | ||
| Ni K-edge 20%NiFe2O4@HPPE | 3.4 | 2.13 | 0.0035 | O (octahedron) | 3.5 ** |
| 2.9 | 2.91 | 0.0050 | Ni | ||
| 4.1 | 3.42 | 0.0050 | Fe | ||
| Fe K-edge 30%NiFe2O4@HPPE | 1.6 | 1.85 | 0.0035 | O (tetra) | 8.6 ** |
| 1.5 | 2.00 | 0.0035 | O (octahedron) | ||
| 2.1 | 3.02 | 0.0045 | Fe | ||
| 3.3 | 3.43 | 0.0045 | Ni | ||
| Ni K-edge 10%NiFe2O4@HPPE | 4.0 | 2.04 | 0.0035 | O (octahedron) | 9.9 ** |
| 2.9 | 2.92 | 0.0050 | Ni | ||
| 3.0 | 3.46 | 0.0050 | Fe |
Disclaimer/Publisher’s Note: The statements, opinions and data contained in all publications are solely those of the individual author(s) and contributor(s) and not of MDPI and/or the editor(s). MDPI and/or the editor(s) disclaim responsibility for any injury to people or property resulting from any ideas, methods, instructions or products referred to in the content. |
© 2023 by the authors. Licensee MDPI, Basel, Switzerland. This article is an open access article distributed under the terms and conditions of the Creative Commons Attribution (CC BY) license (https://creativecommons.org/licenses/by/4.0/).
Share and Cite
Yurkov, G.; Kozinkin, A.; Kubrin, S.; Zhukov, A.; Podsukhina, S.; Vlasenko, V.; Fionov, A.; Kolesov, V.; Zvyagintsev, D.; Vyatkina, M.; et al. Nanocomposites Based on Polyethylene and Nickel Ferrite: Preparation, Characterization, and Properties. Polymers 2023, 15, 3988. https://doi.org/10.3390/polym15193988
Yurkov G, Kozinkin A, Kubrin S, Zhukov A, Podsukhina S, Vlasenko V, Fionov A, Kolesov V, Zvyagintsev D, Vyatkina M, et al. Nanocomposites Based on Polyethylene and Nickel Ferrite: Preparation, Characterization, and Properties. Polymers. 2023; 15(19):3988. https://doi.org/10.3390/polym15193988
Chicago/Turabian StyleYurkov, Gleb, Alexander Kozinkin, Stanislav Kubrin, Alexander Zhukov, Svetlana Podsukhina, Valeriy Vlasenko, Alexander Fionov, Vladimir Kolesov, Dmitry Zvyagintsev, Maria Vyatkina, and et al. 2023. "Nanocomposites Based on Polyethylene and Nickel Ferrite: Preparation, Characterization, and Properties" Polymers 15, no. 19: 3988. https://doi.org/10.3390/polym15193988
APA StyleYurkov, G., Kozinkin, A., Kubrin, S., Zhukov, A., Podsukhina, S., Vlasenko, V., Fionov, A., Kolesov, V., Zvyagintsev, D., Vyatkina, M., & Solodilov, V. (2023). Nanocomposites Based on Polyethylene and Nickel Ferrite: Preparation, Characterization, and Properties. Polymers, 15(19), 3988. https://doi.org/10.3390/polym15193988