Figure 1.
Chemical structures of the pseudo-polymers used in the study: (A) 8L6 (composed of L-leucine, 1,6-hexanediol, and sebacic acid); (B) 1L6 (composed of carbonic acid (1) and L-leucine (L); (C) copolymer of 1L6 and 8L6.
Figure 1.
Chemical structures of the pseudo-polymers used in the study: (A) 8L6 (composed of L-leucine, 1,6-hexanediol, and sebacic acid); (B) 1L6 (composed of carbonic acid (1) and L-leucine (L); (C) copolymer of 1L6 and 8L6.
Figure 2.
Metabolic activity according to MTT assay. Results are presented in arbitrary units compared to the control. (A) In pMSFs after 8 h of incubation (five independent experiments); (B) in RAW264.7 after 8 h of incubation (four independent experiments); (C) in pMSFs after 24 h of incubation (ten independent experiments); (D) in RAW264.7 after 24 h of incubation (eight independent experiments).
Figure 3.
Evaluation of apoptosis level according to DiOC6 staining. On the vertical axis, the mean fluorescence intensity (MFI) of DiOC6 is shown. Staining was performed after 24 h of cell growth on the PP films (or without PPs in the control). (A) MFI of DiOC6 measured in fibroblasts (pMSF); (B) MFI of DiOC6 measured in macrophages (RAW264.7). Data from five independent experiments were summarized.
Figure 4.
Gallery of fluorescent images showing HeLa human cell line stably expressing histone H2B-GFP tag within nuclei. These cells were settled on glass (control, A,B), 1L6 (C,D), 8L6 (E,F), and copolymer (G,H) surfaces. Note that all nuclei emitted bright green fluorescence. Moreover, note the number of mitotic cells (arrows; A–C). To present chromatin texture, nuclei were imaged under high magnification (B). Arrows are pointing to mitotic cells. NPL—nucleoplasm; nl—nucleolus.
Figure 5.
(A) Mitotic index calculated in control and in cells grown on LPPs after 24 h of incubation. Data from three independent experiments were summarized; 1000 cells were counted for each experiment. (B) A representative picture of RAW264.7 cells stained with DAPI. Mitotic nuclei are marked with ovals.
Figure 6.
Evaluation of the RAW264.7 cells’ motility. (A) The average speed, calculated after 8 h of incubation; (B) the length of the total way of run, calculated after 8 h of incubation; (C) the average distance from the origin, calculated after 8 h of incubation; (D) the average speed, calculated after 24 h of incubation; (E) the length of the total way of run, calculated after 24 h of incubation; (F) the average distance from the origin, calculated after 24 h of incubation. Data from three independent experiments were summarized.
Figure 7.
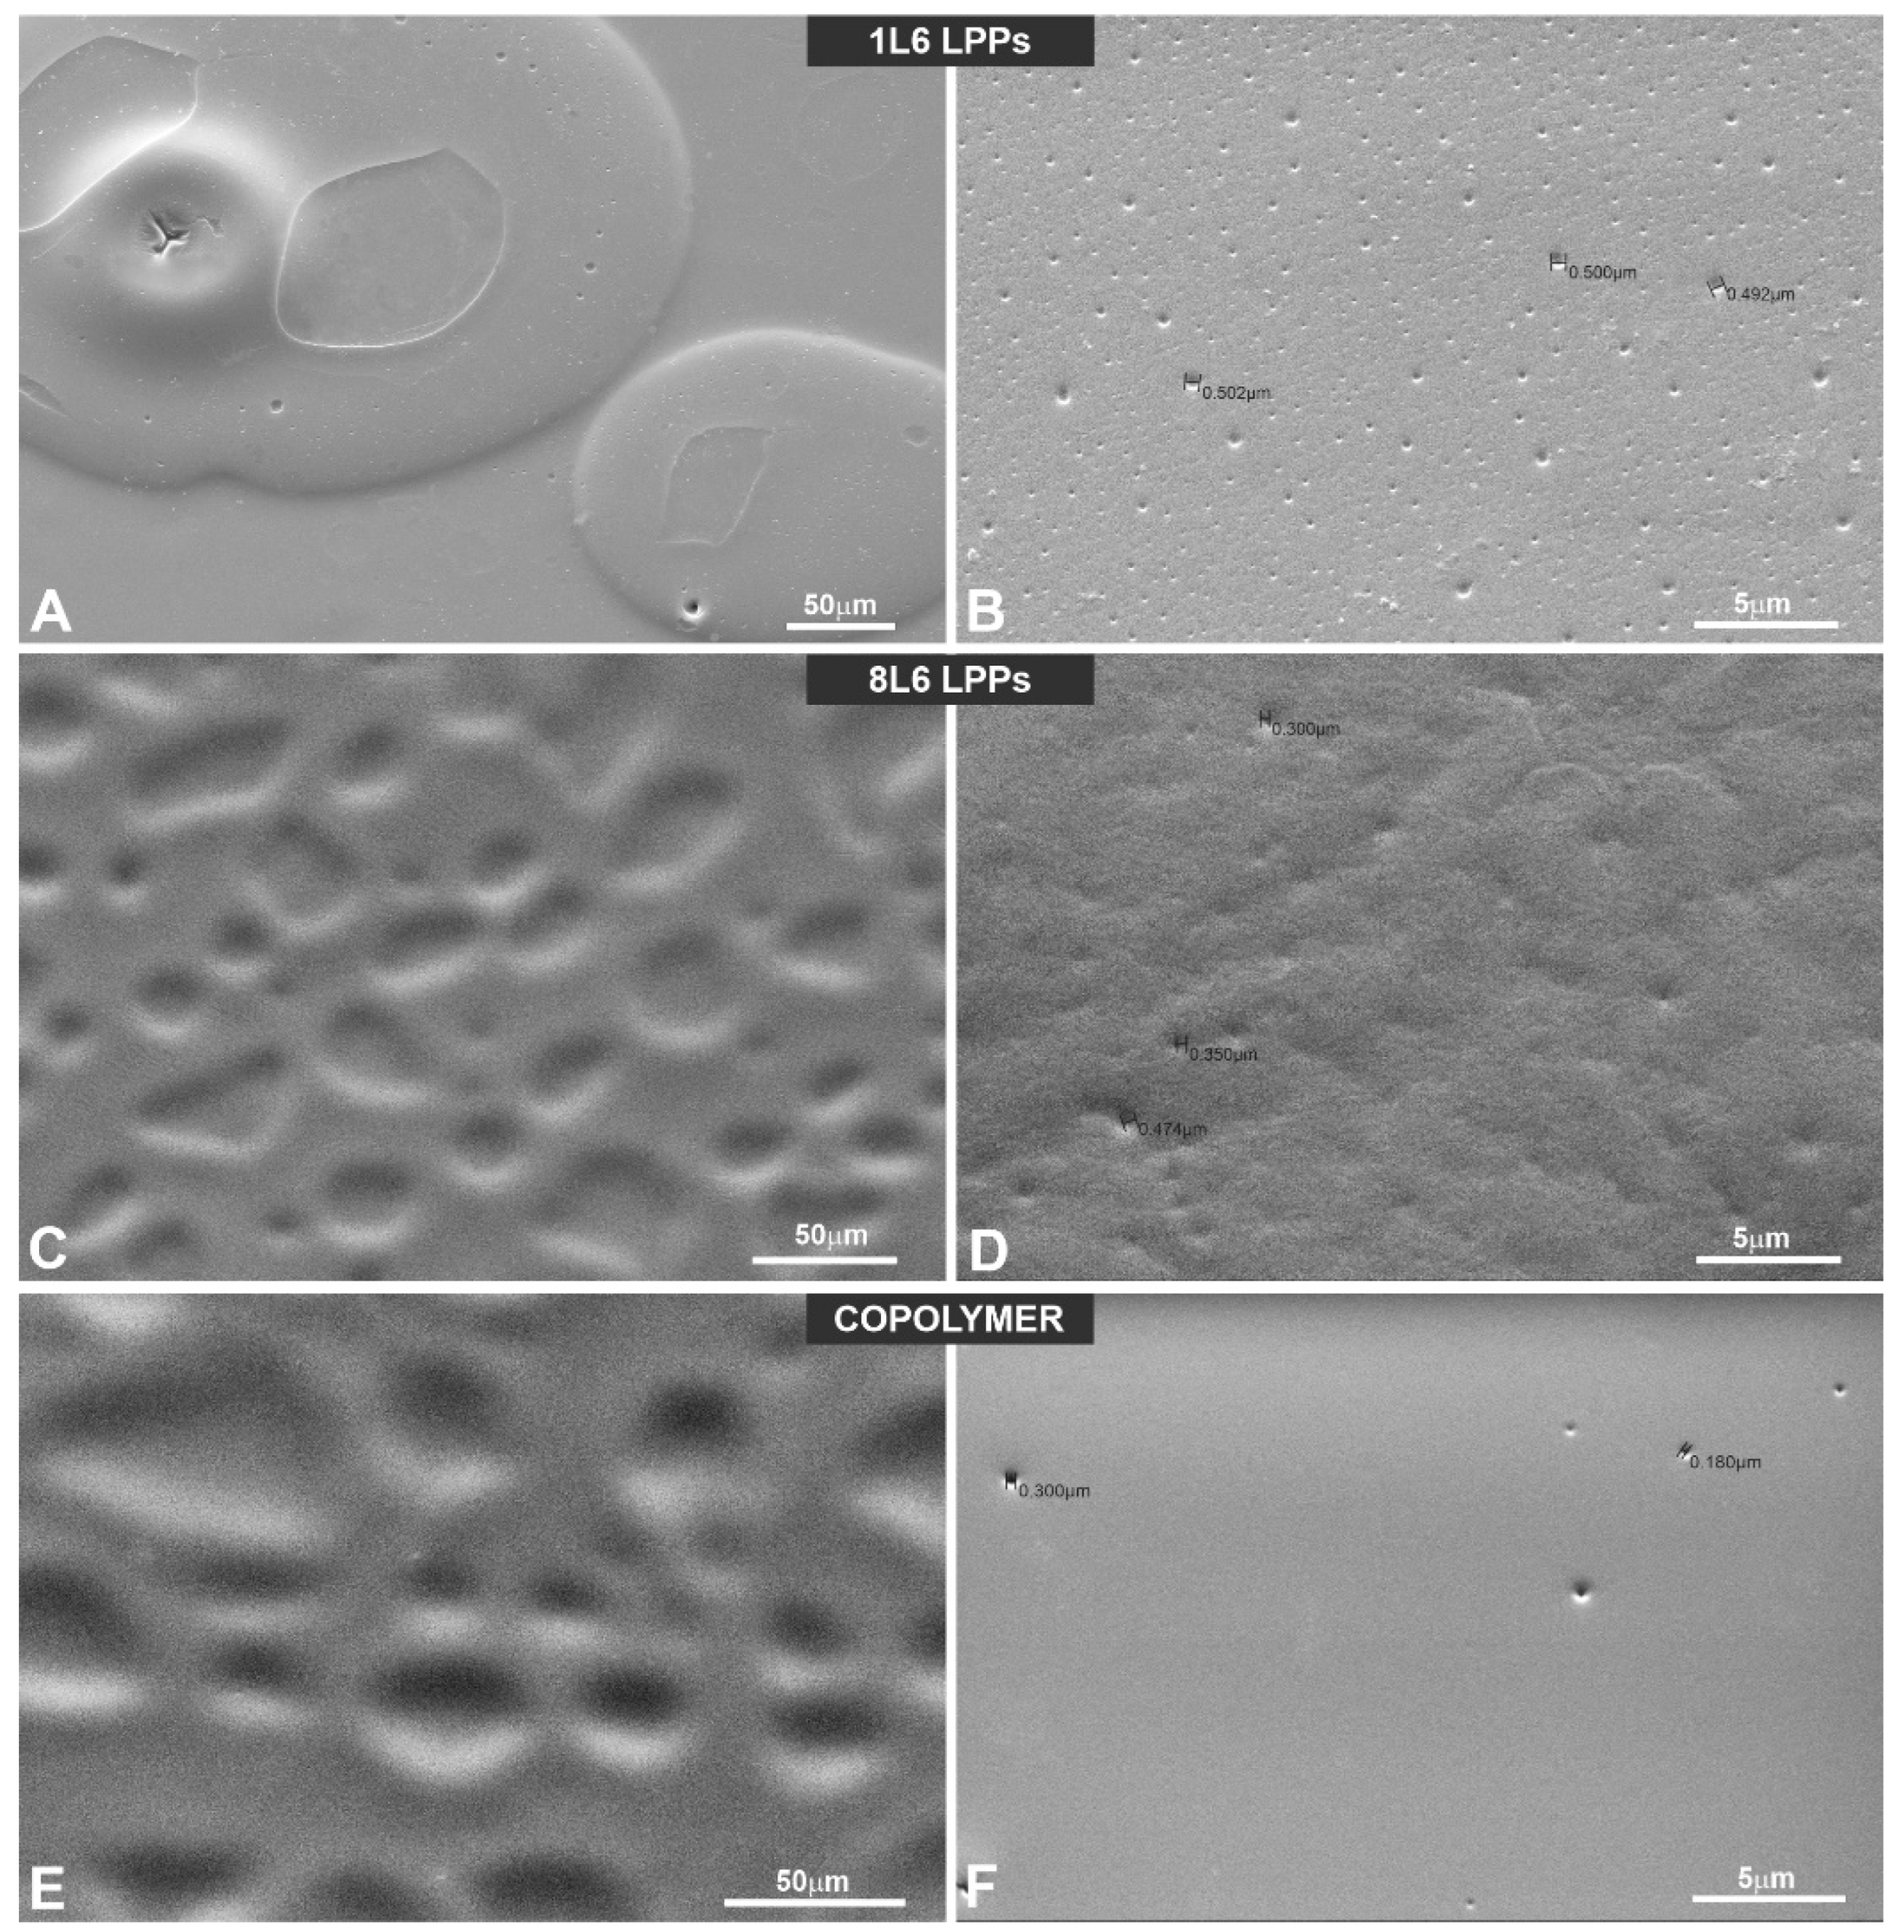
LPP surface characterizations via SEM. Representative SEM images of the LPPs’ surfaces: (A,C,E) ×400; (B,D,F) ×4000; (A,B) 1L6; (C,D) 8L6; (E,F) copolymer.
Figure 7.
LPP surface characterizations via SEM. Representative SEM images of the LPPs’ surfaces: (A,C,E) ×400; (B,D,F) ×4000; (A,B) 1L6; (C,D) 8L6; (E,F) copolymer.
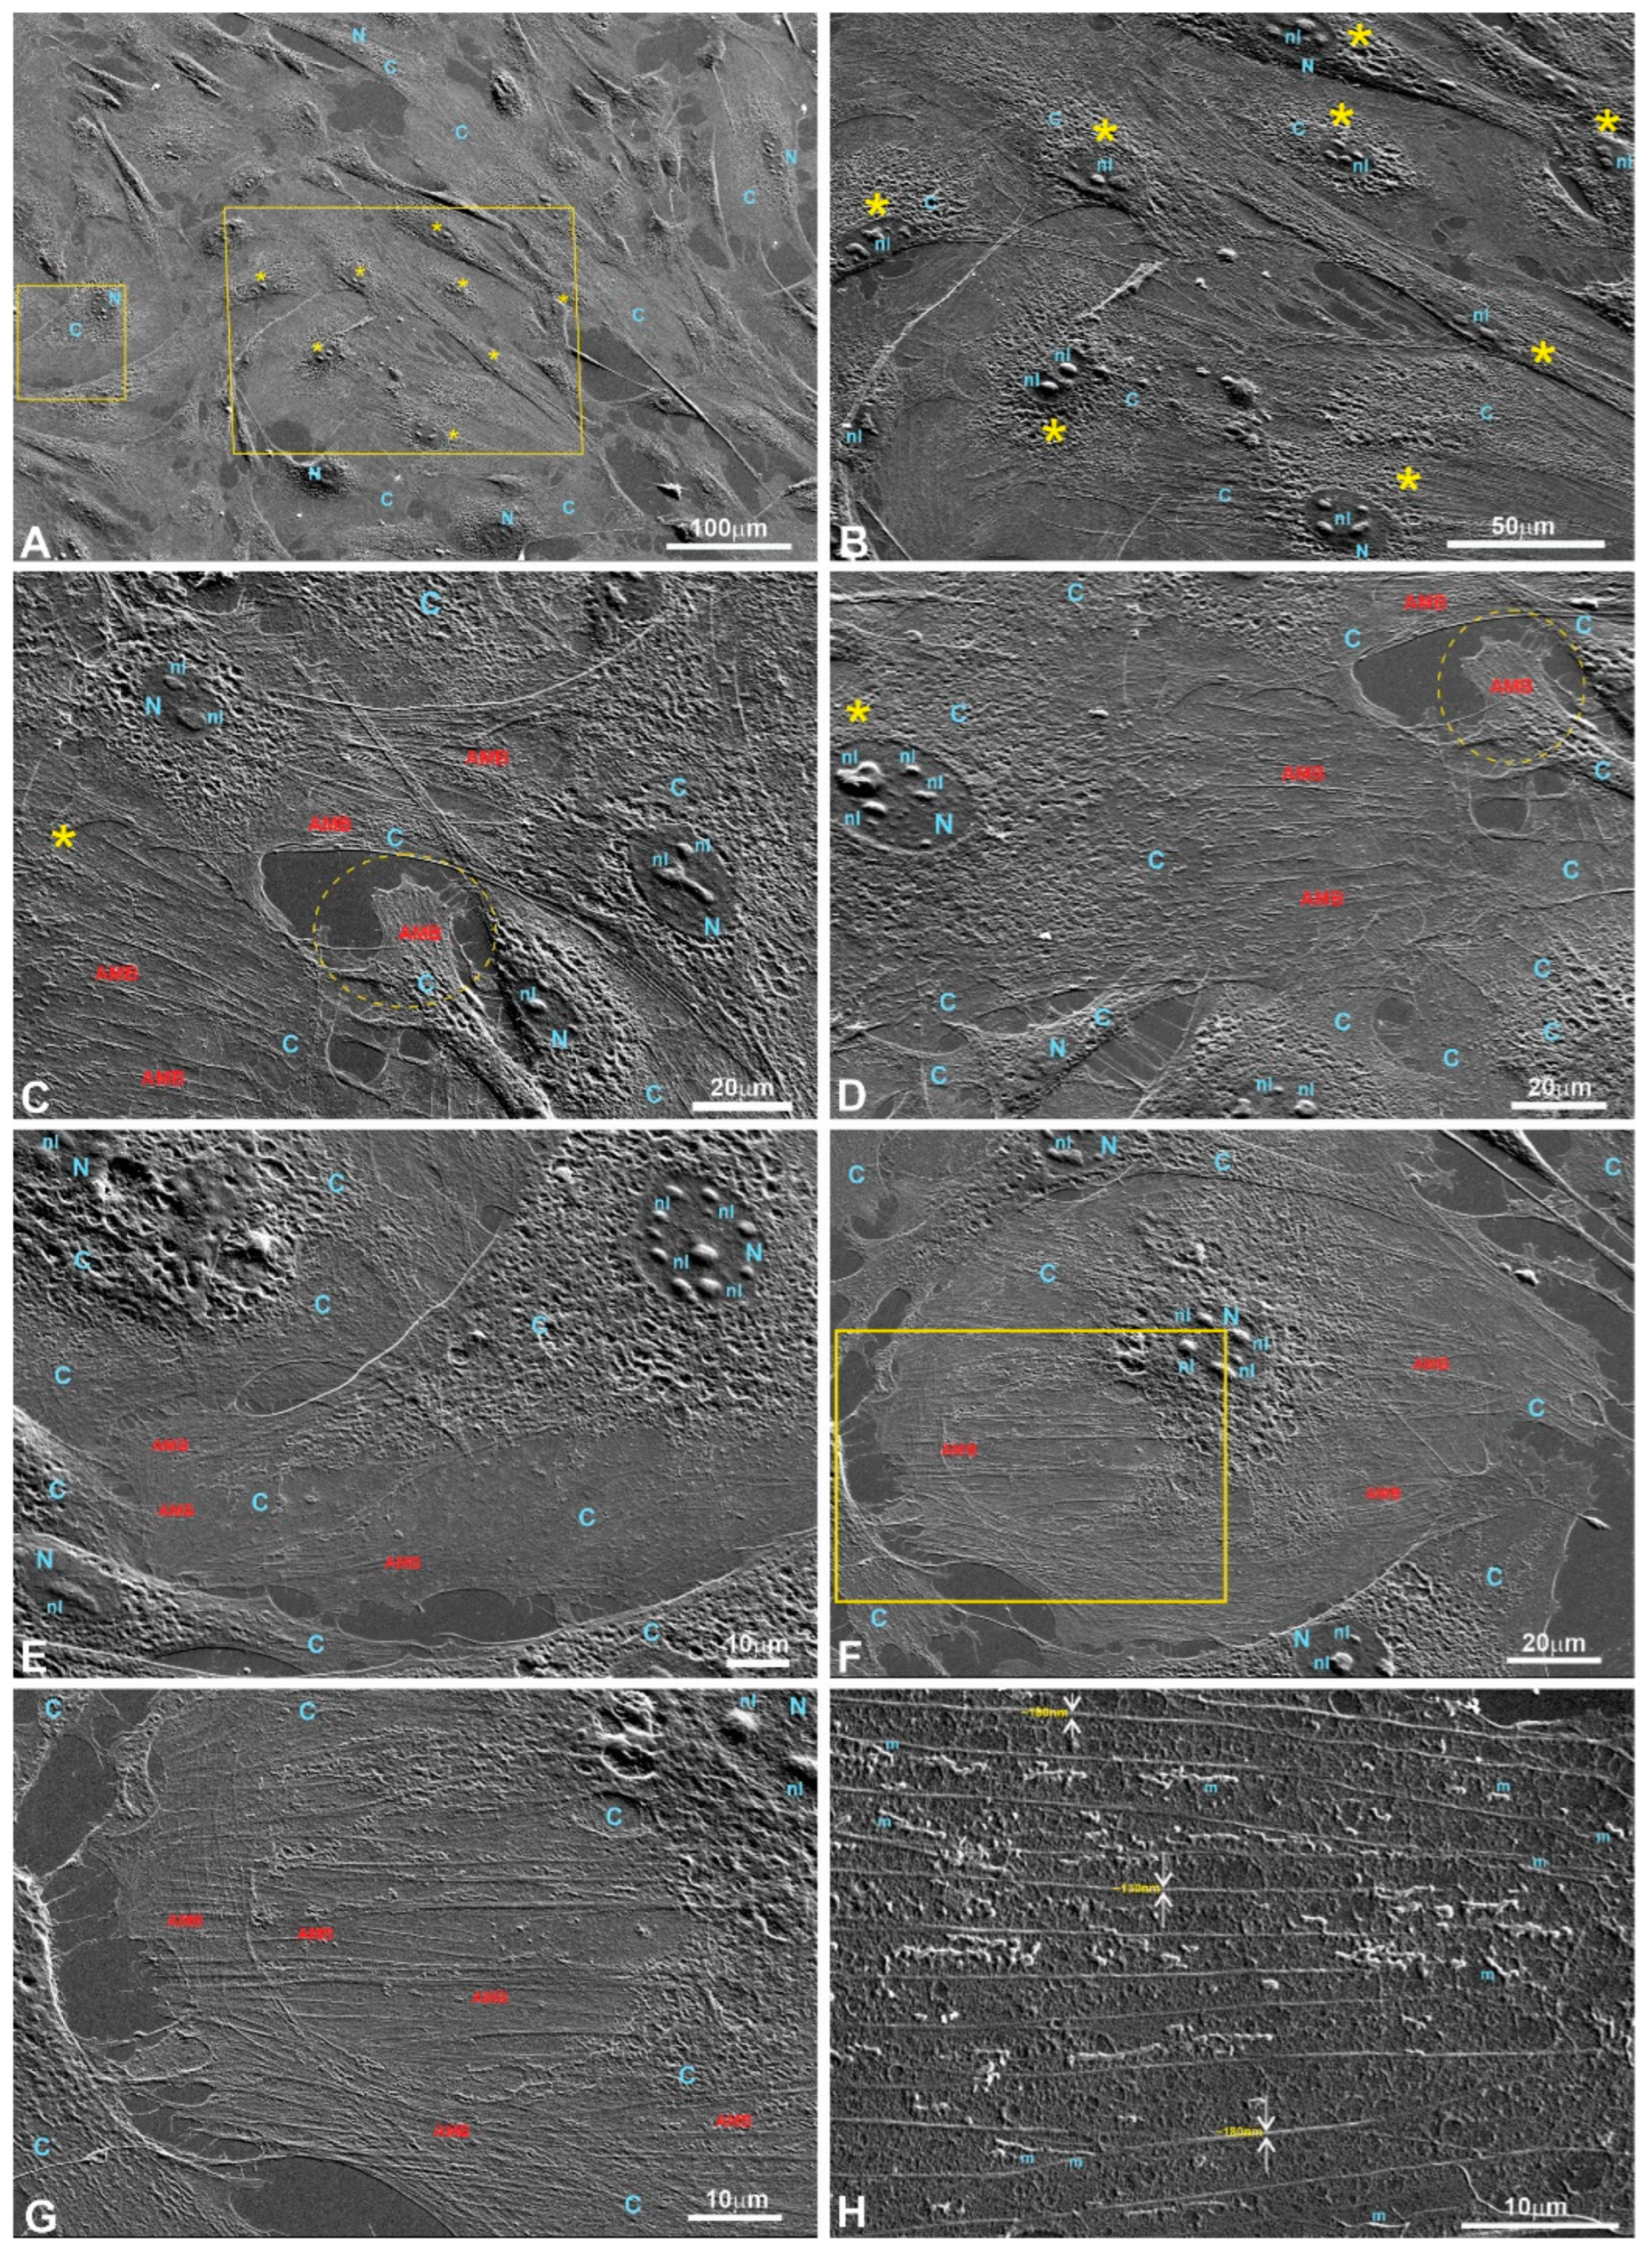
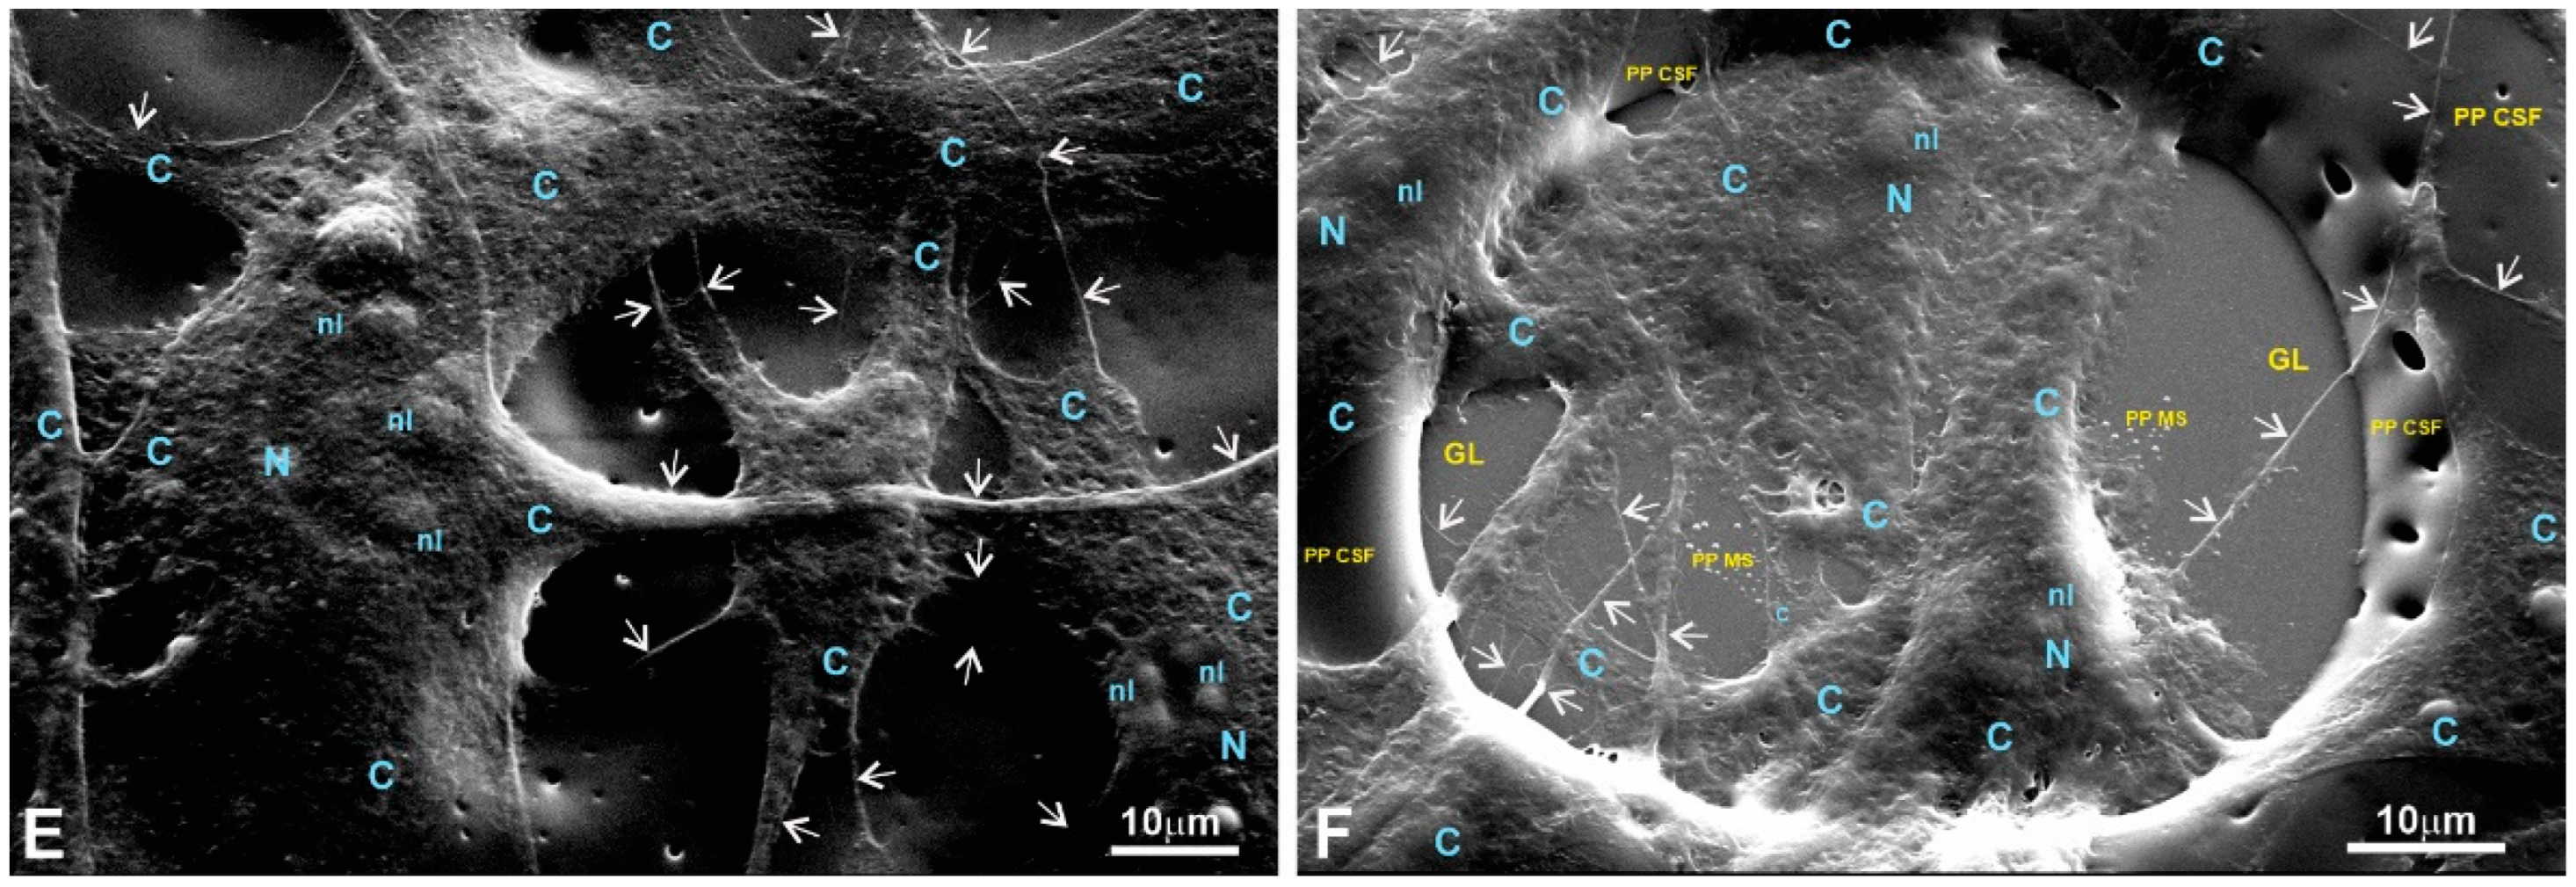
Figure 8.
SEM images of fibroblasts growing on the surface of a PP 1L6 cell-supporting film (PP SCF). (A) Low magnification; (B–D) medium magnification. (A) A layer of properly stretched and chaotically growing cells with multiple cell-to-cell links established via extended primary and tiny secondary processes (arrows). (D) A strongly stretched cytoplasm is nicely visible. Motile cells form typical lamellipodia (outlined with dotted circles in (B,C)), long primary processes, and numerous secondary processes (arrows). All these features generate an impression of the cells’ tight attachment to the 1L6 LPP film. PP CSF—pseudo-protein cell-supporting film; C—cytoplasm; N—nucleus; nl—nucleolus; m—mitochondria; AMB—actin-myosin bundles.
Figure 9.
Fibroblasts growing on the surface of an 8L6 supporting film. (A,B) Low magnification; (C,D) medium magnification. (A,B) SEM images that demonstrate the network of properly stretched and chaotically growing cells. The cells exhibit major cell-specific features, including extended primary and secondary processes (arrows). Polymer-free areas, “holes” in LPP’s coating, where cells are settled on a glass surface are marked with star. Note, cells “climbing” from the glass onto the polymer, being tightly attached similarly to the glass surface and to 8L6 LPP’s surface. PP CSF—pseudo-protein cell-supporting film; C—cytoplasm; N—nucleus; nl—nucleolus; m—mitochondria.
Figure 10.
pMSFs growing on the surface of a copolymer supporting film. (A,B) Low magnification; (C,D) medium magnification. (A,B) Low magnification images demonstrate that similar to the 1L6 and 8L6 PP films, the copolymer facilitates the proper stretching and tight adherence (B) of the pMSFs. Meanwhile, even at the lowest magnification (A), motile cells are readily recognizable as they produced typical leading edges/fronts. In addition, the arrows on (A–D) indicate multiple primary and secondary processes, most probably representing the morphological counterpart of the tight adherence to substrate. PP CSF—pseudo-protein cell-supporting film; C—cytoplasm; N—nucleus; nl—nucleolus; m—mitochondria.
Figure 11.
SEM image of a fibroblast growing on a glass surface. The fibroblast shows a “hairy” appearance due to numerous radially emanating primary processes. (A) Medium magnification; (B) high magnification. On (A), a tight network made of intermittent primary and secondary processes (arrows) is clearly visible; (B) the terminal part of the primary process with flat end-feet. Note that multiple secondary processes of 0.1–0.5 µm diameters (arrows) have tiny local expansions producing a specific “node”-like appearance. C—cytoplasm; N—nucleus; nl—nucleolus; m—mitochondria; AMB—actin-myosin bundles.
Figure 12.
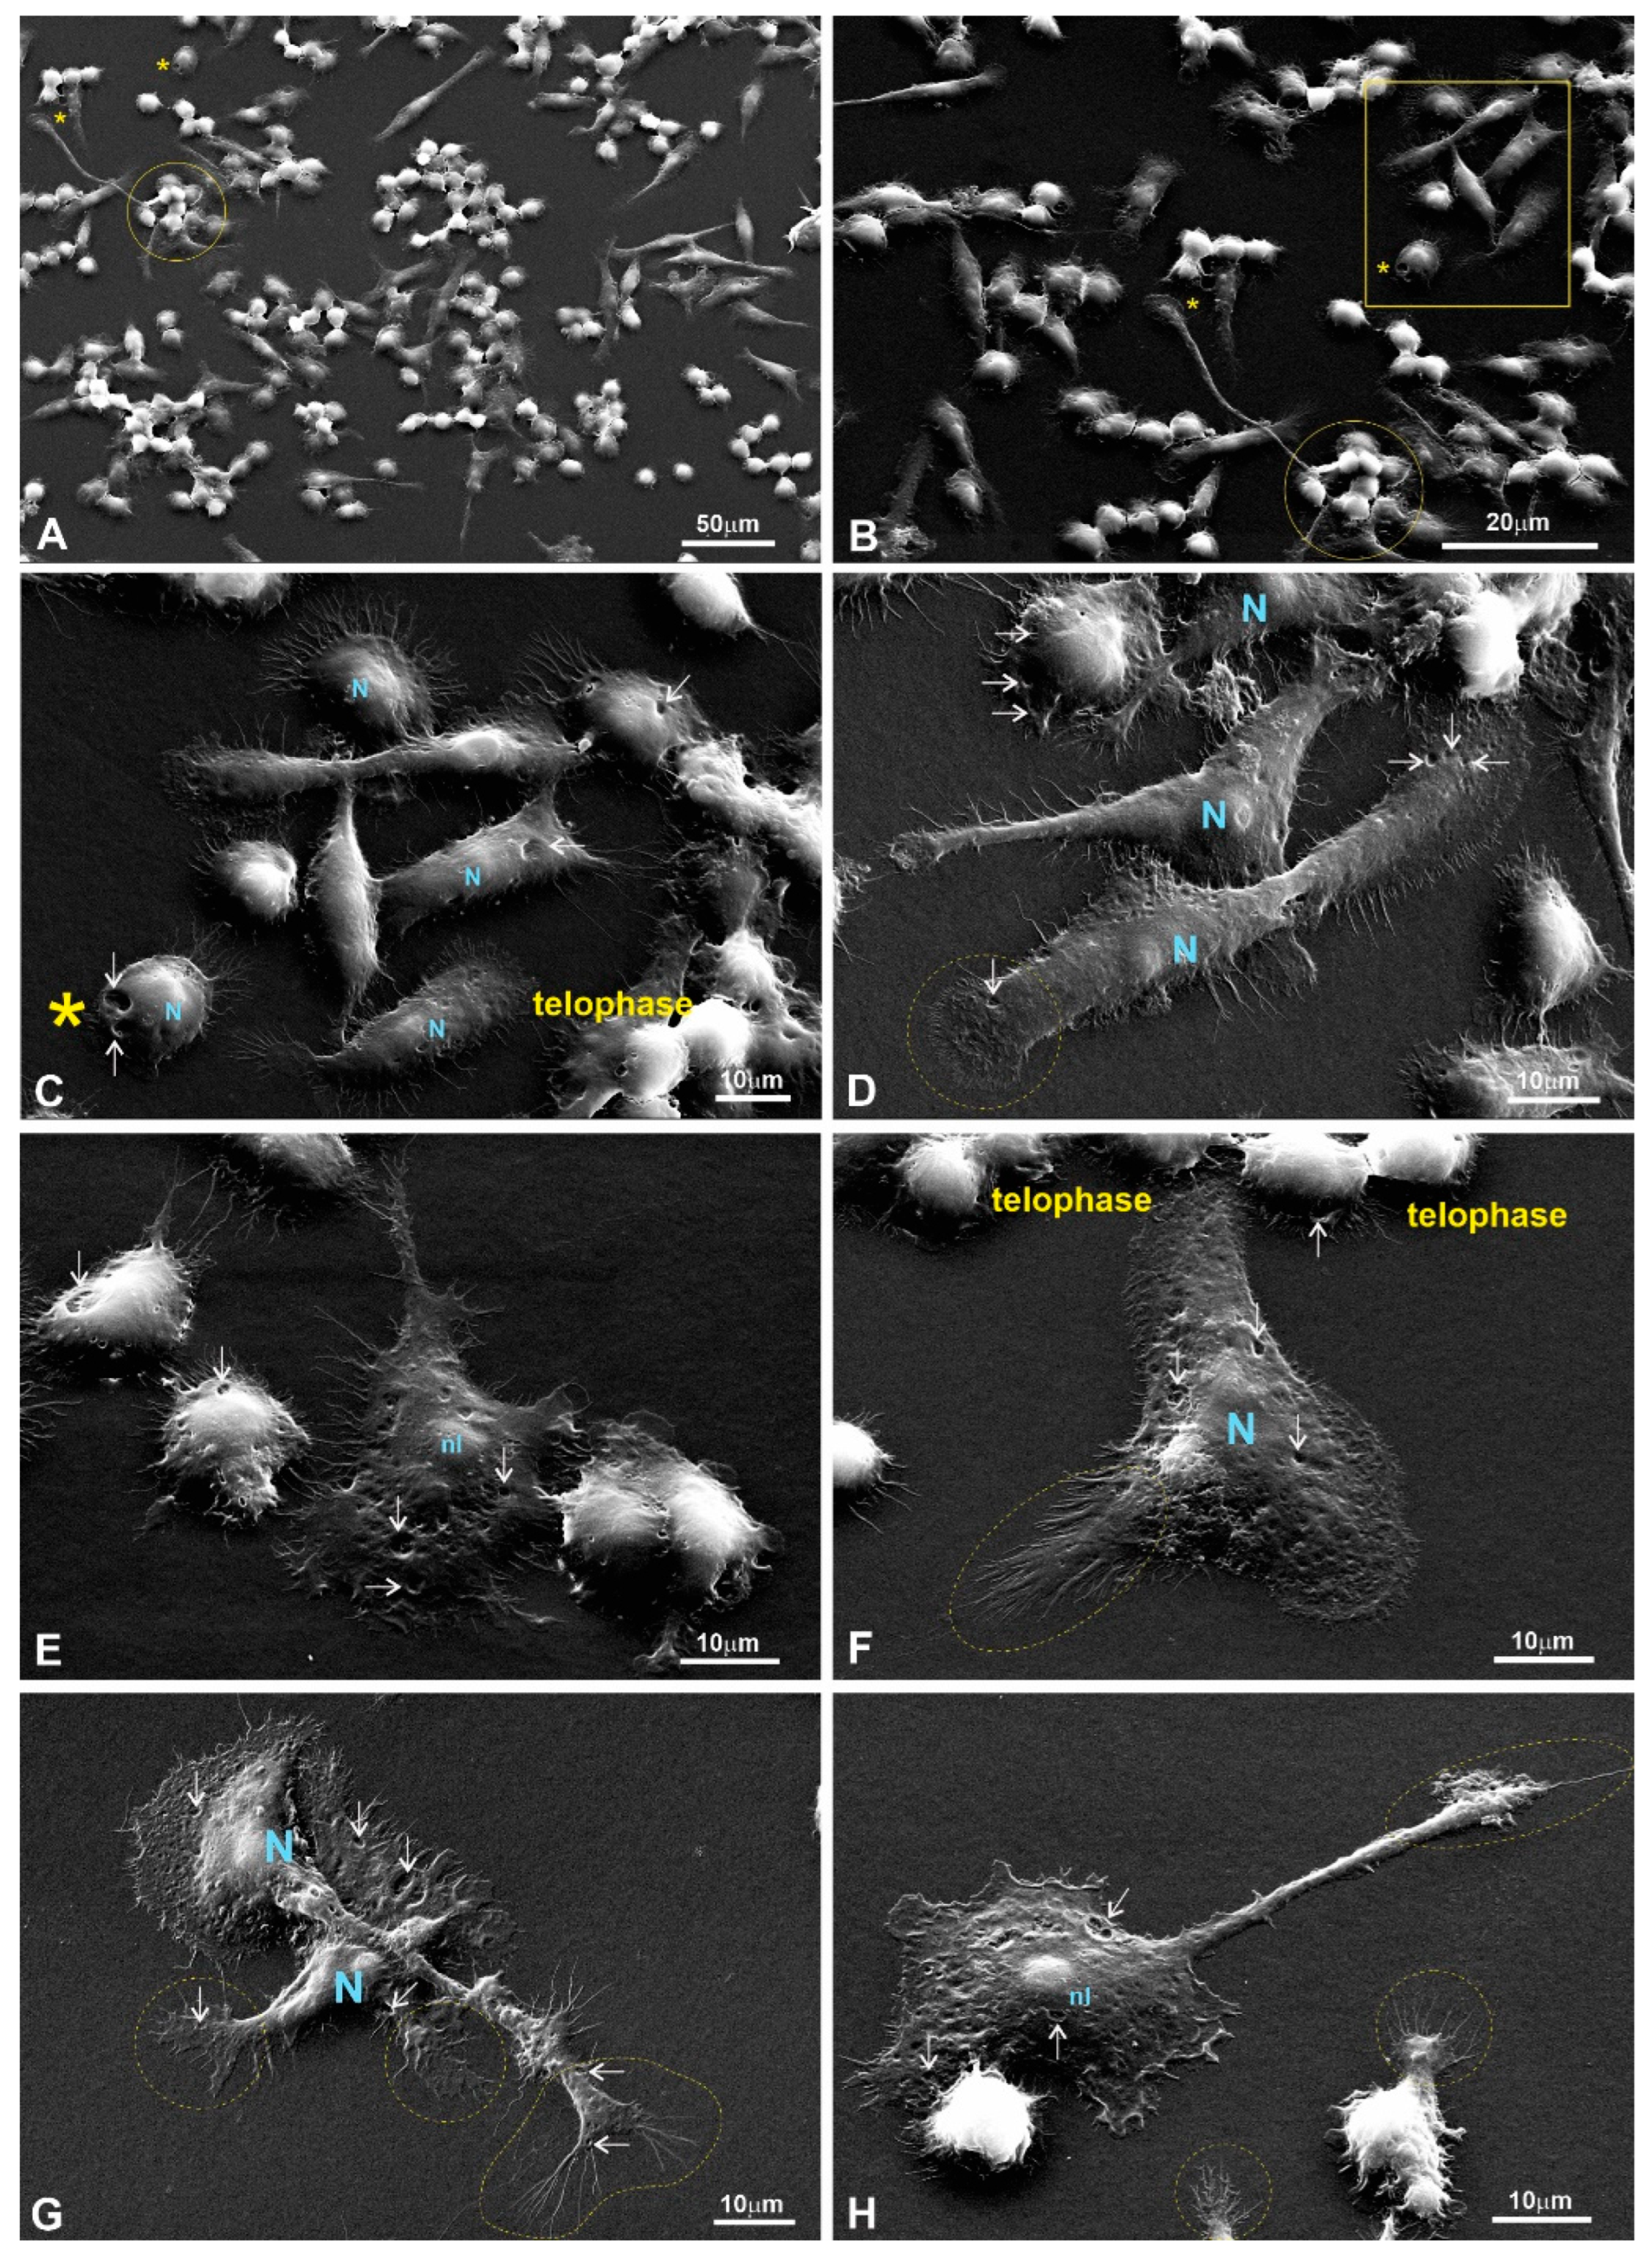
RAW264.7 macrophages growing on a 1L6 PP surface. (A,B) Low magnification; (C–F) medium magnification; (G,H) high magnification. Different subpopulations: bulged, flattened, and motile spindle-like elongated and motile macrophages were chaotically intermittent or gathered in groups of closely associated cells (outlined with solid circles in (A,B)). More or less flattened and motile cells produce numerous primary processes that can interconnect individual cells with grouped ones (marked with a star on (A) and a star outside of a rectangle in (B)). The macrophages in (C) correspond to the group outlined with the rectangle in (B). Corresponding bulged cells that reveal two depressions on their surfaces (arrows) are marked with stars (located inside the rectangle in (B)). All cells imaged at medium magnification abundantly produced secondary processes, and thus acquired a “hairy” cell appearance (C–F). Lamellipodia and end-feet that intensively produce secondary protrusions are outlined with dotted circles (D) and an ellipse (F). Bulged and flattened cells form numerous surface depressions (marked with arrows). (G,H) Two flattened, motile cells that actively produced typical leading edges with prominent end-feet primary processes (outlined with dotted circles and an ellipse), all abundantly spreading out with secondary protrusions. Moreover, visible on (G) are bulged cells that produced numerous secondary processes, growing from more flattened peripheral cytoplasm (outlined with a dotted circle). PP CSF—pseudo-protein cell-supporting film; C—cytoplasm; N—nucleus; nl—nucleolus.
Figure 12.
RAW264.7 macrophages growing on a 1L6 PP surface. (A,B) Low magnification; (C–F) medium magnification; (G,H) high magnification. Different subpopulations: bulged, flattened, and motile spindle-like elongated and motile macrophages were chaotically intermittent or gathered in groups of closely associated cells (outlined with solid circles in (A,B)). More or less flattened and motile cells produce numerous primary processes that can interconnect individual cells with grouped ones (marked with a star on (A) and a star outside of a rectangle in (B)). The macrophages in (C) correspond to the group outlined with the rectangle in (B). Corresponding bulged cells that reveal two depressions on their surfaces (arrows) are marked with stars (located inside the rectangle in (B)). All cells imaged at medium magnification abundantly produced secondary processes, and thus acquired a “hairy” cell appearance (C–F). Lamellipodia and end-feet that intensively produce secondary protrusions are outlined with dotted circles (D) and an ellipse (F). Bulged and flattened cells form numerous surface depressions (marked with arrows). (G,H) Two flattened, motile cells that actively produced typical leading edges with prominent end-feet primary processes (outlined with dotted circles and an ellipse), all abundantly spreading out with secondary protrusions. Moreover, visible on (G) are bulged cells that produced numerous secondary processes, growing from more flattened peripheral cytoplasm (outlined with a dotted circle). PP CSF—pseudo-protein cell-supporting film; C—cytoplasm; N—nucleus; nl—nucleolus.
![Polymers 15 03328 g012]()
Figure 13.
RAW264.7 macrophages growing on the 8L6 LPP film. (A) Low magnification; (B–F) medium magnification; (G,H) high magnification. Group of macrophages in (B) correspond to those shown in the rectangle in (A). Identical cells are marked with stars. Arrows in (C–F) indicate long primary processes, while end-feet in (D) are outlined with dotted circles. In turn, lamellipodia, leading edges, primary processes, as well as end-feet produce numerous secondary protrusions. Note the star-like cells located separately (F) that also produce numerous processes, running from radially emanating primary processes or directly from the peripheral cytoplasm. At a high level of magnification (G,H), numerous intensively branching secondary processes growing from extremely stretched lamellipodia become especially well pronounced. It is clearly visible that the surfaces of macrophages form numerous depressions of drastically different diameters (marked with arrowheads) that correspond to active endocytosis or phagocytosis. PP CSF—pseudo-protein cell-supporting film; C—cytoplasm; N—nucleus; nl—nucleolus.
![Polymers 15 03328 g013]()
Figure 14.
RAW264.7 macrophages growing on a copolymer surface; images taken at low (A,B), medium (C–F), and high (G,H) magnifications. The group of macrophages in (C) corresponds to cells shown in the rectangle in (A), while macrophages within the rectangle in (B) were imaged at a high magnification in (G). In all images, arrows indicate long primary processes that intensively produce secondary processes, while lamellipodia, leading edges, and end-feet are outlined with dotted circles (C–E,G,H). The macrophage marked with a star in (F) reveals a clearly motile cell morphology. Meanwhile, a flattened, large macrophage with typical end-feet formed by both poles (G), as well as the macrophage marked with a star as a well-stretched cell (H), exhibit pronounced nuclear and bulged nucleolar territories. PP CSF—pseudo-protein cell-supporting film; C—cytoplasm; N—nucleus; nl—nucleolus.
Figure 15.
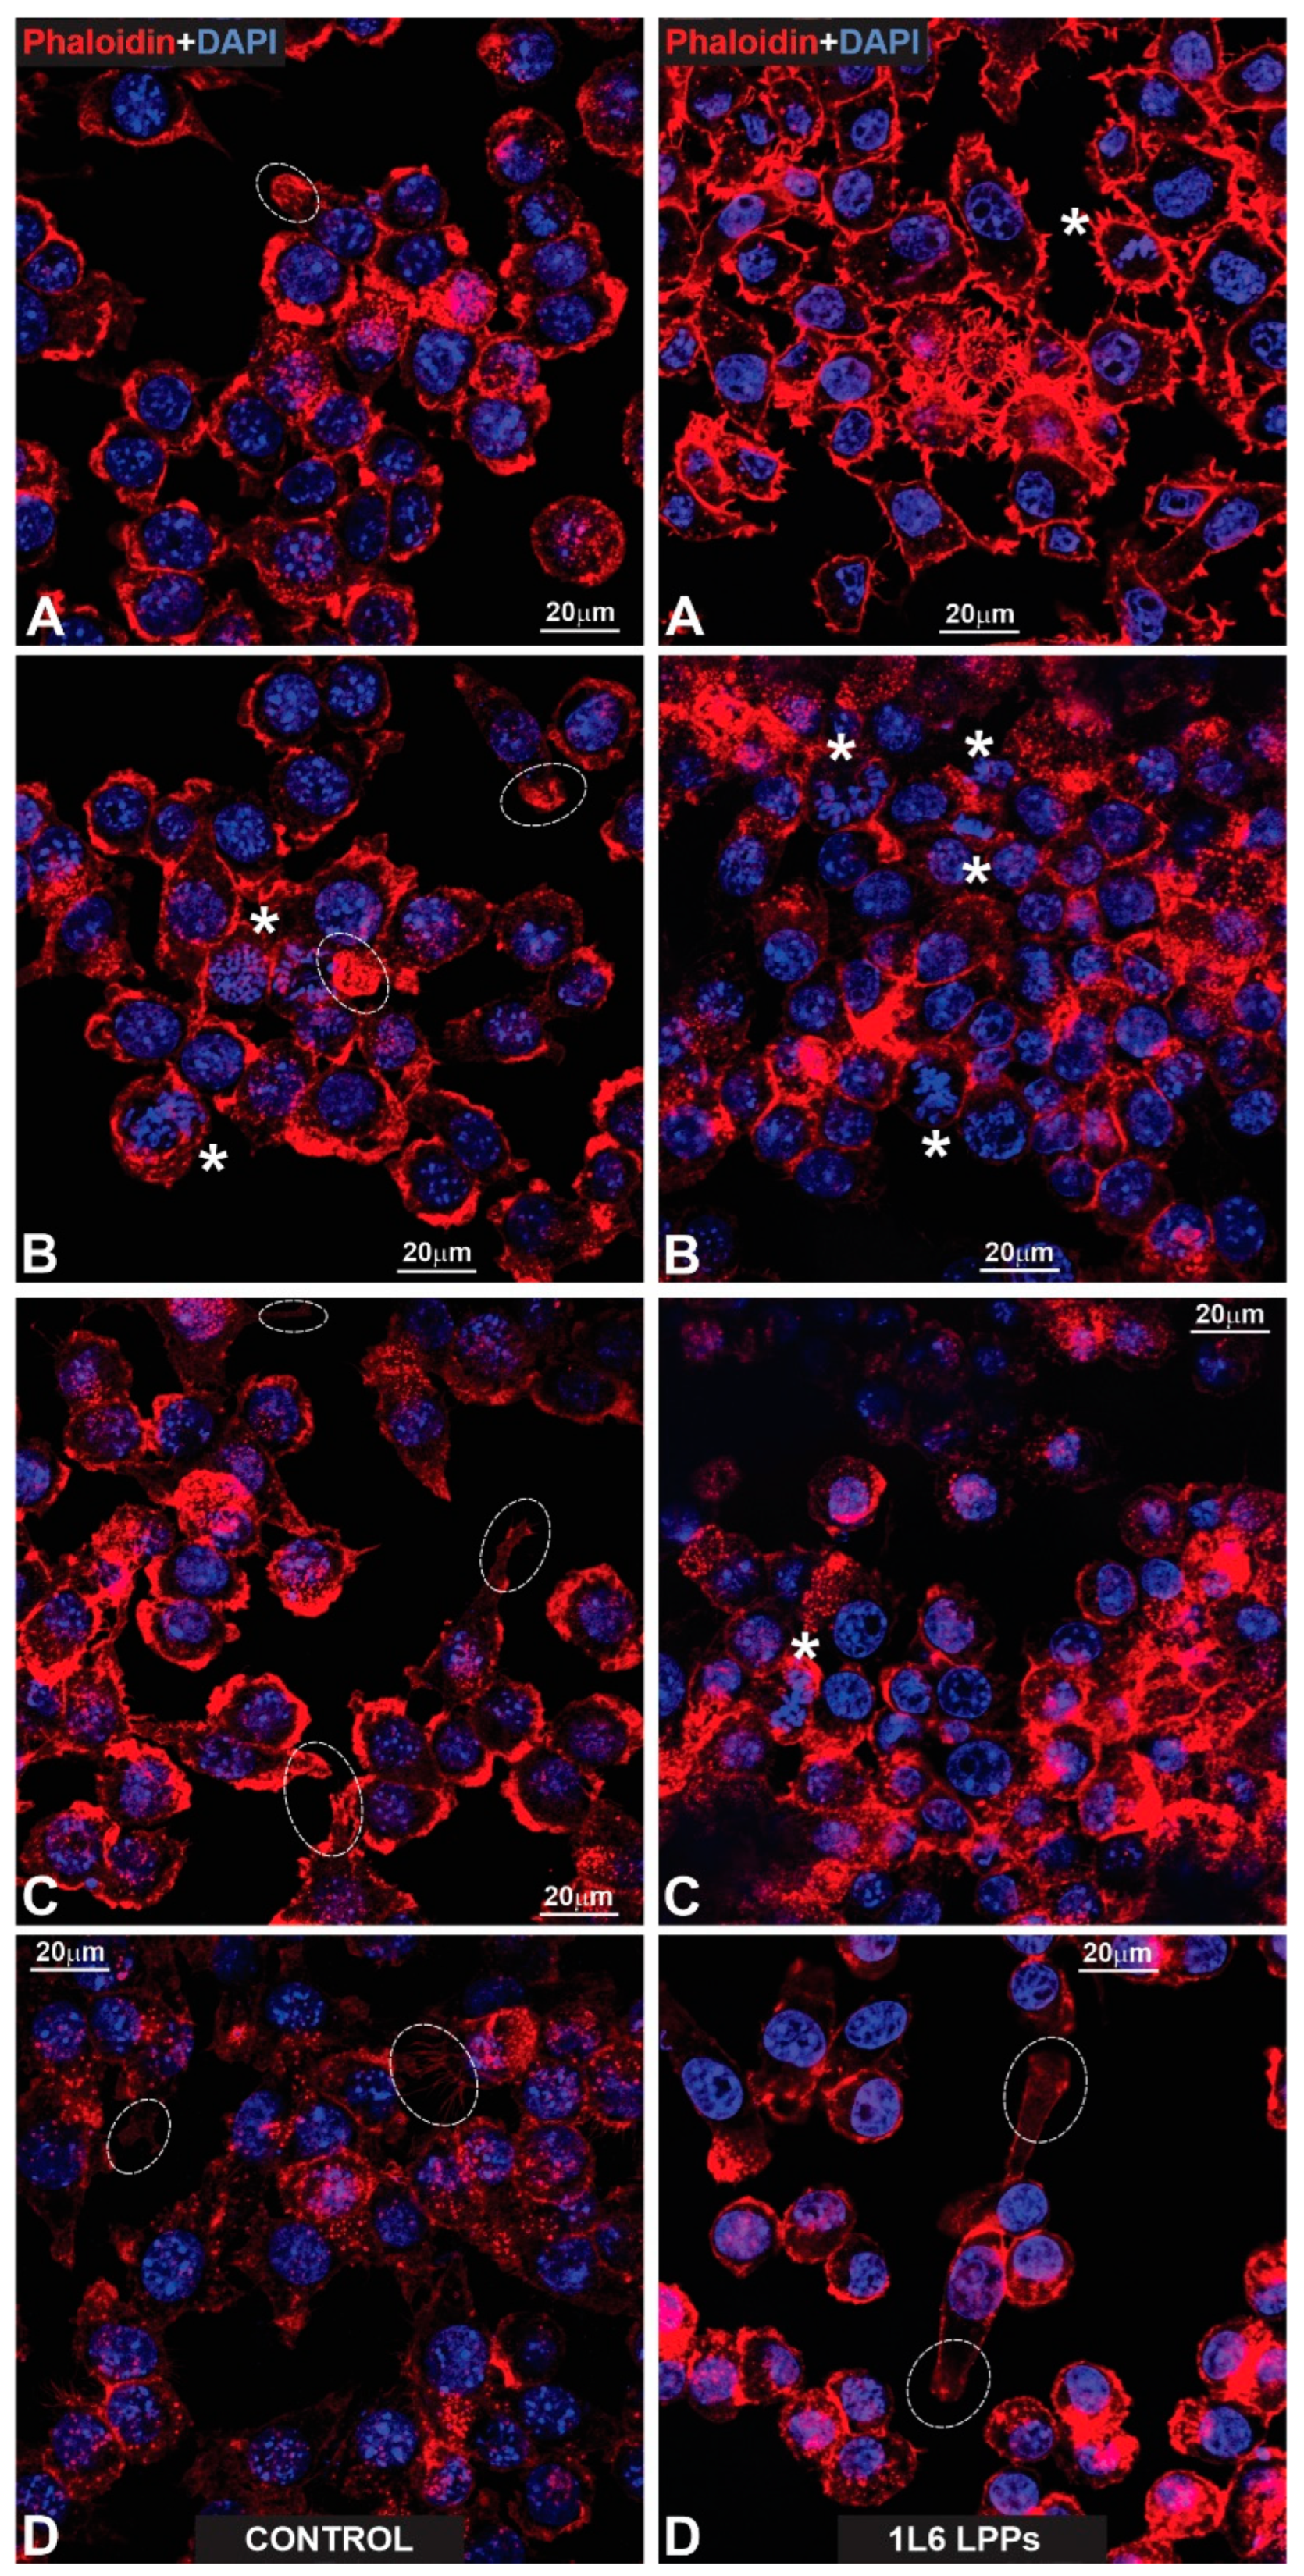
(Left: (A–D)) Gallery of fluorescent control images presenting fibroblasts growing on a glass surface that were specifically labeled for actin microfilaments using phalloidin (red). The nuclear label (blue) was obtained via DAPI counterstaining. All cells reveal a properly stretched appearance, exhibiting strongly developed stress fibers (SF; A–D). Note the prominent organization order of the stretched fibers in which their bundles form nearly parallel rows. Stars (B,C) indicate motile and properly stretched cells, both producing large lamellipodia. End-feet are outlined with dotted circles (A,C). The arrows in (C,D) indicate long primary processes with growing secondary processes. (Right: (A–D)) Fluorescent images presenting pMSFs that grow on the surface of 1L6 LPP. The same labeling as in the case of fibroblasts growing on a glass surface is used. All cells were properly stretched (A–D) and contained profound stress fibers (SF). The star in (B) marks a properly stretched cell that exhibits large lamellipodia. The end-feet are outlined with dotted circles (A,C). Long primary processes that produce secondary sprouts are marked with arrows (B). Note that in (C,D), very long and abundant primary processes emanating from different cells acquire complex network-like appearances by crossing each other and running on the surfaces of cells.
Figure 15.
(Left: (A–D)) Gallery of fluorescent control images presenting fibroblasts growing on a glass surface that were specifically labeled for actin microfilaments using phalloidin (red). The nuclear label (blue) was obtained via DAPI counterstaining. All cells reveal a properly stretched appearance, exhibiting strongly developed stress fibers (SF; A–D). Note the prominent organization order of the stretched fibers in which their bundles form nearly parallel rows. Stars (B,C) indicate motile and properly stretched cells, both producing large lamellipodia. End-feet are outlined with dotted circles (A,C). The arrows in (C,D) indicate long primary processes with growing secondary processes. (Right: (A–D)) Fluorescent images presenting pMSFs that grow on the surface of 1L6 LPP. The same labeling as in the case of fibroblasts growing on a glass surface is used. All cells were properly stretched (A–D) and contained profound stress fibers (SF). The star in (B) marks a properly stretched cell that exhibits large lamellipodia. The end-feet are outlined with dotted circles (A,C). Long primary processes that produce secondary sprouts are marked with arrows (B). Note that in (C,D), very long and abundant primary processes emanating from different cells acquire complex network-like appearances by crossing each other and running on the surfaces of cells.
![Polymers 15 03328 g015]()
Figure 16.
(Left: (A–D)) Fluorescent images of fibroblasts growing on the surface of an 8L6 PP and labeled according to the techniques shown in previous figures. Note the same stretching degree of all cells as was registered in the cases of the glass and 1L6 PP substrates. Moreover, the stress fibers (SF) reveal the same order, being organized in nearly parallel rows. (Right: (A–D)) Fibroblasts growing on a copolymer PP surface. All cells exhibit the same specific features as in previous images. The stars in (A,C) indicate fibroblasts that produce large lamellipodia. Long primary processes in (A,B) have been indicated with arrows, while the end-feet are outlined with dotted circles. Note that extremely stretched (“giant”) fibroblasts reveal especially profound parallel rows of stress fibers (SF).
Figure 17.
(Left: (A–D)) Fluorescent images presented a glass surface upon which macrophages that have been labeled for actin with phalloidin (red) and for nuclear chromatin with DAPI (blue) are growing. Note that due to the abundance of radially growing primary processes, all cells reveal a peculiar “hairy” appearance. The stars in (C) indicate mitotic macrophages, while their end-feet are outlined with dotted circles (A–D). Note two end-feet on the opposite poles of a spindle-like, strongly elongated macrophage (D). (Right: (A–D)) Macrophages that have been fluorescently labeled for actin (red) and nuclear chromatin (blue), according to previously applied techniques. All cells reveal a similar peculiar (“hairy”) appearance as in the control images. The stars in (A,D) indicate mitotic cells. Note the prophase macrophage that is marked with a star in (D).
Figure 18.
(Left: (A–D)) Fluorescent images of macrophages growing on the surface of an 8L6 PP. The macrophages are labeled according to the techniques shown in previous figures. Note that due to abundant primary processes, all macrophages acquired the same “hairy” appearance. The stars in images (A,B,D) indicate mitotic cells, while the lamellipodia in (C) are outlined with dotted circles. (Right: (A–D)) Macrophages growing on a copolymer PP surface. All cells exhibit the same peculiar “hairy” features as all previous macrophages. The arrows indicate long primary processes with growing secondary processes. The stars in (A,C) indicate mitotic cells (A–D) and a “giant” macrophage that comprises two nuclei (A).
Figure 19.
F-Actin distribution in pMSFs. (A) The number of cells with prevalent and diffuse distributions of F-actin vs. the number of cells with F-actin forming easily distinguishable stress fibers (the results from three independent experiments are summarized). (B) A representative confocal fluorescence micrograph of pMSFs stained with DAPI (blue) and Phalloidin-iFluor (red). SF—stress fibers; D—diffuse distribution of F-actin.
Table 1.
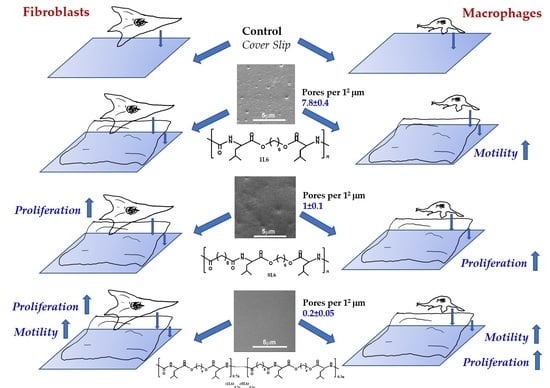
The LPP films’ surface porosity values, measured at a sub-micro level. SEM images were analyzed using ImageJ software. The number of pores per 12 μm and average pore size were calculated.
Table 1.
The LPP films’ surface porosity values, measured at a sub-micro level. SEM images were analyzed using ImageJ software. The number of pores per 12 μm and average pore size were calculated.
| | Number of Pores per 12 μm | Pore Size (in μm) |
|---|
| 1L6 | 7.8 ± 0.4 | 0.256 ± 0.018 |
| 8L6 | 1 ± 0.1 | 0.337 ± 0.013 |
| Copolymer | 0.2 ± 0.05 | 0.181 ± 0.021 |


 ,
, 


