
Advanced Ultrasonic Inspection of Thick-Section Composite Structures for In-Field Asset Maintenance


Abstract
:1. Introduction
2. Materials and Methods
2.1. Materials
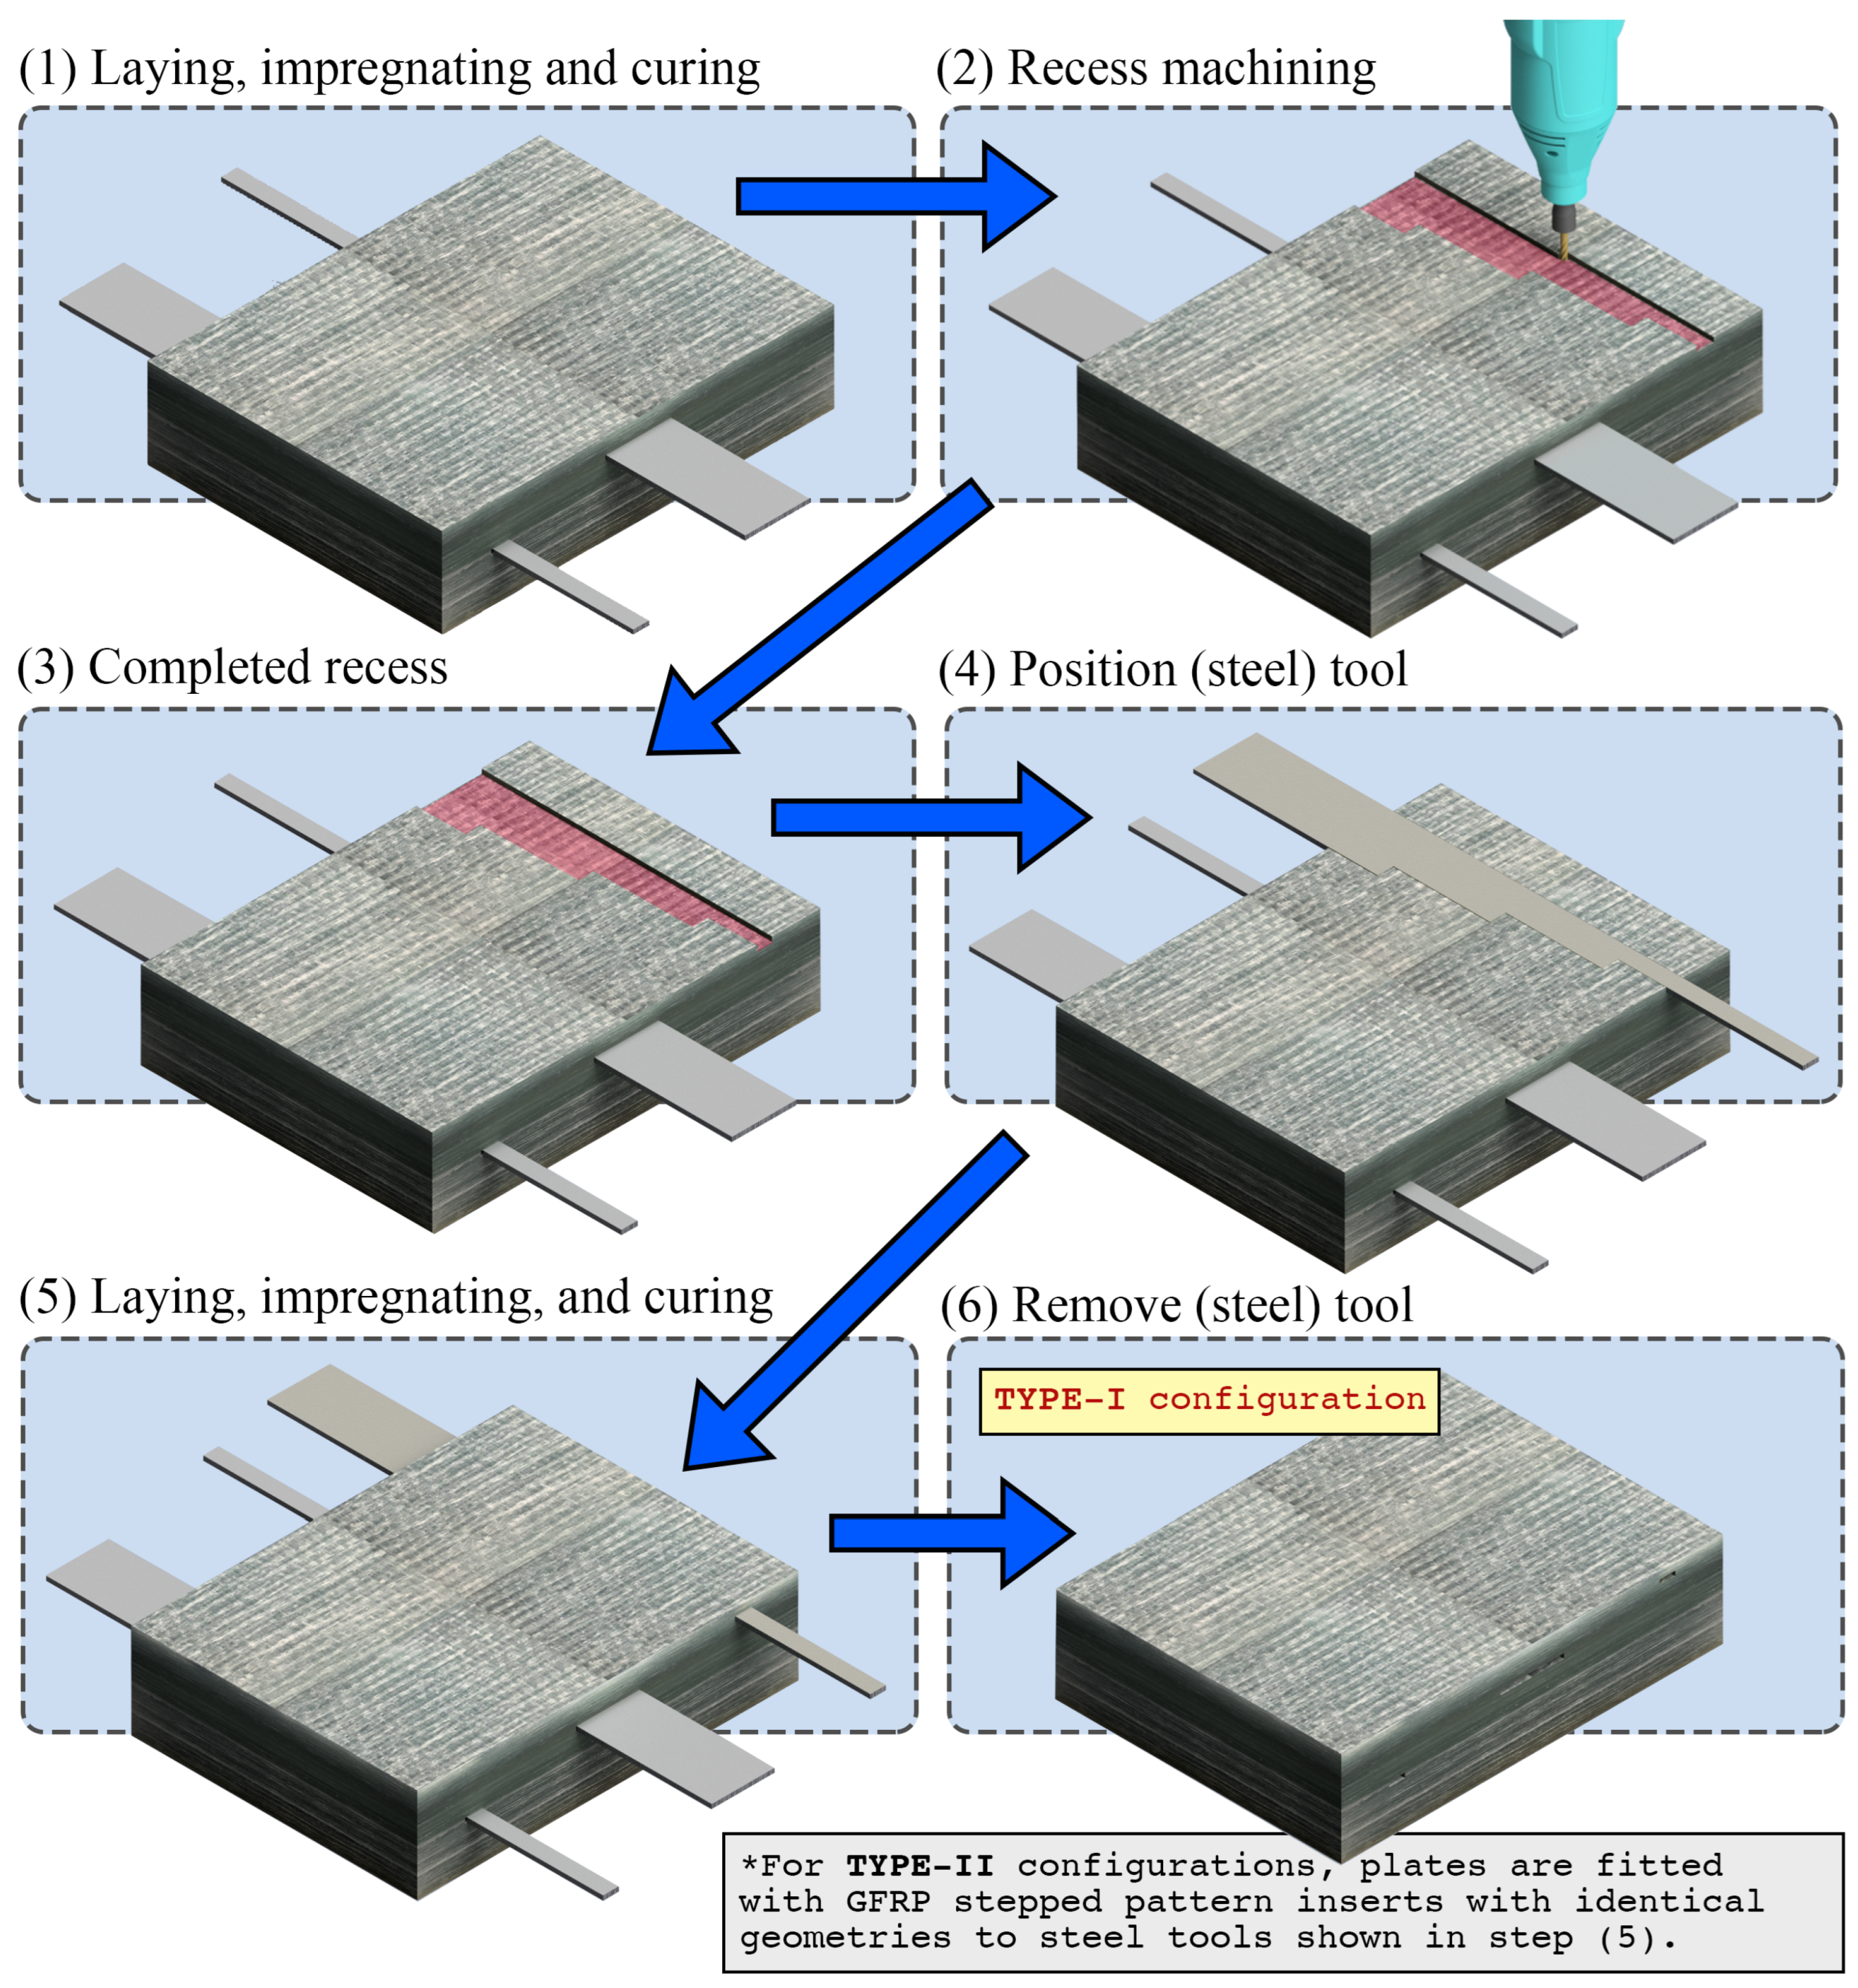
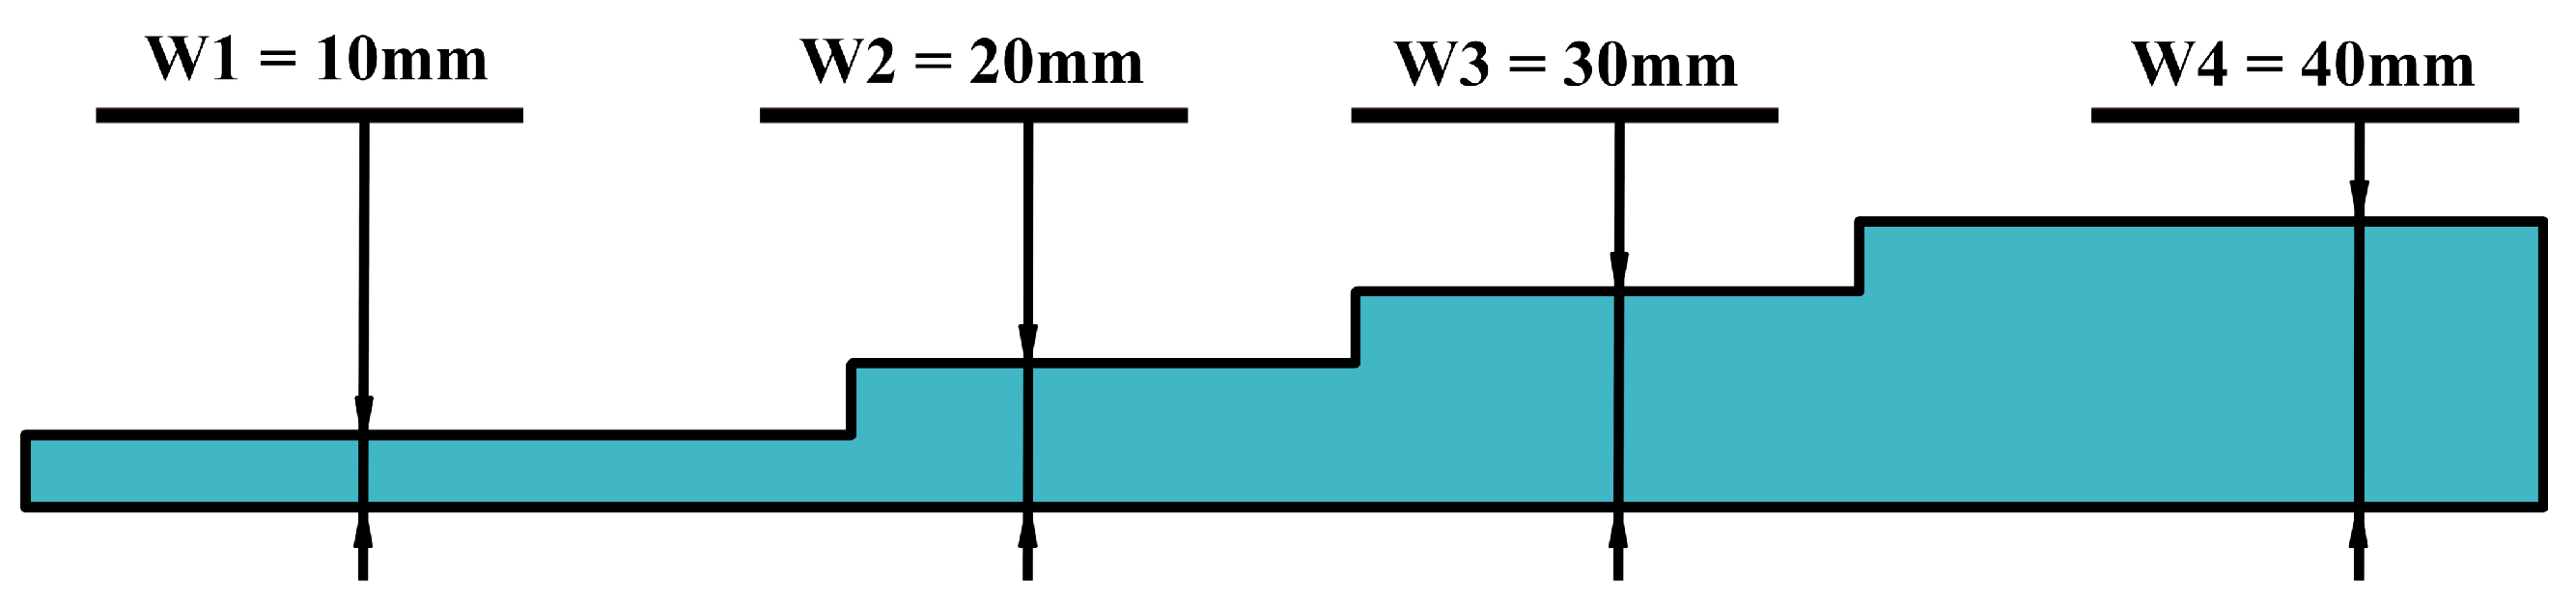
2.2. Manufacturing
2.3. Testing
2.3.1. Equipment Description
2.3.2. Data Acquisition
2.3.3. Post-Processing
3. Results and Discussion
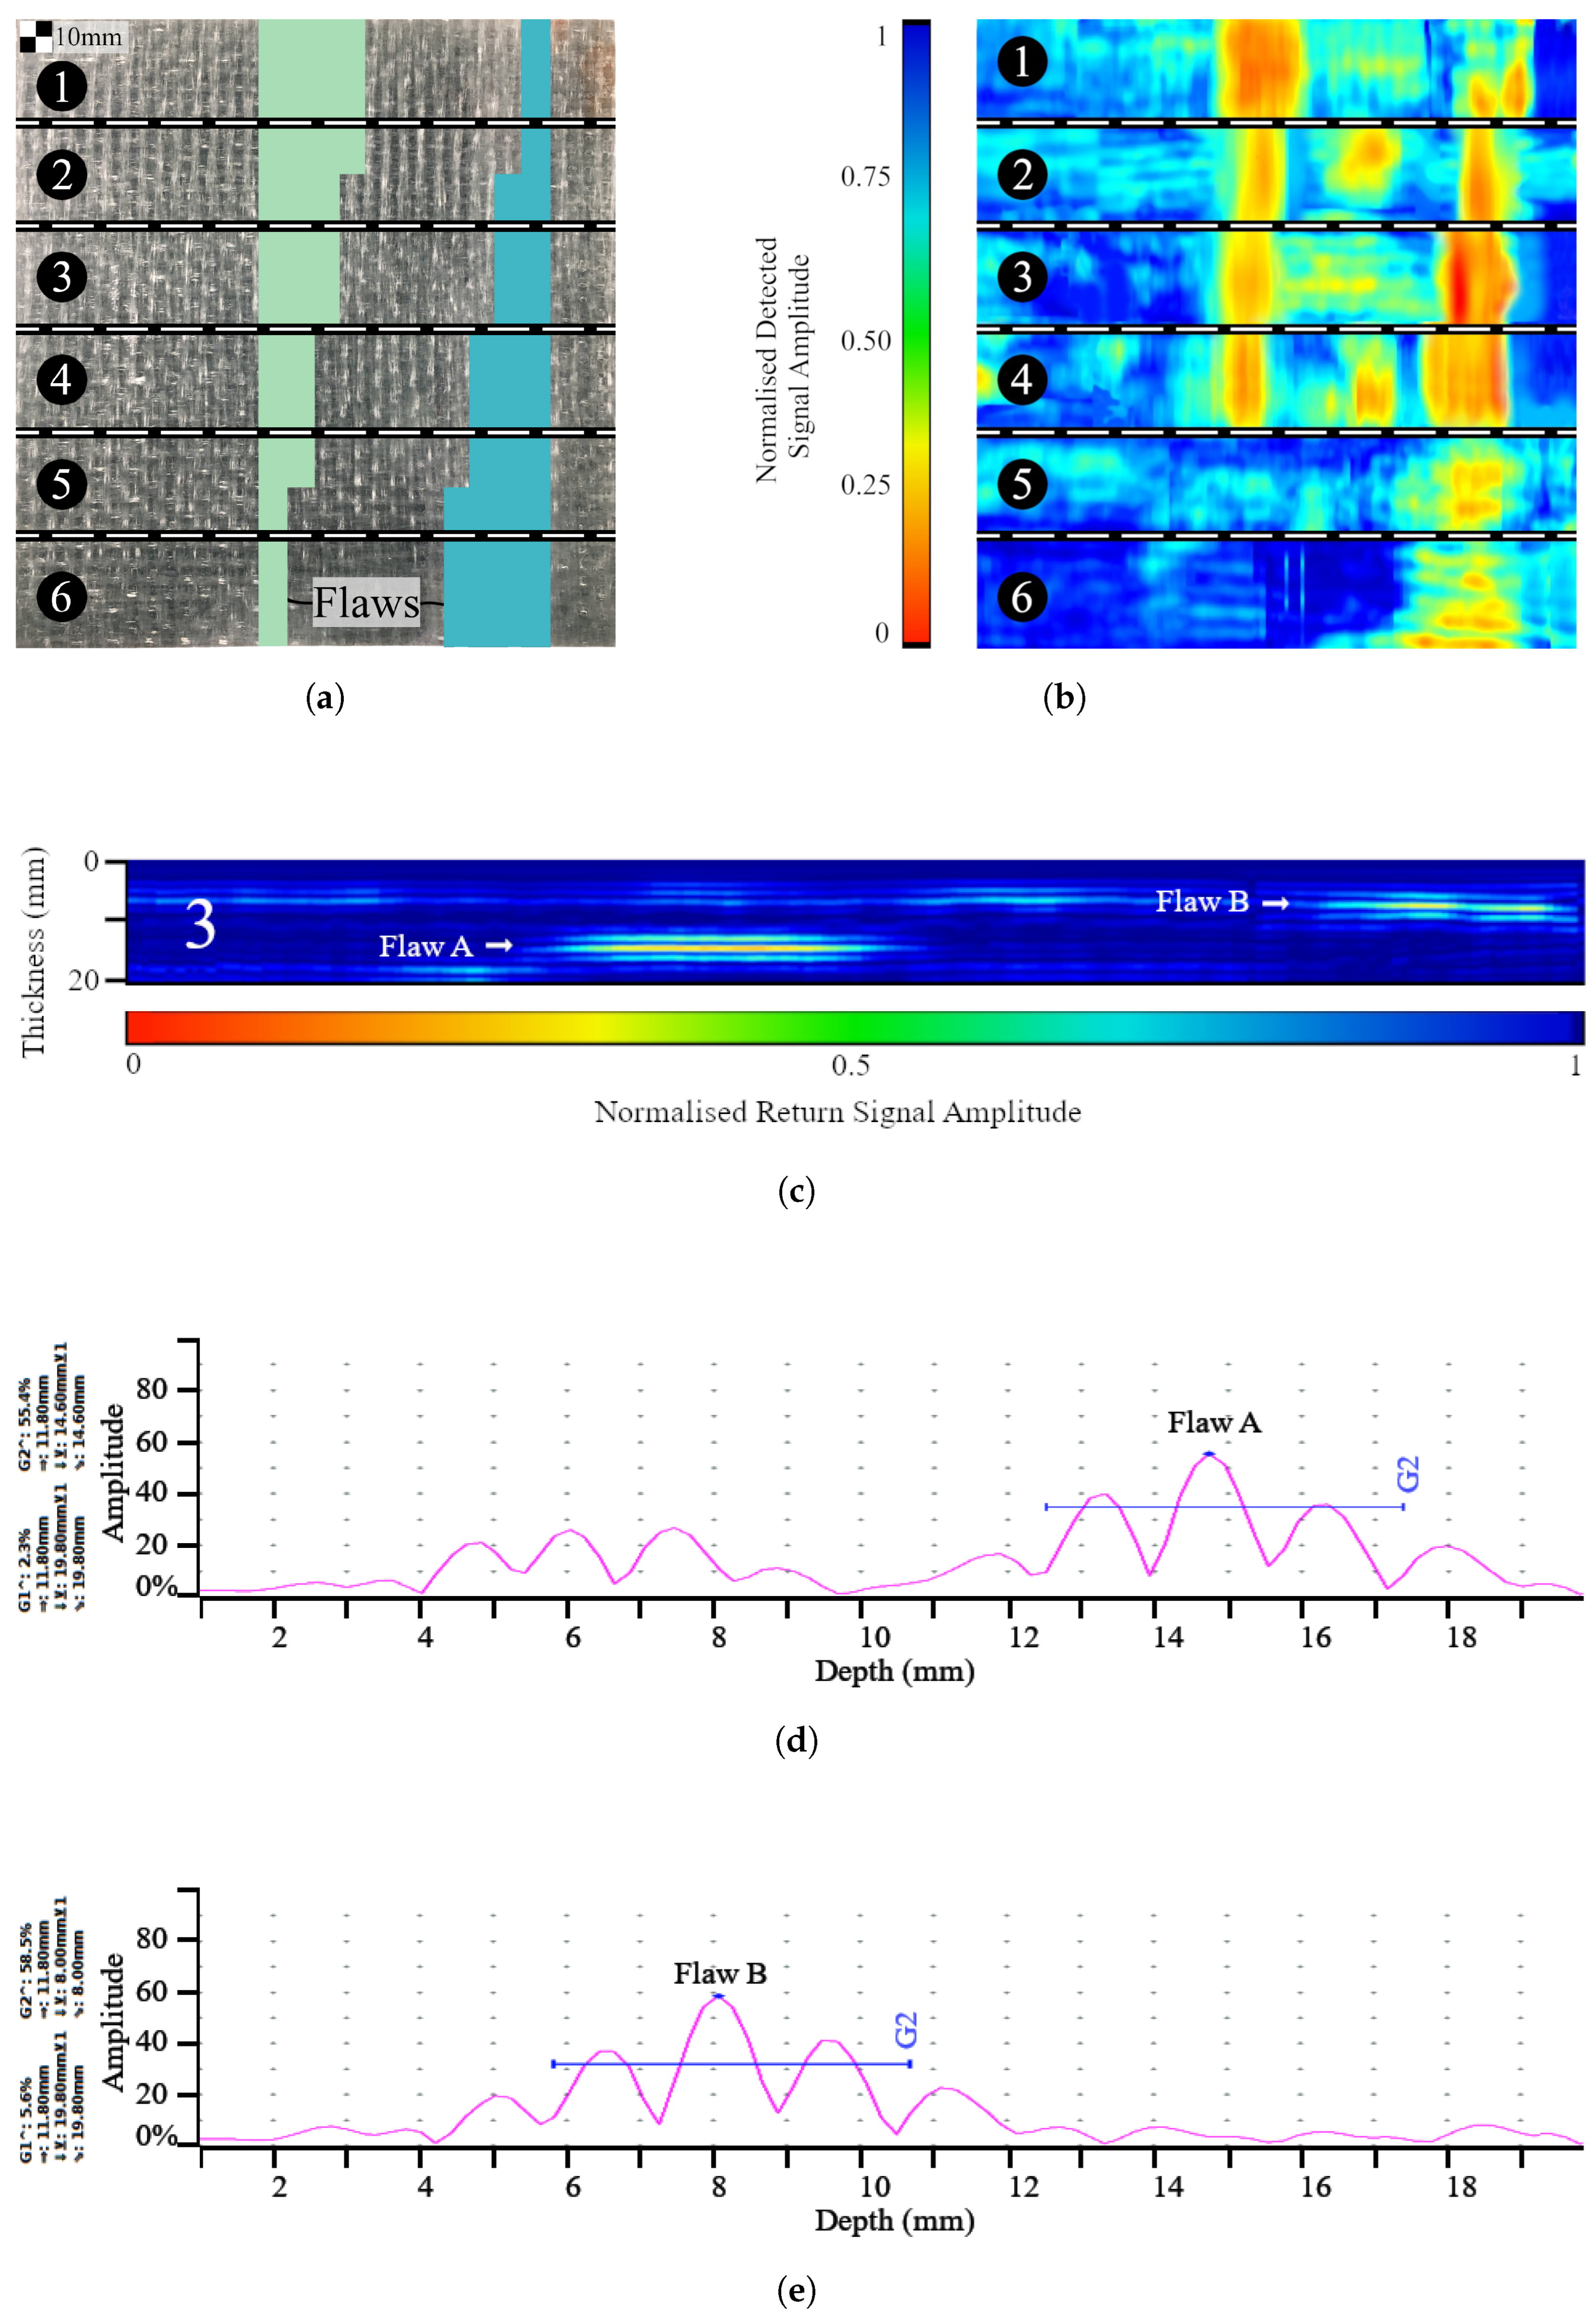
3.1. Representative Scans
3.2. Plate Thickness
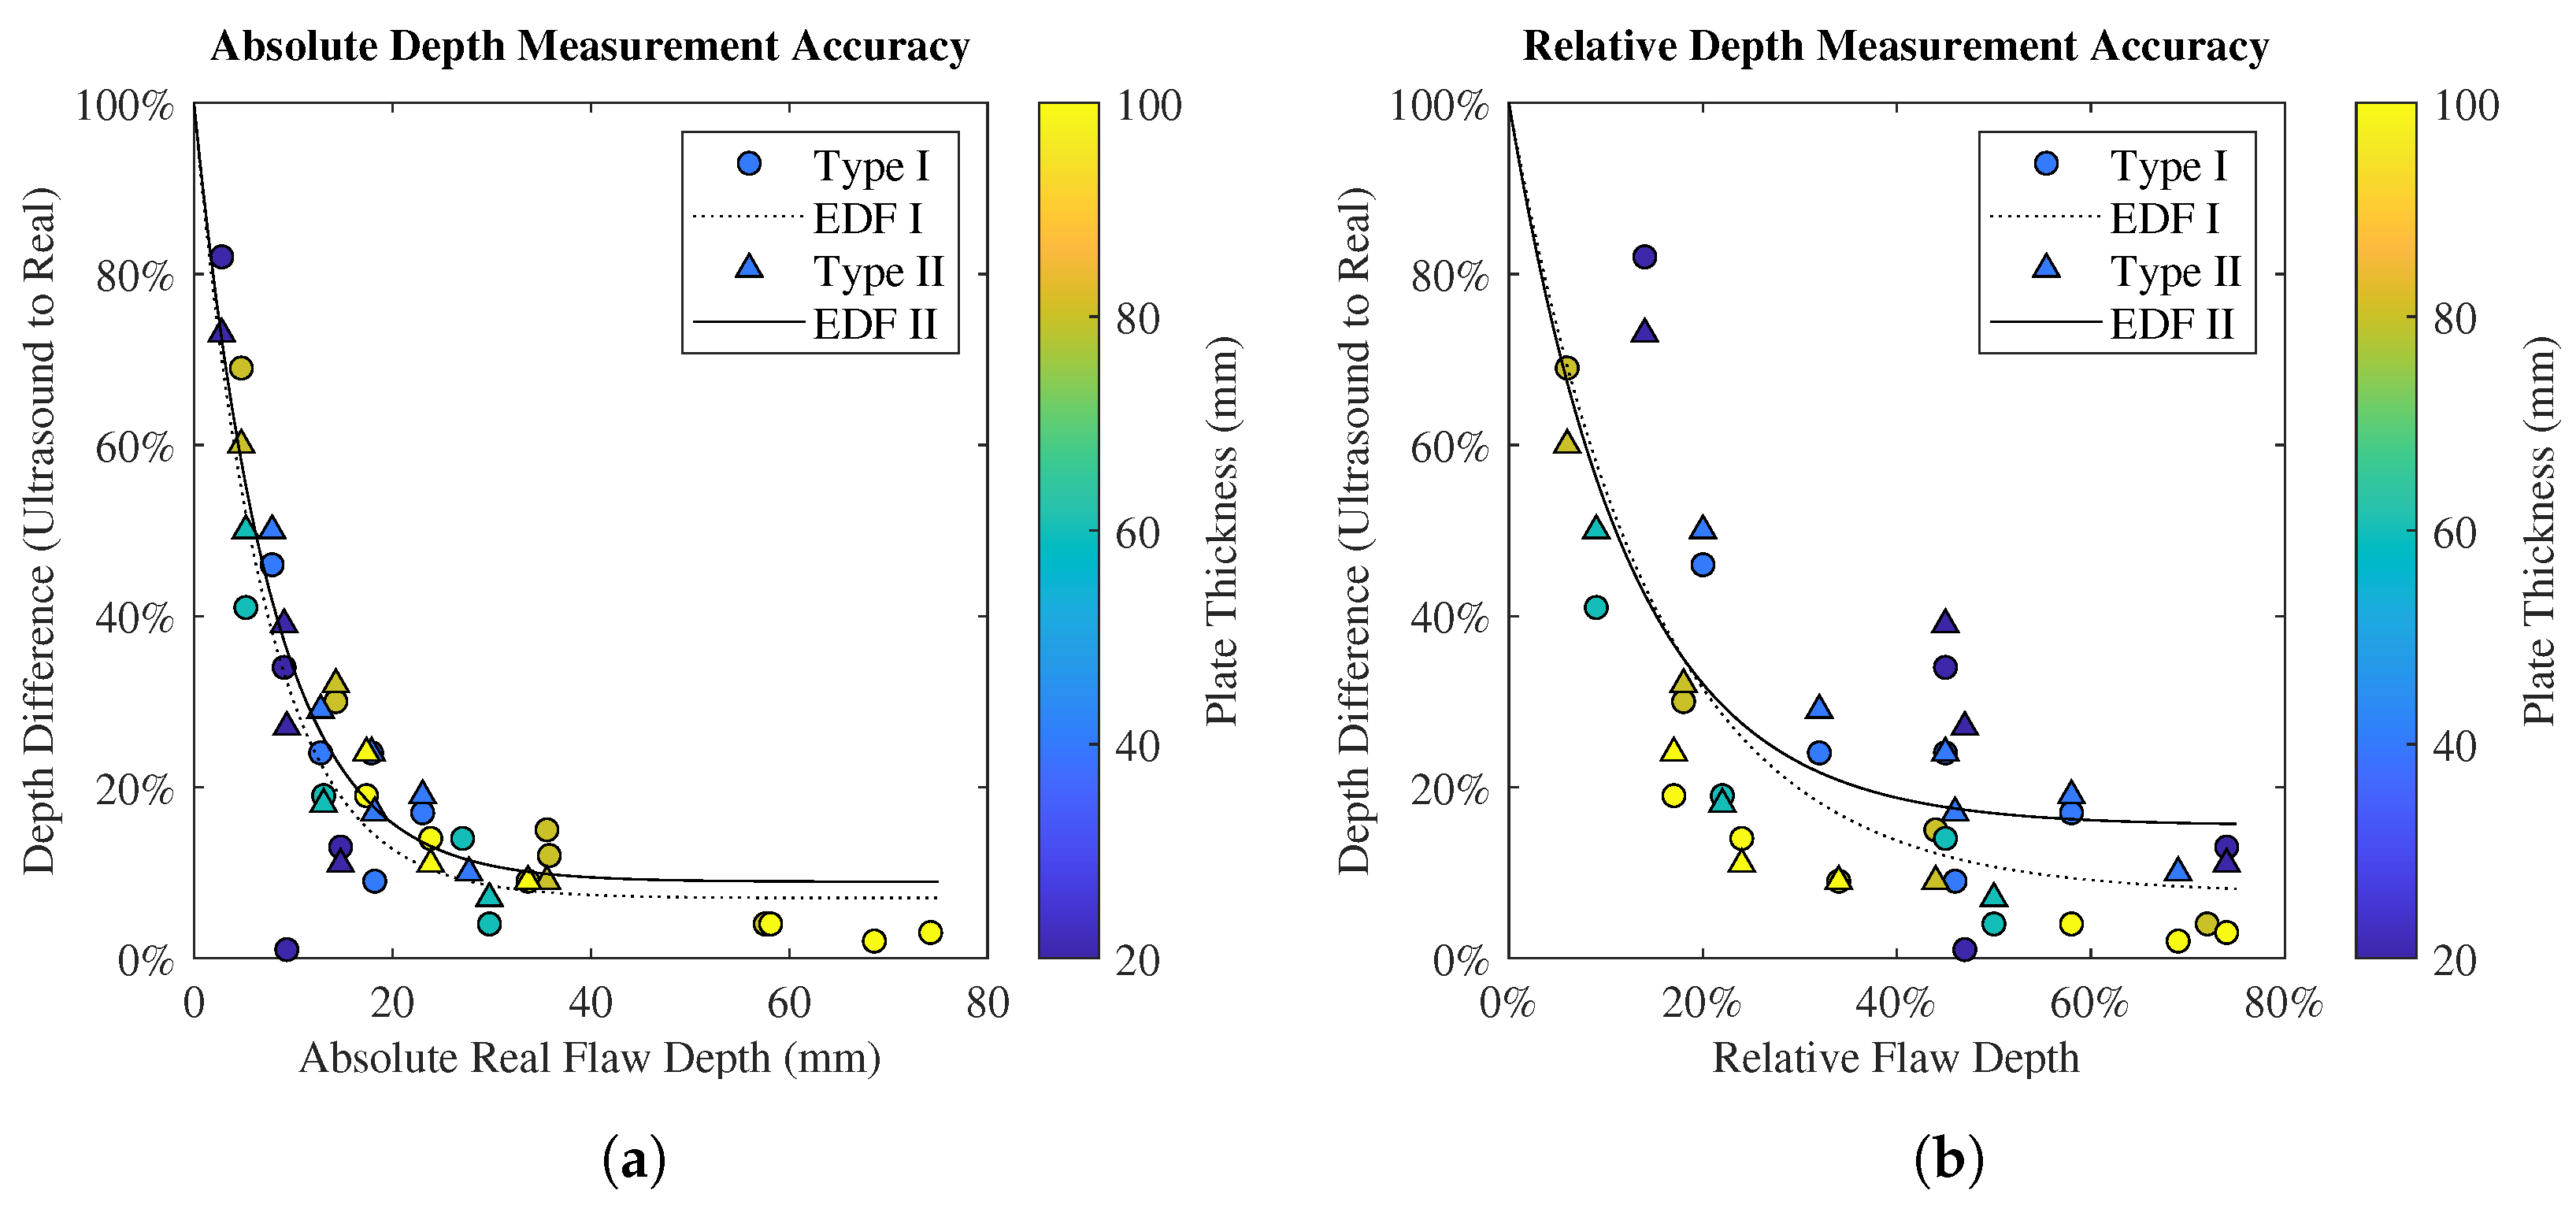
3.3. Flaw Depth
3.4. In-Plane Flaw Dimensioning
4. Conclusions
Author Contributions
Funding
Institutional Review Board Statement
Informed Consent Statement
Data Availability Statement
Acknowledgments
Conflicts of Interest
Abbreviations
| NDT | non-destructive testing |
| RNLI | Royal National Lifeboat Institution |
| UT | ultrasonic testing |
| FRP | fibre-reinforced polymer |
| PAUT | phased array ultrasonic testing |
| TOFD | time-of-flight diffraction |
| AUT | automated ultrasonic testing |
| PTFE | polytetrafluoroethylene |
| ASTM | ASTM International |
| FMC | full matrix capture |
| TFM | total focussing method |
| CSM | chopped strand mat |
| EDF | exponential decay function |
References
- Phillips, H. The RNLI’s Experiences and Current Application of Marine Composites NDT. In Marine Composites Inspection Workshop: Sea What You Are Missing, Poole, UK, 13–14 October 2021; The British Institute of Non-Destructive Testing: Poole, UK, 2021. [Google Scholar]
- Phillips, H. NDE of Composite Marine Structures. In New Approaches for Performance Definition of Composite Materials and Structures; British Society of Strain Measurement: London, UK, 2010. [Google Scholar]
- Whalley, G.; Queen, N.; Hook, A. Babcock Devenport NDT Composite Overview. In Marine Composites Inspection Workshop: Sea What You Are Missing, Poole, UK, 13–14 October 2021; The British Institute of Non-Destructive Testing: Poole, UK, 2021. [Google Scholar]
- Whalley, G.; Hayday, L.; Hook, A. Inspection of naval composites. In Proceedings of the BINDT Workshop 2023: NDT of Composites through Life, Poole, UK, 22–23 March 2023; The British Institute of Non-Destructive Testing: Poole, UK, 2023. [Google Scholar]
- Taheri, H.; Hassen, A.A. Nondestructive Ultrasonic Inspection of Composite Materials: A Comparative Advantage of Phased Array Ultrasonic. Appl. Sci. 2019, 9, 1628. [Google Scholar] [CrossRef]
- Wang, B.; Zhong, S.; Lee, T.L.; Fancey, K.S.; Mi, J. Non-destructive testing and evaluation of composite materials/structures: A state-of-the-art review. Adv. Mech. Eng. 2014, 12, 1–28. [Google Scholar] [CrossRef]
- Li, D.; Zhou, J.; Ou, J. Damage, nondestructive evaluation and rehabilitation of FRP composite-RC structure: A review. Constr. Build. Mater. 2021, 271, 121551. [Google Scholar] [CrossRef]
- Qiu, Q. Effect of internal defects on the thermal conductivity of fiber-reinforced polymer (FRP): A numerical study based on micro-CT based computational modeling. Mater. Today Commun. 2023, 36, 106446. [Google Scholar] [CrossRef]
- Duernberger, E.; MacLeod, C.; Lines, D.; Loukas, C.; Vasilev, M. Adaptive optimisation of multi-aperture ultrasonic phased array imaging for increased inspection speeds of wind turbine blade composite panels. NDT E Int. 2022, 132, 102725. [Google Scholar] [CrossRef]
- Uhry, C.; Guillet, F.; Duvauchelle, P.; Kaftandjian, V. Optimisation of the process of X-ray tomography applied to the detection of defects in composites materials. In Digital Industrial Radiology and Computed Tomography; Ghent University: Ghent, Belgium, 2015. [Google Scholar]
- Thomas, J.A. HMS Wilton—A glass-reinforced plastics minehunter. Composites 1972, 3, 79–82. [Google Scholar] [CrossRef]
- Hall, D.J.; Robson, B.L. A review of the design and materials evaluation programme for the GRP/foam sandwich composite hull of the RAN minehunter. Composites 1984, 15, 266–276. [Google Scholar] [CrossRef]
- Tran, P.; Wu, C.; Saleh, M.; Bortolan Neto, L.; Nguyen-Xuan, H.; Ferreira, A.J. Composite structures subjected to underwater explosive loadings: A comprehensive review. Compos. Struct. 2021, 263, 113684. [Google Scholar] [CrossRef]
- Krautkrämer, J.; Krautkrämer, H. Physical Principles of the Ultrasonic Testing of Materials. In Ultrasonic Testing of Materials, 4th fully rev. ed.; Springer: Berlin/Heidelberg, Germany, 2013; pp. 4–159. [Google Scholar] [CrossRef]
- Automatic Crack Detection and Characterization During Ultrasonic Inspection. J. Nondestruct. Eval. 2010, 29, 169–174. [CrossRef]
- Belyaev, A.; Polupan, O.; Dallas, W.; Ostapenko, S.; Hess, D.; Wohlgemuth, J. Crack detection and analyses using resonance ultrasonic vibrations in full-size crystalline silicon wafers. Appl. Phys. Lett. 2006, 88, 111907. [Google Scholar] [CrossRef]
- Yao, Y.; Tung, S.T.E.; Glisic, B. Crack detection and characterization techniques—An overview. Struct. Control. Health Monit. 2014, 21, 1387–1413. [Google Scholar] [CrossRef]
- An, Y.K.; Kwon, Y.; Sohn, H. Noncontact laser ultrasonic crack detection for plates with additional structural complexities. Struct. Health Monit. 2013, 12, 522–538. [Google Scholar] [CrossRef]
- Bahonar, M.; Safizadeh, M.S. Investigation of real delamination detection in composite structure using air-coupled ultrasonic testing. Compos. Struct. 2022, 280, 114939. [Google Scholar] [CrossRef]
- Zhang, Z.; Guo, S.; Li, Q.; Cui, F.; Malcolm, A.A.; Su, Z.; Liu, M. Ultrasonic detection and characterization of delamination and rich resin in thick composites with waviness. Compos. Sci. Technol. 2020, 189, 108016. [Google Scholar] [CrossRef]
- Park, B.; An, Y.K.; Sohn, H. Visualization of hidden delamination and debonding in composites through noncontact laser ultrasonic scanning. Compos. Sci. Technol. 2014, 100, 10–18. [Google Scholar] [CrossRef]
- Gao, T.; Wang, Y.; Qing, X. A New Laser Ultrasonic Inspection Method for the Detection of Multiple Delamination Defects. Materials 2021, 14, 2424. [Google Scholar] [CrossRef]
- Ibrahim, M.E. Ultrasonic inspection of hybrid polymer matrix composites. Compos. Sci. Technol. 2021, 208, 108755. [Google Scholar] [CrossRef]
- Wu, S.J.; Chin, P.C.; Liu, H. Measurement of Elastic Properties of Brittle Materials by Ultrasonic and Indentation Methods. Appl. Sci. 2019, 9, 2067. [Google Scholar] [CrossRef]
- Smith, R.A.; Nelson, L.J.; Mienczakowski, M.J.; Wilcox, P.D. Ultrasonic tracking of ply drops in composite laminates. AIP Conf. Proc. 2016, 1706, 050006. [Google Scholar] [CrossRef]
- Yang, X.; Verboven, E.; Ju, B.F.; Kersemans, M. Comparative study of ultrasonic techniques for reconstructing the multilayer structure of composites. NDT E Int. 2021, 121, 102460. [Google Scholar] [CrossRef]
- Zhang, Z.; Li, Q.; Liu, M.; Yang, W.; Ang, Y. Through transmission ultrasonic inspection of fiber waviness for thickness-tapered composites using ultrasound non-reciprocity: Simulation and experiment. Ultrasonics 2022, 123, 106716. [Google Scholar] [CrossRef] [PubMed]
- Bastianini, F.; Di Tommaso, A.; Pascale, G. Ultrasonic non-destructive assessment of bonding defects in composite structural strengthenings. Compos. Struct. 2001, 53, 463–467. [Google Scholar] [CrossRef]
- Daniel, I.M.; Wooh, S.C. Ultrasonic Techniques for Characterization of Manufacturing Defects in Thick Composites. In Review of Progress in Quantitative Nondestructive Evaluation: Volume 8, Part A and B; Thompson, D.O., Chimenti, D.E., Eds.; Springer: Boston, MA, USA, 1989; pp. 1605–1612. [Google Scholar] [CrossRef]
- Kokurov, A.M.; Subbotin, D.E. Ultrasonic detection of manufacturing defects in multilayer composite structures. IOP Conf. Ser. Mater. Sci. Eng. 2021, 1023, 012013. [Google Scholar] [CrossRef]
- Cao, A.; Li, Q.; Yang, W.; Zhang, Z. Frequency shifting of transmitted ultrasound in thick composites containing fiber wrinkles and its application in non-destructive evaluation. Compos. Struct. 2023, 314, 116939. [Google Scholar] [CrossRef]
- Inês Silva, M.; Malitckii, E.; Santos, T.G.; Vilaça, P. Review of conventional and advanced non-destructive testing techniques for detection and characterization of small-scale defects. Prog. Mater. Sci. 2023, 138, 101155. [Google Scholar] [CrossRef]
- Opačić, M.; Sedmak, A.; Bakić, G.; Milošević, N.; Milovanovic, N. Application of advanced NDT methods to assess structural integrity of pressure vessel welded joints. PRocedia Struct. Integr. 2022, 42, 1185–1189. [Google Scholar] [CrossRef]
- Rodriguez, A.G.; Gosselin, A.; Rhéaume, R.; Harrap, N. Computational intelligence approaches for data analysis, the next step of innovation for advanced UT techniques in NDT. In Proceedings of the ECNDT 2018—12th European Conference on Non-Destructive Testing (ECNDT 2018), Gothenburg, Sweden, 11–15 June 2018; e-Journal of Nondestructive Testing (eJNDT): Gothenburg, Sweden, 2018. [Google Scholar]
- Yılmaz, B.; Jasiūnienė, E. Advanced ultrasonic NDT for weak bond detection in composite-adhesive bonded structures. Int. J. Adhes. Adhes. 2020, 102, 102675. [Google Scholar] [CrossRef]
- Segreto, T.; Bottillo, A.; Teti, R. Advanced Ultrasonic Non-destructive Evaluation for Metrological Analysis and Quality Assessment of Impact Damaged Non-crimp Fabric Composites. Procedia CIRP 2016, 41, 1055–1060. [Google Scholar] [CrossRef]
- Revel, G.M.; Pandarese, G.; Cavuto, A. Advanced ultrasonic non-destructive testing for damage detection on thick and curved composite elements for constructions. J. Sandw. Struct. Mater. 2013, 15, 5–24. [Google Scholar] [CrossRef]
- Lupien, V. Principles of Phased Array Ultrasound for Nondestructive Testing. Mater. Eval. 2007, 65. [Google Scholar]
- Towsyfyan, H.; Biguri, A.; Boardman, R.; Blumensath, T. Successes and challenges in non-destructive testing of aircraft composite structures. Chin. J. Aeronaut. 2020, 33, 771–791. [Google Scholar] [CrossRef]
- Brizuela, J.; Camacho, J.; Cosarinsky, G.; Iriarte, J.; Cruza, J. Improving elevation resolution in phased-array inspections for NDT. NDT E Int. 2019, 101, 1–16. [Google Scholar] [CrossRef]
- Zobeiry, N.; Bayat, S.; Anas, E.; Mousavi, P.; Abolmaesumi, P.; Poursartip, A. Temporal Enhanced Ultrasound As A Novel NDT Technique For Defects In Composites. In Proceedings of the American Society for Composites Thirty-Third Technical Conference, 18th US-Japan Conference on Composite Materials ATSM Committee D30 Meeting, Seattle, WA, USA, 24–26 September 2018; The American Society for Composites: Seattle, WA, USA, 2018. [Google Scholar] [CrossRef]
- Hsu, D.K.; Jeong, H. Ultrasonic Velocity Change and Dispersion Due to Porosity in Composite Laminates. In Review of Progress in Quantitative Nondestructive Evaluation: Volume 8, Part A and B; Thompson, D.O., Chimenti, D.E., Eds.; Springer: Boston, MA, USA, 1989; pp. 1567–1573. [Google Scholar] [CrossRef]
- Ishii, Y.; Biwa, S.; Kuraishi, A. Influence of porosity on ultrasonic wave velocity, attenuation and interlaminar interface echoes in composite laminates: Finite element simulations and measurements. Compos. Struct. 2016, 152, 645–653. [Google Scholar] [CrossRef]
- Kapadia, A. Best Practice Guide Non-Destructive Testing of Composite Materials; National Composites Network: Cambridge, UK, 2013. [Google Scholar]
- Hsu, D.K.; Minachi, A. Defect Characterization in Thick Composites by Ultrasound. In Review of Progress in Quantitative Nondestructive Evaluation; Thompson, D.O., Chimenti, D.E., Eds.; Springer: Boston, MA, USA, 1990; pp. 1481–1488. [Google Scholar] [CrossRef]
- Mouritz, A.P. Ultrasonic and Interlaminar Properties of Highly Porous Composites. J. Compos. Mater. 2000, 34, 218–239. [Google Scholar] [CrossRef]
- Kersemans, M.; Verboven, E.; Segers, J.; Hedayatrasa, S.; Paepegem, W.V. Non-Destructive Testing of Composites by Ultrasound, Local Defect Resonance and Thermography. Proceedings 2018, 2, 554. [Google Scholar] [CrossRef]
- Mouritz, A.P.; Townsend, C.; Shah Khan, M.Z. Non-destructive detection of fatigue damage in thick composites by pulse echo ultrasonics. Compos. Sci. Technol. 2000, 60, 23–32. [Google Scholar] [CrossRef]
- Drinkwater, B.W.; Wilcox, P.D. Ultrasonic arrays for non-destructive evaluation: A review. NDT E Int. 2006, 39, 525–541. [Google Scholar] [CrossRef]
- Nsengiyumva, W.; Zhong, S.; Lin, J.; Zhang, Q.; Zhong, J.; Huang, Y. Advances, limitations and prospects of nondestructive testing and evaluation of thick composites and sandwich structures: A state-of-the-art review. Compos. Struct. 2021, 256, 112951. [Google Scholar] [CrossRef]
- Battley, M.; Skeates, A.; Simpkin, R.; Holmqvist, A. Non-Destructive Inspection of Marine Composite Structures. In Proceedings of the High Performace Yacht Design Conference, Auckland, New Zealand, 1–4 December 2002. [Google Scholar]
- Balasubramaniam, K.; Whitney, S.C. Ultrasonic through-transmission characterization of thick fibre-reinforced composites. NDT E Int. 1996, 29, 225–236. [Google Scholar] [CrossRef]
- Ibrahim, M.E. Nondestructive evaluation of thick-section composites and sandwich structures: A review. Compos. Part A Appl. Sci. Manuf. 2014, 64, 36–48. [Google Scholar] [CrossRef]
- Ibrahim, M.E. Nondestructive testing and structural health monitoring of marine composite structures. In Marine Applications of Advanced Fibre-Reinforced Composites; Elsevier Inc.: Amsterdam, The Netherlands, 2016; pp. 147–183. [Google Scholar] [CrossRef]
- Sheppard, P.J.; Phillips, H.J.; Cooper, I. The practical use of NDE methods for the assessment of damaged marine composite structures. ICCM Int. Conf. Compos. Mater. 2009, 213, 110305. [Google Scholar]
- Davidson, J.R.; Quinn, J.A.; Rothmann, C.; Bajpai, A.; Robert, C.; Ó Brádaigh, C.M.; McCarthy, E.D. Mechanical characterisation of pneumatically-spliced carbon fibre yarns as reinforcements for polymer composites. Mater. Des. 2022, 213, 110305. [Google Scholar] [CrossRef]
- Obande, W.; Stankovic, D.; Bajpai, A.; Devine, M.; Wurzer, C.; Lykkeberg, A.; Garden, J.A.; Ó Brádaigh, C.M.; Ray, D. Thermal reshaping as a route for reuse of end-of-life glass fibre-reinforced acrylic composites. Compos. Part B Eng. 2023, 257, 110662. [Google Scholar] [CrossRef]
- Khalid, M.Y.; Arif, Z.U.; Ahmed, W.; Arshad, H. Recent trends in recycling and reusing techniques of different plastic polymers and their composite materials. Sustain. Mater. Technol. 2022, 31, e00382. [Google Scholar] [CrossRef]
- O’Rourke, K.; Wurzer, C.; Murray, J.; Doyle, A.; Doyle, K.; Griffin, C.; Christensen, B.; Ó Brádaigh, C.M.; Ray, D. Diverted from Landfill: Reuse of Single-Use Plastic Packaging Waste. Polymers 2022, 14, 5485. [Google Scholar] [CrossRef]
- Bond, L.J.; Ahmad, A. Fundamentals Ultrasonic Inspection. ASM Handb. Nondestruct. Eval. Mater. 2018, 17, 698. [Google Scholar]


| Plate | Depth from Front Face | Depth from Rear Face | (%) | |||||
|---|---|---|---|---|---|---|---|---|
| Thickness | Flaw 1 | Flaw 2 | Flaw 3 | Flaw 1 | Flaw 2 | Flaw 3 | Mean | SD |
| 20 mm | 25% | 50% | 60% | 35% | 44.7 | 8.5 | ||
| 40 mm | 12% | 25% | 50% | 80% | 68% | 43% | 44.4 | 8.3 |
| 60 mm | 8% | 25% | 50% | 86% | 70% | 45% | 40.4 | 8.3 |
| 80 mm | 6% | 25% | 50% | 90% | 71% | 46% | 41.9 | 11.0 |
| 100 mm | 10% | 20% | 30% | 77% | 67% | 57% | 46.4 | 13.8 |
Disclaimer/Publisher’s Note: The statements, opinions and data contained in all publications are solely those of the individual author(s) and contributor(s) and not of MDPI and/or the editor(s). MDPI and/or the editor(s) disclaim responsibility for any injury to people or property resulting from any ideas, methods, instructions or products referred to in the content. |
© 2023 by the authors. Licensee MDPI, Basel, Switzerland. This article is an open access article distributed under the terms and conditions of the Creative Commons Attribution (CC BY) license (https://creativecommons.org/licenses/by/4.0/).
Share and Cite
Quinn, J.A.; Davidson, J.R.; Bajpai, A.; Ó Brádaigh, C.M.; McCarthy, E.D. Advanced Ultrasonic Inspection of Thick-Section Composite Structures for In-Field Asset Maintenance. Polymers 2023, 15, 3175. https://doi.org/10.3390/polym15153175
Quinn JA, Davidson JR, Bajpai A, Ó Brádaigh CM, McCarthy ED. Advanced Ultrasonic Inspection of Thick-Section Composite Structures for In-Field Asset Maintenance. Polymers. 2023; 15(15):3175. https://doi.org/10.3390/polym15153175
Chicago/Turabian StyleQuinn, James A., James R. Davidson, Ankur Bajpai, Conchúr M. Ó Brádaigh, and Edward D. McCarthy. 2023. "Advanced Ultrasonic Inspection of Thick-Section Composite Structures for In-Field Asset Maintenance" Polymers 15, no. 15: 3175. https://doi.org/10.3390/polym15153175
APA StyleQuinn, J. A., Davidson, J. R., Bajpai, A., Ó Brádaigh, C. M., & McCarthy, E. D. (2023). Advanced Ultrasonic Inspection of Thick-Section Composite Structures for In-Field Asset Maintenance. Polymers, 15(15), 3175. https://doi.org/10.3390/polym15153175