


Configuration of a Simple Method for Different Polyamides 6.9 Recognition by ATR-FTIR Analysis Coupled with Chemometrics

 , ,
, ,  and
and 
Abstract
1. Introduction
2. Materials and Methods
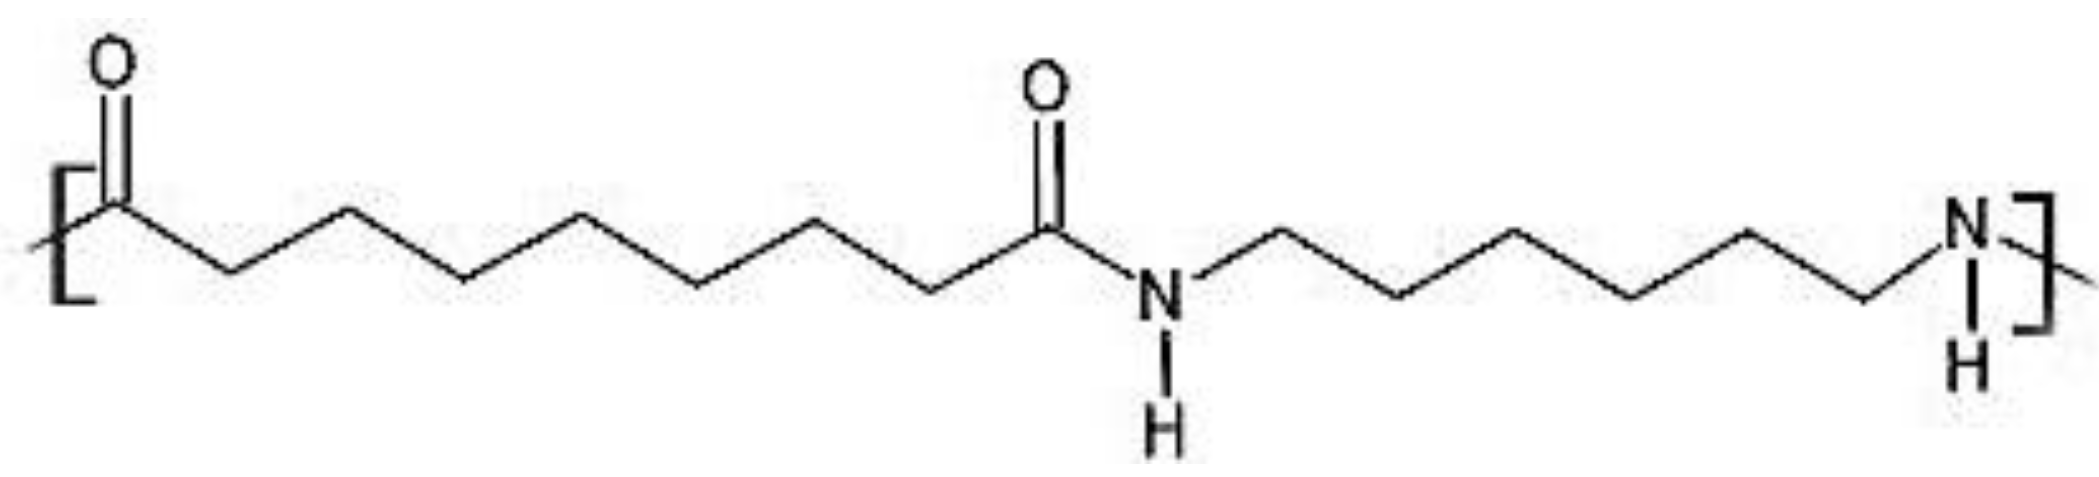
2.1. Synthesis and Characterisation of PA69
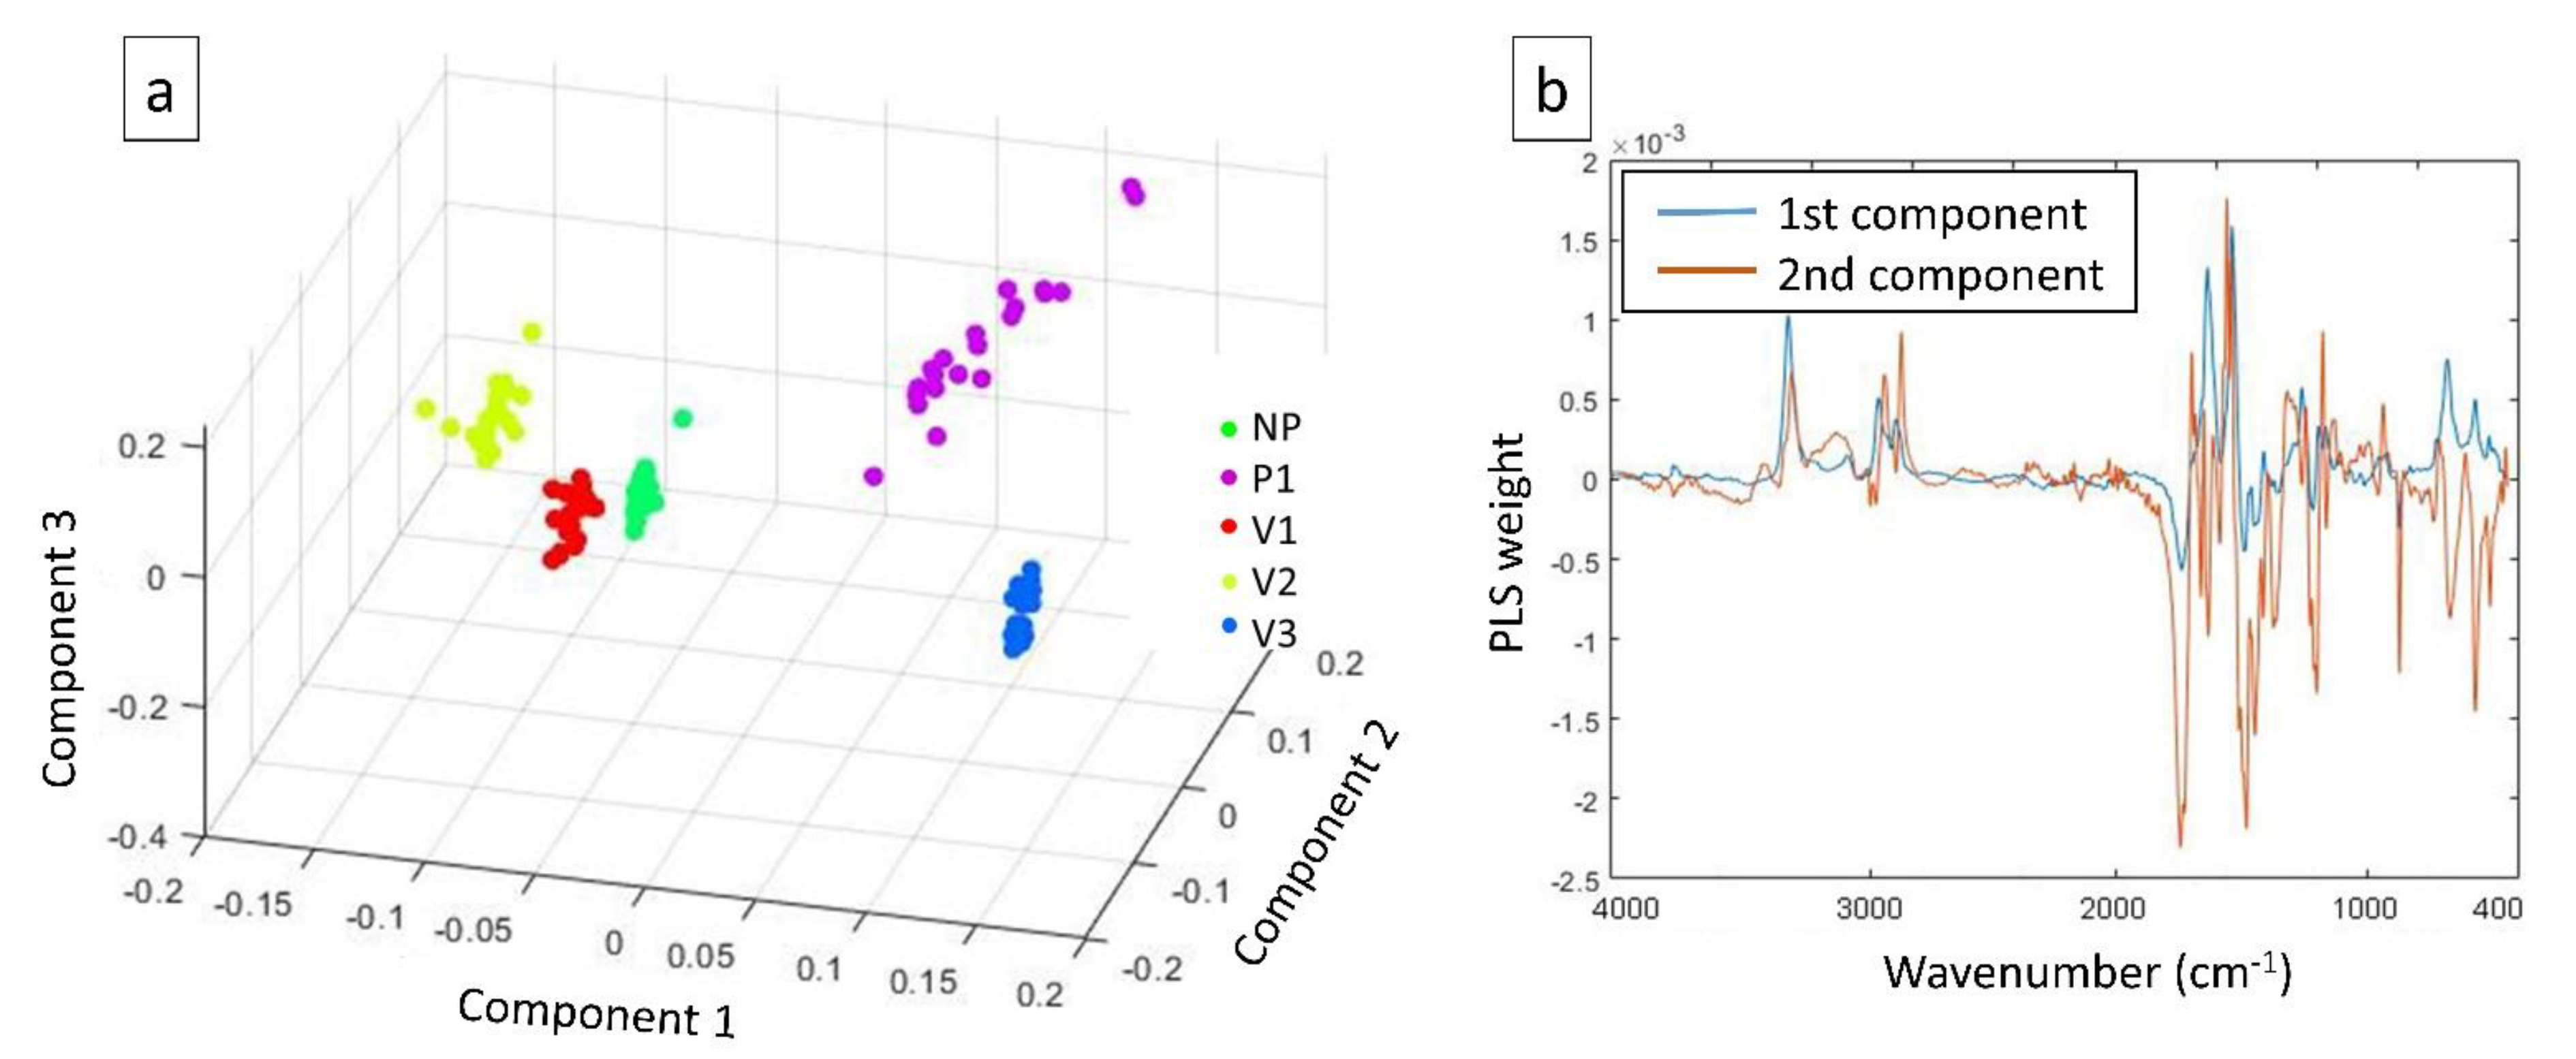
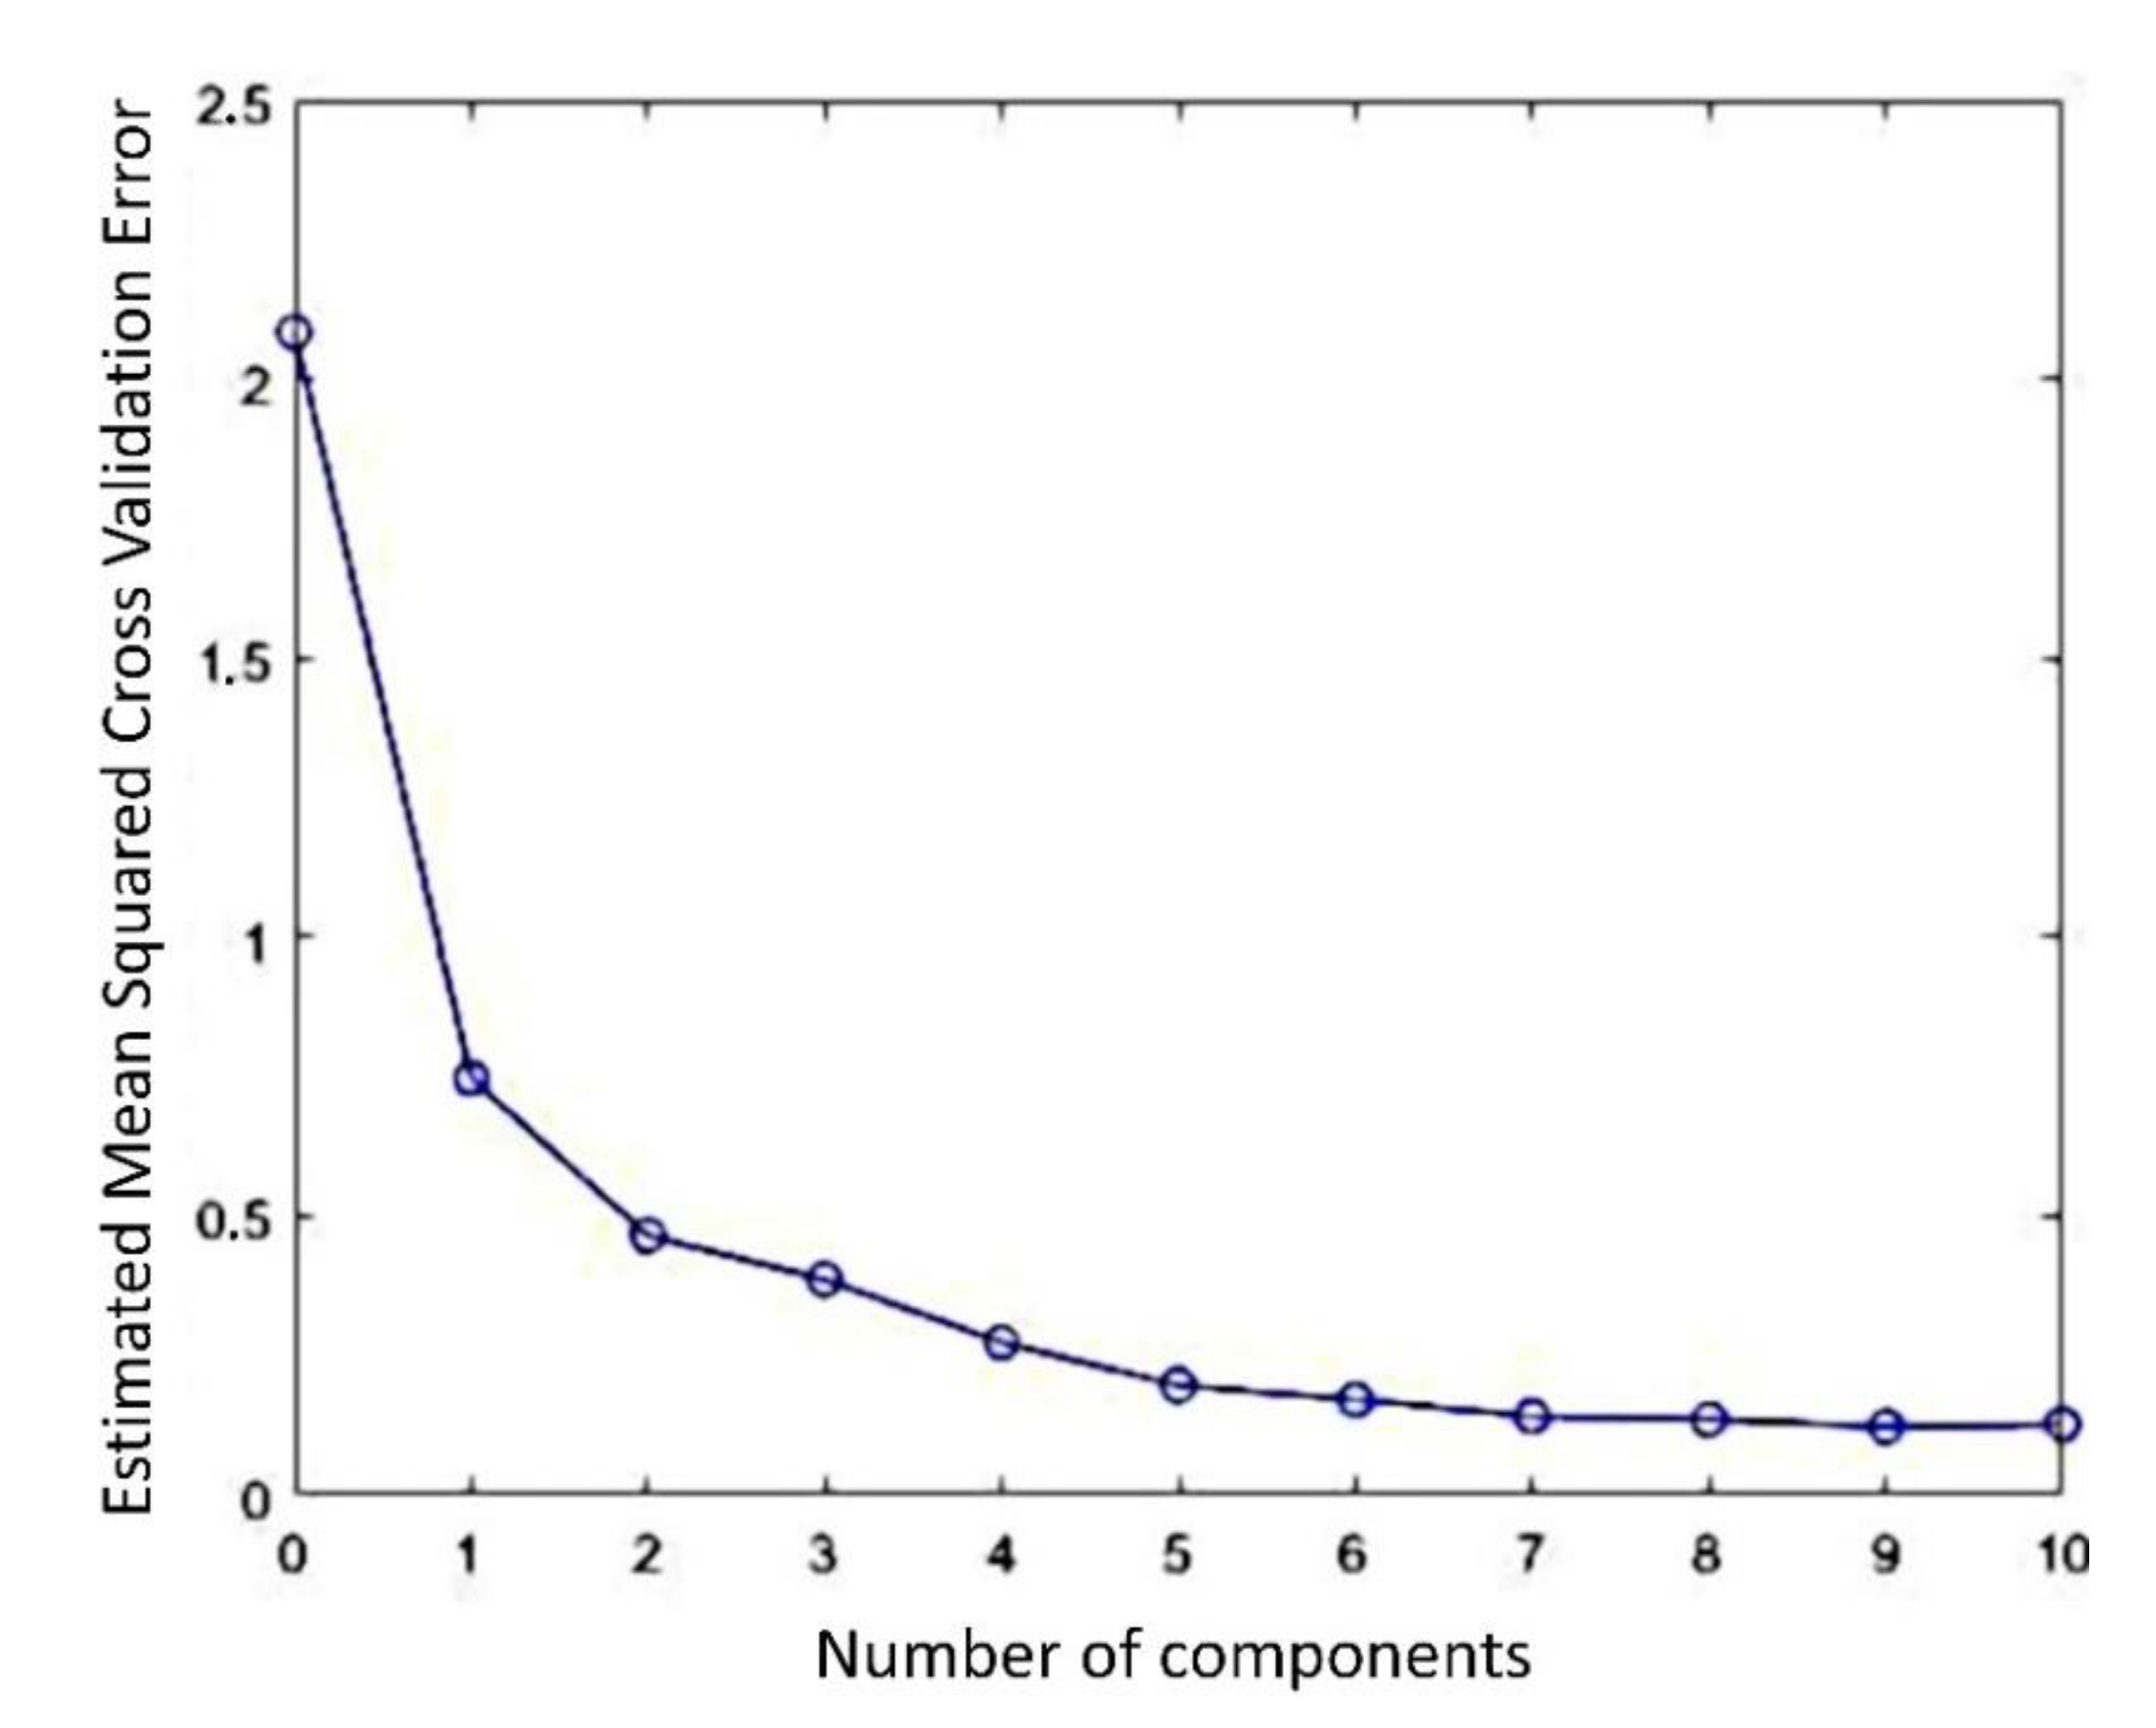
2.2. ATR-FTIR Measures Coupled with Chemometrics
3. Results and Discussion
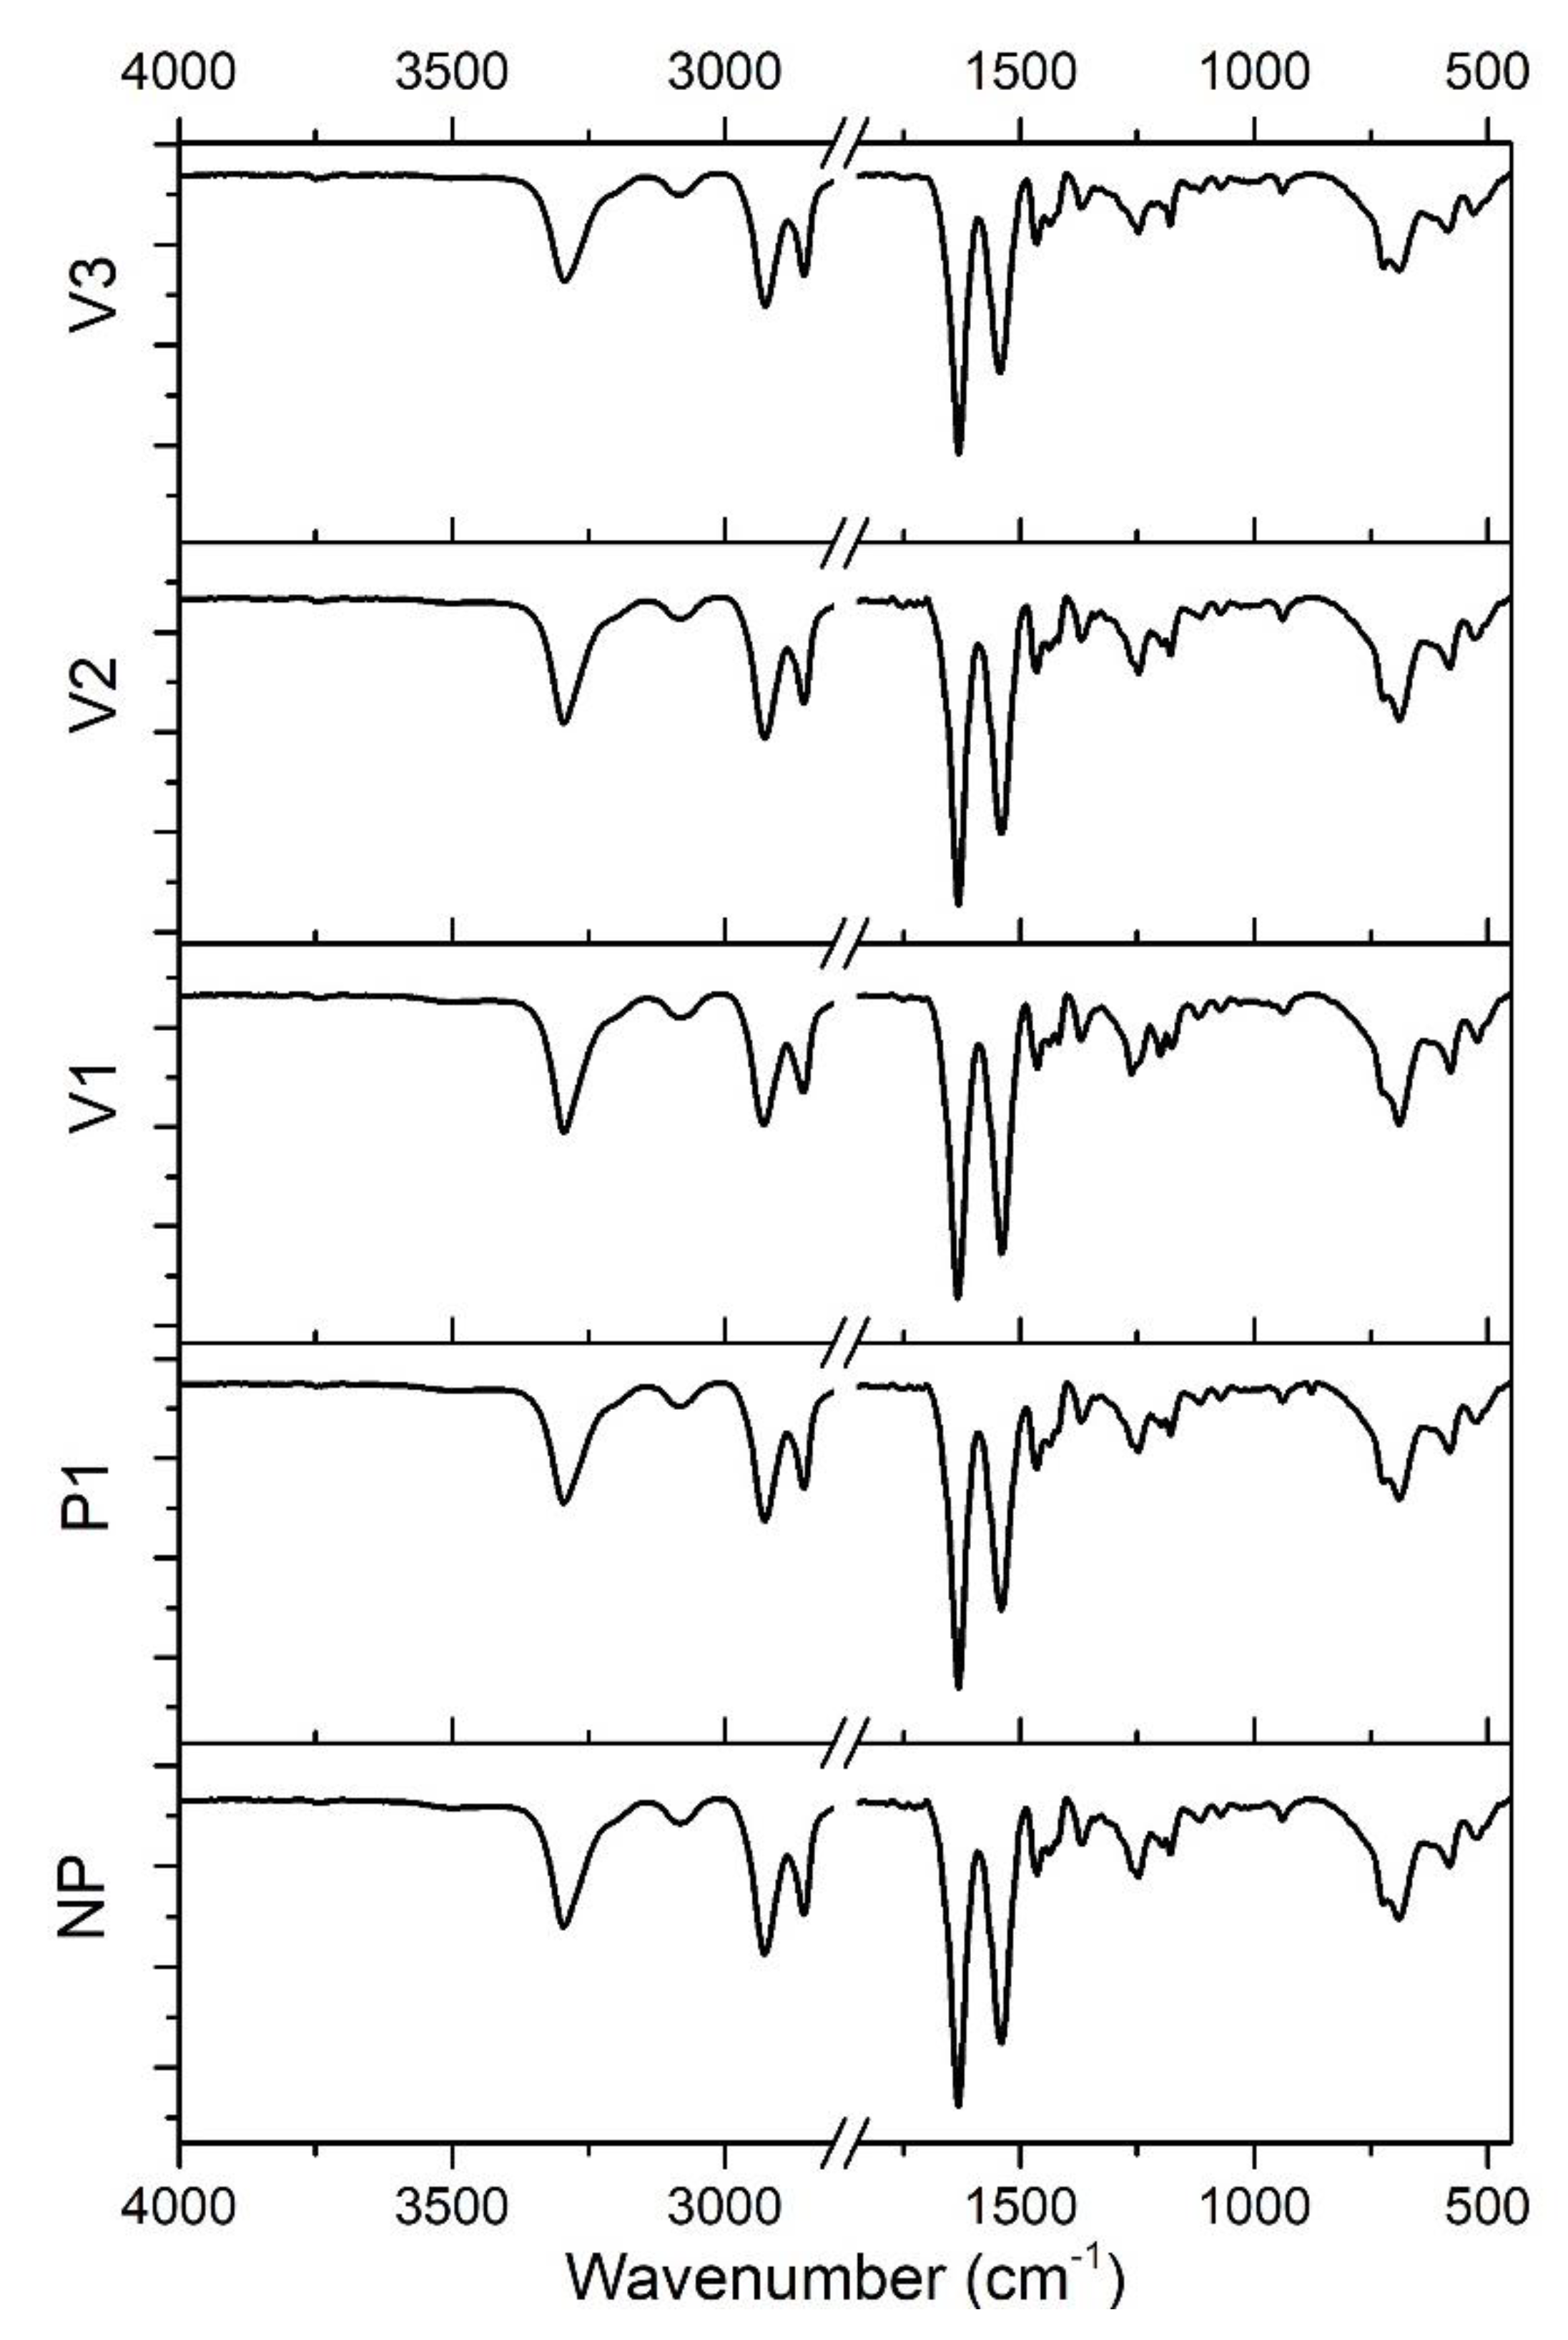
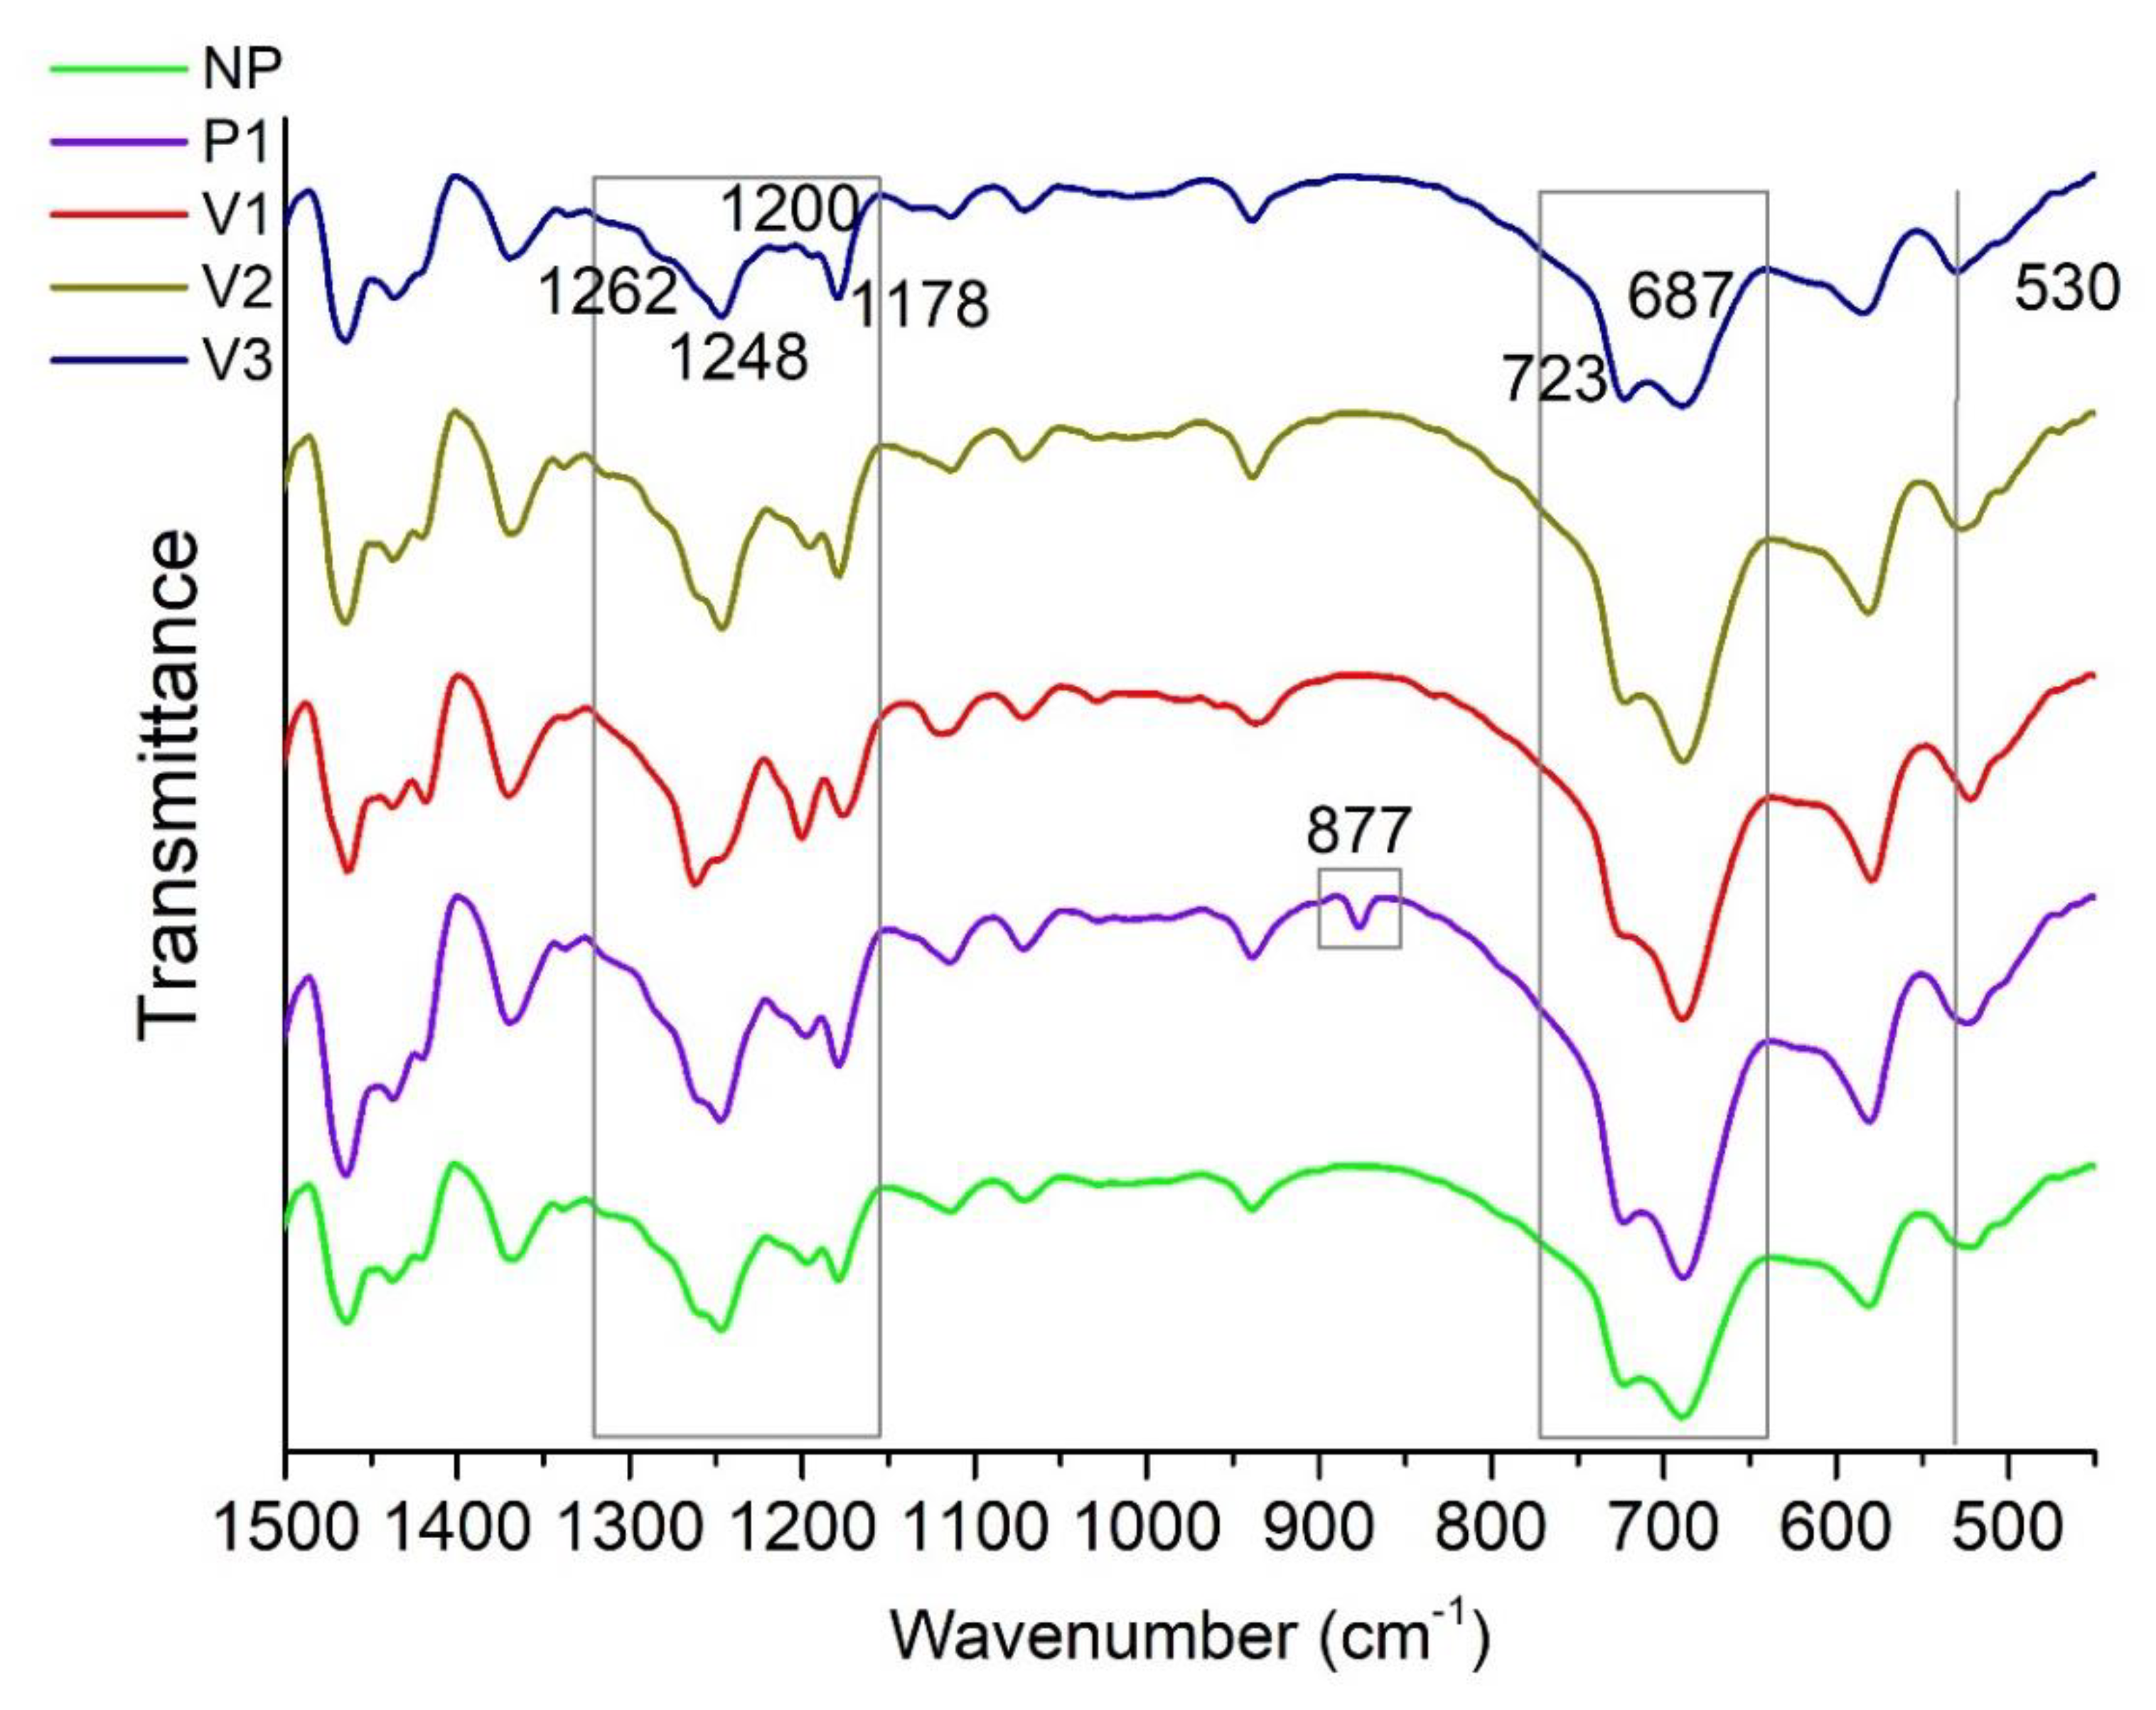
- − Around 3300 cm−1: stretching vibration of the amine groups (at ca. 3075 cm−1, the overtone of N-H bending has a signal [44]);
- − At about 2930 and 2855 cm−1: asymmetric and symmetric stretching vibration peaks of methylene (-CH2-), respectively;
- − Around 1634 cm−1 and 1542 cm−1: amide I [ν(C=O)] and amide II [δ(N-H), ν(C-N)] bands, respectively;
- − Peaks appearing at 1465 cm−1 and 1370 cm−1: C-H asymmetric bending in (-CH2-) or (-CH3-) and symmetric bending in (-CH3-), respectively;
- − At about 940 cm−1 and 685 cm−1: C–C=O stretching vibration and N–H out-of-plane bending vibration, respectively;
4. Conclusions and Perspectives
Supplementary Materials
Author Contributions
Funding
Data Availability Statement
Conflicts of Interest
References
- Poliammidi (PA), Nylon: Caratteristiche, Tipologie, Impieghi, Mercato. Available online: https://www.plastmagazine.it/poliammidi-pa-nylon-caratteristiche-tipologie-impieghi-mercato/ (accessed on 23 December 2022).
- Harmsen, P.; Scheffer, M.; Bos, H. Textiles for Circular Fashion: The Logic behind Recycling Options. Sustainbility 2021, 13, 9714. [Google Scholar] [CrossRef]
- Alberti, C.; Figueira, R.; Hofmann, M.; Koschke, S.; Enthaler, S. Chemical Recycling of End-of-Life Polyamide 6 via Ring Closing Depolymerization. ChemistrySelect 2019, 4, 12638–12642. [Google Scholar] [CrossRef]
- Kind, S.; Neubauer, S.; Becker, J.; Yamamoto, M.; Völkert, M.; von Abendroth, G.; Zelder, O.; Wittmann, C. From Zero to Hero—Production of Bio-Based Nylon from Renewable Resources Using Engineered Corynebacterium Glutamicum. Metab. Eng. 2014, 25, 113–123. [Google Scholar] [CrossRef] [PubMed]
- Tummino, M.L.; Varesano, A.; Copani, G.; Vineis, C. A Glance at Novel Materials, from the Textile World to Environmental Remediation. J. Polym. Environ. 2023, 31, 2826–2854. [Google Scholar] [CrossRef]
- Ohshima, M.; Tanigaki, M. Quality Control of Polymer Production Processes. J. Process Control 2000, 10, 135–148. [Google Scholar] [CrossRef]
- Alkhuder, K. Attenuated Total Reflection-Fourier Transform Infrared Spectroscopy: A Universal Analytical Technique with Promising Applications in Forensic Analyses. Int. J. Legal Med. 2022, 136, 1717–1736. [Google Scholar] [CrossRef]
- Sharma, V.; Yadav, J.; Kumar, R.; Tesarova, D.; Ekielski, A. On the Rapid and Non-Destructive Approach for Wood Identification Using ATR-FTIR Spectroscopy and Chemometric Methods. Vib. Spectrosc. 2020, 110, 103097. [Google Scholar] [CrossRef]
- Sharma, A.; Chauhan, R.; Kumar, R.; Mankotia, P.; Verma, R.; Sharma, V. A Rapid and Non-Destructive ATR-FTIR Spectroscopy Method Supported by Chemometrics for Discriminating between Facial Creams and the Classification into Herbal and Non-Herbal Brands. Spectrochim. Acta—Part A Mol. Biomol. Spectrosc. 2021, 258, 119803. [Google Scholar] [CrossRef]
- Peets, P.; Leito, I.; Pelt, J.; Vahur, S. Identification and Classification of Textile Fibres Using ATR-FT-IR Spectroscopy with Chemometric Methods. Spectrochim. Acta—Part A Mol. Biomol. Spectrosc. 2017, 173, 175–181. [Google Scholar] [CrossRef]
- Chrimatopoulos, C.; Pavlou, E.; Kourkoumelis, N.; Sakkas, V. Discriminating the Salivary Profile of Athletes Using ATR-FTIR Spectroscopy and Chemometrics. Chemom. Intell. Lab. Syst. 2022, 230, 104660. [Google Scholar] [CrossRef]
- da Silva, D.J.; Wiebeck, H. ATR-FTIR Spectroscopy Combined with Chemometric Methods for the Classification of Polyethylene Residues Containing Different Contaminants. J. Polym. Environ. 2022, 30, 3031–3044. [Google Scholar] [CrossRef]
- Bertolla, M.; Cecchetto, M.; Comotto, M.; Dal Moro, A. Comparison of the Properties of a Random Copolymer and a Molten Blend PA6/PA6.9. Polymers 2022, 14, 4115. [Google Scholar] [CrossRef]
- Sun, Z.; Wang, X.; Guo, F.; Jiang, C.; Pan, Q. Isothermal and Nonisothermal Crystallization Kinetics of Bio-Sourced Nylon 69. Chin. J. Chem. Eng. 2016, 24, 638–645. [Google Scholar] [CrossRef]
- Tao, L.; Liu, K.; Li, T.; Xiao, R. Preparation and Properties of Biobased Polyamides Based on 1,9-Azelaic Acid and Different Chain Length Diamines. Polym. Bull. 2020, 77, 1135–1156. [Google Scholar] [CrossRef]
- Tao, L.; Liu, K.; Zheng, Y.; Xiao, R. Structure and Properties of Bio-Based Polyamide 69 after Treated with Water under Different States. Mater. Res. Express 2019, 6, 115331. [Google Scholar] [CrossRef]
- Ernest Ravindran, R.S.; Thomas, P.; Renganathan, S. Studies on the Structural, Thermal, and Dielectric Properties of Fabricated Nylon 6,9/CaCu3Ti4O12 Nanocomposites. Sci. Eng. Compos. Mater. 2017, 24, 185–194. [Google Scholar] [CrossRef]
- Capsal, J.F.; Dantras, E.; Dandurand, J.; Lacabanne, C. Dielectric Relaxations and Ferroelectric Behaviour of Even-Odd Polyamide PA 6,9. Polymer 2010, 51, 4606–4610. [Google Scholar] [CrossRef]
- Sender, C.; Dantras, E.; Dantras-Laffont, L.; Lacoste, M.H.; Dandurand, J.; Mauzac, M.; Lacout, J.L.; Lavergne, C.; Demont, P.; Bernès, A.; et al. Dynamic Mechanical Properties of a Biomimetic Hydroxyapatite/Polyamide 6,9 Nanocomposite. J. Biomed. Mater. Res.—Part B Appl. Biomater. 2007, 83, 628–635. [Google Scholar] [CrossRef]
- Zilberman, M.; Siegmann, A.; Narkis, M. Structure and Properties of 6/6.9 Copolyamide Series. I. Amorphous Phase. J. Appl. Polym. Sci. 1996, 59, 581–587. [Google Scholar] [CrossRef]
- Garcia-Ramirez, M.; Cavaille, J.Y.; Dufresne, A.; Dupeyre, D. Cellulose-Copolyamide 6,69 Blends. J. Appl. Polym. Sci. 1996, 59, 1995–2007. [Google Scholar] [CrossRef]
- Sood, A.; Upadhyay, R.; Maurya, S.K. Sustainable Production of Azelaic Acid from Vegetable Oils over a Heterogeneous Catalyst. Ind. Crops Prod. 2022, 186, 115139. [Google Scholar] [CrossRef]
- Vassoi, A.; Tabanelli, T.; Sacchetti, A.; Di Gioia, F.; Capuzzi, L.; Cavani, F. The Oxidative Cleavage of 9,10-Dihydroxystearic Triglyceride with Oxygen and Cu Oxide-based Heterogeneous Catalysts. ChemSusChem 2021, 14, 2375–2382. [Google Scholar] [CrossRef] [PubMed]
- Köckritz, A.; Martin, A. Synthesis of Azelaic Acid from Vegetable Oil-Based Feedstocks. Eur. J. Lipid Sci. Technol. 2011, 113, 83–91. [Google Scholar] [CrossRef]
- Arajo, P.H.H.; Sayer, C.; Giudici, R.; Poo, J.G.R. Techniques for Reducing Residual Monomer Content in Polymers: A Review. Polym. Eng. Sci. 2002, 42, 1442–1468. [Google Scholar] [CrossRef]
- Pirman, T.; Ocepek, M.; Likozar, B. Radical Polymerization of Acrylates, Methacrylates, and Styrene: Biobased Approaches, Mechanism, Kinetics, Secondary Reactions, and Modeling. Ind. Eng. Chem. Res. 2021, 60, 9347–9367. [Google Scholar] [CrossRef]
- Thoden van Velzen, E.U.; Chu, S.; Alvarado Chacon, F.; Brouwer, M.T.; Molenveld, K. The Impact of Impurities on the Mechanical Properties of Recycled Polyethylene. Packag. Technol. Sci. 2021, 34, 219–228. [Google Scholar] [CrossRef]
- Polychronopoulos, N.D.; Vlachopoulos, J. Polymer Processing and Rheology. In Functional Polymers; Polymers and Polymeric Composites: A Reference Series; Jafar Mazumder, M., Sheardown, H., Al-Ahmed, A., Eds.; Springer: Cham, Switzerland, 2019; Volume 86, pp. 1–47. ISBN 9783319920672. [Google Scholar]
- Lu, J.; Qiang, Y.; Wu, W.; Jiang, B. Effects of the Processing Parameters on the Shear Viscosity of Cyclic Olefin Copolymer Plasticized by Ultrasonic Vibration Energy. Polymers 2020, 12, 539. [Google Scholar] [CrossRef]
- Chen, J.Y.; Yang, K.J.; Huang, M.S. Optimization of Clamping Force for Low-Viscosity Polymer Injection Molding. Polym. Test. 2020, 90, 106700. [Google Scholar] [CrossRef]
- Härth, M.; Dörnhöfer, A. Film Blowing of Linear and Long-Chain Branched Poly(Ethylene Terephthalate). Polymers 2020, 12, 1605. [Google Scholar] [CrossRef]
- Singh, S.; Ghosh, A.K.; Maiti, S.N.; Gupta, R.K.; Bhattacharya, S. Rheological Aspects and Film Processability of Poly (Lactic Acid)/Linear Low-Density Polyethylene Blends. Polym. Eng. Sci. 2021, 61, 85–94. [Google Scholar] [CrossRef]
- Benz, J.; Bonten, C. Reactive Extrusion of PA6—Different Ways to Increase the Viscosity. AIP Conf. Proc. 2019, 2055, 6–11. [Google Scholar] [CrossRef]
- Schindler, A.; Doedt, M.; Gezgin, Ş.; Menzel, J.; Schmölzer, S. Identification of Polymers by Means of DSC, TG, STA and Computer-Assisted Database Search. J. Therm. Anal. Calorim. 2017, 129, 833–842. [Google Scholar] [CrossRef]
- Bahrami, M.; Abenojar, J.; Martínez, M.A. Comparative Characterization of Hot-Pressed Polyamide 11 and 12: Mechanical, Thermal and Durability Properties. Polymers 2021, 13, 3553. [Google Scholar] [CrossRef]
- Hirschberg, V.; Rodrigue, D. Recycling of Polyamides: Processes and Conditions. J. Polym. Sci. 2023, 1–22. [Google Scholar] [CrossRef]
- Beasley, M.M.; Bartelink, E.J.; Taylor, L.; Miller, R.M. Comparison of Transmission FTIR, ATR, and DRIFT Spectra: Implications for Assessment of Bone Bioapatite Diagenesis. J. Archaeol. Sci. 2014, 46, 16–22. [Google Scholar] [CrossRef]
- Luo, M.R. CIELAB. In Encyclopedia of Color Science and Technology; Shamey, R., Ed.; Springer: Berlin/Heidelberg, Germany, 2015; pp. 1–7. ISBN 978-3-642-27851-8. [Google Scholar]
- Mathworks Website. Available online: https://www.mathworks.com/help/stats/partial-least-squares-regression-and-principal-components-regression.html (accessed on 25 December 2022).
- Jun, Y.; Yong, H.; Hyung, K.; Chon, H.; Rae, D. Transport Properties of Electrospun Nylon 6 Nonwoven Mats. Eur. Polym. J. 2003, 39, 1883–1889. [Google Scholar] [CrossRef]
- Wilkes, G.L. An Overview of the Basic Rheological Behavior of Polymer Fluids with an Emphasis on Polymer Melts. J. Chem. Educ. 1981, 58, 880. [Google Scholar] [CrossRef]
- Balani, K.; Verma, V.; Agarwal, A.; Narayan, R. Physical, Thermal, and Mechanical Properties of Polymers. In Biosurfaces: A Materials Science and Engineering Perspective; John Wiley & Sons, Inc.: Hoboken, NJ, USA, 2014; pp. 329–344. ISBN 9781118950623. [Google Scholar]
- Millot, C.; Fillot, L.A.; Lame, O.; Sotta, P.; Seguela, R. Assessment of Polyamide-6 Crystallinity by DSC: Temperature Dependence of the Melting Enthalpy. J. Therm. Anal. Calorim. 2015, 122, 307–314. [Google Scholar] [CrossRef]
- Nandiyanto, A.B.D.; Ragadhita, R.; Fiandini, M. Interpretation of Fourier Transform Infrared Spectra (FTIR): A Practical Approach in the Polymer/Plastic Thermal Decomposition. Indones. J. Sci. Technol. 2023, 8, 113–126. [Google Scholar] [CrossRef]
- Enlow, E.M.; Kennedy, J.L.; Nieuwland, A.A.; Hendrix, J.E.; Morgan, S.L. Discrimination of Nylon Polymers Using Attenuated Total Reflection Mid-Infrared Spectra and Multivariate Statistical Techniques. Appl. Spectrosc. 2005, 59, 2–8. [Google Scholar] [CrossRef]
- Kang, H.; Wang, Z.; Hao, X.; Liu, R. Thermal Induced Crystalline Transition of Bio-Based Polyamide 56. Polymer 2022, 242, 124540. [Google Scholar] [CrossRef]
- Ho, C.; Chen, P.; Yang, C.; Jeng, U.; Su, A. Mesomorphic Intermediate Stages During Brill Transition of Nylon 6/6. ACS Appl. Polym. Mater. 2021, 3, 1042–1051. [Google Scholar] [CrossRef]
- Raman, R.; Deopura, B.L.; Varma, D.S. Vibrational Spectra of Polyamides in Relation to Polyethylene. Indian J. Text. Res. 1977, 2, 56–58. [Google Scholar]
- Loo, L.S.; Gleason, K.K. Insights into Structure and Mechanical Behavior of α and γ Crystal Forms of Nylon-6 at Low Strain by Infrared Studies. Macromolecules 2003, 36, 6114–6126. [Google Scholar] [CrossRef]
- Seguela, R. Overview and Critical Survey of Polyamide6 Structural Habits: Misconceptions and Controversies. J. Polym. Sci. 2020, 58, 2971–3003. [Google Scholar] [CrossRef]
- Vasanthan, N.; Salem, D.R. FTIR Spectroscopic Characterization of Structural Changes in Polyamide-6 Fibers during Annealing and Drawing. J. Polym. Sci. Part B Polym. Phys. 2001, 39, 536–547. [Google Scholar] [CrossRef]
- Franco, L.; Cooper, S.J.; Atkins, E.D.T.; Hill, M.J.; Jones, N.A. Nylon 6 9 Can Crystallize with Hydrogen Bonding in Two and in Three Interchain Directions. J. Polym. Sci. Part B Polym. Phys. 1998, 36, 1153–1165. [Google Scholar] [CrossRef]
- Murthy, N.S. Hydrogen Bonding, Mobility, and Structural Transitions in Aliphatic Polyamides. J. Polym. Sci. Part B Polym. Phys. 2006, 44, 1763–1782. [Google Scholar] [CrossRef]
- Ma, N.; Liu, W.; Ma, L.; He, S.; Liu, H.; Zhang, Z.; Sun, A.; Huang, M.; Zhu, C. Crystal Transition and Thermal Behavior of Nylon 12. E-Polymers 2020, 20, 346–352. [Google Scholar] [CrossRef]
- Mindivan, F. Effect of crystalline form (γ) of polyamide 6/graphene nanoplatelets (pa6/gn) nanocomposites on its structural and thermal properties. Mach. Technol. Mater. 2016, 10, 56–59. [Google Scholar]
- Sustaita-Rodríguez, J.M.; Medellín-Rodríguez, F.J.; Olvera-Mendez, D.C.; Gimenez, A.J.; Luna-Barcenas, G. Thermal Stability and Early Degradation Mechanisms of High-Density Polyethylene, Polyamide 6 (Nylon 6), and Polyethylene Terephthalate. Polym. Eng. Sci. 2019, 59, 2016–2023. [Google Scholar] [CrossRef]
- Lee, L.C.; Jemain, A.A. Predictive Modelling of Colossal ATR-FTIR Spectral Data Using PLS-DA: Empirical Differences between PLS1-DA and PLS2-DA Algorithms. Analyst 2019, 144, 2670–2678. [Google Scholar] [CrossRef]
- Kipnusu, W.K.; Zhuravlev, E.; Schick, C.; Kremer, F. Homogeneous Nucleation in Polyamide 66, a Two-Stage Process as Revealed by Combined Nanocalorimetry and IR Spectroscopy. Colloid Polym. Sci. 2022, 300, 1247–1255. [Google Scholar] [CrossRef]
- Song, L.; Zhu, T.; Yuan, L.; Zhou, J.; Zhang, Y.; Wang, Z.; Tang, C. Ultra-Strong Long-Chain Polyamide Elastomers with Programmable Supramolecular Interactions and Oriented Crystalline Microstructures. Nat. Commun. 2019, 10, 1315. [Google Scholar] [CrossRef]
- Quarti, C.; Milani, A.; Civalleri, B.; Orlando, R.; Castiglioni, C. Ab Initio Calculation of the Crystalline Structure and IR Spectrum of Polymers: Nylon 6 Polymorphs. J. Phys. Chem. B 2012, 116, 8299–8311. [Google Scholar] [CrossRef]
- Zhou, C.; Qi, S.; Zhu, P.; Zhao, Y.; Xu, Y.; Dong, X. The Methylene Infrared Vibration and Dielectric Behavior Monitored by Amide Group Arrangement for Long Chain Polyamides. Polymer 2020, 190, 122231. [Google Scholar] [CrossRef]
- Pagacz, J.; Raftopoulos, K.N.; Leszczyńska, A.; Pielichowski, K. Bio-Polyamides Based on Renewable Raw Materials. J. Therm. Anal. Calorim. 2016, 123, 1225–1237. [Google Scholar] [CrossRef]
- Porubská, M.; Szöllös, O.; Kóňová, A.; Janigová, I.; Jašková, M.; Jomová, K.; Chodák, I. FTIR Spectroscopy Study of Polyamide-6 Irradiated by Electron and Proton Beams. Polym. Degrad. Stab. 2012, 97, 523–531. [Google Scholar] [CrossRef]


| Sample Label | Colour, b * | Relative Viscosity |
|---|---|---|
| NP | 11 | 2.57 |
| P1 | 2.5 | 2.62 |
| V1 | 14 | 2.34 |
| V2 | 13 | 3.23 |
| V3 | 6 | 3.50 |
| Sample | NP | V2 |
|---|---|---|
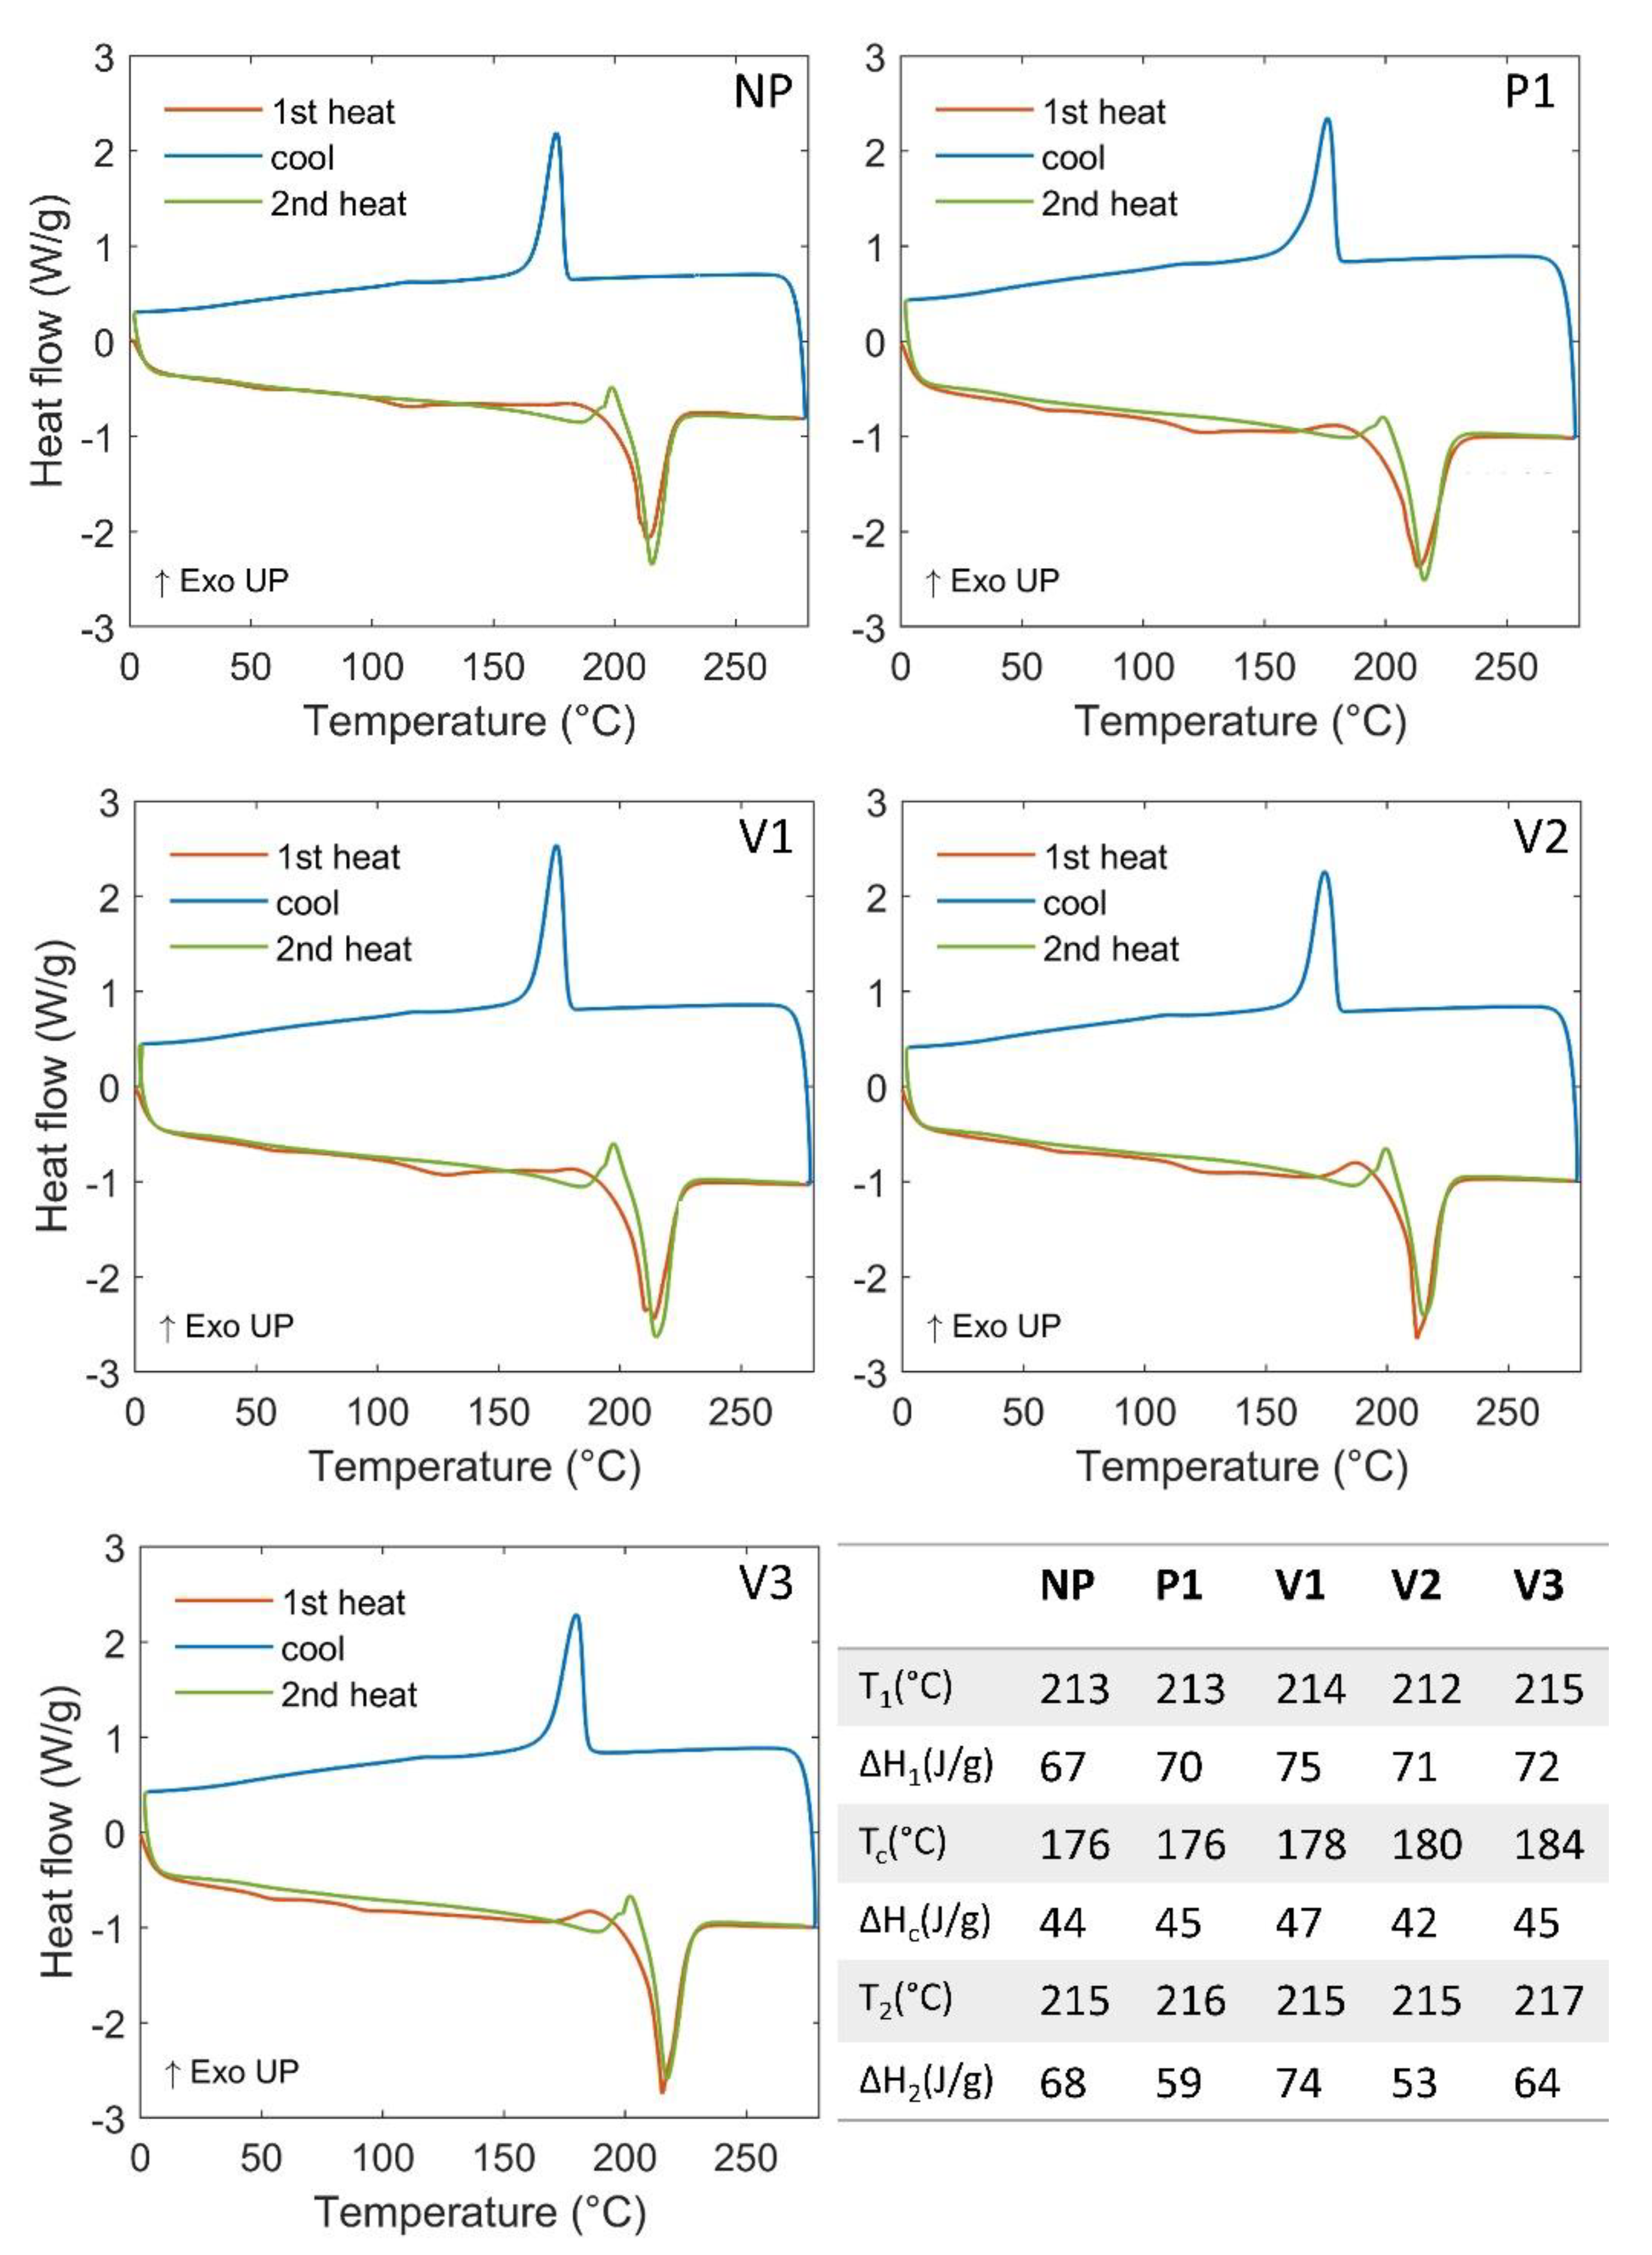
| Melting Point (°C) | 213 | 214 |
| Melt Volume Rate (cm3/10 min) | 35.3 | 9.7 |
| Notched Izod (kJ/m) | 0.032 | 0.044 |
| Unnotched Izod (kJ/m) | 2.2 | 1.9 |
| Notched Charpy (kJ/m2) | 4.9 | 5.8 |
| Unnotched Charpy (kJ/m2) | 224 | 180 |
| Flexural Modulus (GPa) | 1.5 | 1.7 |
| Tensile Strength (MPa) | 57.0 | 56.5 |
| Strain at yield (%) | 4.6 | 4.6 |
| Elongation at break (%) | 141 | 140 |
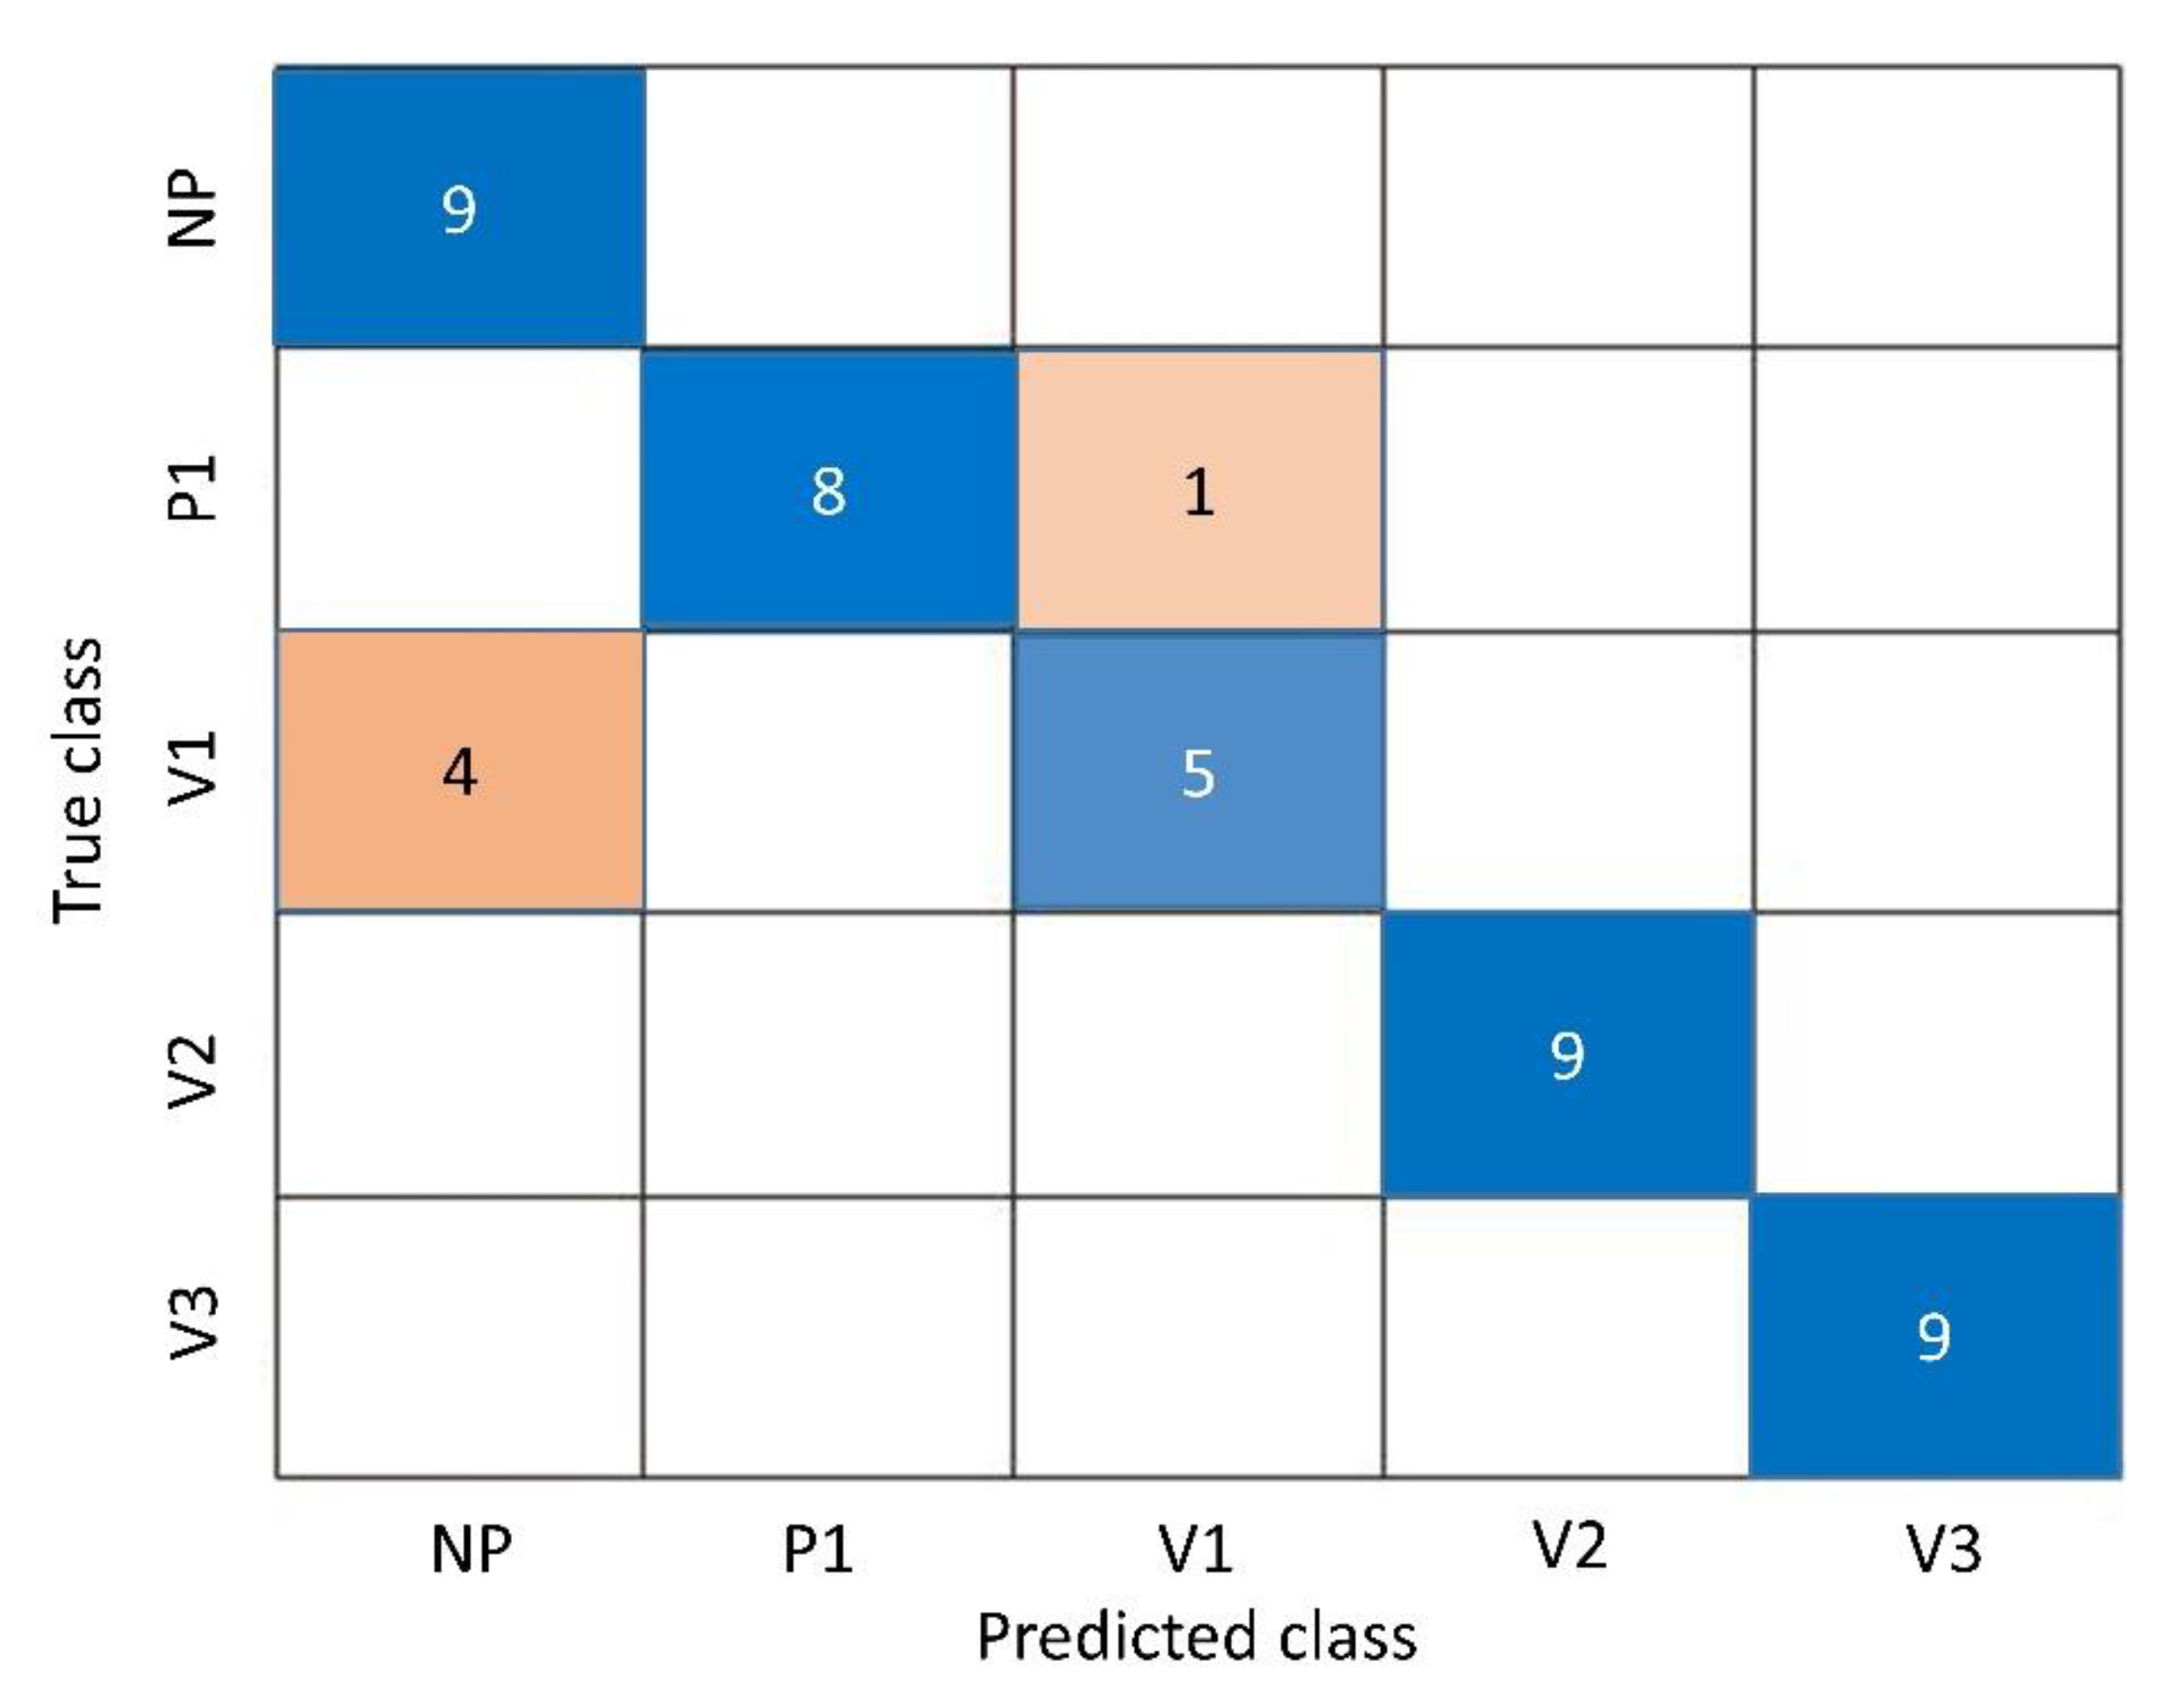
| Polyamide Groups | Sensitivity | Specificity |
|---|---|---|
| NP | 1 | 0.89 |
| P1 | 0.89 | 1 |
| V1 | 0.56 | 0.97 |
| V2 | 1 | 1 |
| V3 | 1 | 1 |
Disclaimer/Publisher’s Note: The statements, opinions and data contained in all publications are solely those of the individual author(s) and contributor(s) and not of MDPI and/or the editor(s). MDPI and/or the editor(s) disclaim responsibility for any injury to people or property resulting from any ideas, methods, instructions or products referred to in the content. |
© 2023 by the authors. Licensee MDPI, Basel, Switzerland. This article is an open access article distributed under the terms and conditions of the Creative Commons Attribution (CC BY) license (https://creativecommons.org/licenses/by/4.0/).
Share and Cite
Tummino, M.L.; Chrimatopoulos, C.; Bertolla, M.; Tonetti, C.; Sakkas, V. Configuration of a Simple Method for Different Polyamides 6.9 Recognition by ATR-FTIR Analysis Coupled with Chemometrics. Polymers 2023, 15, 3166. https://doi.org/10.3390/polym15153166
Tummino ML, Chrimatopoulos C, Bertolla M, Tonetti C, Sakkas V. Configuration of a Simple Method for Different Polyamides 6.9 Recognition by ATR-FTIR Analysis Coupled with Chemometrics. Polymers. 2023; 15(15):3166. https://doi.org/10.3390/polym15153166
Chicago/Turabian StyleTummino, Maria Laura, Christoforos Chrimatopoulos, Maddalena Bertolla, Cinzia Tonetti, and Vasilios Sakkas. 2023. "Configuration of a Simple Method for Different Polyamides 6.9 Recognition by ATR-FTIR Analysis Coupled with Chemometrics" Polymers 15, no. 15: 3166. https://doi.org/10.3390/polym15153166
APA StyleTummino, M. L., Chrimatopoulos, C., Bertolla, M., Tonetti, C., & Sakkas, V. (2023). Configuration of a Simple Method for Different Polyamides 6.9 Recognition by ATR-FTIR Analysis Coupled with Chemometrics. Polymers, 15(15), 3166. https://doi.org/10.3390/polym15153166