Corrosion Resistance of CeO2-GO/Epoxy Nanocomposite Coating in Simulated Seawater and Concrete Pore Solutions

 , ,
, ,
Abstract
1. Introduction
2. Experimental
2.1. Raw Materials
2.2. Preparation of CeO2-GO (4:1)/EP Nanocomposite Coating
2.3. Preparation of Corrosive Solutions
2.4. Test Method
2.4.1. Corrosion Micromorphology Testing
2.4.2. Hardness Test
2.4.3. Electrochemical Test
3. Results and Discussion
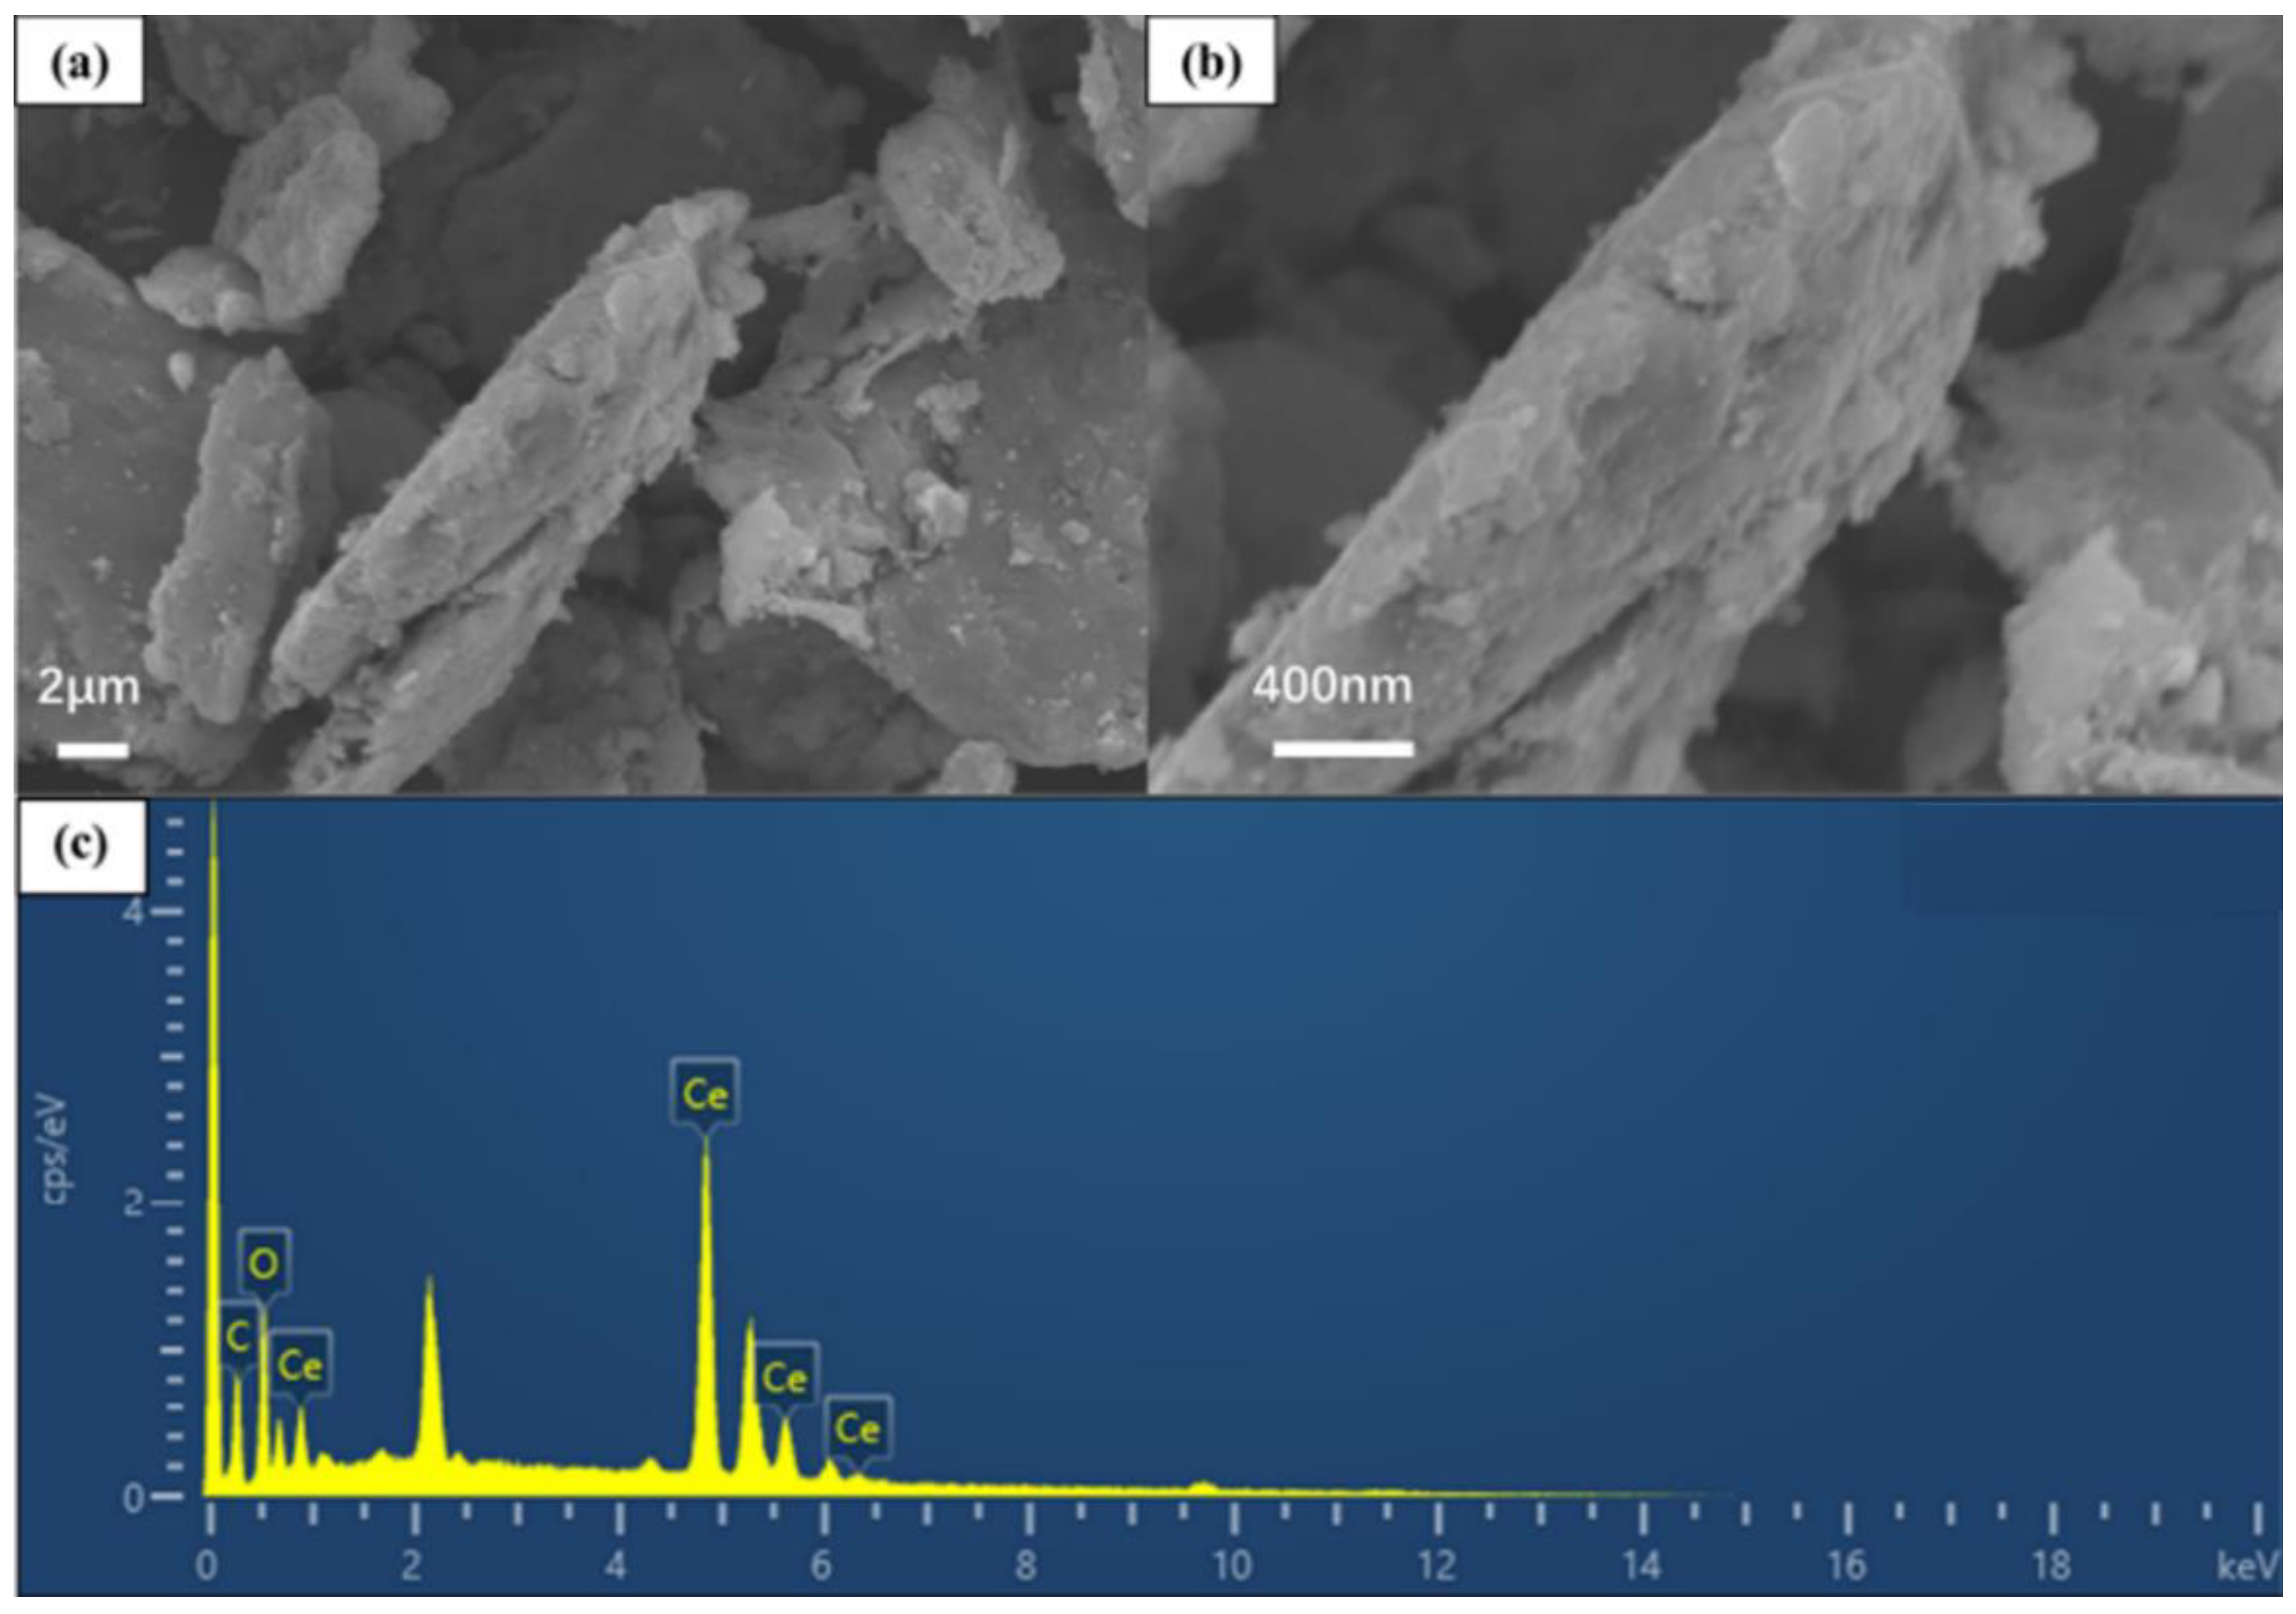
3.1. SEM-EDS Analysis of CeO2-GO Nanocomposites
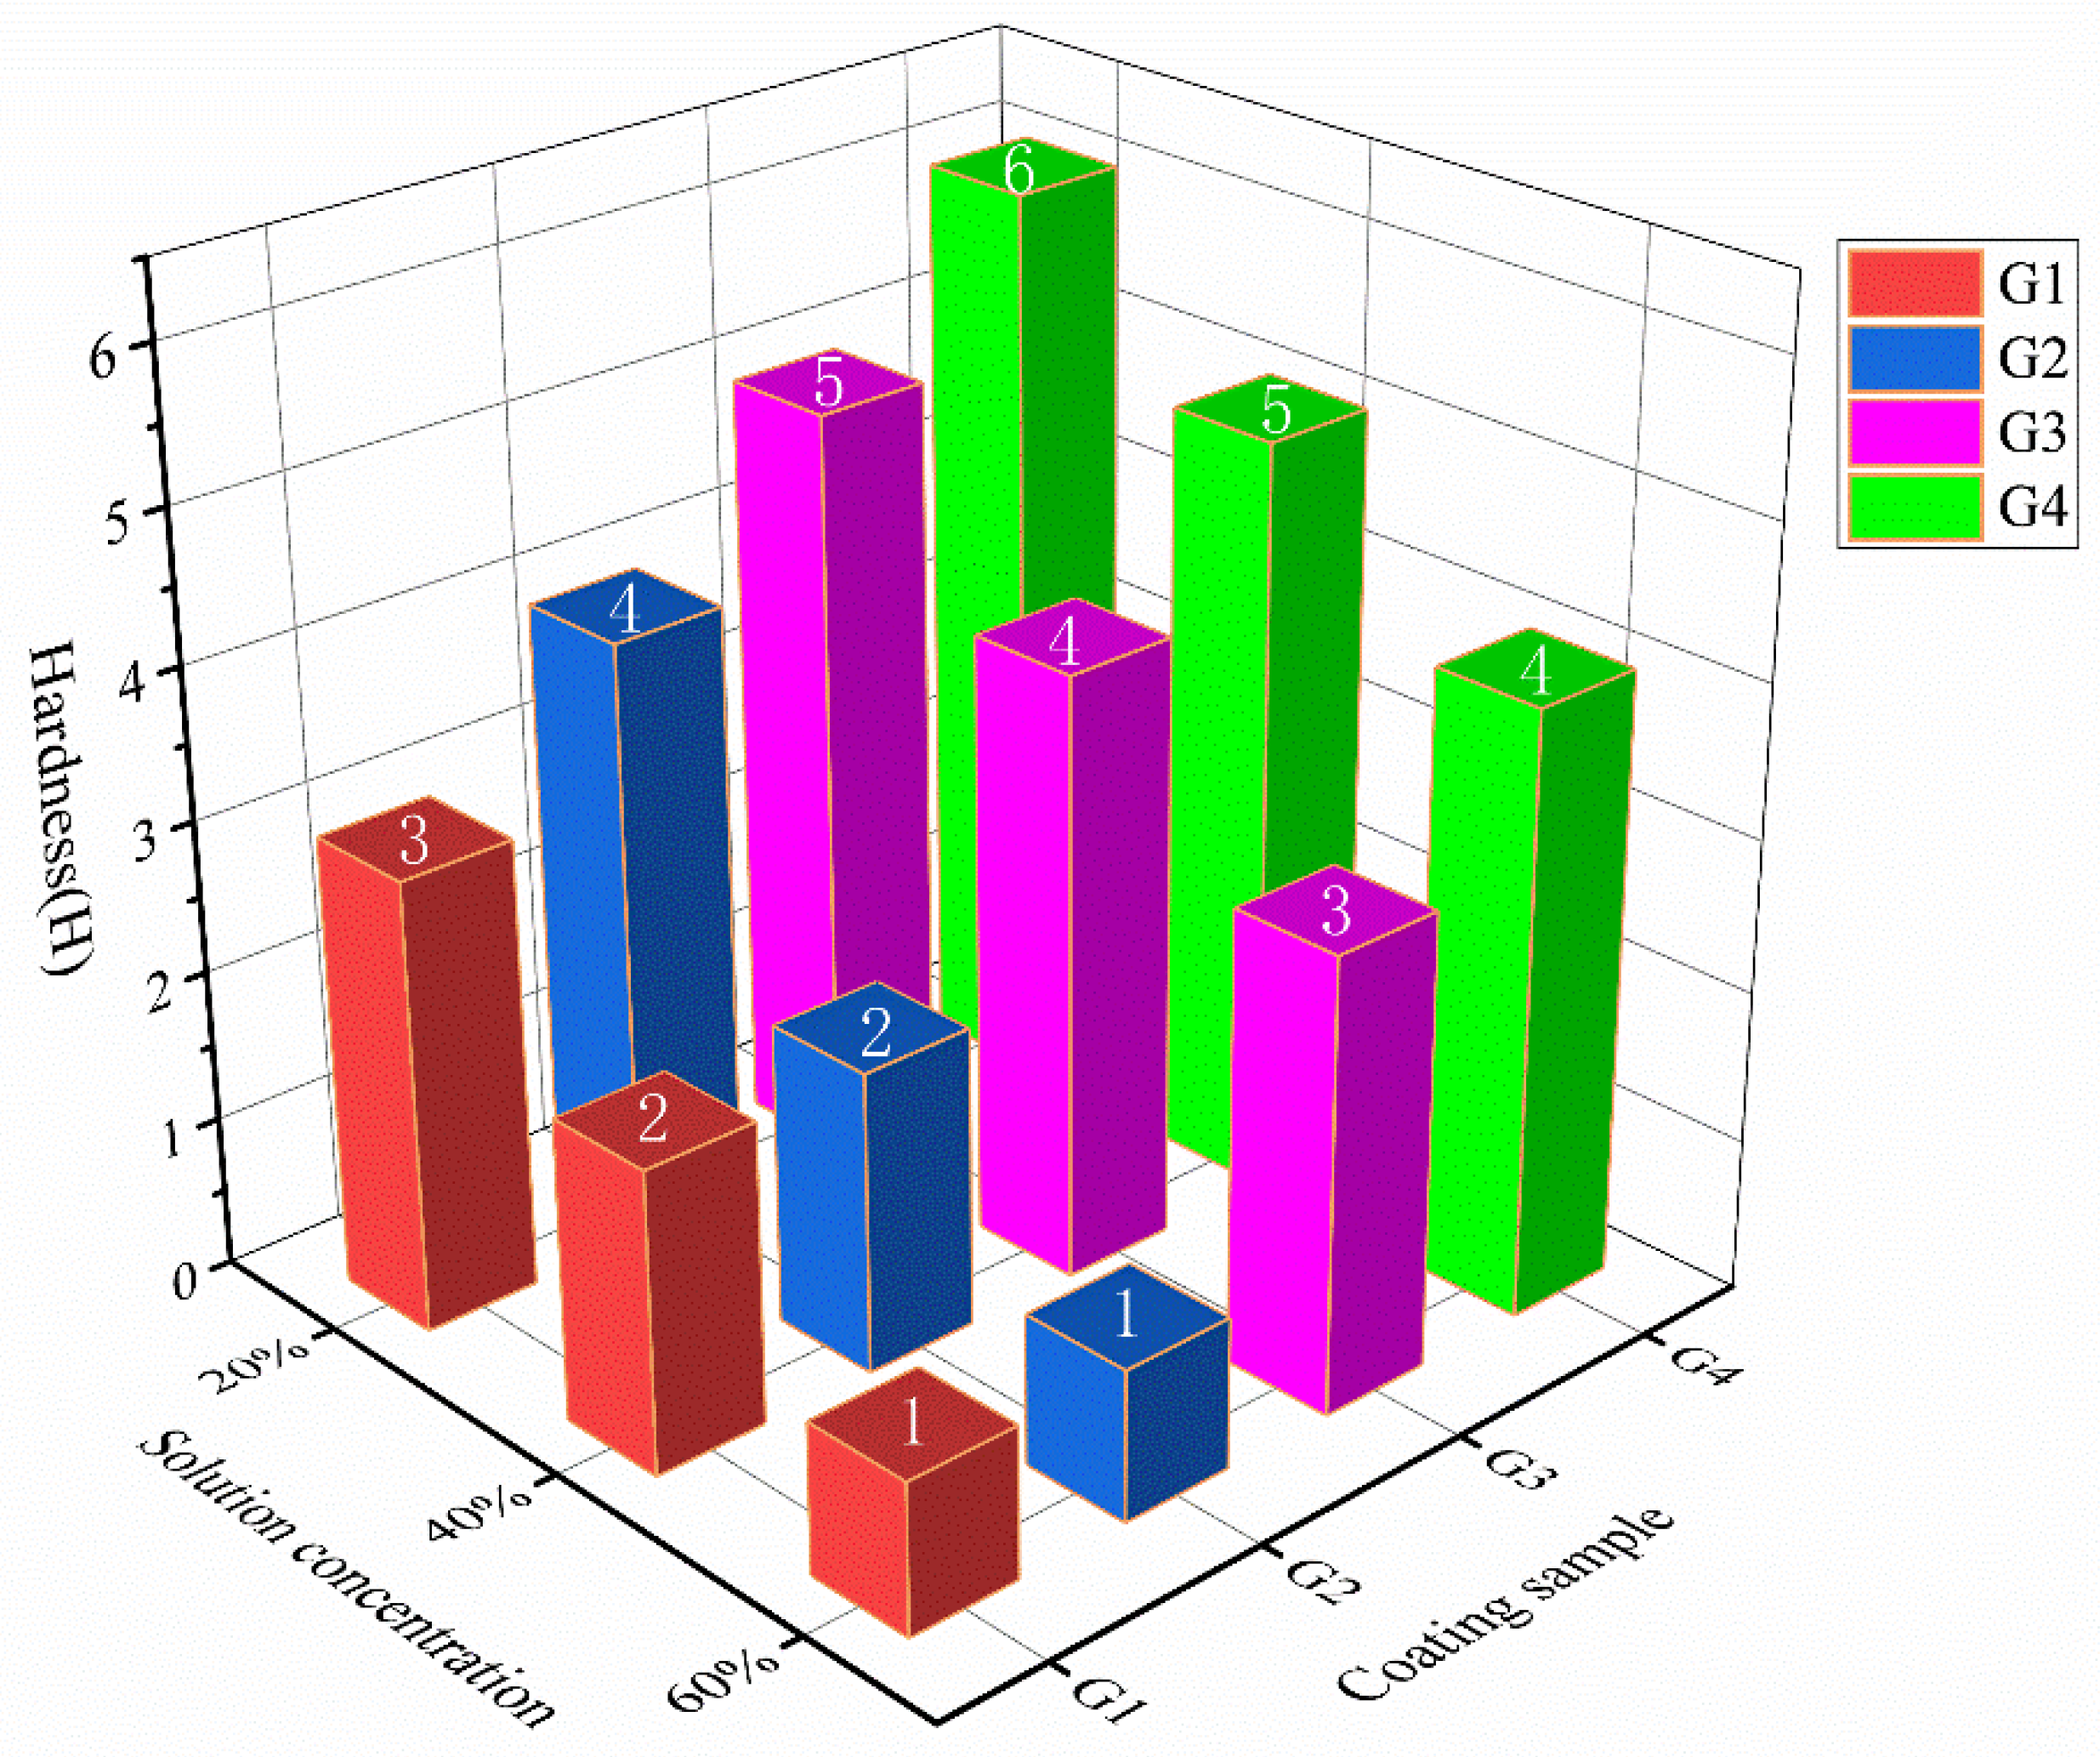
3.2. Hardness
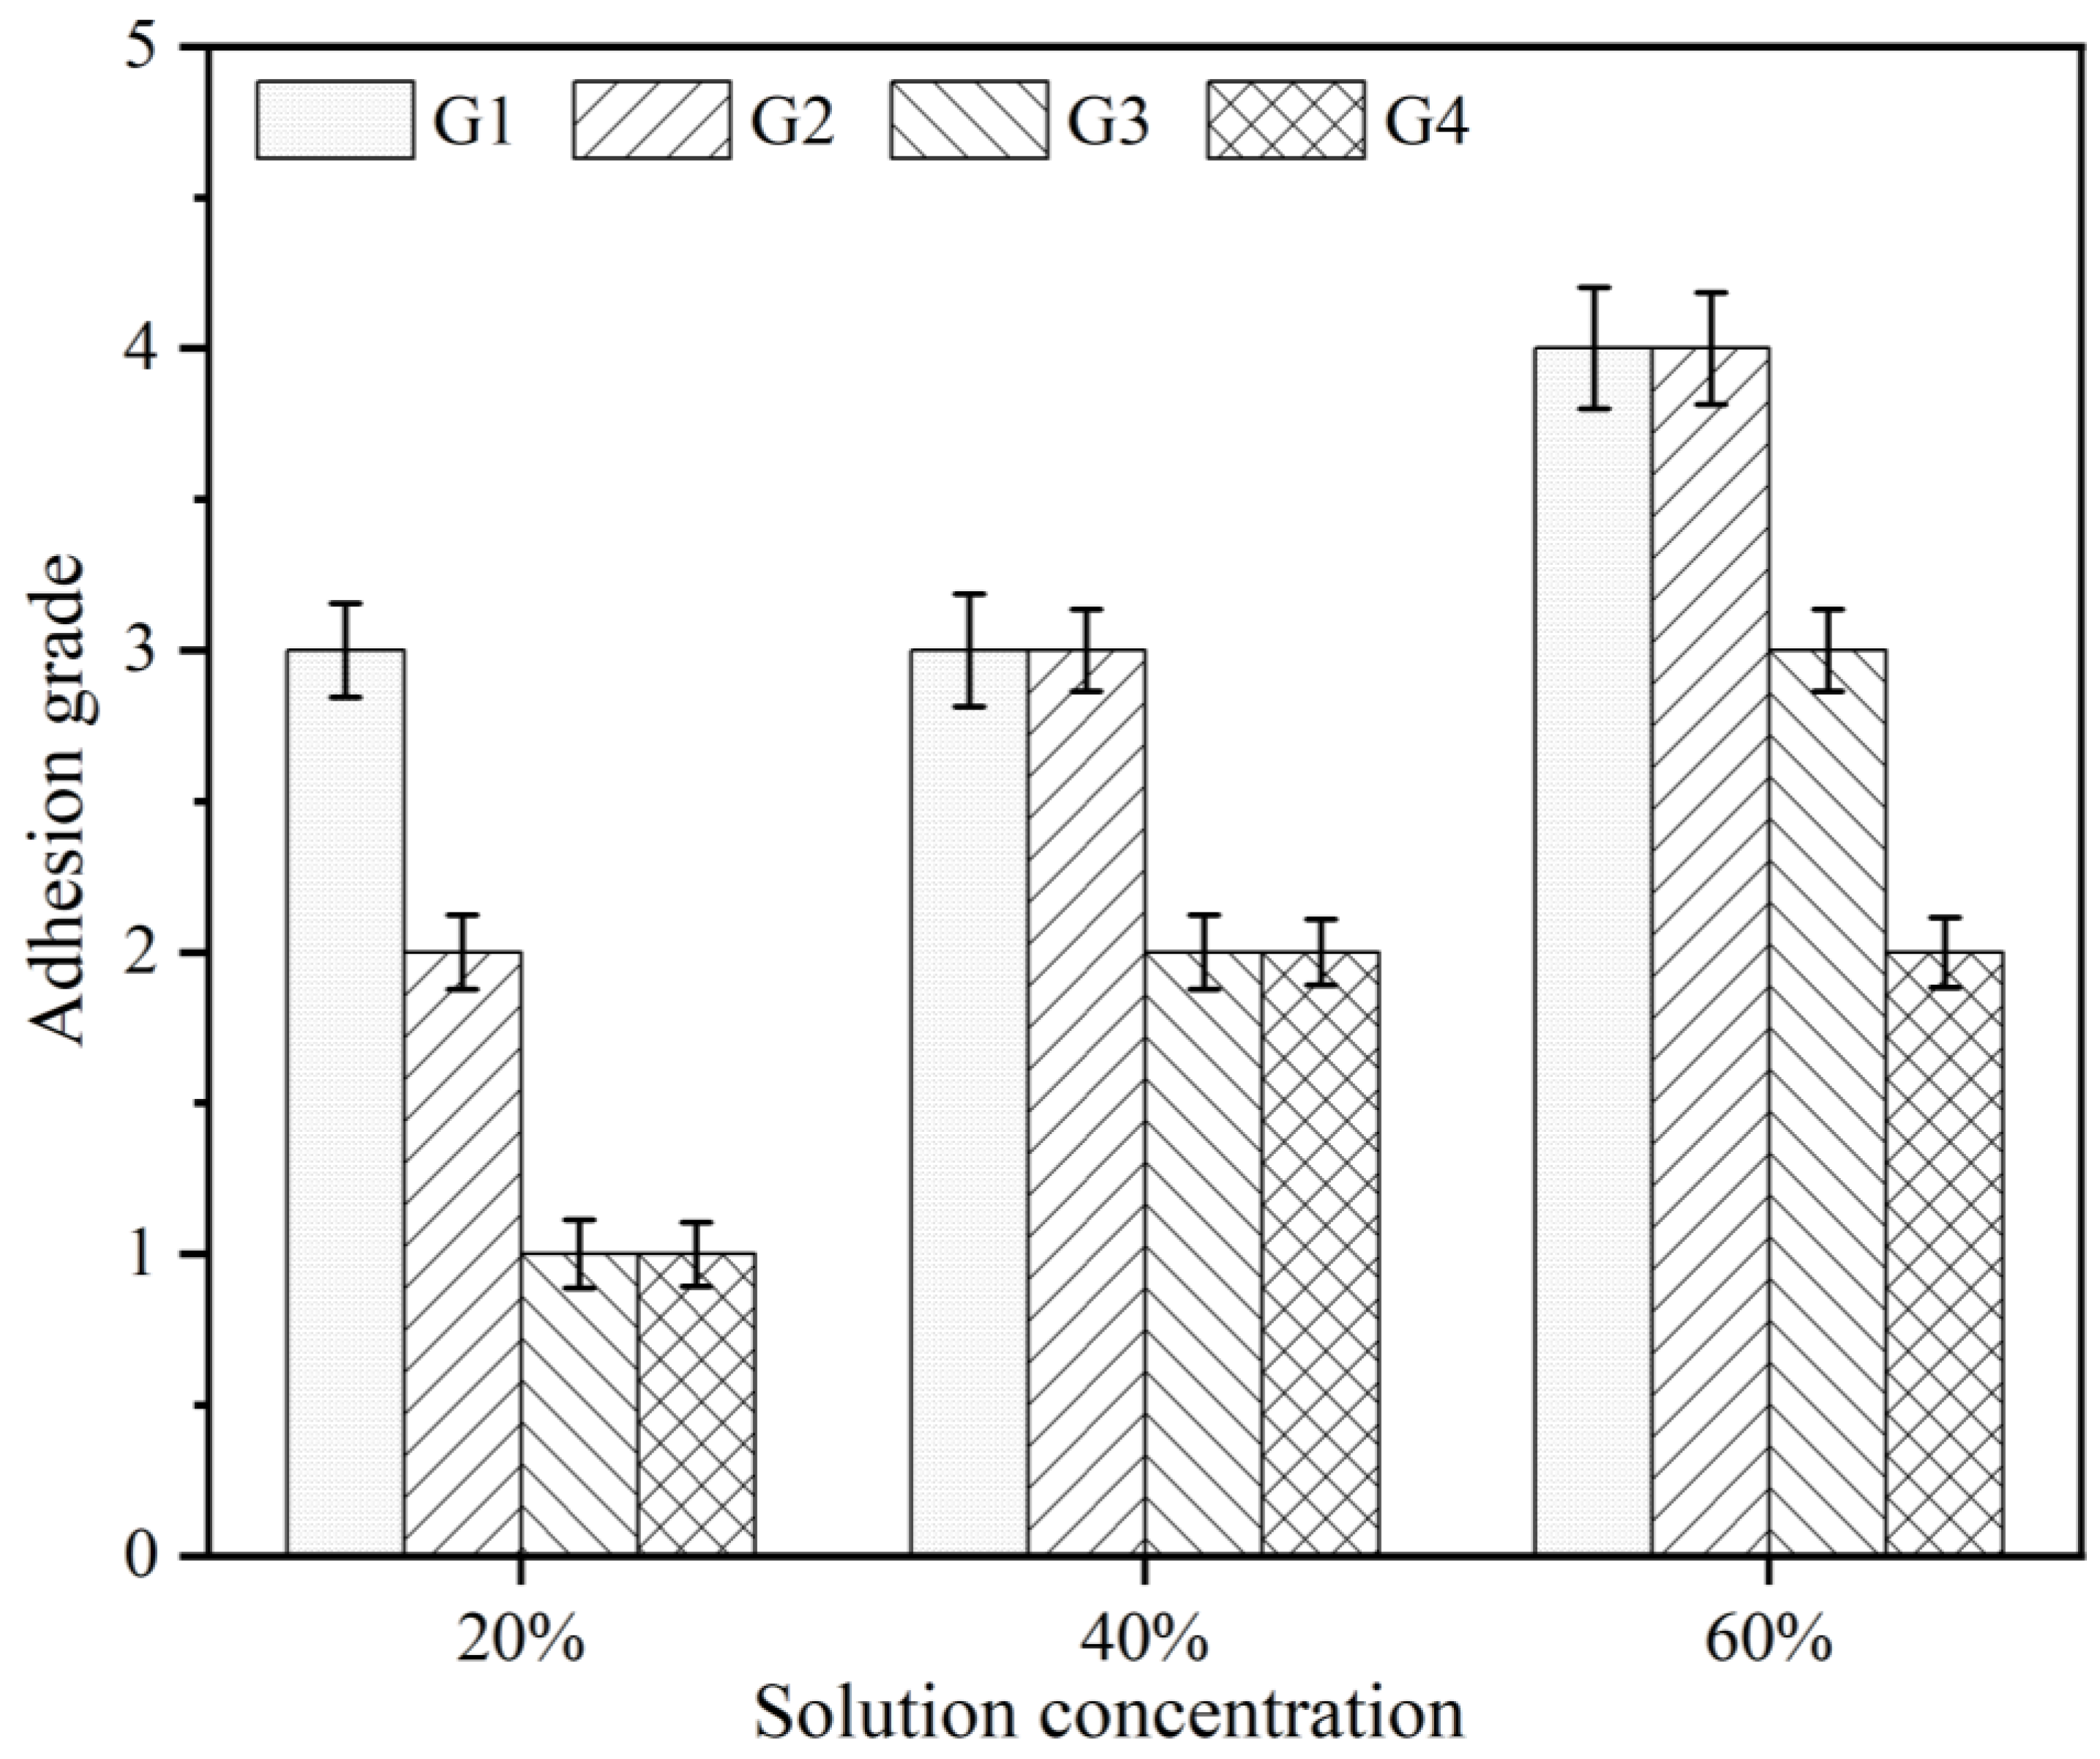
3.3. Adhesive Force
3.4. Electrochemical Testing
3.4.1. Open Circuit Potential Test
3.4.2. Electrochemical Impedance Spectroscopy
3.4.3. Tafel Curve Analysis
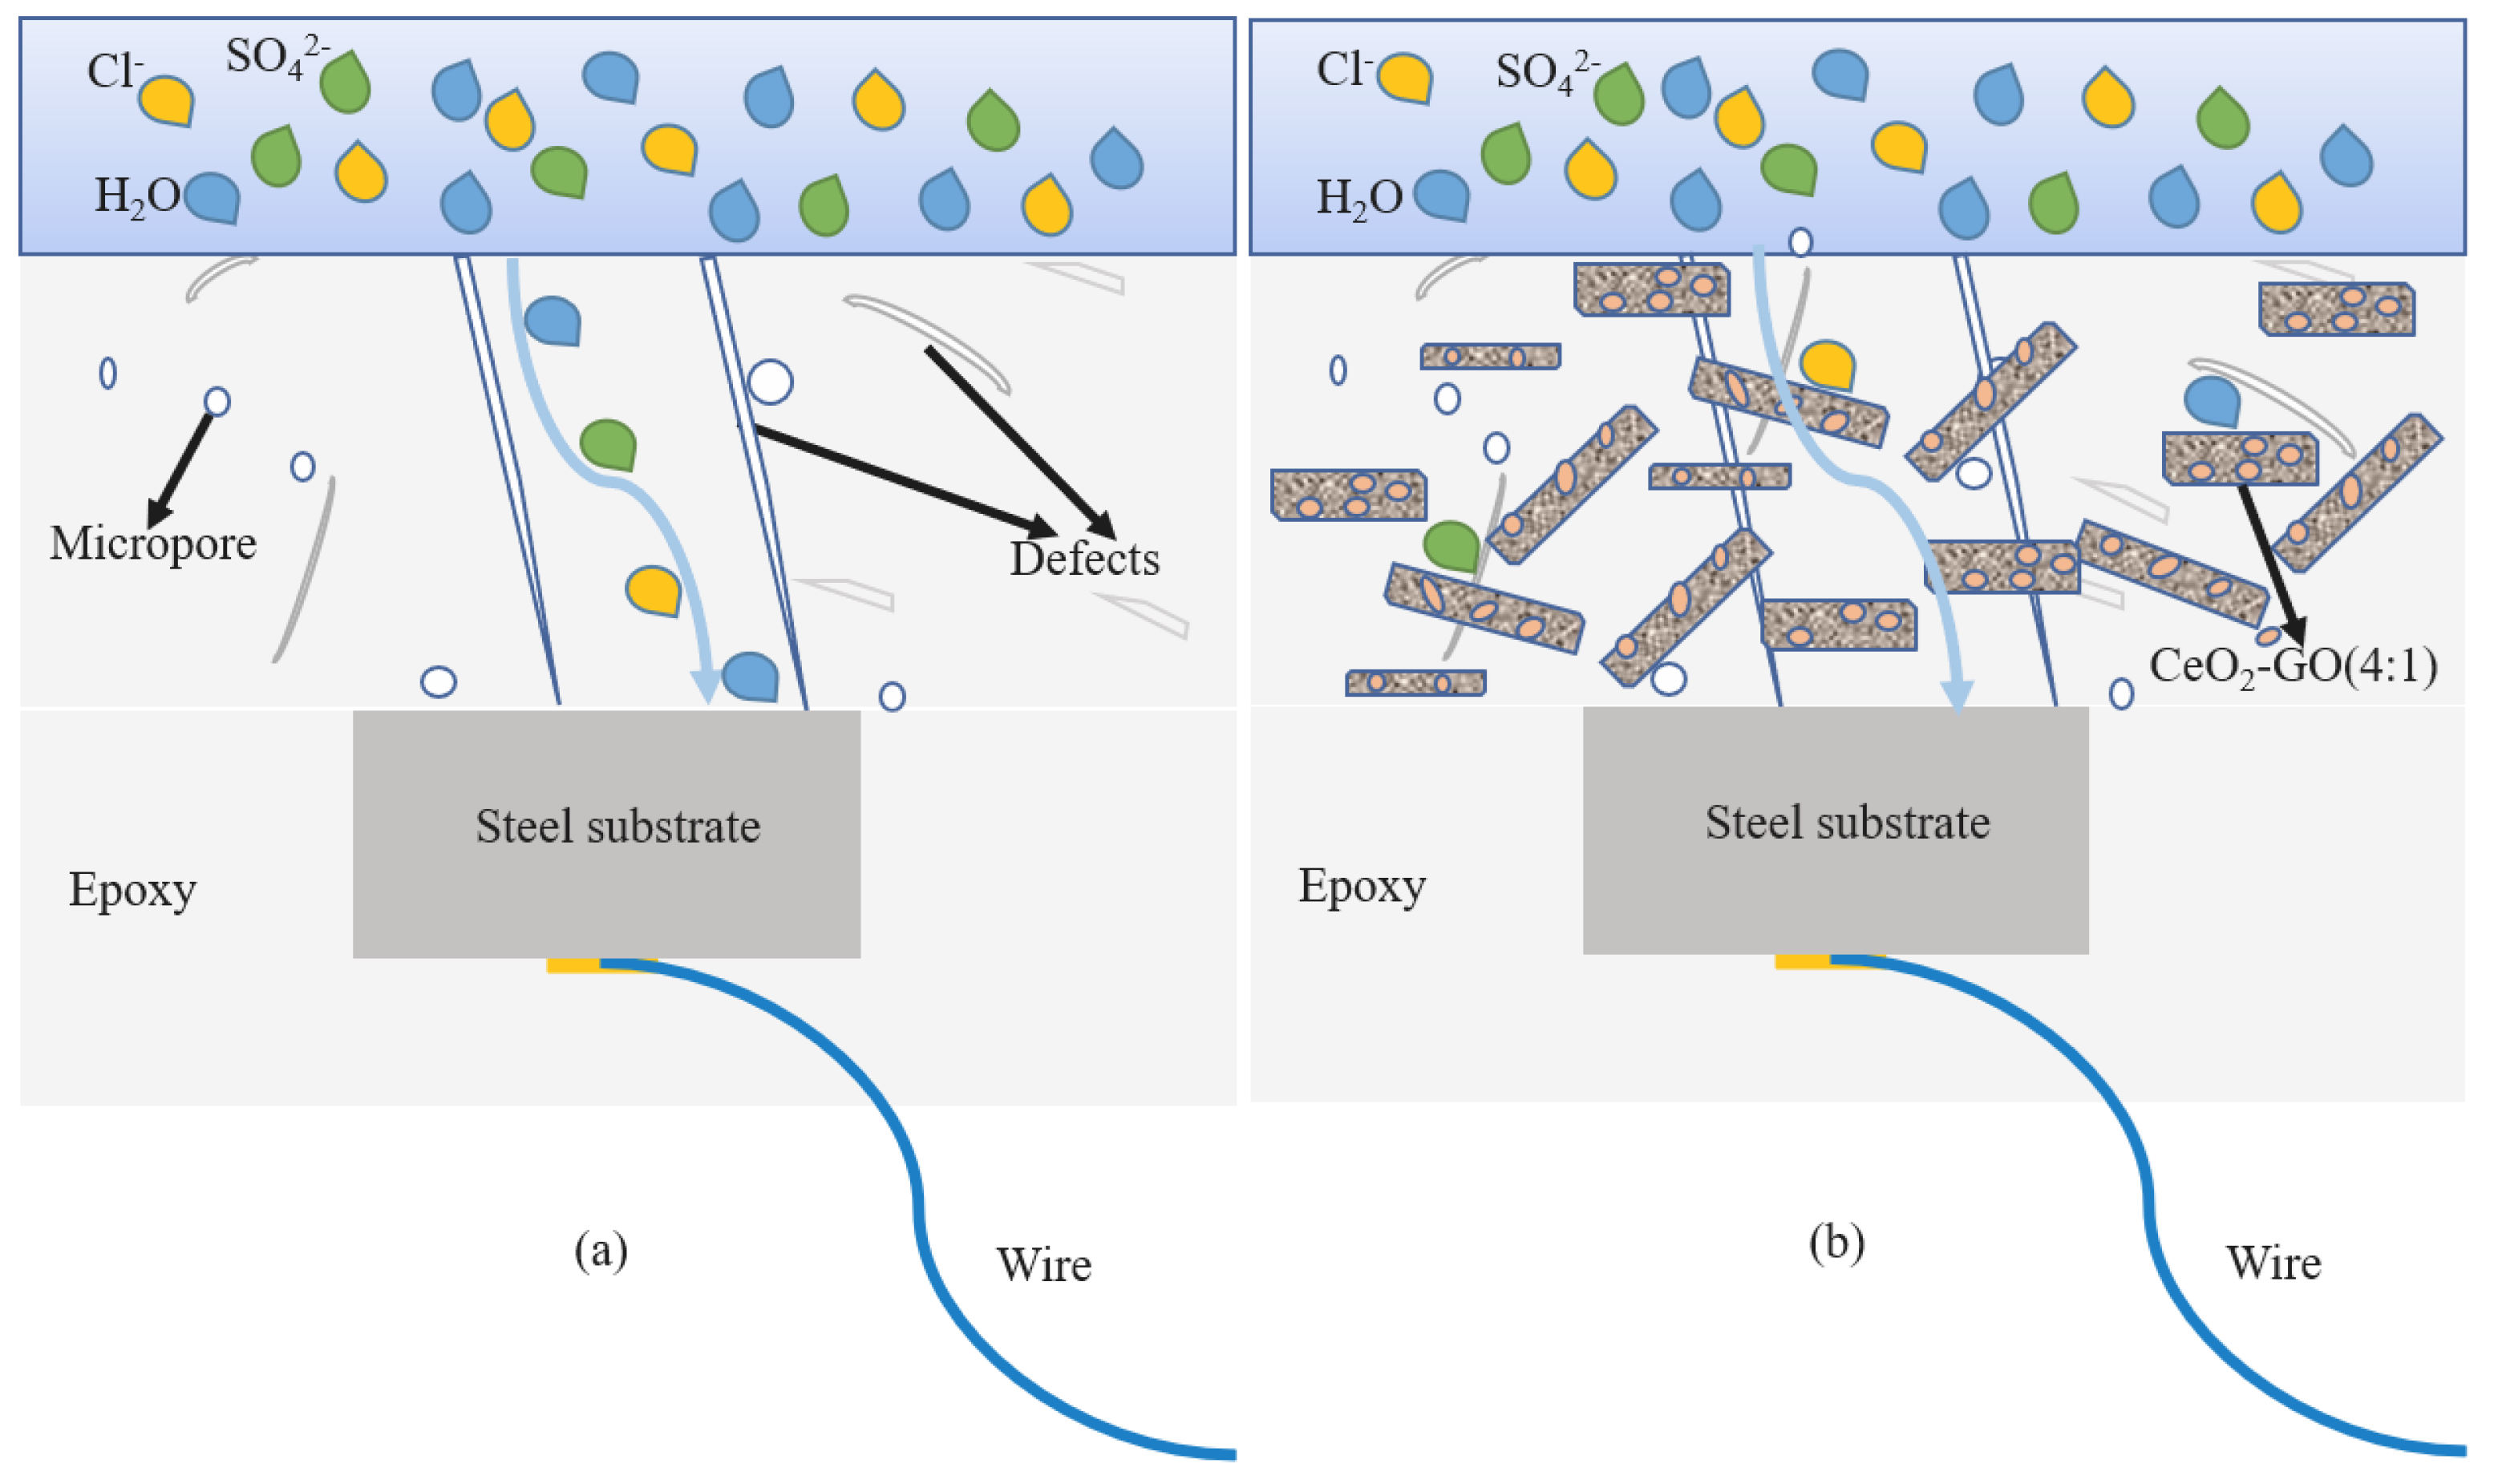
3.5. Discussion
4. Conclusions
Author Contributions
Funding
Institutional Review Board Statement
Data Availability Statement
Acknowledgments
Conflicts of Interest
References
- Ting, M.Z.Y.; Wong, K.S.; Rahman, M.E.; Meheron, S.J. Deterioration of marine concrete exposed to wetting-drying action. J. Clean. Prod. 2021, 278, 123383. [Google Scholar] [CrossRef]
- Ibrion, M.; Paltrinieri, N.; Nejad, A.R. Learning from failures: Accidents of marine structures on Norwegian continental shelf over 40 years time period. Eng. Fail. Anal. 2020, 111, 104487. [Google Scholar] [CrossRef]
- Navarro, I.J.; Yepes, V.; Martí, J.V.; González-Vidosa, F. Life cycle impact assessment of corrosion preventive designs applied to prestressed concrete bridge decks. J. Clean. Prod. 2018, 196, 698–713. [Google Scholar] [CrossRef]
- Ji, W.-F.; Ahmed, M.M.M.; Luo, K.-H.; Chen, K.-Y.; Lee, Y.-C.; Yeh, J.-M. Epoxy thermoset coatings with fine controllable hierarchical structures prepared from bio-inspired photo-/colloidal lithography technique for anticorrosion application. Prog. Org. Coat. 2021, 152, 106132. [Google Scholar] [CrossRef]
- Ren, B.; Li, Y.; Meng, D.; Li, J.; Gao, S.; Cao, R. Encapsulating polyaniline within porous MIL-101 for high-performance corrosion protection. J. Colloid Interface Sci. 2020, 579, 842–852. [Google Scholar] [CrossRef] [PubMed]
- Spencer, N.; Strobl, E.; Campbell, A. Sea level rise under climate change: Implications for beach tourism in the Caribbean. Ocean Coast. Manag. 2022, 225, 106207. [Google Scholar] [CrossRef]
- Alamri, A.H. Localized corrosion and mitigation approach of steel materials used in oil and gas pipelines—An overview. Eng. Fail. Anal. 2020, 116, 104735. [Google Scholar] [CrossRef]
- Lliso-Ferrando, J.; Gasch, I.; Martínez-Ibernón, A.; Valcuende, M. Effect of macrocell currents on rebar corrosion in reinforced concrete structures exposed to a marine environment. Ocean Eng. 2022, 257, 111680. [Google Scholar] [CrossRef]
- You, N.; Shi, J.; Zhang, Y. Corrosion behaviour of low-carbon steel reinforcement in alkali-activated slag-steel slag and Portland cement-based mortars under simulated marine environment. Corros. Sci. 2020, 175, 108874. [Google Scholar] [CrossRef]
- Feng, G.; Jin, Z.; Zhu, D.; Xiong, C.; Li, Z.; Wang, X. Corrosion propagation of steel reinforcement in pre-cracked mortar attacked by seawater using wire beam electrode. Corros. Sci. 2022, 208, 110655. [Google Scholar] [CrossRef]
- Hu, J.; Zhu, Y.; Hang, J.; Zhang, Z.; Ma, Y.; Huang, H.; Yu, Q.; Wei, J. The effect of organic core–shell corrosion inhibitors on corrosion performance of the reinforcement in simulated concrete pore solution. Constr. Build. Mater. 2021, 267, 121011. [Google Scholar] [CrossRef]
- Van Belleghem, B.; Maes, M.; Soetens, T. Throwing power and service life of galvanic cathodic protection with embedded discrete anodes for steel reinforcement in chloride contaminated concrete. Constr. Build. Mater. 2021, 310, 125187. [Google Scholar] [CrossRef]
- Sreehari, H.; Sethulekshmi, A.S.; Saritha, A. Bio Epoxy Coatings: An Emergent Green Anticorrosive Coating for the Future. Macromol. Mater. Eng. 2022, 307, 2200004. [Google Scholar] [CrossRef]
- Sheu, H.-H. Effect of Trimethylamine Borane (TMAB) on the Corrosion Resistance and Mechanical Properties of Nickel-Based Composite Coatings. Int. J. Electrochem. Sci. 2021. [Google Scholar] [CrossRef]
- Li, G.; Chen, L.; An, Y.; Gao, M.; Zhou, H.; Chen, J. Investigating the effect of polytetrafluoroethylene on the tribological properties and corrosion resistance of epoxy/hydroxylated hexagonal boron nitride composite coatings. Corros. Sci. 2023, 210, 110820. [Google Scholar] [CrossRef]
- Yu, C.; Zhang, M.; Xu, F.; Meng, L.; Wei, Y.; Chang, Y.; Zhang, M.; Fu, D.; Wang, H. A multiple synergistic composite coating with ultrahigh anti-corrosion performance under harsh oxygen environment. Corros. Sci. 2022, 208, 110696. [Google Scholar] [CrossRef]
- Zhao, H.; Ding, J.; Liu, P.; Yu, H. Boron nitride-epoxy inverse “nacre-like” nanocomposite coatings with superior anticorrosion performance. Corros. Sci. 2021, 183, 109333. [Google Scholar] [CrossRef]
- Ding, J.; Zhao, H.; Zhou, M.; Liu, P.; Yu, H. Super-anticorrosive inverse nacre-like graphene-epoxy composite coating. Carbon 2021, 181, 204–211. [Google Scholar] [CrossRef]
- Haddadi, S.A.; Mehmandar, E.; Jabari, H.; Ramazani S.A., A.; Mohammadkhani, R.; Yan, N.; Arjmand, M. Zinc-doped silica/polyaniline core/shell nanoparticles towards corrosion protection epoxy nanocomposite coatings. Compos. Part B Eng. 2021, 212, 108713. [Google Scholar] [CrossRef]
- Brand, S.; Veith, L.; Baier, R.; Dietrich, C.; Schmid, M.J.; Ternes, T.A. New methodical approaches for the investigation of weathered epoxy resins used for corrosion protection of steel constructions. J. Hazard. Mater. 2020, 395, 122289. [Google Scholar] [CrossRef]
- Qian, Y.; Zheng, W.; Chen, W.; Feng, T.; Liu, T.X.; Fu, Y.Q. Enhanced functional properties of CeO2 modified graphene/epoxy nanocomposite coating through interface engineering. Surf. Coat. Technol. 2021, 409, 126819. [Google Scholar] [CrossRef]
- Van Hau, T.; Van Trinh, P.; Van Tu, N.; Duoc, P.N.D.; Phuong, M.T.; Toan, N.X.; Phuong, D.D.; Nam, N.P.H.; Lam, V.D.; Minh, P.N.; et al. Electrodeposited nickel–graphene nanocomposite coating: Influence of graphene nanoplatelet size on wear and corrosion resistance. Appl. Nanosci. 2021, 11, 1481–1490. [Google Scholar] [CrossRef]
- Tian, Y.; Wang, W.; Zhong, L.; Jiang, X.; Zhang, X. Investigation of the anticorrosion properties of graphene oxide-modified waterborne epoxy coatings for AA6061. Prog. Org. Coat. 2022, 163, 106655. [Google Scholar] [CrossRef]
- Fan, X.; Xia, Y.; Wu, S.; Zhang, D.; Oliver, S.; Chen, X.; Lei, L.; Shi, S. Covalently immobilization of modified graphene oxide with waterborne hydroxyl acrylic resin for anticorrosive reinforcement of its coatings. Prog. Org. Coat. 2022, 163, 106685. [Google Scholar] [CrossRef]
- Ramezanzadeh, B.; Ahmadi, A.; Mahdavian, M. Enhancement of the corrosion protection performance and cathodic delamination resistance of epoxy coating through treatment of steel substrate by a novel nanometric sol-gel based silane composite film filled with functionalized graphene oxide nanosheets. Corros. Sci. 2016, 109, 182–205. [Google Scholar] [CrossRef]
- Song, R.; Zhang, S.; He, Y.; He, T.; Li, H.; Liu, B.; Zhang, Z.; He, Y. Silicon nitride nanoparticles reinforced the corrosion resistance of Ni-Cu composite coating in simulated seawater solution. Colloids Surf. A Physicochem. Eng. Asp. 2022, 649, 129427. [Google Scholar] [CrossRef]
- Javidparvar, A.A.; Naderi, R.; Ramezanzadeh, B. Epoxy-polyamide nanocomposite coating with graphene oxide as cerium nanocontainer generating effective dual active/barrier corrosion protection. Compos. Part B Eng. 2019, 172, 363–375. [Google Scholar] [CrossRef]
- Tsai, P.-Y.; Chen, T.-E.; Lee, Y.-L. Development and Characterization of Anticorrosion and Antifriction Properties for High Performance Polyurethane/Graphene Composite Coatings. Coatings 2018, 8, 250. [Google Scholar] [CrossRef]
- Ahmadi, A.; Ramezanzadeh, B.; Mahdavian, M. Hybrid silane coating reinforced with silanized graphene oxide nanosheets with improved corrosion protective performance. RSC Adv. 2016, 6, 54102–54112. [Google Scholar] [CrossRef]
- Godugu, C.; Khurana, A.; Saifi, M.A. Rare earth cerium oxide nanoparticles attenuated liver fibrosis in bile duct ligation mice model. J. Trace Elem. Med. Biol. 2023, 75, 127102. [Google Scholar] [CrossRef]
- Tan, P.; Shu, X.; Wen, M.; Li, L.; Lu, Y.; Lu, X.; Chen, S.; Dong, F. Characteristics of cerium doped aluminosilicate glass as simulated radioactive waste forms: Effect on structures and properties. Prog. Nucl. Energy 2022, 150, 104299. [Google Scholar] [CrossRef]
- Taniguchi, M.M.; da Silva, E.; da Silva, M.A.T.; Herculano, L.S.; Muniz, R.F.; Sandrini, M.; Belançon, M.P. The role of Ce3+/Ce4+ in the spectroscopic properties of cerium oxide doped zinc-tellurite glasses prepared under air. J. Non-Cryst. Solids 2020, 547, 120307. [Google Scholar] [CrossRef]
- Sandrini, M.; Gemelli, J.C.; Gibin, M.S.; Zanuto, V.S.; Muniz, R.F.; de Vicente, F.S.; Belançon, M.P. Synthesis and properties of Cerium-doped organic/silica xerogels: A potential UV filter for photovoltaic panels. J. Non-Cryst. Solids 2023, 600, 122033. [Google Scholar] [CrossRef]
- Jayakumar, G.; Irudayaraj, A.A.; Raj, A.D.; Sundaram, S.J.; Kaviyarasu, K. Electrical and magnetic properties of nanostructured Ni doped CeO2 for optoelectronic applications. J. Phys. Chem. Solids 2022, 160, 110369. [Google Scholar] [CrossRef]
- Liu, X.Y.; Jie, H.D.; Liu, R.D.; Liu, Y. Research on the Preparation and Anticorrosion Properties of EP/CeO2-GO Nanocomposite Coating. Polymers 2021, 13, 183. [Google Scholar] [CrossRef] [PubMed]
- Liu, R.; Liu, X.; Yang, H.; Jie, H.; Li, T.; Lyu, K.; Shah, S.P. Effect of CeO2-GO Nanocomposite on the Anticorrosion Properties of Epoxy Coating in Simulated Acid Rain Solution. Polymers 2022, 14, 3573. [Google Scholar] [CrossRef]
- Lu, Y.; Chen, Z.; Wang, C.; Zhao, Q.; Zhang, K.; Du, Y.; Xin, L.; Zhu, S.; Wang, F. Protection of 304 stainless steel by nano-modified silicone coating in cyclically alternate corrosion environment. Corros. Sci. 2021, 190, 109712. [Google Scholar] [CrossRef]
- Liu, X.; Yue, T.; Qi, K.; Xia, B.Y.; Chen, Z.; Qiu, Y.; Guo, X. Probe into metal-organic framework membranes fabricated via versatile polydopamine-assisted approach onto metal surfaces as anticorrosion coatings. Corros. Sci. 2020, 177, 108949. [Google Scholar] [CrossRef]
- Zhao, P.; Yan, J.; Yan, H.; Zhou, S.; Huang, J.; Wu, X.; Zhao, G.; Liu, Y. Wear and corrosion resistance of self-healing epoxy coatings filled by polydopamine-modified graphene oxide assembly of polysulfone double-walled microcapsules. Prog. Org. Coat. 2023, 177, 107416. [Google Scholar] [CrossRef]
- Runci, A.; Provis, J.L.; Serdar, M. Revealing corrosion parameters of steel in alkali-activated materials. Corros. Sci. 2023, 210, 110849. [Google Scholar] [CrossRef]
- Cai, G.; Xiao, S.; Deng, C.; Jiang, D.; Zhang, X.; Dong, Z. CeO2 grafted carbon nanotube via polydopamine wrapping to enhance corrosion barrier of polyurethane coating. Corros. Sci. 2021, 178, 109014. [Google Scholar] [CrossRef]
- Chen, Y.; Wu, L.; Yao, W.; Chen, Y.; Zhong, Z.; Ci, W.; Wu, J.; Xie, Z.; Yuan, Y.; Pan, F. A self-healing corrosion protection coating with graphene oxide carrying 8-hydroxyquinoline doped in layered double hydroxide on a micro-arc oxidation coating. Corros. Sci. 2022, 194, 109941. [Google Scholar] [CrossRef]
- Morozov, Y.; Calado, L.M.; Shakoor, R.A.; Raj, R.; Kahraman, R.; Taryba, M.G.; Montemor, M.F. Epoxy coatings modified with a new cerium phosphate inhibitor for smart corrosion protection of steel. Corros. Sci. 2019, 159, 108128. [Google Scholar] [CrossRef]


| Chemical Composition | C | Mn | Si | S | P | O | N | Fe |
|---|---|---|---|---|---|---|---|---|
| wt/(%) | 0.15 | 0.68 | 0.12 | 0.026 | 0.023 | 0.01 | 0.003 | 98.988 |
| Colour | pH Value | Density (g/cm2) | Corrosion Inhibition Rate |
|---|---|---|---|
| Light yellow to brownish red transparent liquid | 9 | 1.030 | >99.3% |
| Coating Sample | Composite Corrosion Solutions | Metal Substrate | |||
|---|---|---|---|---|---|
| G1 | G2 | G3 | G4 | ||
| EP | EP+corrosion inhibitor | (CeO2-GO)/EP | (CeO2-GO)/EP+corrosion inhibitor | Simulated seawater and concrete pore liquid | Q235 low carbon steel |
| Component | Concentration (g·L−1) | ||
|---|---|---|---|
| 20% | 40% | 60% | |
| SrCl2·6H2O | 0.025 | 0.05 | 0.075 |
| MgCl2·6H2O | 5.20 | 10.4 | 15.6 |
| CaCl2 | 1.16 | 2.32 | 3.48 |
| NaF | 0.003 | 0.006 | 0.009 |
| KCl | 0.695 | 1.39 | 2.085 |
| NaHCO3 | 0.201 | 0.402 | 0.603 |
| KBr | 0.101 | 0.202 | 0.303 |
| H3BO3 | 0.027 | 0.054 | 0.081 |
| NaCl | 24.53 | 24.53 | 24.53 |
| Na2SO4 | 4.09 | 8.18 | 12.27 |
| Ca(OH)2 | Adjust the pH of the solution to 12.5 | ||
| Adhesion Level/Level | Peeling Area (%) |
|---|---|
| 0 | none |
| 1 | (0, 5) |
| 2 | (5, 15) |
| 3 | (15, 35) |
| 4 | (35, 65) |
| 5 | >65 |
| Test Items | OCP | EIS | Tafel |
|---|---|---|---|
| Full testing cycle (d) | 90 | 90 | 90 |
| Coating | Ecorr (V) | Icorr (A/cm2) | η (%) | Rp (ohm) |
|---|---|---|---|---|
| G1 | −0.772 | 1.322 × 10⁻⁶ | / | 5.739 × 10⁵ |
| G2 | −0.703 | 2.143 × 10⁻⁷ | 83.79 | 7.663 × 10⁶ |
| G3 | −0.586 | 1.435 × 10⁻⁸ | 98.91 | 5.372 × 10⁷ |
| G4 | −0.364 | 1.001 × 10⁻⁹ | 99.92 | 9.473 × 10⁸ |
| Coating | Ecorr (V) | Icorr (A/cm2) | η (%) | Rp (ohm) |
|---|---|---|---|---|
| G1 | −0.842 | 2.028 × 10⁻⁶ | / | 7.068 × 10⁵ |
| G2 | −0.729 | 5.072 × 10⁻⁷ | 74.99 | 2.300 × 10⁶ |
| G3 | −0.648 | 8.013 × 10⁻⁸ | 96.04 | 8.936 × 10⁶ |
| G4 | −0.483 | 3.942 × 10⁻⁸ | 98.06 | 3.110 × 10⁷ |
| Coating | Ecorr (V) | Icorr (A/cm2) | η (%) | Rp (ohm) |
|---|---|---|---|---|
| G1 | −0.882 | 3.592 × 10⁻⁶ | / | 5.946 × 10⁵ |
| G2 | −0.764 | 1.042 × 10⁻⁶ | 70.99 | 8.583 × 10⁵ |
| G3 | −0.685 | 3.972 × 10⁻⁷ | 88.94 | 2.839 × 10⁶ |
| G4 | −0.573 | 1.882 × 10⁻⁷ | 94.76 | 6.029 × 10⁶ |
Disclaimer/Publisher’s Note: The statements, opinions and data contained in all publications are solely those of the individual author(s) and contributor(s) and not of MDPI and/or the editor(s). MDPI and/or the editor(s) disclaim responsibility for any injury to people or property resulting from any ideas, methods, instructions or products referred to in the content. |
© 2023 by the authors. Licensee MDPI, Basel, Switzerland. This article is an open access article distributed under the terms and conditions of the Creative Commons Attribution (CC BY) license (https://creativecommons.org/licenses/by/4.0/).
Share and Cite
Liu, X.; Wu, Z.; Lyu, Y.; Li, T.; Yang, H.; Liu, Y.; Liu, R.; Xie, X.; Lyu, K.; Shah, S.P. Corrosion Resistance of CeO2-GO/Epoxy Nanocomposite Coating in Simulated Seawater and Concrete Pore Solutions. Polymers 2023, 15, 2602. https://doi.org/10.3390/polym15122602
Liu X, Wu Z, Lyu Y, Li T, Yang H, Liu Y, Liu R, Xie X, Lyu K, Shah SP. Corrosion Resistance of CeO2-GO/Epoxy Nanocomposite Coating in Simulated Seawater and Concrete Pore Solutions. Polymers. 2023; 15(12):2602. https://doi.org/10.3390/polym15122602
Chicago/Turabian StyleLiu, Xiaoyan, Zitao Wu, Yaoyao Lyu, Tianyu Li, Heng Yang, Yanqi Liu, Ruidan Liu, Xian Xie, Kai Lyu, and Surendra P. Shah. 2023. "Corrosion Resistance of CeO2-GO/Epoxy Nanocomposite Coating in Simulated Seawater and Concrete Pore Solutions" Polymers 15, no. 12: 2602. https://doi.org/10.3390/polym15122602
APA StyleLiu, X., Wu, Z., Lyu, Y., Li, T., Yang, H., Liu, Y., Liu, R., Xie, X., Lyu, K., & Shah, S. P. (2023). Corrosion Resistance of CeO2-GO/Epoxy Nanocomposite Coating in Simulated Seawater and Concrete Pore Solutions. Polymers, 15(12), 2602. https://doi.org/10.3390/polym15122602