Article

A Label-Free Electrochemical Biosensor for Homocysteine Detection Using Molecularly Imprinted Polymer and Nanocomposite-Modified Electrodes

by
Unchalee Kongintr
1,2,
Benchaporn Lertanantawong
1 and
Chamras Promptmas
1,*
1
Biosensor Laboratory, Department of Biomedical Engineering, Faculty of Engineering, Mahidol University, Nakhon Pathom 73170, Thailand
2
Faculty of Medical Technology, Huachiew Chalermprakiat University, Samut Prakan 10540, Thailand
*
Author to whom correspondence should be addressed.
Polymers 2023, 15(10), 2241; https://doi.org/10.3390/polym15102241
Submission received: 16 April 2023 / Revised: 2 May 2023 / Accepted: 8 May 2023 / Published: 9 May 2023
(This article belongs to the Special Issue Advance in Molecularly Imprinted Polymers II)

Abstract

:
An essential biomarker for the early detection of cardiovascular diseases is serum homocysteine (Hcy). In this study, a molecularly imprinted polymer (MIP) and nanocomposite were used to create a label-free electrochemical biosensor for reliable Hcy detection. A novel Hcy-specific MIP (Hcy-MIP) was synthesized using methacrylic acid (MAA) in the presence of trimethylolpropane trimethacrylate (TRIM). The Hcy-MIP biosensor was fabricated by overlaying the mixture of Hcy-MIP and the carbon nanotube/chitosan/ionic liquid compound (CNT/CS/IL) nanocomposite on the surface of a screen-printed carbon electrode (SPCE). It showed high sensitivity, with a linear response of 5.0 to 150 µM (R2 of 0.9753) and with a limit of detection (LOD) at 1.2 µM. It demonstrated low cross-reactivity with ascorbic acid, cysteine, and methionine. Recoveries of 91.10–95.83% were achieved when the Hcy-MIP biosensor was used for Hcy at 50–150 µM concentrations. The repeatability and reproducibility of the biosensor at the Hcy concentrations of 5.0 and 150 µM were very good, with coefficients of variation at 2.27–3.50% and 3.42–4.22%, respectively. This novel biosensor offers a new and effective method for Hcy assay compared with the chemiluminescent microparticle immunoassay at the correlation coefficient (R2) of 0.9946.

1. Introduction

Cardiovascular disease diagnosis is gaining great attention globally because of its prevalence and the high mortality rate. Methods for the detection of early inflammation in cardiovascular disease include screening methods such as blood pressure tests, electrocardiography (ECG), exercise stress tests, and CT scans [1]. Increased levels of cardiovascular disease markers in human serum, which are creatinine kinase MB subform (CK-MB), Troponin I (cTnI), Troponin T (cTnT), Myoglobin, C-reactive protein (CRP), Myeloperoxidase (MPO), heart fatty acid binding protein (H-FABP), and homocysteine (Hcy), are a reliable symptom associated with cardiovascular disease patients. The determination of inflammation via cardiovascular markers plays an important role in the early diagnosis of cardiovascular disease [2,3,4]. In clinical laboratory assays, the detection methods for cardiovascular markers include high-performance liquid chromatography [5,6,7,8,9,10], gas chromatography–mass spectrometry (GC-MS) [11,12], capillary electrophoresis [13,14], and photoluminescence assays [15]. All these methods require laborious derivatization processing and sophisticated instruments. This is a time-consuming process. The operation costs of specific instruments and reagents also limit their wider application in clinical laboratories. Hence, the assay method based on the immunological reaction was developed, with its low operation costs and suitability for point-of-care testing [16,17,18,19].
Recently, the electrochemical method for Hcy detection was extensively developed using enzyme-based electrodes [20,21] and screen-printed electrodes (SPE) [22]. The screen-printed electrode is versatile, simple, low-cost, easily operated, small-sized, portable, and capable of mass production. To improve the electrochemical signal, nanomaterials were applied to SPE, such as gold nanoparticles [23,24,25], carbon nanotubes [26,27,28], graphene [29,30], and nanocomposite materials [31]. The sensitivity of Hcy detection was noticeably improved by applying quantum dots to the assay platform [15,32,33].
To date, the aptamers and the molecularly imprinted polymers (MIPs) have attracted substantial interest as a biomimetic recognition element to solve the limitations of antibodies. They exhibit interesting selectivity and high affinity in binding to specific targets such as antibodies, but demonstrate more stability and reusability than antibodies [34,35,36,37,38]. The aptamer has been established for Hcy detection using voltammetric assays and optical detection methods [39,40,41,42]. They showed superior signal detection performance, specificity, reproducibility, and acceptable accuracy when working with real serum samples [39,40,41,42].
Generally, MIPs are synthesized by the polymerization of functional monomers and cross-linker monomers, which have prior interactions with target molecules, as a template. After polymerization, the template is subsequently removed from the complex matrix to open cavities with a size and shape complementary to the template. MIPs function as artificial specific receptors to target molecules with a binding function, such as antibodies [43]. To date, MIPs have been reported as selective recognition elements for a range of both biological and chemical molecules, including amino acids and proteins [44,45,46] and drugs [47], because of their robustness and tolerance to ambient temperatures.
MIPs for Hcy have been fabricated and applied for Hcy detection by in situ fluorescent derivatizations in the optical sensor system. None of the analytical characteristics have been presented due to the sensitivity of detection, which needs to be improved in practical applications [45]. Recently, the use of electrochemical methods incorporating MIPs has emerged as a well-established analytical technique employing the concept of the selective uptake of an analyte of interest and subsequent generation of a characteristic electrochemical signal.
In this research, a label-free electrochemical biosensor system for the detection of serum Hcy was created by the surface modification of screen-printed carbon electrodes (SPCE) with the combination of synthesized MIPs and a nanocomposite (carbon nanotube/chitosan/ionic liquid). MIP-modified carbon paste electrodes were fabricated, characterized, and applied for the electrochemical detection of Hcy by differential pulse voltammetry. This novel detection system provides a promising solution for the preliminary detection of hyperhomocysteinemia and other diseases associated with homocysteine.

2. Materials and Methods

2.1. Chemicals and Specimens

Homocysteine (Hcy), methacrylic acid (MAA), 2,2′-azobis(2-methylpropio nitrile) (AIBN), trimethylolpropane trimethacrylate (TRIM), methionine, cysteine, L-ascorbic acid, multi-walled carbon nanotubes (MWCNT-COOH) (outer diameter x length 7–15 nm x 0.5–10 µm), 1-butyl-3-methylimidazolium tetrafluoroborate (BF4) and potassium chloride (KCl), methanol, acetic acid, potassium hexacyanoferrate (K4[Fe(CN)6]), and chitosan (CS) were obtained from Merck KGaA, Darmstadt, Germany. All chemicals were of analytical grade and all solutions were prepared with ultrapure water (resistivity ≥ 18 MΩ cm) from a Millipore Milli Q system obtained from Merck KGaA, Darmstadt, Germany. All the solutions for electrochemical analysis were dissolved in 0.1 M phosphate buffer solution (PBS), pH 7.
Eighteen anonymous serum samples were left-over samples from the Clinical Chemistry Laboratory Service Unit of the Faculty of Medical Technology, Huachiew Chalermprakiat University.

2.2. Apparatus

A Thermo Scientific Nicolet iS5 FTIR Spectrometer from Thermo Fisher Scientific Inc. (Waltham, MA, USA) was used to record the Fourier transform infrared (FTIR) spectra. An ER466, eDAQ electrochemical workstation from eDAQ Pty Ltd. (Sydney, NSW, Australia), coupled with a three-electrode cell format, was used for cyclic voltammetric (CV) and differential pulse voltammetric (DPV) studies. Triple screen-printed carbon electrodes (SPCE) of 3 mm diameter carbon working electrodes, a solid-state silver/silver chloride (Ag/AgCl) reference electrode, and carbon counter-electrodes were obtained from Quasense Co., Ltd., Bangkok, Thailand.

2.3. Procedures

This platform uses molecularly imprinted polymer and nanocomposite-modified working carbon paste electrodes. The SPCE was fabricated with the mixture of Hcy-MIP and the CNT/CS/IL nanocomposite to obtain a Hcy-MIP biosensor electrode, as shown in Figure 1a. The Hcy in the serum sample binds with Hcy-MIP on the surface of the electrode. As illustrated in Figure 1b, this binding event can be identified by measuring the electrochemical signal of differential pulse voltammetry (DPV) employing K4[Fe(CN)6]3−/4−.

2.3.1. Preparation of Molecularly Imprinted Polymers

According to Chow et al. [45], the molecularly imprinted polymer (MIP) was created via precipitation polymerization with Hcy as the target molecule. The mixture solution containing 1 mM Hcy as a molecular template and 2 mM MAA as a functional monomer in 50 mL of methanol was agitated for 12 h. The monomer mixture was then mixed with 10 mM TRIM as a cross-linking agent and 1 mM AIBN as a radical-induced polymerization initiator. The mixture was agitated for 15 min under a nitrogen atmosphere and maintained at 60 °C for 24 h to complete polymerization. The polymerized product of Hcy containing MIP was decanted and washed with methanol. The Hcy template was eliminated by refluxing with 100 mL of a 10% NaOH solution for 1 h, followed by cleaning with a 1% acetic acid solution and deionized water (DI) until the product suspension reached a pH of 7.0. The Hcy-MIP precipitate was filtered and dried with acetone. A non-imprinted polymer (NIP) was created by using the Hcy-MIP preparation procedure without exposure of Hcy.

2.3.2. Preparation of CNT/CS/IL Nanocomposite

The nanocomposite for the Hcy-MIP biosensor was prepared according to Gopalan et al. [48] by dispersing 1 mg of MWCNT in 1 mL DI water with sonication for 2 h. The solution of 0.1% chitosan (CS) in acetic acid was dropped into the CNT suspension and sonicated for 1 h. To form a complete CNT/CS/IL nanocomposite, 10 µL of BF4 was added and it was sonicated for 30 min.

2.3.3. Hcy-MIP Electrode Fabrication

The Hcy-MIP biosensor was fabricated by the modification of SPCE with the mixture of Hcy-MIP and the CNT/CS/IL nanocomposite. The Hcy-MIP electrode was prepared by overlaying the surface of SPCE with 1 µL of a CNT/CS/IL nanocomposite suspension containing Hcy-MIP at the optimal concentration for 1 h at room temperature.
After being air dried, this Hcy-MIP-modified electrode was kept at 4 °C. An identical process to that used to generate the Hcy-MIP-modified electrode was used to prepare the NIP-modified electrode, but only NIP was used in place of Hcy-MIP. The optimal response to Hcy was examined for the concentrations of Hcy-MIP of 5, 25, 50, 75, 100, and 150 µM. The Hcy-MIP- and NIP-modified electrodes were characterized by a Nicolet 6700 FTIR spectrometer to demonstrate the chemical bonding on the tested surface. The attenuated total reflectance (ATR) mode IR spectrum was recorded in the range of 4000 to 625 cm−1 at a resolution of 2 cm−1 with 64 scans.

2.3.4. Characterization and Electroanalytical Measurements of the Hcy-MIP Electrodes

The Hcy-MIP-modified electrodes were characterized by cyclic voltammetry (CV) and differential pulse voltammetry (DPV) using K4[Fe(CN)6]3−/4− as an electroactive probe molecule. The electrochemical behavior of Hcy-MIP/CNT/CS/IL/SPCE in 10 mM ferro-ferricyanide (K4[Fe(CN)6]) and 1 M KCl in 0.1 M PBS pH 7.0 was investigated and compared with that of non-modified and NIP modified electrodes. The electrochemical signals of the non-modified, Hcy-MIP-, and NIP-modified electrodes were investigated in the same solution unless mentioned otherwise. In this investigation, CV analyses were performed at a scan rate of 10 mV/s in the potential range of −0.5 to 0.8 V. DPVs were conducted in the same potential range with an amplitude of 0.05 V, pulse width of 0.05 s, and a pulse period of 0.5 s. Prior to recording the response, the electrode was given 10 min to interact with the analyte.

2.3.5. Determination of Homocysteine

The studies were conducted in their entirety at room temperature. The reaction of the Hcy-MIP biosensor started by applying 150 µL of Hcy standard solution or tested sample and allowing its complete interaction with the active sites on the Hcy-MIP biosensor surface for 10 min. The electrode was then carefully cleansed with deionized water to remove any potential non-specific binding substances. The DPV peak current of K4[Fe(CN)6 was observed from the reaction using the DPV and scanning the electrode potential from −0.5 to 0.8 V. DPVs were recorded for the Hcy-MIP biosensor.
The optimal conditions for the Hcy-MIP biosensor were investigated, namely the appropriate incubation time, pH, and Hcy concentration for an effective Hcy measurement. The Hcy-MIP biosensor was connected to an ER466, eDAQ electrochemical workstation as the DPV signal detection system. To accomplish the function of the Hcy-MIP biosensor, 150 µL of 100 µM Hcy in 0.1 M PBS, pH 7.0, with 1 M KCl was applied to the Hcy-MIP biosensor and incubated at different times from 1 to 30 min; it was then washed out to avoid any possible non-specific interaction by rinsing with DI water. The peak current of K4[Fe(CN)6 was observed from the reaction using the DPV by scanning the electrode potential from −0.5 to 0.8 V to obtain an appropriate incubation time for Hcy determination. To obtain the optimal pH and Hcy concentrations in the reaction, 0.1 M PBS at a pH of 7.0, 7.2, 7.4, 7.8, and 8.0, and Hcy solutions at concentrations of 5, 25, 50, 75, 100, and 150 µM, were applied to the Hcy-MIP biosensor for 10 min. The current signals of K4[Fe(CN)6]3−/4− were then recorded by scanning the electrode potential from −0.5 to 0.8 V after rinsing with DI water.
The optimal reaction time, reaction pH, and dose response for Hcy detection were obtained by plotting the peak current from the DPV against the incubation time, the pH of the buffer, and the Hcy concentrations, respectively.

2.3.6. Evaluation of Hcy-MIP Biosensor Performance

The analytical precision of Hcy detection by the Hcy-MIP biosensor was determined via the intra- and inter-assay variation by measuring Hcy at the concentration of 5 and 150 µM. Both the intra- and inter-assay variation were obtained via 20 measurements and each measurement was conducted in triplicate under optimal conditions. The mean of the replicates and the standard deviation (SD) were used to calculate the coefficient of variation (CV) of this evaluation.
The limit of detection (LOD) of Hcy was determined using the 3-standard-deviation (3SD) values of the test results of 1 M Hcy in PBS, pH 7.0, under optimal conditions with 10 repetitions.
The analytical accuracy of the Hcy-MIP biosensor was determined via a recovery assay. A spike recovery was employed by adding known concentrations of 50, 75, 100, and 150 µM Hcy. The recovery as a percentage was calculated as the ratio of the observed Hcy concentration to that of the spiked concentration.
The specificity of the assay was evaluated by exposing the Hcy-MIP biosensor to 500 µM of several physiological substances: cysteine, methionine, glutathione, and ascorbic acid. The analysis was performed under the same procedure as the Hcy assay.
Additionally, the performance of the Hcy-MIP biosensor was evaluated by determining the Hcy concentration in the serum sample. The Hcy-MIP biosensor measurement and the chemiluminescent microparticle immunoassay (CMIA) method often used in clinical laboratories were compared using 18 serum samples. The correlation between these two measuring techniques was assessed using paired-sample t-test analysis and correlation analysis.

3. Results and Discussion

3.1. Characterization of Hcy-MIP

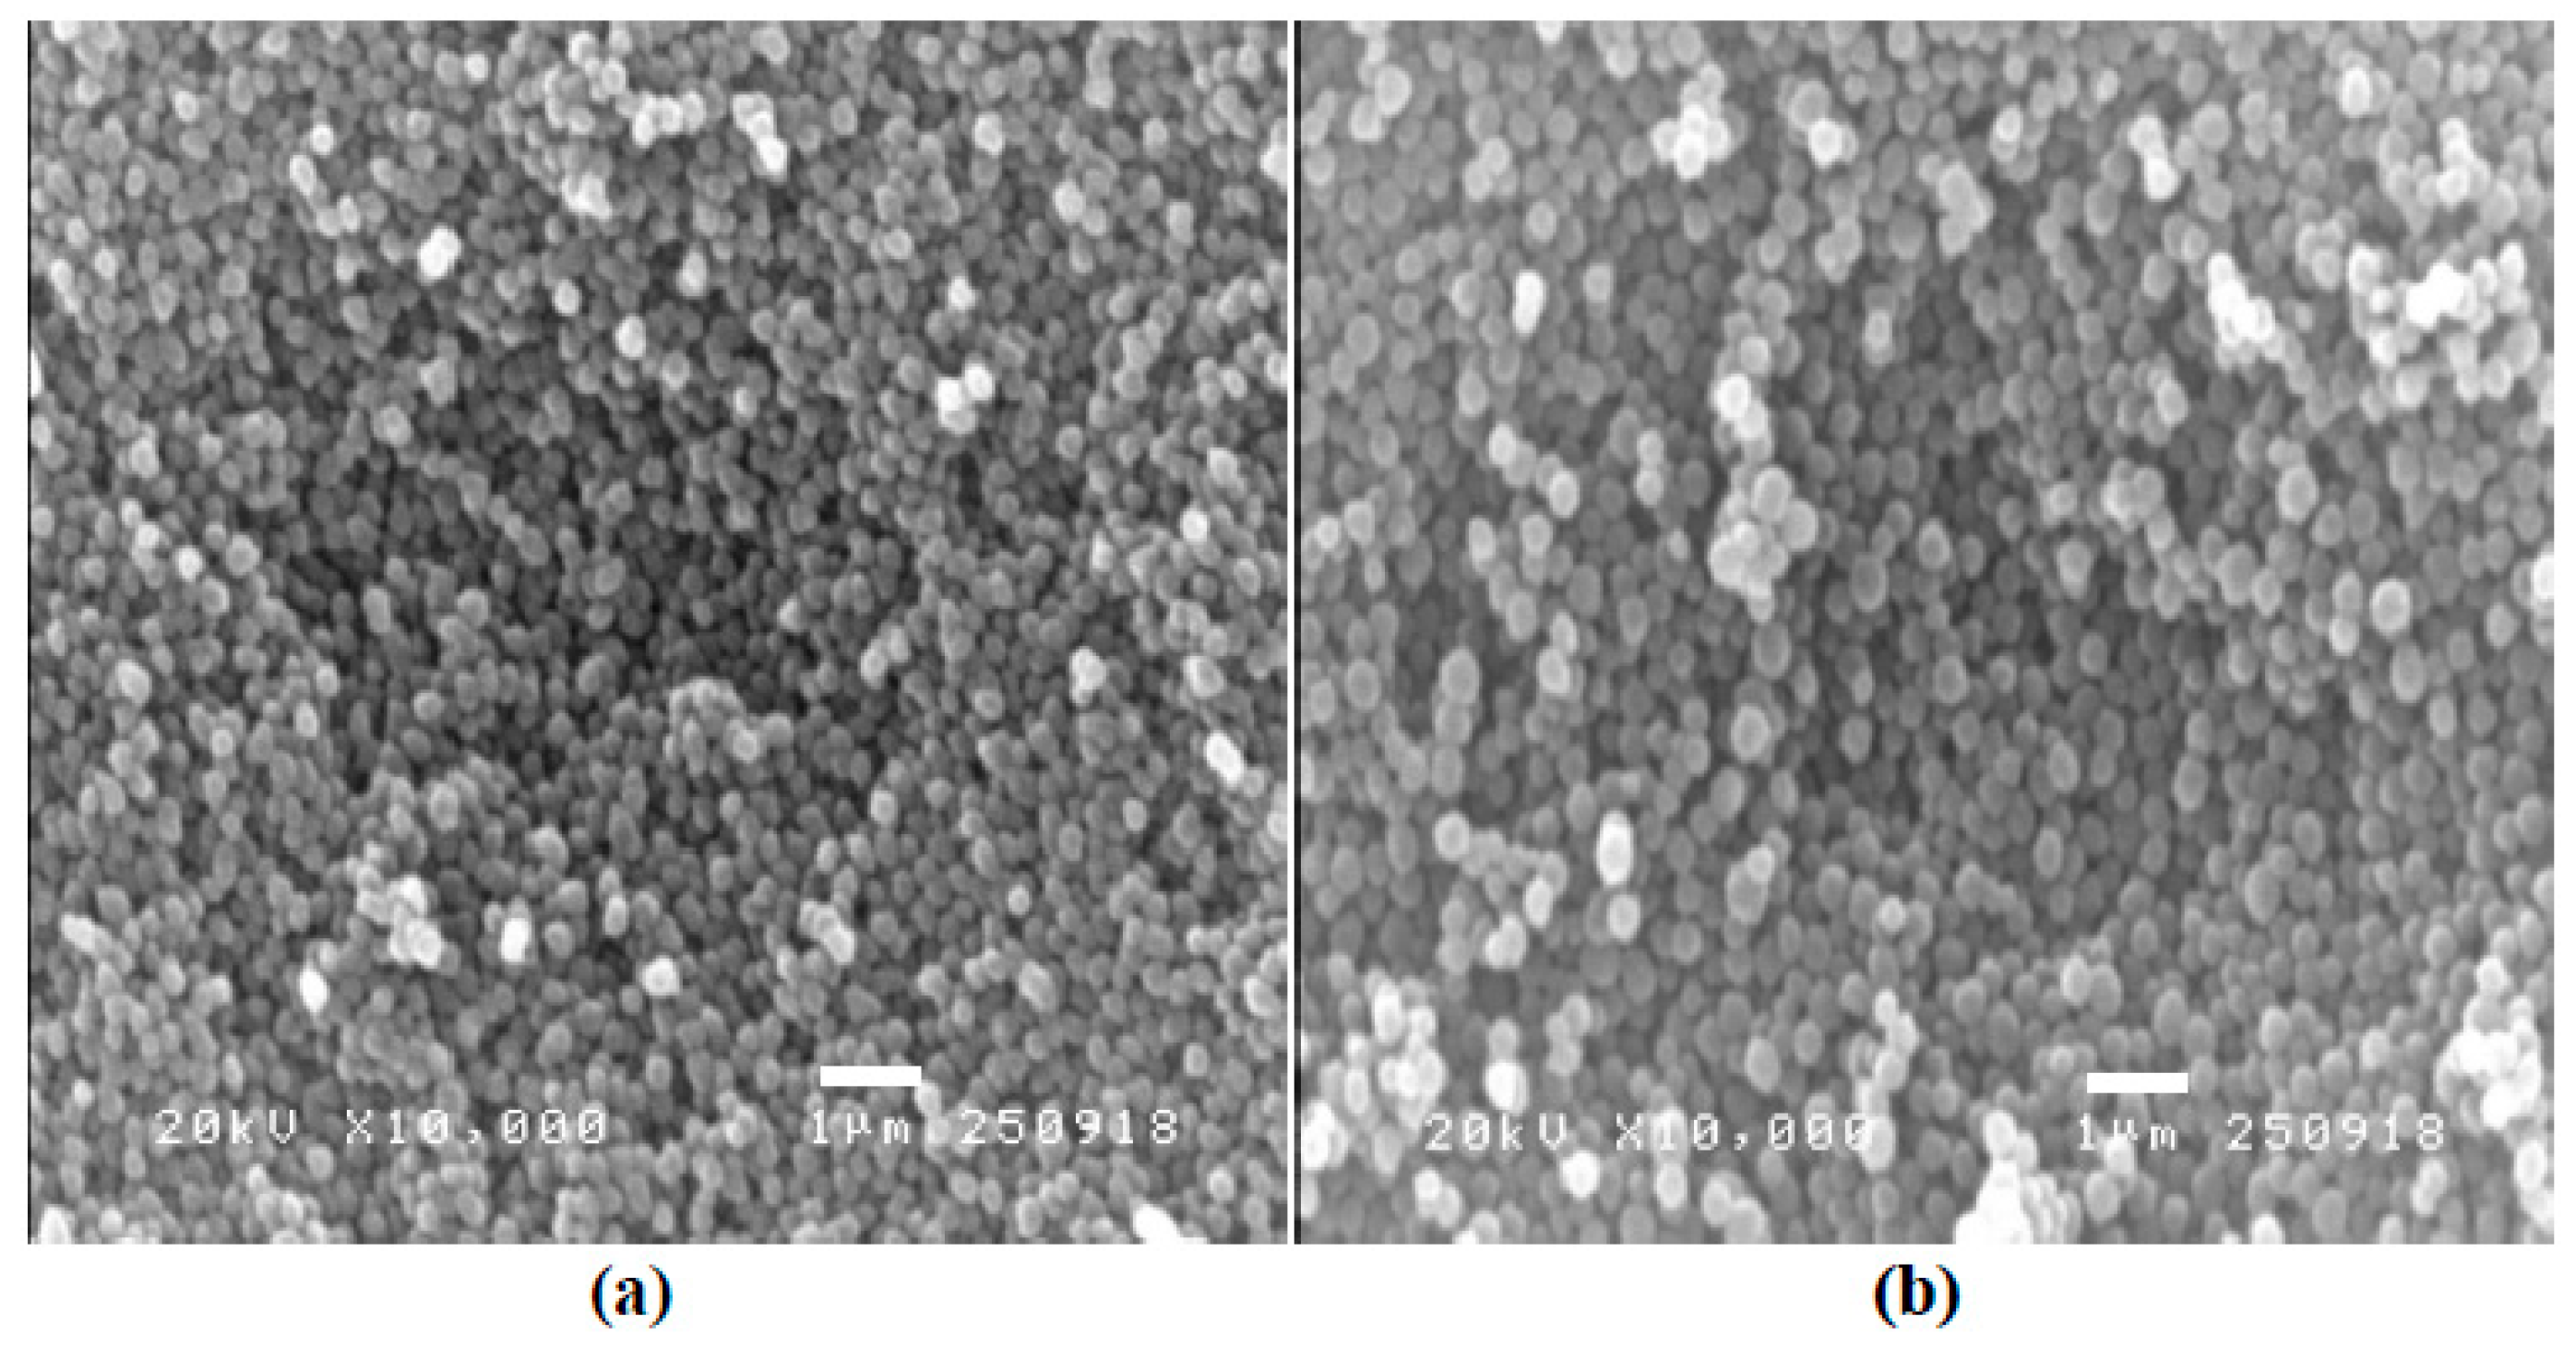
The morphology of the imprinted polymer for homocysteine was observed under scanning electron microscopy (SEM). The SEM images in Figure 2 show the spherical shape of the Hcy-MIP and NIP particles with the approximate diameters of 100 ± 10 nm and 150 ± 15 nm, respectively. These were consistent with most of the imprinted polymer particles prepared by the precipitation method [45]. The chemical characterization or elemental analysis of these imprinted particles was also observed by the FTIR spectrometer. The FTIR spectra in Figure 3 present the unique chemical characteristics of the polymerized compounds of MAA both in Hcy-MIP and NIP particles (red dashed line). The peaks at 2920 cm−1 and 3438 cm−1 indicate the stretching vibrations of the methyl C-H and O-H groups, respectively. The peak at 1720 cm−1 represents the >C=O, 1631 cm−1 the alkenyl >C=C< stretching, 1463 cm−1 and 1386 cm−1 the methyl C-H bending, 1295 cm−1 the vinylidene bending, and 1140 cm−1 the C-O stretching. Hcy (green solid line) had its characteristic peak at 2910 cm−1 due to C-H stretching from tertiary carbon, at 2080 cm−1 due to C-O stretching, 1520 cm−1 due to N-H bending, 1322 cm−1 due to >C-C< stretching,1060 cm−1 due to C-N stretching, 853 cm−1 due to S-H bending, 758 cm−1 due to methylene CH2 rocking, and 691 cm−1 due to –CH2-SH bending.
The IR spectrum showed decreasing signals of C=O and C-O and an increase in the C-N peak at 1060 cm−1 and N-H at 1520 cm−1 when Hcy bound to Hcy-MIP (blue line). These changes were due to the bonding of the H atom of Hcy and O atom of MIP.

3.2. Electrochemical Characteristics of Hcy-MIP

The CV analysis of all electrodes was conducted using K4[Fe(CN)6]3−/4− as an electrochemical marker. Figure 4 shows the CV of a different modified electrode from the nanocomposite-modified electrode (CNT/CS/IL/SPCE), MIP/CNT/CS/IL/SPCE, MIP/CNT/CS/IL/SPCE after interaction with 1 mM Hcy for 10 min, and NIP/CNT/CS/IL/SPCE. The cyclic voltammetric current response of the nanocomposite-modified electrode was found to decrease with the incorporation of non-conducting polymer material as a modification, but the porous nature of the MIP produced due to the leaching of Hcy made it more responsive than the NIP. The current response further decreased after 10 min of MIP/CNT/CS/IL/SPCE exposure to 1 mM Hcy because the Hcy molecules formed hydrogen bonds with the MIP on the electrode surface, decreasing the surface area available for electron transfer. The unavailability of the pores in NIP resulted in a very poor current response for the corresponding electrode.
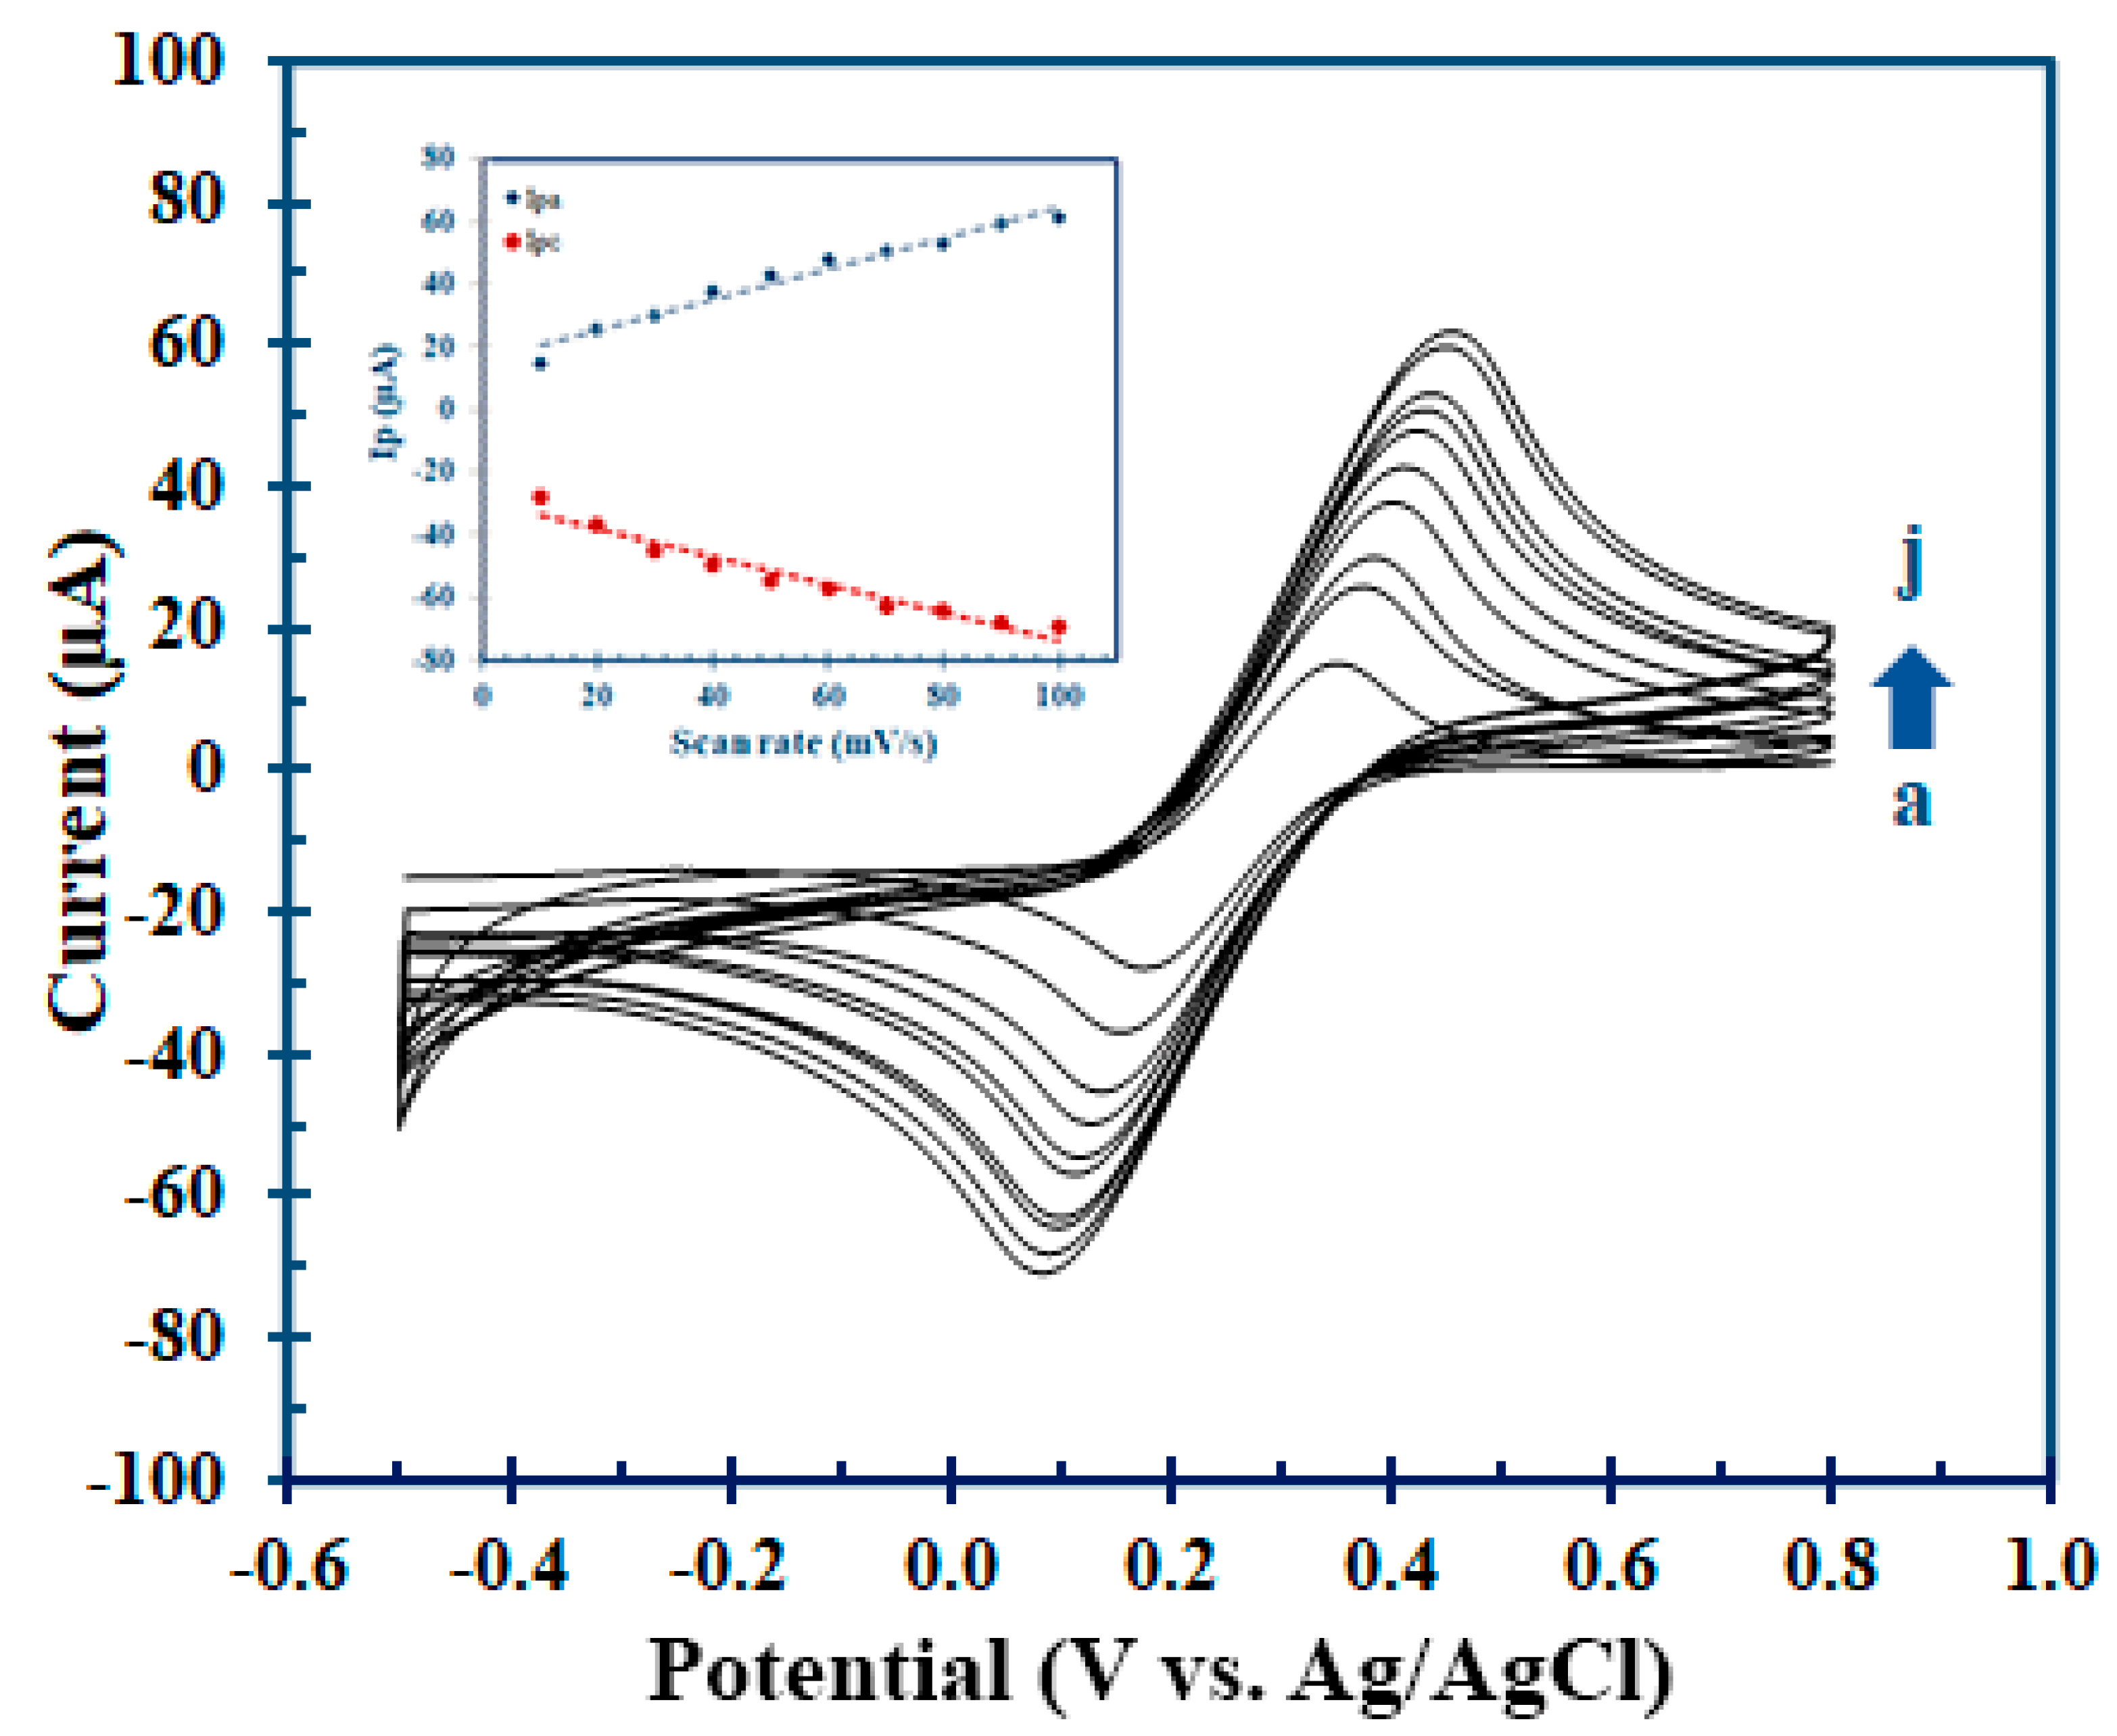
CVs of MIP/CNT/CS/IL/SPCE were also recorded at various scan rates of 10, 20, 30, 40, 50, 60, 70, 80, 90, and 100 mV/s in the same potential range and are shown in Figure 5a–j (inset: Ip against scan rate). A surface-controlled electrochemical reaction system was found since the peak current (Ip) was seen to grow linearly with the scan rate. Thus, the ferro–ferri conversion redox reaction for the MIP-modified electrode appeared to be an absorption-controlled process; initially, it was absorbed onto the electrode surface and subsequently underwent a redox reaction.

3.3. Optimization of Hcy-MIP Biosensor

3.3.1. Concentration of MIP in Hcy-MIP Biosensor

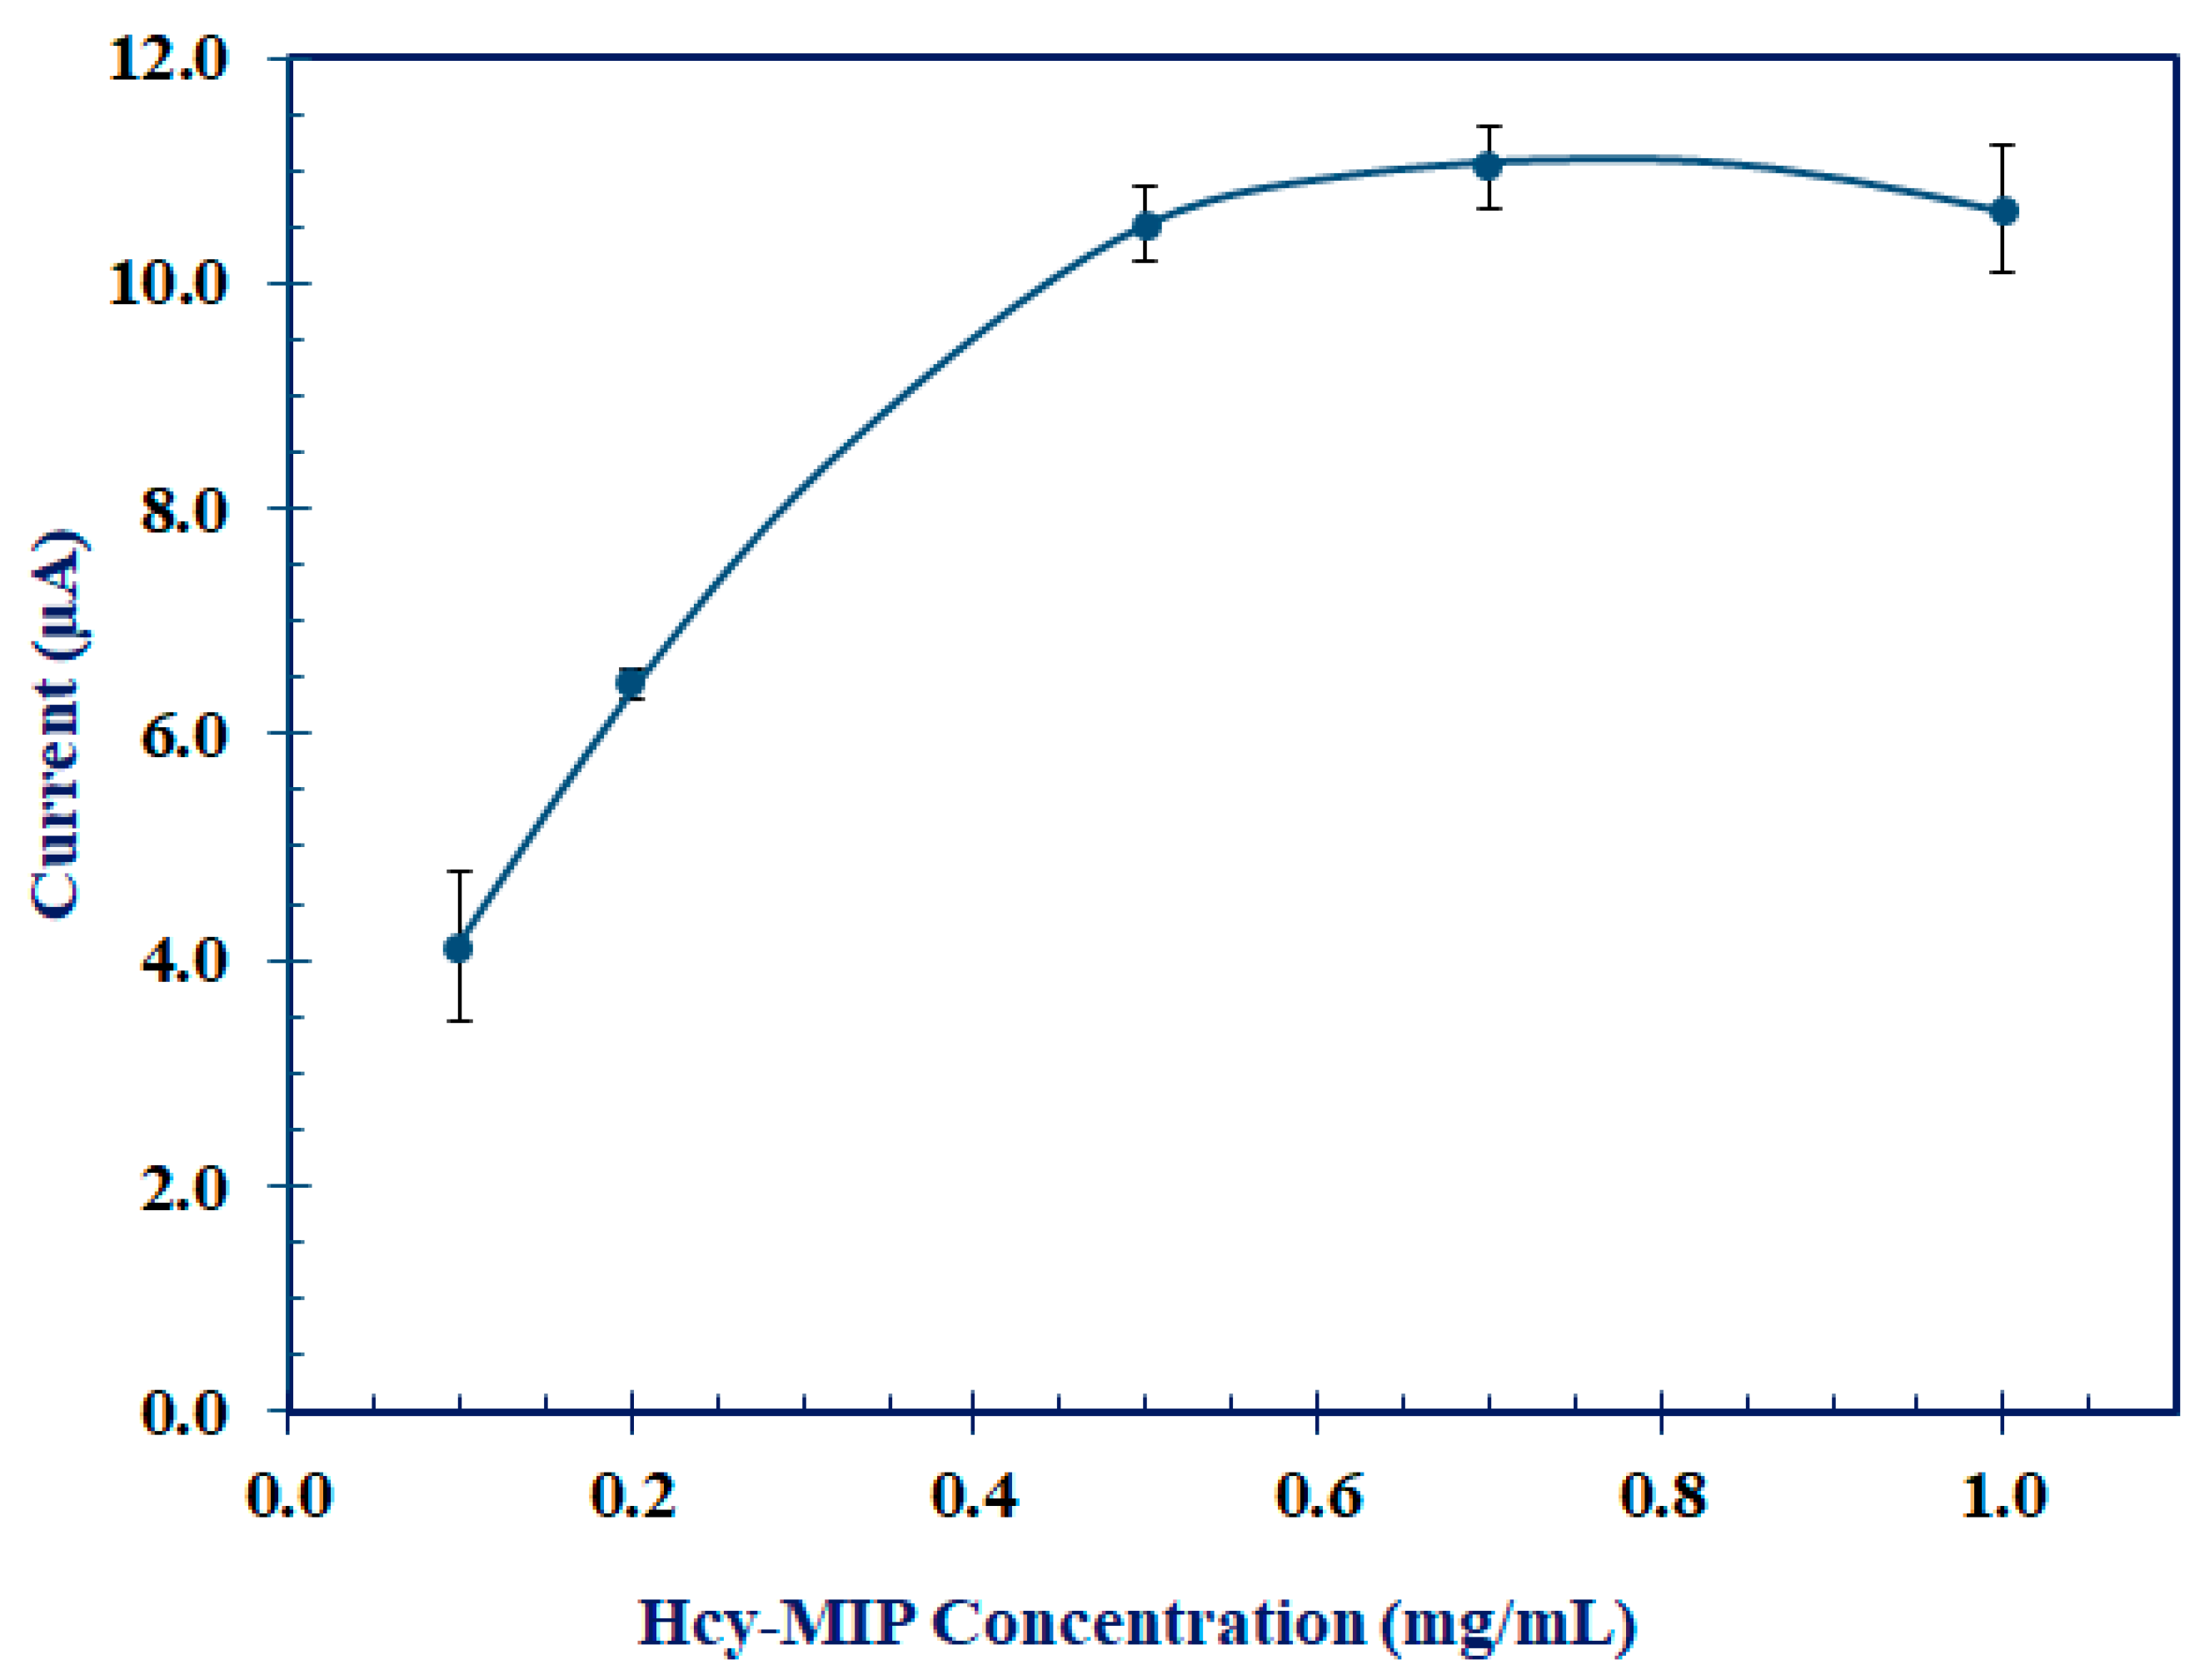
Different MIP-modified SPCEs were prepared with MIP at the concentrations of 0.1, 0.2, 0.5, 0.7, and 1.0 mg/mL. The current response from DPV was observed after interaction with 0.1 mM Hcy for 10 min. The electrode response in Figure 6 demonstrates the positive relationship between the current signal and MIP at a concentration up to 0.5 mg/mL. Using MIP greater than 0.5 mg/mL did not significantly increase the current signal. As a result, 0.5 mg/mL MIP is appropriate for the preparation of the Hcy-MIP biosensor.

3.3.2. Effect of pH

The DPV response of the Hcy-MIP biosensor was recorded after 0.1 mM Hcy was applied for 10 min, followed by 10 mM ferro–ferricyanide solution in 0.1 M PBS at various pHs of 7.0, 7.2, 7.4, 7.8, and 8.0. The DPV was used to monitor the pH while the biosensor function was at its peak, as shown in Figure 7. The electrode response was seen to increase initially when the solution’s pH rose to a maximum, and then it decreased. Since this biosensor responded most strongly to Hcy at pH 7.0, it was decided that this was the optimal pH for Hcy determination.

3.4. Determination of Hcy

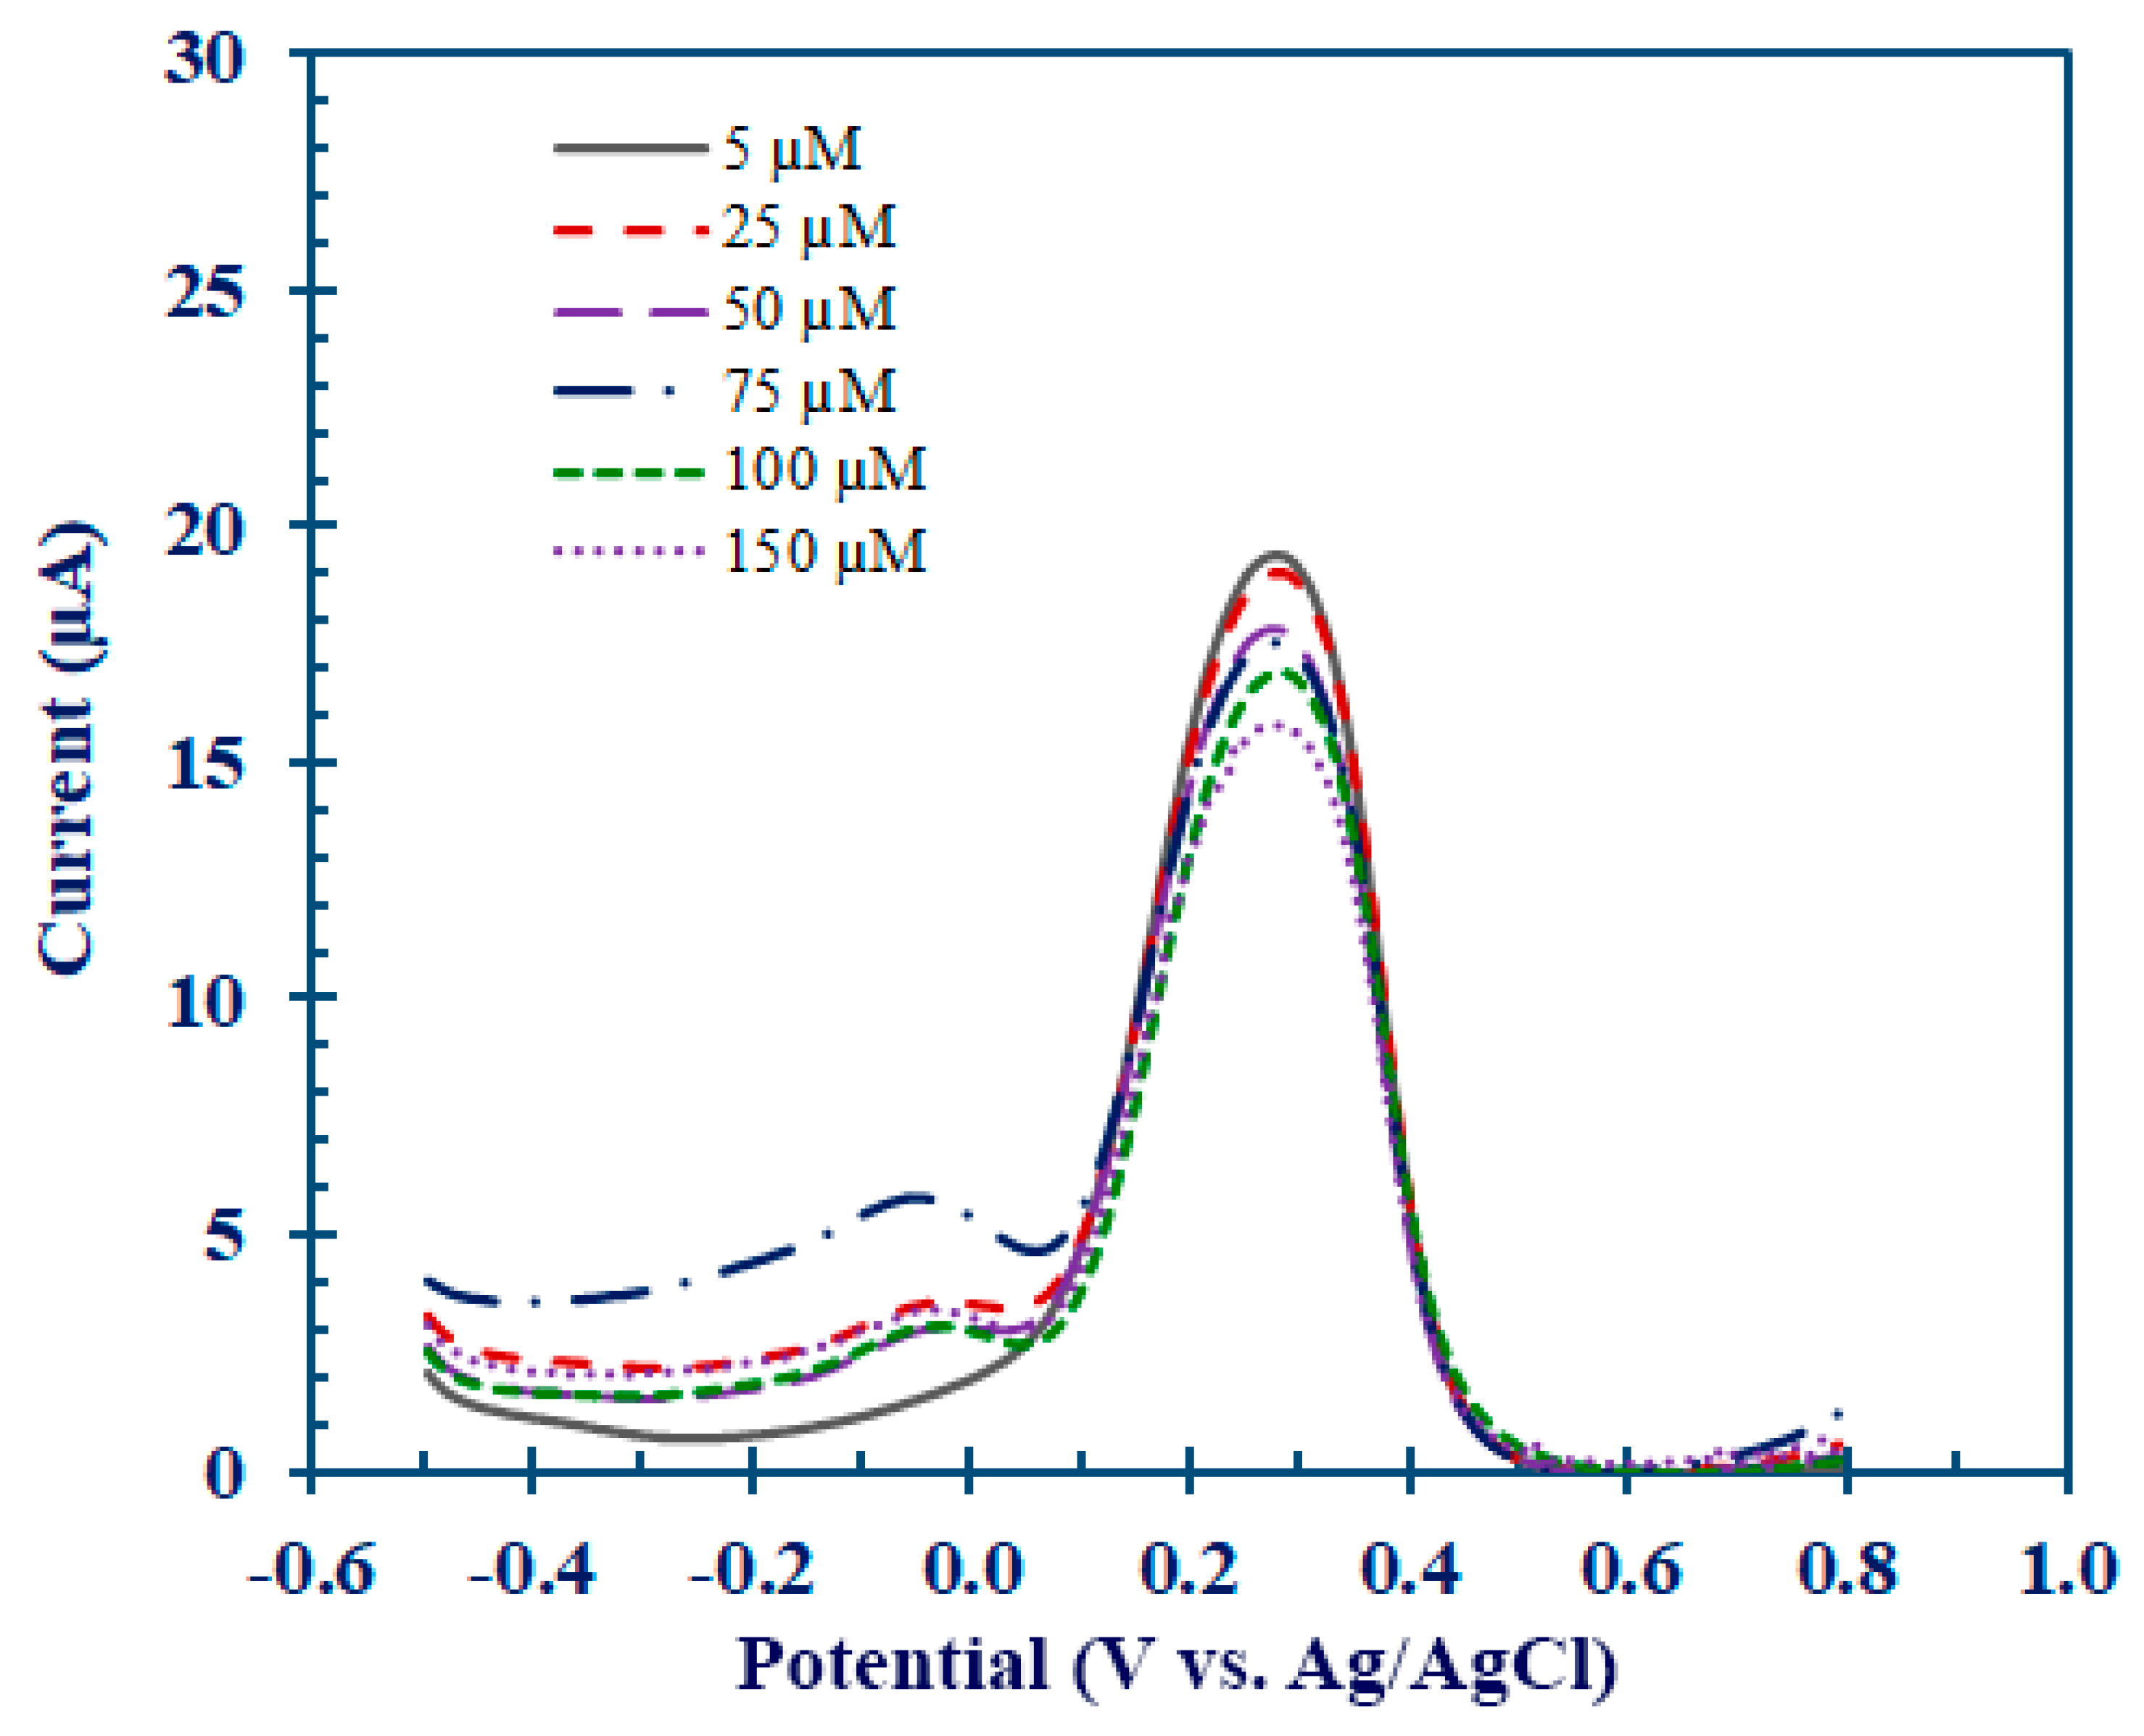
The DPV response after allowing the interaction between the Hcy-MIP biosensor and Hcy for 10 min served to exhibit the performance of the Hcy-MIP biosensor at various Hcy concentrations of 0, 25, 50, 75, 100, and 150 µM, as shown in Figure 8. The corresponding calibration curve in Figure 8 was obtained, with an R2 correlation coefficient of 0.9753. The limit of detection (LOD) of the Hcy-MIP biosensor was 1.2 µM (S/N = 3). The DPV response of MIP/CPE for the K4[Fe(CN)6]3−/4− redox couple was found to decrease with an increase in the Hcy concentration. The decrease in the availability of the pores at the electrode surface was caused by a rise in the Hcy concentration because the interconversion of the Fe(II)–Fe(III) redox reaction unfolds as a surface-controlled process. Additionally, the response current decreased as a result of the imprinted sites being blocked by the hydrogen-bonded Hcy, which also reduced the effective surface area.

3.5. Evaluation of Hcy-MIP Biosensor Performance

3.5.1. Dose Response of Hcy-MIP Biosensor

The dose response curve for the determination of the Hcy-MIP biosensor is represented in Figure 9. This curve was plotted between the current signal obtained from the DPV of potassium ferrocyanide and the Hcy concentration in the range of 5.0 to 150 µM. The DPV peak current inversely correlated to the Hcy concentration was 19.40 ± 0.145, 19.07 ± 0.231, 17.81 ± 0.172, 17.56 ± 0.211, 16.91 ± 0.218, and 15.78 ± 0.371 µA, respectively. The sensitivity for Hcy of this Hcy-MIP biosensor was 25.2 nA/µM. This Hcy-MIP biosensor had a linear detection range between 5.0 and 150 µM and a high correlation coefficient (R2 = 0.9753).
Additionally, the limit of detection (LOD) of the Hcy-MIP biosensor was defined as three times the standard deviation of the assay results of 1 µM Hcy in PBS, pH 7.0, under optimal conditions in 10 replicates. It was 1.2 µM, which is comparable to those calculated from other reported methods, such as an enzyme-based biosensor platform [20], an aptamer-modified gold nanoparticle/graphene sponge electrode platform [39], and a rapid liquid chromatography–tandem mass spectrometry platform [12], as shown in Table 1. However, some methods have LODs that are significantly lower than this Hcy-MIP biosensor method—for instance, the quantum dot platform method with an LOD and detection range in the nM range [15,32,33] or HPLC with a post-column reaction platform, where the LOD and detection range are 10 times better [5,8,9]. It is possible to modify the Hcy-MIP to obtain a fluorescent signal [45] and apply it to the fluorescent sensor platform to obtain a better LOD [49]. During the polymerization process, the Hcy-MIP can be coated on a polymeric photonic platform for the real-time sensing of Hcy [50]. The normal range of serum Hcy is typically 5–16 µM. The range of hyperhomocysteinemia can also be classified as mild (16–30 µM), moderate (30–100 µM), and severe (>100 µM). The linear response range of this biosensor is 5.0 to 150 µM with an LOD at 1.2 µM, which covers both pathological and normal plasma levels of homocysteine without the requirement for sample dilution.

3.5.2. Analytical Accuracy

A recovery assay was employed to assess the analytical accuracy of the Hcy-MIP biosensor. Four Hcy concentration levels of 50, 75, 100, and 150 µM were added and examined for the recovery of Hcy. According to Table 2, the recovered spike Hcy samples had concentrations of 46.1, 72.6, 94.4, and 144.3 µM or 91.10%, 96.07%, 93.85%, and 95.83% recovery, respectively, with an average recovery percentage of 94.21.

3.5.3. Analytical Precision

Three Hcy concentration levels of 5 and 150 µM were chosen for the analytical precision of the Hcy-MIP biosensor for both the intra- and inter-assay methods. Twenty measurements were taken for the intra-assay in the same batch, whereas twenty measurements were taken for the inter-assay over the course of twenty days under optimal conditions. Calculations were made to convert the DPV peak current signal to the Hcy concentration. The coefficients of variation (CVs) for the intra- and inter-assay at the concentrations of 5 and 150 µM were 2.27%, 3.50%, and 3.42%, 4.22%, respectively, as shown in Table 3. According to this finding, the Hcy-MIP biosensor might be used to determine Hcy with satisfactory reproducibility.

3.5.4. Analytical Specificity

The specificity of the Hcy-MIP biosensor was examined by recording the DPVs before and after exposure to 0.5 mM of cysteine, methionine, glutathione, and ascorbic acid. The insignificant current response observed for the interferents demonstrates the considerable selectivity of this biosensor, which is attributed to the Hcy-specific cavities present in the imprinted polymer matrix. This demonstrates that the selectivity of this Hcy-MIP biosensor is suitable for diagnostic application.

3.5.5. Comparative Assay

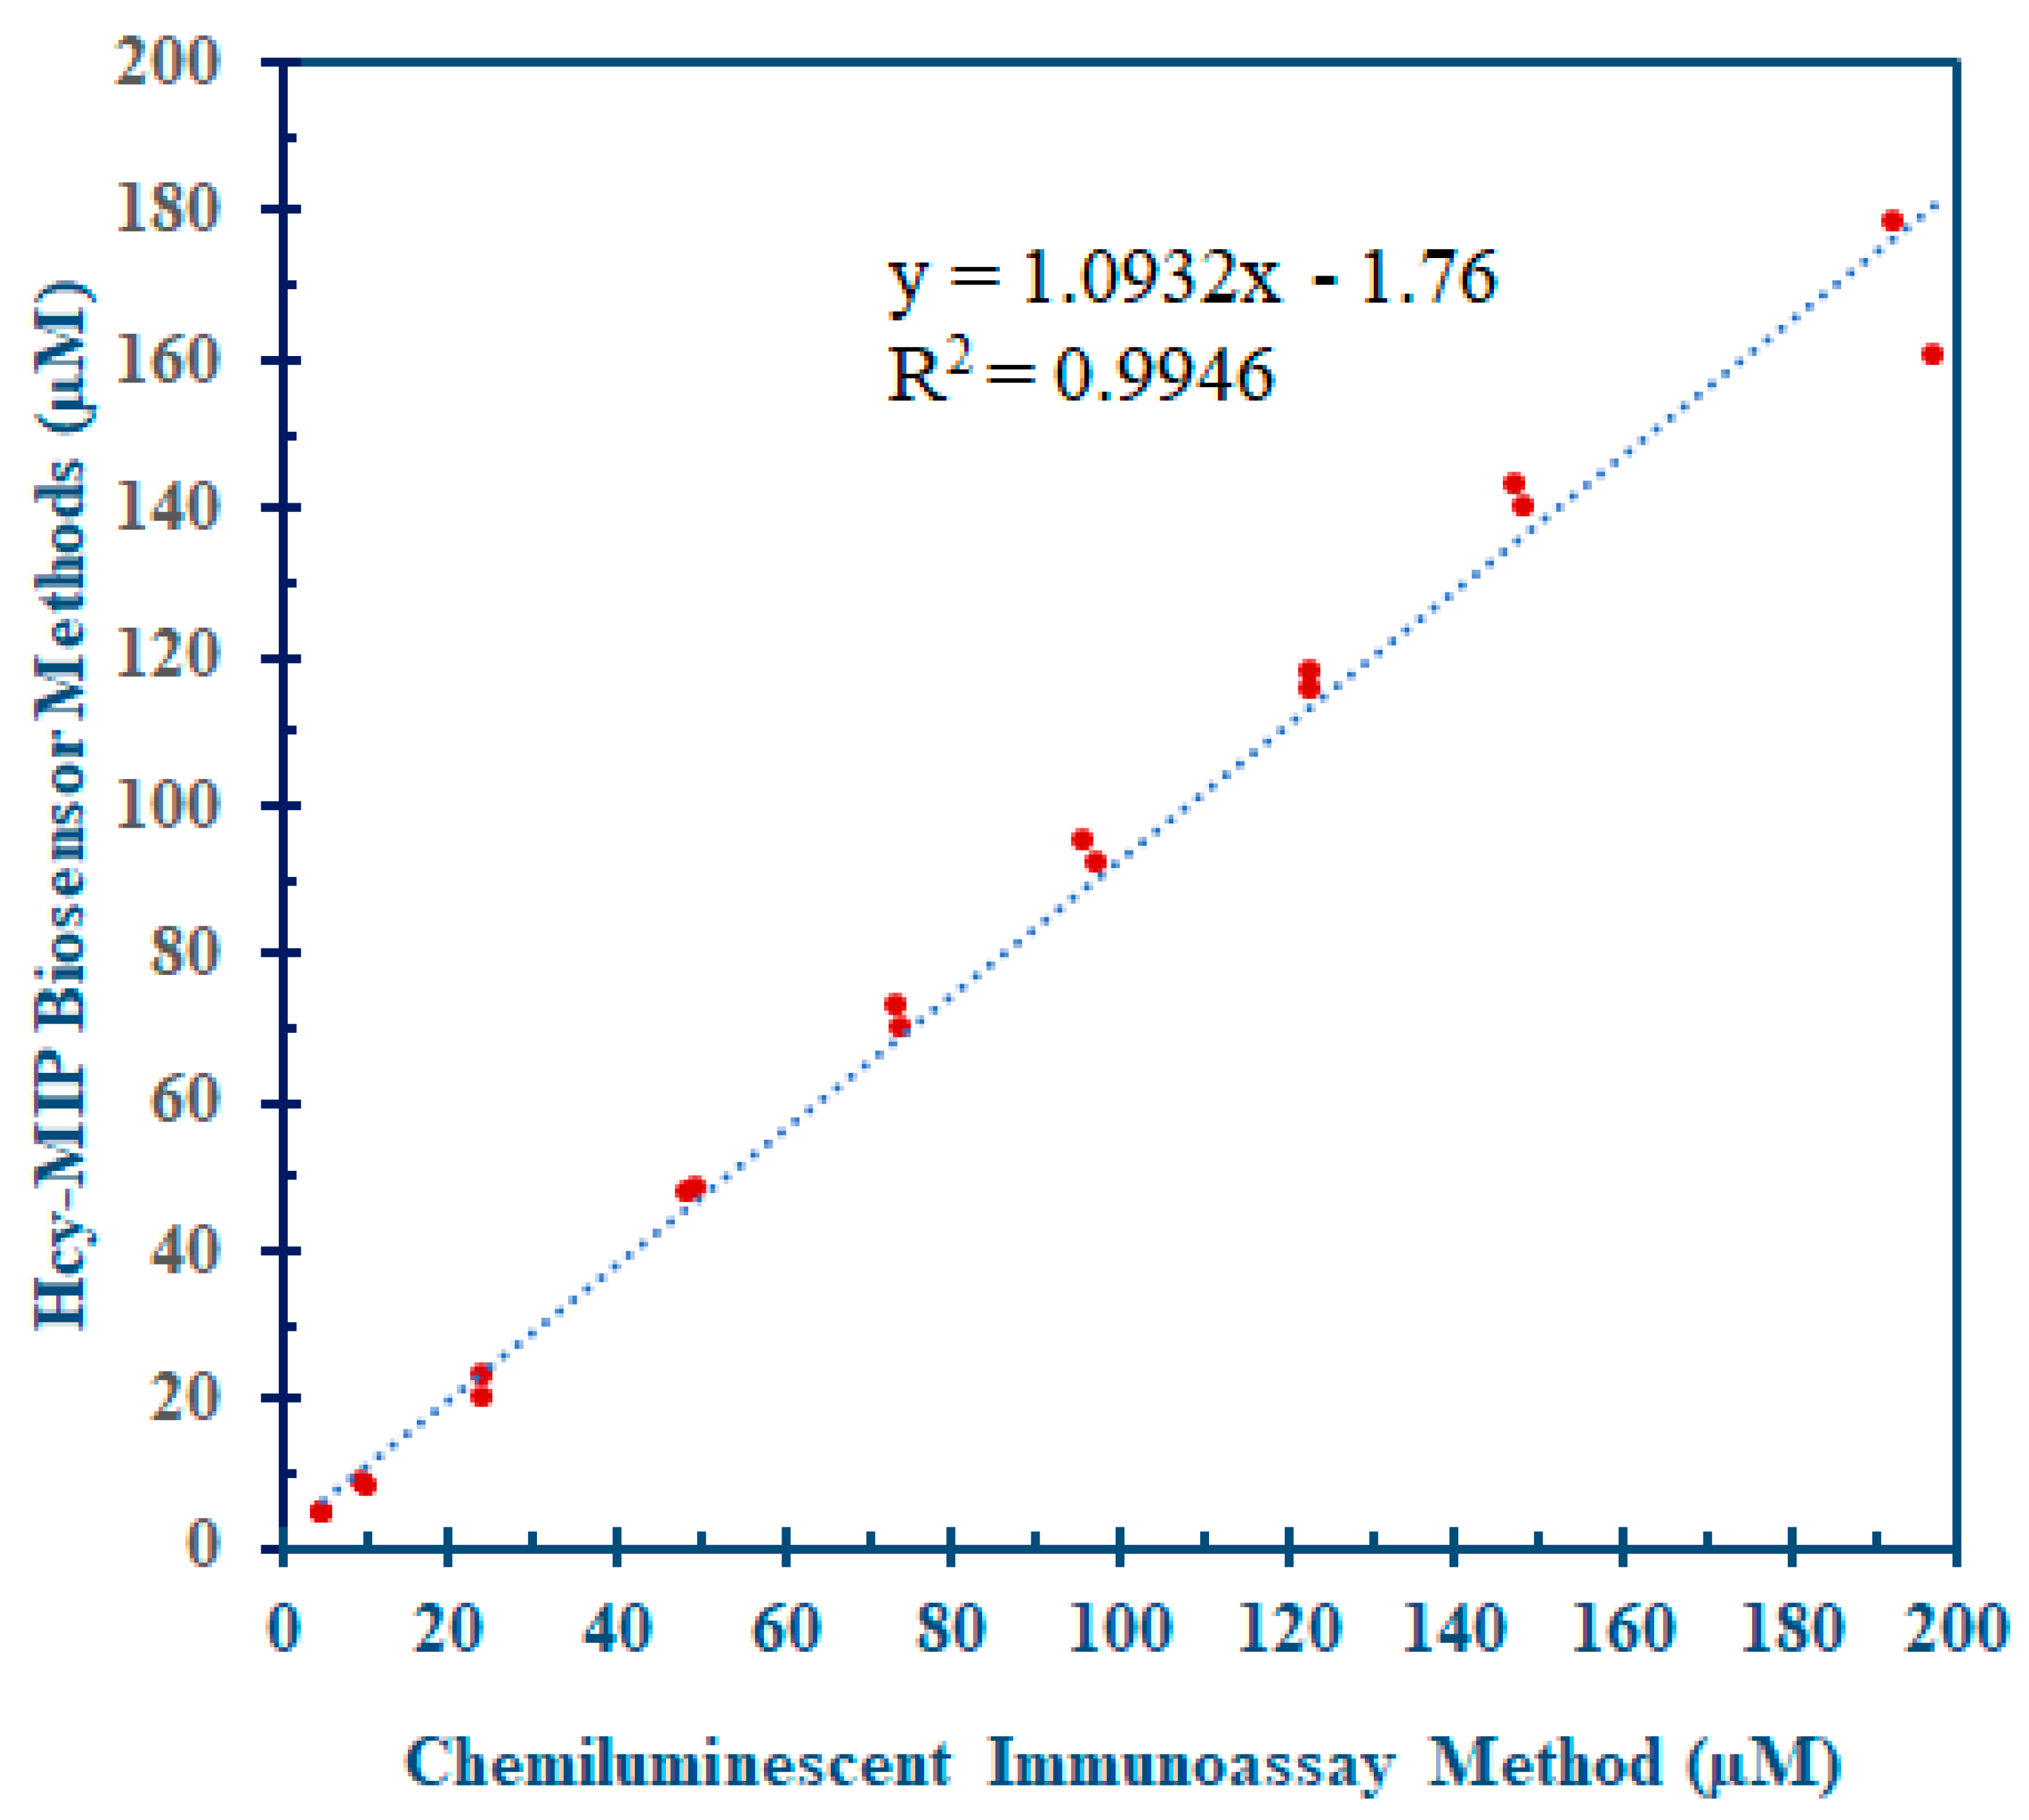
Eighteen serum samples were selected for the comparative assay between the Hcy-MIP biosensor and chemiluminescent microparticle immunoassay method (CMIA). The statistical analysis of 18 measurements from the MIP sensor and CMIA was performed using a paired t-test. The correlation value of the two measurement methods was 0.9946, with a non-significantly different measurement result (paired t-test: p > 0.01), as shown in Figure 10. Therefore, this proposed Hcy-MIP biosensor could be applied as a testing method to determine serum Hcy concentrations at both normal and abnormal levels.

4. Conclusions

An MIP of Hcy was synthesized from MAA, characterized by FTIR, and was used in the modification of SPCE, which was further characterized with CV and DPV. CV and DPV analysis showed that the electrode was responsive to the target molecule. The MIP/modified SPCE as the Hcy-MIP biosensor was optimized at 0.5 mg/mL, which provided the highest electrode DPV response. This innovative biosensor combines synthesized MIPs with a nanocomposite made of carbon nanotubes, chitosan, and ionic liquid, which has the advantages of a label-free electrochemical system and extreme stability of the imprinted polymer on the electrode surface. The detection of Hcy by the Hcy-MIP biosensor was determined by the DPV peak current in the range of 5.0 to 150 µM, with a limit of detection of 1.2 µM and correlation coefficient, R2, of 0.9753. The developed biosensor was only selective to Hcy as it produced no electrode response towards physiological interferences such as methionine, cysteine, and L-ascorbic acid. Thus, the proposed biosensor exhibits benefits including ease of electrode construction, excellent electrode integrity, and a discernible detection limit and detection range.

Author Contributions

Conceptualization, C.P. and U.K.; Methodology, U.K.; Validation, C.P., B.L. and U.K.; Formal Analysis, U.K.; Investigation, U.K.; Resources, U.K.; Data Curation, U.K.; Writing—Original Draft Preparation, U.K.; Writing—Review and Editing, C.P. and B.L.; Visualization, C.P.; Supervision, C.P. and B.L.; Project Administration, C.P.; Funding Acquisition, C.P. All authors have read and agreed to the published version of the manuscript.

Funding

This research was funded by the National Science and Technology Development Agency (NSTDA), Thailand (Grant Number: P17-51769).

Institutional Review Board Statement

Ethical review and approval were not applicable.

Data Availability Statement

The data presented in this study are available from the corresponding author upon reasonable request.

Acknowledgments

This work was supported by research grants from the National Science and Technology Development Agency (NSTDA), Thailand (Grant Number: P17-51769).

Conflicts of Interest

The authors declare no conflict of interest. The funders had no role in the design of the study; in the collection, analyses, or interpretation of data; in the writing of the manuscript; or in the decision to publish the results.

References

  1. Hochholzer, W.; Morrow, D.A.; Giugliano, R.P. Novel Biomarkers in Cardiovascular Disease: Update 2010. Am. Heart J. 2010, 160, 583–594. [Google Scholar] [CrossRef]
  2. Nekrassova, O.; Lawrence, N.S.; Compton, R.G. Analytical Determination of Homocysteine: A Review. Talanta 2003, 60, 1085–1095. [Google Scholar] [CrossRef]
  3. Splaver, A.; Lamas, G.A.; Hennekens, C.H. Homocysteine and Cardiovascular Disease: Biological Mechanisms, Observational Epidemiology, and the Need for Randomized Trials. Am. Heart J. 2004, 148, 34–40. [Google Scholar] [CrossRef] [PubMed]
  4. Refsum, H.; Smith, A.D.; Ueland, P.M.; Nexo, E.; Clarke, R.; McPartlin, J.; Johnston, C.; Engbaek, F.; Schneede, J.; McPartlin, C.; et al. Facts and Recommendations about Total Homocysteine Determinations: An Expert Opinion. Clin. Chem. 2004, 50, 3–32. [Google Scholar] [CrossRef] [PubMed]
  5. Chou, S.T.; Ko, L.E.; Yang, C.S. High Performance Liquid Chromatography with Fluorimetric Detection for the Determination of Total Homocysteine in Human Plasma: Method and Clinical Applications. Anal. Chim. Acta 2001, 429, 331–336. [Google Scholar] [CrossRef]
  6. Accinni, R.; Bartesaghi, S.; De Leo, G.; Cursano, C.F.; Achilli, G.; Loaldi, A.; Cellerino, C.; Parodi, O. Screening of Homocysteine from Newborn Blood Spots by High-performance Liquid Chromatography with Coulometric Array Detection. J. Chromatogr. A 2000, 896, 183–189. [Google Scholar] [CrossRef]
  7. Xu, H.; Zhang, W.; Zhu, W.; Wang, D.; Ye, J.; Yamamoto, K.; Jin, L. Simultaneous Determination of Total Homocysteine, Cysteine and Methionine in Hypothyroid Patients’ Plasma by Liquid Chromatography Using Platinum/Poly(methyl violet) Modified Electrode. Anal. Chim. Acta 2005, 545, 182–188. [Google Scholar] [CrossRef]
  8. Amarnath, K.; Amarnath, V.; Amarnath, K.; Valentine, H.; Valentine, W. A Specific HPLC-UV Method for the Determination of Cysteine and Related Aminothiols in Biological Samples. Talanta 2003, 60, 1229–1238. [Google Scholar] [CrossRef]
  9. Chwatko, G.; Bald, E. Determination of Cysteine in Human Plasma by High-performance Liquid Chromatography and Ultraviolet Detection after Pre-column Derivatization with 2-Chloro-1-Methylpyridinium Iodide. Talanta 2000, 52, 509–515. [Google Scholar] [CrossRef]
  10. Wang, H.; Liang, S.; Zhang, Z.; Zhang, H. 3-Iodoacetylaminobenzanthrone as a Fluorescent Derivatizing Reagent for Thiols in High-performance Liquid Chromatography. Anal. Chim. Acta 2004, 512, 281–286. [Google Scholar] [CrossRef]
  11. Guan, X.; Hoffman, B.; Dwivedi, C.; Matthees, D.P. A Simultaneous Liquid Chromatography/Mass Spectrometric Assay of Glutathione, Cysteine, Homocysteine and Their Disulfides in Biological Samples. J. Pharm. Biomed. Anal. 2003, 31, 251–261. [Google Scholar] [CrossRef] [PubMed]
  12. Kuhn, J.; Götting, C.; Kleesiek, K. Rapid Micro-scale Assay for Homocysteine by Liquid Chromatography-tandem Mass Spectrometry. Clin. Biochem. 2006, 39, 164–166. [Google Scholar] [CrossRef] [PubMed]
  13. Pasas, S.A.; Lacher, N.A.; Davies, M.I.; Lunte, S.M. Detection of Homocysteine by Conventional and Microchip Capillary Electrophoresis/Electrochemistry. Electrophoresis 2002, 23, 759–766. [Google Scholar] [CrossRef] [PubMed]
  14. Inoue, T.; Kirchhoff, J.R. Determination of Thiols by Capillary Electrophoresis with Amperometric Detection at a Coenzyme Pyrroloquinoline Quinone Modified Electrode. Anal. Chem. 2002, 74, 1349–1354. [Google Scholar] [CrossRef]
  15. Zou, Y.; Feng, X.; Zhao, Y.; Wei, Z.; Zhu, W.; Zhao, M.; Wang, T.; Liu, Z.; Tang, S.; Wang, G.; et al. Selective Homocysteine Detection of Nitrogen-doped Graphene Quantum Dots: Synergistic Effect of Surface Catalysis and Photoluminescence Sensing. Synth. Metals 2020, 267, 116432. [Google Scholar] [CrossRef]
  16. Hock, B. Antibodies for immunosensors a review. Anal. Chim. Acta 1997, 347, 177–186. [Google Scholar] [CrossRef]
  17. Frantzen, F.; Faaren, A.L.; Alfheim, I.; Nordhei, A.K. Enzyme Conversion Immunoassay for Determining Total Homocysteine in Plasma or Serum. Clin. Chem. 1998, 44, 311–316. [Google Scholar] [CrossRef] [PubMed]
  18. Wan, Y.; Su, Y.; Zhu, X.; Liu, G.; Fan, C. Development of Electrochemical Immunosensors Towards Point of Care Diagnostics. Biosens. Bioelectron. 2013, 47, 1–11. [Google Scholar] [CrossRef]
  19. Chen, W.; Ang, C.; Lou, D.; Ji, Y.; Huang, L.; Zhu, Y.; Guo, Z.; Gu, N.; Zhang, Y. Fast Immunofluorescence Lateral Flow Test Strip Approach for Detection of Homocysteine. Micro Nano Lett. 2018, 13, 1719–1723. [Google Scholar] [CrossRef]
  20. Zhang, G.; Liu, D.; Shuang, S.; Choi, M.M.F. A Homocysteine Biosensor with Eggshell Membrane as an Enzyme Immobilization Platform. Sens. Actuators B 2006, 114, 936–942. [Google Scholar] [CrossRef]
  21. Alacam, S.; Timur, S.; Telefoncu, A. A Novel Biosensor Based on L-homocysteine Desulfhydrase Enzyme Immobilized in Eggshell Membrane. J. Mol. Catal. B Enzym. 2007, 49, 55–60. [Google Scholar] [CrossRef]
  22. Ching, C.T.S.; Chang, J.W.; Sun, T.P.; Shieh, H.L.; Tsai, C.L.; Huang, H.W.; Liu, W.H.; Liu, C.M.; Yeh, W.C.; Li, J.H. An Amperometric Biosensor Array for Precise Determination of Homocysteine. Sens. Actuators B 2011, 152, 94–98. [Google Scholar] [CrossRef]
  23. Madasamy, T.; Santschi, C.; Martin, O.J.F. A Miniaturized Electrochemical Assay for Homocysteine using Screen-printed Electrodes with Cytochrome c Anchored Gold Nanoparticles. Analyst 2015, 140, 6071–6078. [Google Scholar] [CrossRef] [PubMed]
  24. Rajaram, R.; Mathiyarasua, J. An Electrochemical Sensor for Homocysteine Detection using Gold Nanoparticle Incorporated Reduced Graphene Oxide. Colloids Surf. B 2018, 170, 109–114. [Google Scholar] [CrossRef] [PubMed]
  25. Agüí, L.; Peña-Farfal, C.; Yáñez-Sedeño, P.; Pingarrón, J.M. Electrochemical Determination of Homocysteine at a Gold Nanoparticle-modified Electrode. Talanta 2007, 74, 412–420. [Google Scholar] [CrossRef]
  26. Gong, K.; Dong, Y.; Xiong, S.; Chen, Y.; Mao, L. Novel Electrochemical Method for Sensitive Determination of Homocysteine with Carbon Nanotube-based Electrodes. Biosens. Bioelectron. 2004, 20, 253–259. [Google Scholar] [CrossRef]
  27. Lawrence, N.S.; Deo, R.P.; Wang, J. Detection of Homocysteine at Carbon Nanotube Paste Electrodes. Talanta 2004, 63, 443–449. [Google Scholar] [CrossRef] [PubMed]
  28. Gholami-Orimi, F.; Taleshi, F.; Biparva, P.; Karimi-Maleh, H.; Beitollahi, H.; Ebrahimi, H.R.; Shamshiri, M.; Bagheri, H.; Fouladgar, M.; Taherkhani, A. Voltammetric Determination of Homocysteine using Multiwall Carbon Nanotube Paste Electrode in the Presence of Chlorpromazine as a Mediator. J. Anal. Methods Chem. 2012, 902184. [Google Scholar] [CrossRef]
  29. Zhao, J.; Du, P.; Sun, X.; Liu, H. Development of Electrochemical Sensor for Homocysteine Determination as a Cerebrovascular Disease Biomarker. Int. J. Electrochem. Sci. 2017, 12, 8642–8650. [Google Scholar] [CrossRef]
  30. Kannan, P.; Maiyalagan, T.; Sahoo, N.G.; Opallo, M. Nitrogen Doped Graphene Nanosheet Supported Platinum Nanoparticles as High Performance Electrochemical Homocysteine Biosensors. J. Mater. Chem. B 2013, 36, 4655–4666. [Google Scholar] [CrossRef]
  31. Šimšíkova, M.; Čechal, J.; Zorkovská, A.; Antalík, M.; Šikola, T. Preparation of CuO/ZnO Nanocomposite and Its Application as a Cysteine/Homocysteine Colorimetric and Fluorescence Detector. Colloids Surf. B 2014, 123, 951–958. [Google Scholar] [CrossRef] [PubMed]
  32. Zhu, Q.; Du, J.; Feng, S.; Li, J.; Yang, R.; Qu, L. Highly Selective and Sensitive Detection of Glutathione over Cysteine and Homocysteine with a Turn-on Fluorescent Biosensor Based on Cysteamine-stabilized CdTe Quantum Dots. Spectrochim. Acta Part A 2022, 267, 120492. [Google Scholar] [CrossRef] [PubMed]
  33. Wu, Z.; Li, W.; Chen, J.; Yu, C. A Graphene Quantum Dot-based Method for the Highly Sensitive and Selective Fluorescence Turn on Detection of Biothiols. Talanta 2014, 119, 538–543. [Google Scholar] [CrossRef] [PubMed]
  34. Ellington, A.D.; Szostak, J.W. In vitro Selection of RNA Molecules that Bind Specific Ligands. Nature 1990, 346, 818–822. [Google Scholar] [CrossRef] [PubMed]
  35. Stoltenburg, R.; Reinemann, C.; Strehlitz, B. SELEX-A (R)evolutionary Method to Generate High-affinity Nucleic Acid Ligands. Biomol. Eng. 2007, 24, 381–403. [Google Scholar] [CrossRef]
  36. Wackerlig, J.; Lieberzeit, P.A. Molecularly Imprinted Polymer Nanoparticles in Chemical Sensing—Synthesis, Characterisation and Application. Sens. Actuators B 2015, 207, 144–157. [Google Scholar] [CrossRef]
  37. Poma, A.; Guerreiro, A.; Whitcombe, M.J.; Piletska, E.V.; Turner, A.P.F.; Piletsky, S.A. Solid-phase Synthesis of Molecularly Imprinted Polymer Nanoparticles with a Reusable Template—“Plastic antibodies”. Adv. Funct. Mater. 2013, 23, 2821–2827. [Google Scholar] [CrossRef]
  38. Piletsky, S.A.; Alcock, S.; Turner, A.P.F. Molecular Imprinting: At the Edge of the Third Millennium. Trends Biotechnol. 2001, 19, 9–12. [Google Scholar] [CrossRef]
  39. Wen, X.H.; Zhao, X.F.; Peng, B.F.; Yuan, K.P.; Li, X.X.; Zhu, L.Y.; Lu, H.L. Facile Preparation of an Electrochemical Aptasensor Based on Au NPs/Graphene Sponge for Detection of Homocysteine. Appl. Surf. Sci. 2021, 556, 149735. [Google Scholar] [CrossRef]
  40. Beitollahi, H.; Zaimbashi, R.; Mahani, M.T.; Tajik, S. A Label-free Aptasensor for Highly Sensitive Detection of Homocysteine Based on Gold Nanoparticles. Bioelectrochemistry 2020, 134, 107497. [Google Scholar] [CrossRef]
  41. Saeed, J.; Mirzaei, M.; Torkzadeh-Mahani, M. A Selective and Regenerable Voltammetric Aptasensor for Determination of Homocysteine. Microchim. Acta 2016, 183, 2205–2210. [Google Scholar] [CrossRef]
  42. McKeague, M.; Foster, A.; Miguel, Y.; Giamberardino, A.; Verdin, C.; Chan, J.Y.S.; Derosa, M.C. Development of a DNA Aptamer for Direct and Selective Homocysteine Detection in Human Serum. RSC Adv. 2013, 46, 24415–24422. [Google Scholar] [CrossRef]
  43. Vasapollo, G.; Del Sole, R.; Mergola, L.; Lazzoi, M.R.; Scardino, A.; Scorrano, S.; Mele, G. Molecularly Imprinted Polymers: Present and Future Prospective. Int. J. Mol. Sci. 2011, 12, 5908–5945. [Google Scholar] [CrossRef] [PubMed]
  44. Scorrano, S.; Mergola, L.; Del Sole, R.; Vasapollo, G. Synthesis of Molecularly Imprinted Polymers for Amino Acid Derivates by Using Different Functional Monomers. Int. J. Mol. Sci. 2011, 12, 1735–1743. [Google Scholar] [CrossRef] [PubMed]
  45. Chow, C.F.; Lam, M.H.W.; Leung, M.K.P. Fluorescent Sensing of Homocysteine by Molecular Imprinting. Anal. Chim. Acta 2002, 466, 17–30. [Google Scholar] [CrossRef]
  46. Bossi, A.; Bonini, F.; Turner, A.P.F.; Piletsky, S.A. Molecularly Imprinted Polymers for the Recognition of Proteins: The State of the Art. Biosens. Bioelectron. 2007, 22, 1131–1137. [Google Scholar] [CrossRef] [PubMed]
  47. Athikomrattanakul, U.; Promptmas, C.; Katterle, M. Synthetic Receptors for Neutral Nitro Derivatives. Tetrahedron Lett. 2009, 50, 359–362. [Google Scholar] [CrossRef]
  48. Gopalan, A.I.; Lee, K.-P.; Ragupathy, D. Development of a Stable Cholesterol Biosensor Based on Multi-walled Carbon Nanotubes-Gold Nanoparticles Composite Covered with a Layer of Chitosan-Room-temperature Ionic Liquid Network. Biosens. Bioelectron. 2009, 24, 2211–2217. [Google Scholar] [CrossRef]
  49. El-Bindary, M.A.; Shahat, A.; El-Deen, I.M.; El-Afify, M.A.M.; Hassan, N. Synthesis of Novel Fluorescent Sensor Based on a Modified Amino Al-MOF for Rapid, Sensitive, and Selective Detection of Arsenic in Aqueous Solution. Appl. Organomet. Chem. 2023, 37, e7029. [Google Scholar] [CrossRef]
  50. Zhang, J.; Gai, M.; Ignatov, A.V.; Dyakov, S.A.; Wang, J.; Gippius, N.A.; Frueh, J.; Sukhorukov, G.B. Stimuli-Responsive Microarray Films for Real-Time Sensing of Surrounding Media, Temperature, and Solution Properties via Diffraction Patterns. ACS Appl. Mater. Interfaces 2020, 12, 19080–19091. [Google Scholar] [CrossRef]
Figure 1. Scheme for homocysteine determination with the Hcy-MIP electrochemical biosensor platform. (a) The SPCE was fabricated with the mixture of Hcy-MIP and CNT/CS/IL nanocomposite to obtain Hcy-MIP biosensor electrode; (b) the detection was performed by measuring the electrochemical signal of differential pulse voltammetry (DPV) using K4[Fe(CN)6]3−/4− as an electroactive probe molecule.
Polymers 15 02241 g001
Figure 2. The SEM images of the imprinted polymer: (a) homocysteine-imprinted polymer (Hcy-MIP), (b) non-imprinted polymer (NIP).
Polymers 15 02241 g002
Figure 3. The FTIR spectrophotometry results of homocysteine-imprinted polymer (Hcy-MIP) (red dashed line), homocysteine (blue dotted line), and Hcy-MIP reacted with Hcy (green solid line).
Polymers 15 02241 g003
Figure 4. The CV analysis of modified electrodes with nanocomposite-modified SPCE (CNT/CS/IL/SPCE) (dotted line), Hcy-MIP/CNT/CS/IL/SPCE (dashed line), Hcy-MIP/CNT/CS/IL/SPCE after interaction with 1 mM Hcy for 10 min (solid line), and NIP/CNT/CS/IL/SPCE (dashed-dotted line). The electrochemical measurement was conducted in 10 mM K3[Fe(CN)6] in 0.1 M phosphate buffer containing 1 M KCl.
Polymers 15 02241 g004
Figure 5. The CVs of MIP/CNT/CS/IL/SPCE at different scan rates of (a) 10, (b) 20, (c) 30, (d) 40, (e) 50, (f) 60, (g) 70, (h) 80, (i) 90, and (j) 100 mV/s in the potential range of −0.5–0.8 V (vs./Ag/AgCl) (inset: Ip vs. scan rate).
Polymers 15 02241 g005
Figure 6. The DPV peak current response of MIP/CNT/CS/IL/SPCE (Hcy-MIP biosensor) fabricated with Hcy-MIP at the concentration of 0.1, 0.2, 0.5, 0.7, and 1.0 mg/mL.
Polymers 15 02241 g006
Figure 7. The effect of pH on the DPV peak current response of MIP/CNT/CS/IL/SPCE (Hcy-MIP biosensor), after interaction with 0.1 mM Hcy for 10 min. The electrochemical measurement was performed in 10 mM ferro–ferricyanide in 0.1 M PBS at different pHs of 7.0, 7.2, 7.4, 7.8, and 8.0 solution containing 1 M KCl.
Polymers 15 02241 g007
Figure 8. The DPV signal response of Hcy-MIP biosensor after interacting with Hcy at concentrations of 5, 25, 50, 75, 100, and 150 µM for 10 min. The electrochemical measurement was conducted in 10 mM K3[Fe(CN)6] in 0.1 M phosphate buffer pH 7.0 containing 1 M KCl.
Polymers 15 02241 g008
Figure 9. Dose response curve for homocysteine determination. The Hcy-MIP biosensor reacted with a standard solution containing 5–150 µM Hcy for 10 min at room temperature. The DPV peak current response was then measured by applying 10 mM K3[Fe(CN)6] in 0.1 M phosphate buffer, pH 7.0, containing 1 M KCl. Values are mean ± S.D. (n = 3).
Polymers 15 02241 g009
Figure 10. The comparative assay of serum homocysteine between Hcy-MIP biosensor and chemiluminescent microparticle immunoassay method (CMIA) with a correlation value of R2 = 0.9946.
Polymers 15 02241 g010
Table 1. Comparison of limit of detection (LOD) of other previously reported homocysteine detection methods.
PlatformMethodsLODLinearityRef.
Chromatographic Platform
Simultaneous liquid chromatography–mass spectrometryHPLC-MS0.75 µM1.5–740 µM[11]
Rapid liquid chromatography–tandem mass spectrometryHPLC-MS/MS1.0 µM0.0–61.6 µM[12]
HPLC with electrochemical coulometric array detectionHPLC-ED0.14 µM-[6]
HPLC with platinum/poly(methyl violet) (Pt/MV)-modified electrodeHPLC-ED0.1 µM0.2–100 µM[7]
Thiocarbonyldiimidazole (TCDI) post-column reactionHPLC-UV0.1 µM2.5–10 µM[8]
2-chloro-1-methylpyridinium iodide (CMPI) post-column reactionHPLC-UV0.1 µM0.5–50 µM[9]
Methanolic monobromobimane for thiol derivatizationHPLC-FL0.12 µM3.9–62 µM[5]
Iodoacetylaminobenzanthrone (IAB) post-column reactionHPLC-FL2.3 nM0.05–25 µM[10]
Electrophoresis Platform
Capillary electrophoresis/electrochemistryAmperometry0.5 µM1–100 µM[13]
Capillary electrophoresis with pyrroloquinoline quinone-modified electrodeAmperometry0.03 µM0.1–5 µM[14]
Immunoassay Platform
Lateral flow immunofluorescentOptical0.27 µM1.0–50 µM[16]
Enzyme-Based Biosensor Platform
Amino acid oxidase immobilized on screen-printed carbon electrodeAmperometryNA6.4–100 µM[22]
Amino acid oxidase immobilized on oxygen electrodePotentiometry2.0 µM0.05–1.5 µM[20]
Homocysteine desulfhydrase enzyme electrodePotentiometryNA0.15–1.8 µM[21]
Nanomaterial-Based Biosensor Platform
Cytochrome c-anchored gold nanoparticles on screen-printed electrodeAmperometry0.3 µM0.4–700 µM[23]
Gold nanoparticle-incorporated reduced graphene oxide electrodeAmperometry6.9 µM2–14 µM[24]
Reduced graphene oxide–TiO2 (RGO-TiO2) nanocomposite on glassy carbon electrodesAmperometry24 nM0.1–80 µM[29]
Carbon nanotube-based electrodeAmperometry0.06 µM0.1–60 µM[26]
Carbon nanotube-based electrodeAmperometry4.6 µM5.0–200 µM[27]
Multiwall carbon nanotube paste electrodeVoltammetry0.8 µM0.1–210 µM[28]
Graphene nanosheet-supported platinum nanoparticle electrodeVoltammetry0.2 nM0.2–2.4 nM[30]
CuO/ZnO nanocompositeOptical40 µM40–96 µM[31]
Aptamer-Based Biosensor Platform
Aptamer-modified Au NP/graphene sponge electrodeVoltammetry1.0 µM1–100 µM[39]
Aptamer-modified gold nanoparticle/carbon electrodeVoltammetry0.009 µM0.05–20 µM[40]
Aptamer-modified gold electrodeVoltammetry10 nM0.2–10 µM[41]
Aptamer–gold nanoparticleOptical0.3 µM0.5–3.0 µM[42]
Quantum Dot Platform
Nitrogen-doped graphene quantum dotsOptical0.05 nM0.05–50 nM[15]
Cysteamine-stabilized CdTe quantum dotsOptical3.3 nM6.7–400 nM[32]
Graphene quantum dotsOptical5 nM0–50 nM[33]
Molecularly Imprinted Polymer-Based Biosensor Platform
MIP-based optical sensorOpticalNANA[45]
MIP-modified nanocomposite screen-printed carbon electrodeVoltammetry1.2 µM5.0–150 µMThis Work
Table 2. The accuracy of the Hcy-MIP biosensor for homocysteine detection at concentration of 50, 75, 100, and 150 µM.
Homocysteine Added (µM)Homocysteine Obtained (µM)Recovery (%)
5046.1091.10
7572.6096.07
10094.4093.85
150144.3095.83
Average % recovery (n = 8)94.21
Spiked serum samples at Hcy concentrations of 50, 75, 100, and 150 µM were assayed for Hcy by the Hcy-MIP biosensor using the previously described method. The % recovery was calculated as an indicator of accuracy of the assay method (n = 8).
Table 3. The analytical precision of the Hcy-MIP biosensor for homocysteine detection at concentration of 5 and 150 µM.
Homocysteine
Concentration (µM)
Intra-Assay (n = 20)Inter-Assay (n = 20)
Mean ± SD
(µM)
%CVMean ± SD
(µM)
%CV
54.97 ± 0.112.274.98 ± 0.173.42
150150.35 ± 5.263.50150.40 ± 6.354.22
The standard Hcy solution at concentration of 5 and 150 µM was determined for both intra- and inter-assay with 20 measurements using the assay method previously described.
Disclaimer/Publisher’s Note: The statements, opinions and data contained in all publications are solely those of the individual author(s) and contributor(s) and not of MDPI and/or the editor(s). MDPI and/or the editor(s) disclaim responsibility for any injury to people or property resulting from any ideas, methods, instructions or products referred to in the content.