Article

Extraction of Nanocellulose for Eco-Friendly Biocomposite Adsorbent for Wastewater Treatment

by
Mohamed Bassyouni
1,2,*,
Mohamed Sh. Zoromba
1,3,
Mohamed H. Abdel-Aziz
1,4 and
Ibrahim Mosly
5
1
Department of Chemical and Materials Engineering, King Abdulaziz University, Rabigh 21911, Saudi Arabia
2
Department of Chemical Engineering, Faculty of Engineering, Port Said University, Port Said 42526, Egypt
3
Chemistry Department, Faculty of Science, Port Said University, Port Said 42521, Egypt
4
Chemical Engineering Department, Faculty of Engineering, Alexandria University, Alexandria 21544, Egypt
5
Department of Civil Engineering, King Abdulaziz University, Rabigh 21911, Saudi Arabia
*
Author to whom correspondence should be addressed.
Polymers 2022, 14(9), 1852; https://doi.org/10.3390/polym14091852
Submission received: 18 February 2022 / Revised: 20 April 2022 / Accepted: 26 April 2022 / Published: 30 April 2022
(This article belongs to the Special Issue Polymers for Energy and Environmental Applications)

Abstract

:
In the present study, nanocellulose was extracted from palm leaves to synthesize nanocellulose/chitosan nanocomposites for the removal of dyes from textile industrial wastewater. Nanocellulose is of interest in water purification technologies because of its high surface area and versatile surface chemistry. Following bleach, alkali, and acid treatments on palm leaves, nanocellulose is obtained as a white powder. The produced nanocellulose was investigated. The adsorption capacity of chitosan, nanocellulose, and novel synthetic nanocellulose/chitosan microbeads (CCMB) for direct blue 78 dye (DB78) removal was studied. A series of batch experiments were conducted in terms of adsorbent concentration, mixing time, pH, dye initial concentration, and nanocellulose concentration in synthetic microbeads. The CCMB was characterized by using physicochemical analysis, namely Brunauer–Emmett–Teller (BET), scanning electron microscope (SEM), zeta potential analysis, and Fourier-transform infrared spectroscopy (FTIR). It was found that the surface area of synthetic CCMB is 10.4 m2/g, with a positive net surface charge. The adsorption tests showed that the dye removal efficiency increases with an increasing adsorbent concentration. The maximum removal efficiencies were 91.5% and 88.4%, using 14 and 9 g/L of CCMB-0.25:1. The initial dye concentrations were 50 and 100 mg/L under acidic conditions (pH = 3.5) and an optimal mixing time of 120 min. The equilibrium studies for CCMB-0.25:1 showed that the equilibrium data were best fitted to Langmuir isothermal model with R2 = 0.99. These results revealed that nanocellulose/chitosan microbeads are an effective eco-adsorbent for the removal of direct blue 78 dye and provide a new platform for dye removal.

1. Introduction

Dye contaminants in aquatic resources have become a significant problem as a result of the recent industrialization, urbanization, and growth of dyes-based operations such as the textile industry. Textile industries are also one of the world’s fastest-growing industrial sectors presently. They use a lot of water and produce a large amount of wastewater, which mostly consists of colors used in the dyeing process. The yearly water consumption by textile industries in the world is 40 × 109 m3 [1]. Approximately 10–15% of the applied dyes amount is gushed out as effluent. Such wastewaters severely affect land and water, resulting in pollution of the ecosystem [2,3].
The organic effluent disrupts the aquatic biosphere by obstructing light penetration, as well as posing major health risks to humans [4,5,6,7]. These dangers serve as ongoing reminders of the importance of finding effective color-removal technologies for wastewater. Many treatment technologies specialized in dye removal have been investigated, with several degree of success (i.e., chemical coagulation, membrane separation, catalytic, and chemical/physical adsorption) [8,9,10,11]. Among these processes, adsorption is considered one of the most commonly utilized and adaptable, allowing for the efficient and cost-effective removal of pollutants [12,13,14,15,16]. It was reported that biosorption process is one of the most promising technologies for wastewater treatment. Microorganisms such as bacteria, fungi, and algae have been investigated and used efficiently as bio-based sorbents for the removal of many contaminates from wastewater [17,18,19].
Various dyes adsorbents have been designed and examined, such as graphene-based composite, activated carbons, inorganic nanomaterials, microorganisms, and metal–organic frameworks.
Because of their natural abundance, low cost, biocompatibility, and low environmental impact, biomass materials such as cellulose, chitin, chitosan, and lignin have been recognized as one of the most promising candidates in the past few years [20,21].
Cellulose is the most important plant component to substitute synthetic polymers, due to its being an inexpensive, nontoxic, and biodegradable polymer [22]. Cellulose is the main component of the plant cell wall [23,24]. Cellulose can be extracted from various sources, including wood, grasses, seed fibers, date palm seeds, algae, sisal fibers, fungi, argo-industrial waste, and bacteria [25,26,27]. On the other hand, cellulose is the most plentiful and renewable naturally occurring polymer in the world. It has been used in the manufacturing of energetic material for numerous supplies in the food and pharmaceutical industries, in paint, and in textiles [25]. In recent years, a wider application of cellulose has been suggested at the nanoscale level for developing various biocompatible products and a variety of cellulose derivatives [28,29,30]. A new area of nanocellulose applications is still under examination in some fields, including photonics, foams, surface modifications, nanocomposites, flexible, pharmaceutical industries, and optoelectronics. The most useful property of nanocellulose exploration is the green nature of the particles, as well as amazing chemical and physical properties. In addition, there are a variety of applications that can be taken from this vital material [31]. Cellulose is a carbohydrate polymer that has many monosaccharide units that are connected to each other through covalent bonds. Cellulose is considered to be a polymer with a linear backbone of anhydro-glucose monomer units connected through 1,4 β-linkages. Moreover, cellulose’s compact structure, mainly contributed to by the linkage of intra- and inter-hydrogen bonds as strong physical bonds, has a remarkable mechanical strength that protects the plant’s biological structure [32]. Date palm fiber biomass is a potential renewable resource which can contribute to energy sustainability. This may diminish the negative impacts of petroleum combustion in the environment. In the production of nanocellulose material from lignocellulosic biomass, various methods have been used, including acidic, basic, and ionic liquid treatment [33,34,35]. During the biomass treatment process, potassium hydroxide solution makes polymers (hemicellulose, lignin, and cellulose) swell, partially breaking the intra-hydrogen bonding in the biomass structure. The less ordered biomass structure leads to an increase in the number of existing hydroxyl groups and the availability of solvents for further hydrolysis reaction. Usually, sulfuric acid or hydrochloric acid as a strong acid were used for de-polymerization processing; acid makes hydrolytic cleave to the glycosidic linkages between the two adjacent anhydroglucose nits, dissolving the amorphous region of the cellulose by increasing the crystallinty of cellulose [36]. Because contamination of water by toxic dyes can affect human health and the ecology, it is necessary to remove dye wastewater. Natural adsorbents have attracted the attentions of many researchers throughout the world, due to their availability, ease of modification, and excellent adsorption capability. Heavy metals and dyes are removed from wastewater by using cellulose nanofibers (CNFs) [37]. This crystalline portion may be isolated from cellulose fibrils, which are typically 50–150 nm in length [38]. Nanocellulose (NC) may be versatilely modified with other materials to improve its adsorption capacity in the presence of hydroxymethyl functional groups. Some studies have found that using nanocrystalline cellulose (NC) to remove anionic and cationic dyes has satisfactory results [39]. More than 300 million tons of paper is produced yearly, and the demand is expected to increase by 2030 [40]. Paper uses 42 percent of the world’s wood, generating environmental issues.
It was reported that a tris-azo dye (Direct Blue 71) was removed from aqueous solutions by using chitosan-based adsorbent gels. The chemical modification of chitosan was carried out by using crosslinking agents: sodium tripolyphosphate (TPP) and glutaraldehyde. The linear and nonlinear approaches for the Langmuir and Freundlich isotherms were compared. The adsorption studies revealed that the Langmuir model best described the experimental data from this study, with the maximal dye adsorption capacity of the adsorbent being 88.49 mg/g (linear form) and 92.22 mg/g (square form) (nonlinear form) [41,42].
Chitosan hydrogel beads were made by lowering the degree of crystallinity by generating a gel with the purpose of raising chitosan’s adsorption capability. Several strategies, including chemical crosslinking with crosslinking agents on their surface, have been developed to improve the commercial applicability of chitosan beads [43,44,45,46,47,48]. In recent years, the utilization of chitosan and cellulose for dye removal has attracted substantial interest as a potential eco-friendly adsorbent. Figure 1 shows the number of yearly published articles from 2013 to 2021. It was noted that the number of scientific publications on chitosan and cellulose in dye removal have significantly increased over the last 9 years.
This study aimed to extract nanocellulose from palm leaves and develop a novel biocomposite adsorbent from the two largest natural resources (nanocellulose and chitosan), with an ionic liquid as the medium. The adsorption efficiency for direct blue 78 dye (anionic) removal using chitosan, nanocellulose, and nanocellulose/chitosan biocomposites was investigated.
In this research, the nanocellulose particles were successfully extracted from palm leaves. A novel nanocellulose-based adsorbent was used for direct blue 78 dye removal with high efficiency (88–91%), optimal dose = (9–14) g/L, and high sedimentation rate, with an initial dye concentration of 50 and 100 mg/L respectively. Isothermal studies were also conducted for nanocellulose-based adsorbents, and the findings showed that the Langmuir isotherm best fit the adsorption results (R2 = 0.98).

2. Materials and Methods

2.1. Extraction of Nanocellulose from Palm Fiber

Palm leaves were cleaned, shredded, and ground. Acetic acid, sodium hydroxide and sodium chlorite were purchased from Sigma-Aldrich (St. Louis, MI, USA). A solution of acetic acid, sodium chlorite, and distilled water was used for de-lignification. The suspension solution was refluxed at 80 °C. The solution was stirred for 24 h at 65 °C before rinsing with deionized water. The separation process was carried out by using centrifugation at 8000 r.p.m. The holocellulose was obtained at 70 °C. The remaining materials (hemicellulose and lignin) were removed by using diluted sodium hydroxide, using magnetic stirring for 7 h. The resultant suspended solution was dried for 24 h at 65 °C. Nanocellulose was extracted by using sulfuric solution (9 M) after stirring for 7 h at ambient temperature. The solution was rinsed with distilled water to avoid cellulose hydrolysis. Nanocellulose was obtained after centrifugation and freezing. Cellulose is a linear homopolymer made up of repeating units (called cellobiose) that are formed by connecting two anhydro-glucose rings via a -1,4 glycosidic linkage. It has s abundance of hydroxyl groups on the surface, according to its structure, as shown in Figure 2a.

2.2. Chitosan and Dyes

Figure 2b shows chitosan, an amino-based polymer, synthesized in vast amounts by N-deacetylation of chitin. High-molecular-weight chitosan was used. The supplier reported that it is a white powder with a molecular-weight range from 140 to 220 kDa, degree of deacetylation (DAC) of 81.2%, viscosity of 36,000 cps, and density of 0.15 g/mL.
The direct blue 78 (DB78) dye (Port Said, Egypt)was received by color print (Port Said, Egypt). Its relative molecular mass was 1059.95, max wavelength (λmax) was 604 nm, and solubility was up to 10 g/L at 25 °C. The direct blue 78 was selected for adsorption tests, as it is widely used in the textile industry. The chemical structure of direct blue 78 is shown in Figure 2c. Two synthetic dye solutions with different dye concentration (50 and 100 mg/L) were prepared for adsorption study.

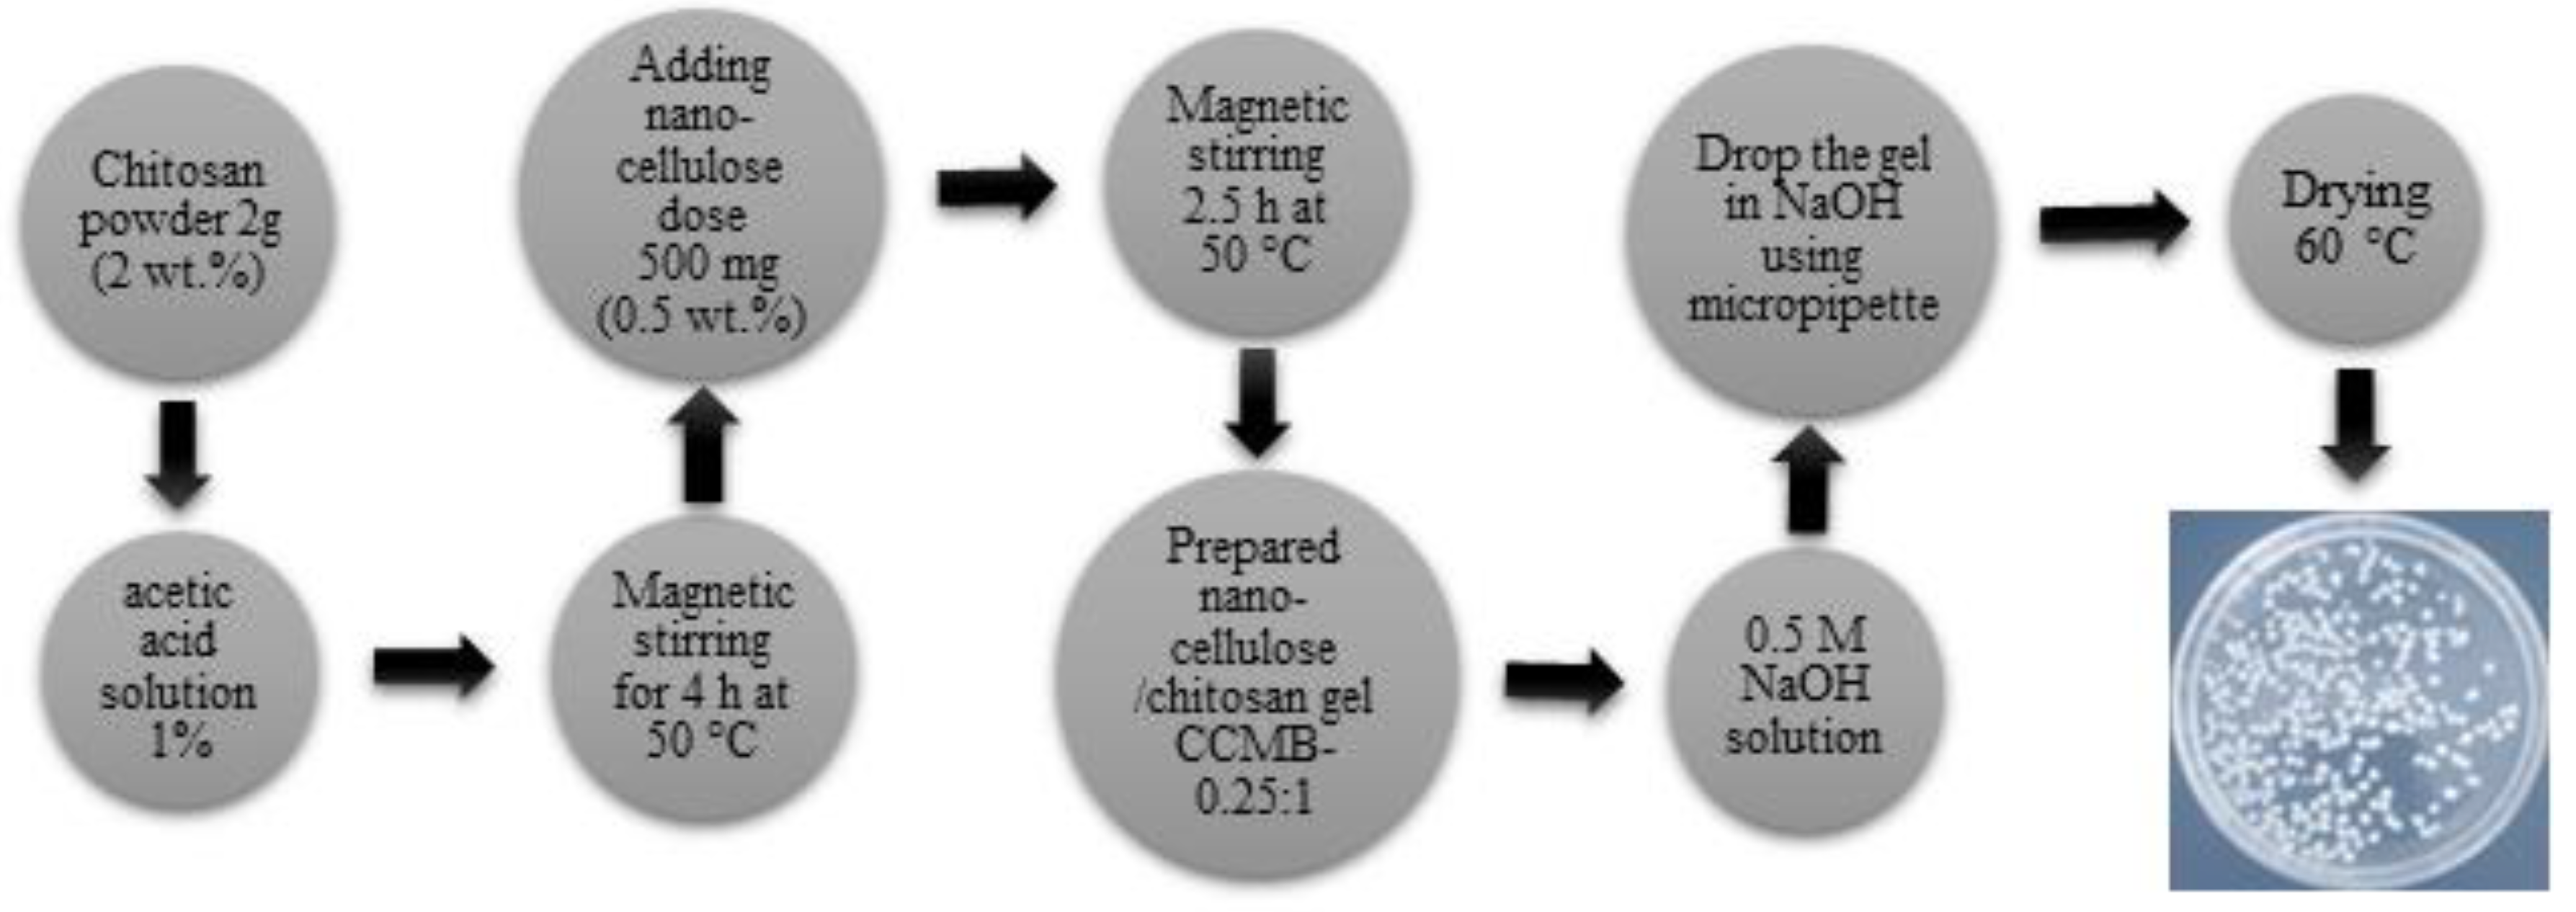
2.3. Preparation of Nanocellulose/Chitosan Microbeads (CCMB)

Chitosan was purchased from Sigma-Aldrich (St. Louis, MO, USA). Nanocellulose/chitosan microbeads (CCMBs) with different ratios of nanocellulose to chitosan were synthesized: CCMBz, where z refers to the ratio of nanocellulose to chitosan. The adsorption studies were conducted by using polymer biocomposite materials with different loading ratios: CCMB-0.1:1, CCMB-0.25:1, CCMB-0.5:1, and CCMB-1:1. In CCMB-1:1, the chitosan solution was prepared under magnetic stirring for 4 h by dissolving 2 g (2 wt.%) of chitosan powder into diluted acetic acid to form a 100 mL chitosan gel sample. A total of 500 mg (0.5 wt.%) of nanocellulose was added to the formed gel (50 mg of nanocellulose was added for every 10 mL of chitosan gel, under magnetic stirring, for 2.5 h, at a temperature of 50 °C). The final prepared gel was dropped into a 0.5 M NaOH solution (contact time 6 h), using a micropipette to form the beads. The formed beads were then washed with distilled water. Finally, the beads were oven-dried at 60 °C. The preparation process is illustrated in Figure 3.

2.4. Adsorption Studies

This study was conducted by using a discontinuous batch adsorption system (lab scale) on a single-component synthetic wastewater. Nanocellulose samples used in this study were 0.1–2 g in 1000 mL of synthetic wastewater, with differing initial concentrations (50 and 100 mg/L), with mixing at 150 r.p.m. and contact times of 0–60 min, at a room temperature (22 ± 2 °C). Chitosan samples used in this study were 1–6 g in 1000 mL of synthetic wastewater, with differing initial concentrations (50 and 100 mg/L), with mixing at 150 r.p.m. for contact times of 0–60 min, at a room temperature (22 ± 2 °C). Nanocellulose/chitosan microbead samples used in this study were 1–15 g in 1000 mL of synthetic wastewater with differing initial concentrations (50 and 100 mg/L), with mixing at 150 r.p.m. for different contact times (0:150 min), at a room temperature (22 ± 2 °C). The spectrophotometrically analysis was applied to determine the removal efficiency by measuring dyes’ concentrations before and after the adsorption process at λmax = 600 nm for DB78.

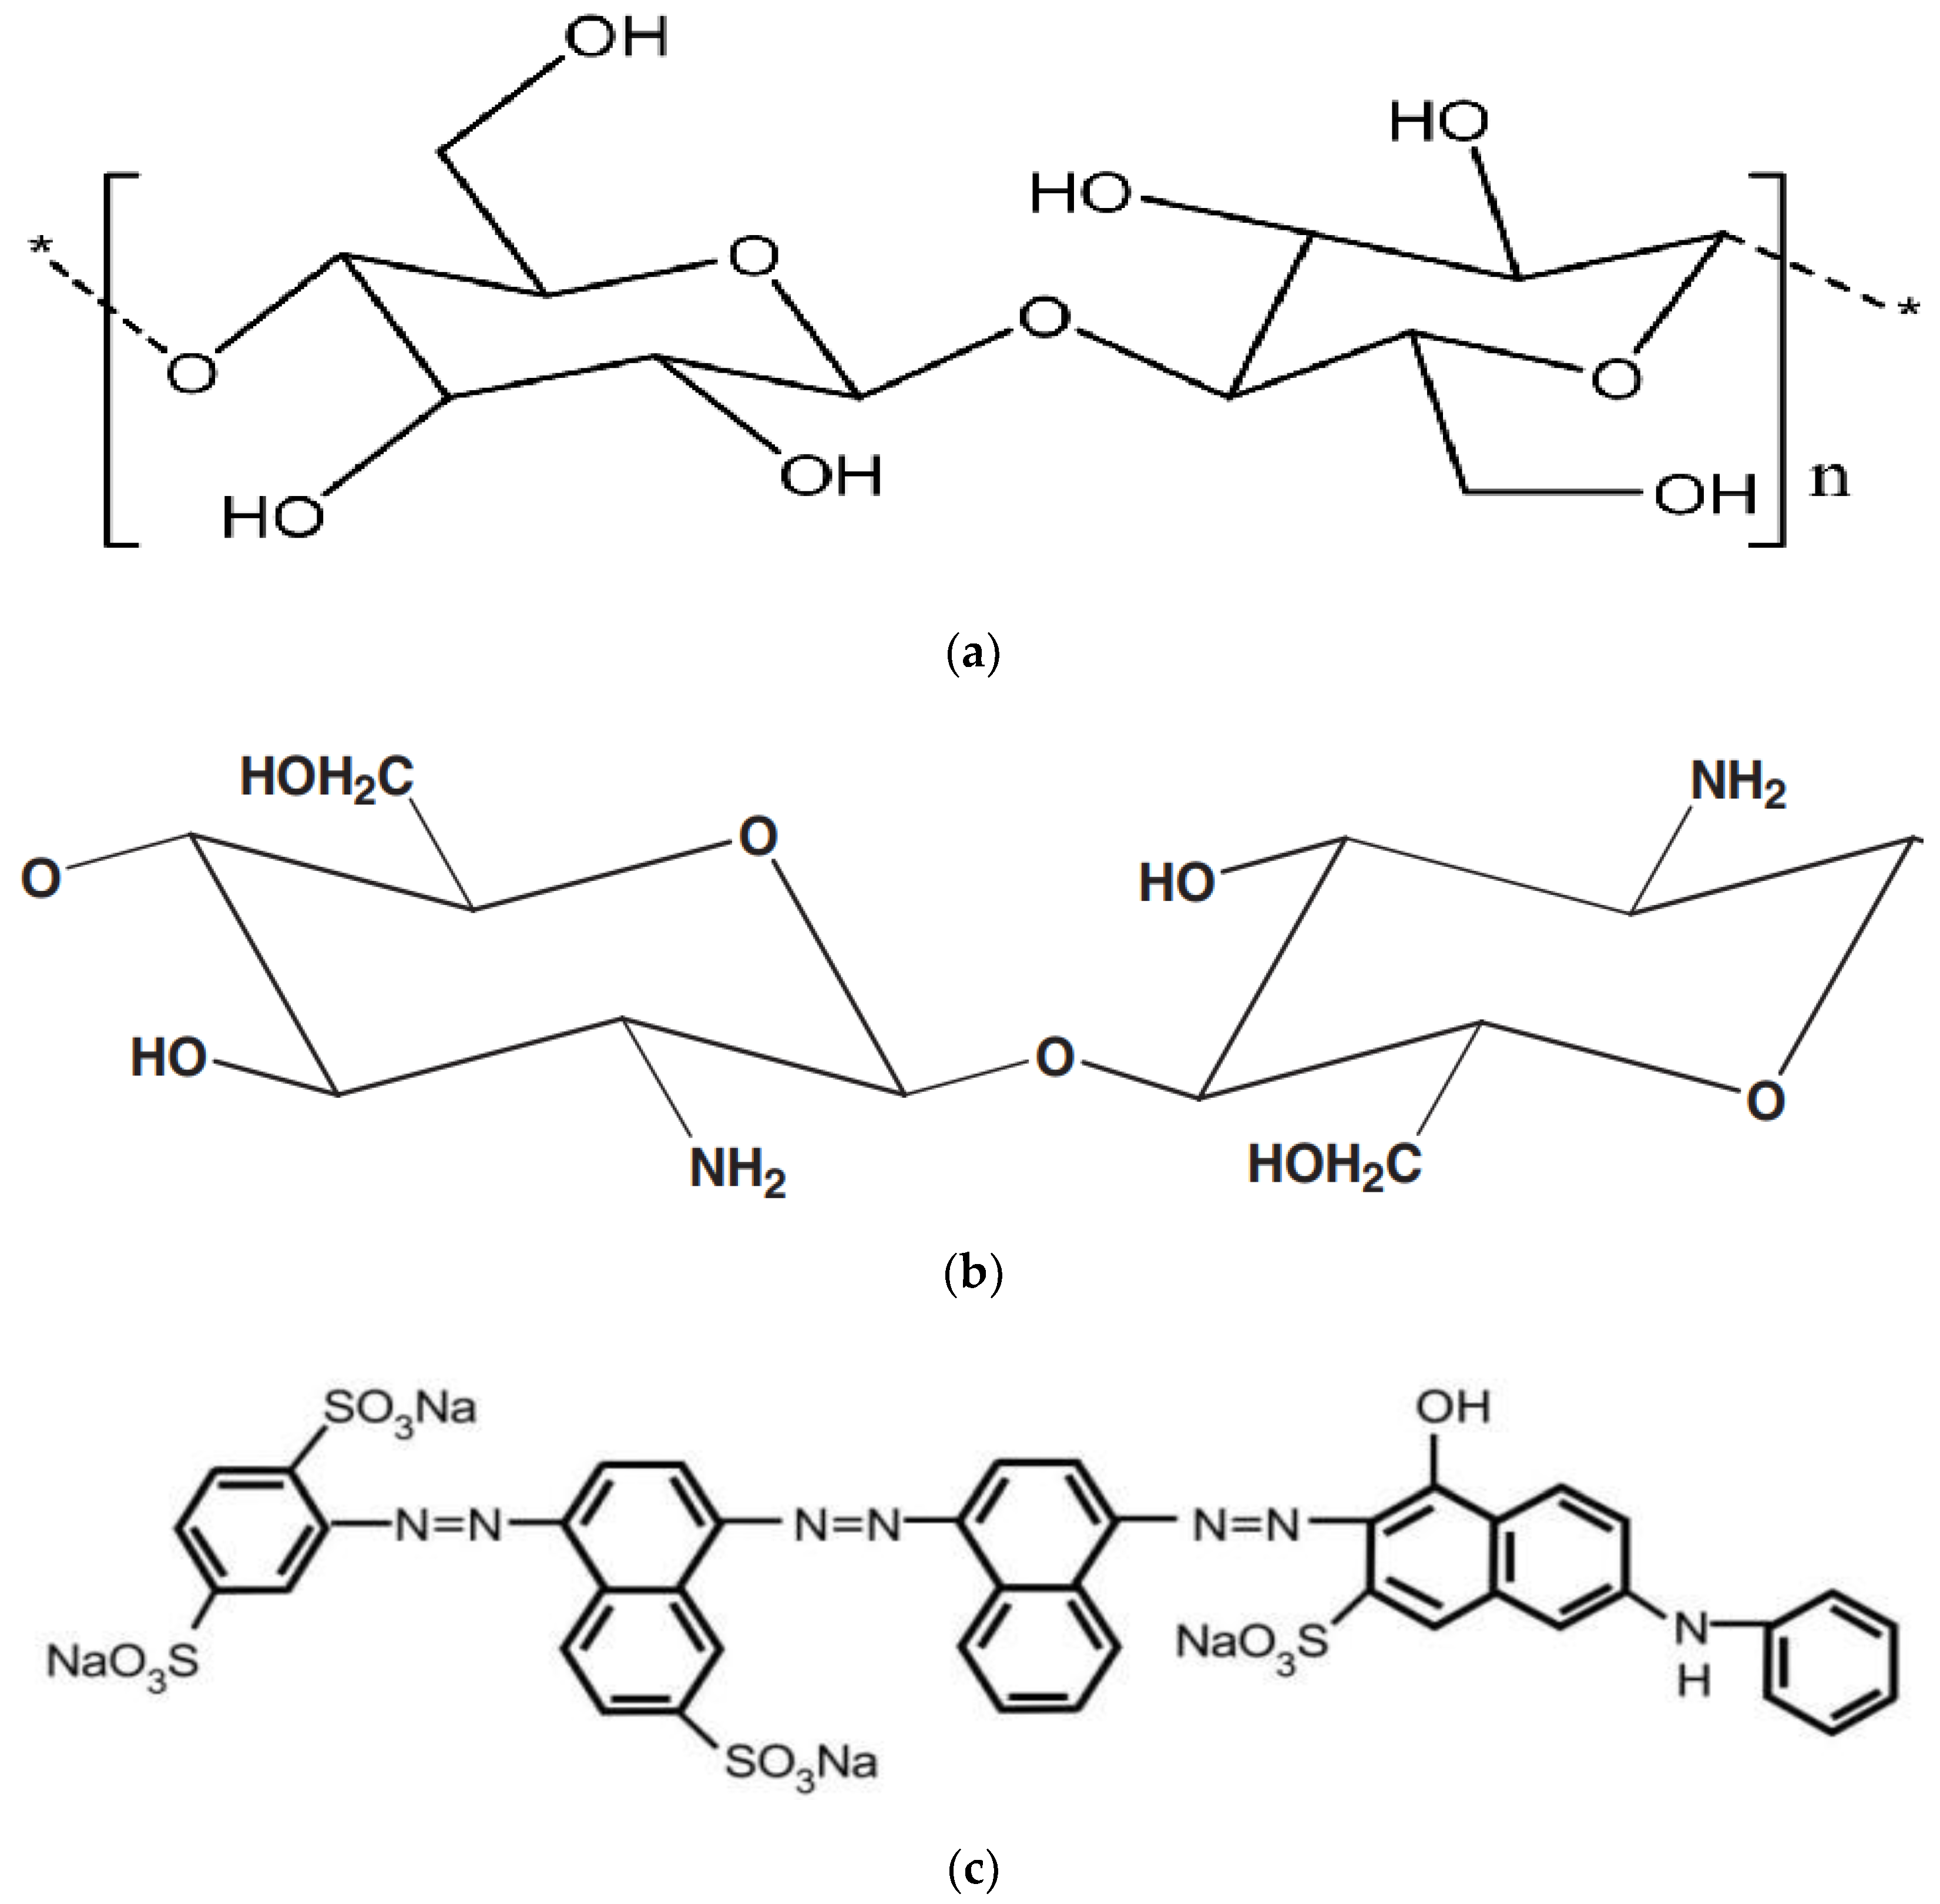
Nanocellulose and Chitosan Nanocomposites

The nanocellulose suspension was diluted in water and ultrasonicated for 30 min in an ultrasonic bath, at 4% (w/v). Model USC-1400 is one-of-a-kind (40 kHz of ultrasound frequency). The Malvern 3000 Zetasizer NanoZS was used to make the measurements (Malvern Instruments, Malvern, WR14 1XZ. UK). This apparatus measures the diffusion of particles moving under Brownian motion and translates the data to size and size distribution, using dynamic light scattering. It also employs laser doppler micro-electrophoresis to provide an electric field to a dispersion of particles, which then move at a rate proportional to their zeta potential. The Smoluchowski algorithm was used to determine the particle size.
The surface area of the CCMB-0.25:1 sample was measured in the presence of N2 adsorption at −195.65 °C, using surface area analyzers (Autosorb-l-C-8, Quantachrome, Boynton Beach, FL, USA). Prior to adsorption studies, the samples were degasified at 200 °C for 4 h. By applying the BET (Brunauer–Emmett–Teller) equation to the adsorption data, the BET surface area for the sample was determined.
The colorimetric analysis was performed in this study, using a spectrophotometer (LAMOTTE smart spectrophotometer v3 2000-01-MN, Washington Ave. Chestertown, MD, USA).
The pH values of nanocellulose, chitosan, and CCMB-0.25:1 solutions were determined by mixing 0.1 g from each sample with 100 mL of distilled water, at a mixing speed of 100 r.p.m., for a period of 1 h and temperature of 25 °C, using a digital pH meter (Omega CDS107, Taiwan).
The surface morphology and porous microstructure of the CCMB-0.25:1 samples were investigated by SEM analysis, using a Quanta 250 FEG scanning electron microscope (Field Electron and Ion company, Hillsboro, OR, USA.).
FTIR studies for the nanocellulose, chitosan, and CCMB-0.25:1 samples were observed by using a VERTEX 80v vacuum FTIR Spectrometer (Bruker corporation, Oberkochen, Germany).

3. Results and Discussion

3.1. Characterization of Nanocellulose

The extracted nanocellulose was characterized by using zeta sizer to measure the particles size. Chemical structure was determined by using FTIR analysis.

3.1.1. Size of Nanocellulose

To generate hydrodynamic diameter dimensions, light-scattering data were automatically evaluated and computed by using the built-in Zetasizer program. Figure 4 illustrates the particle size distribution acquired from DLS; it demonstrates that 95.5 percent of particles fall between nano-dimensions (up to 300 nm).

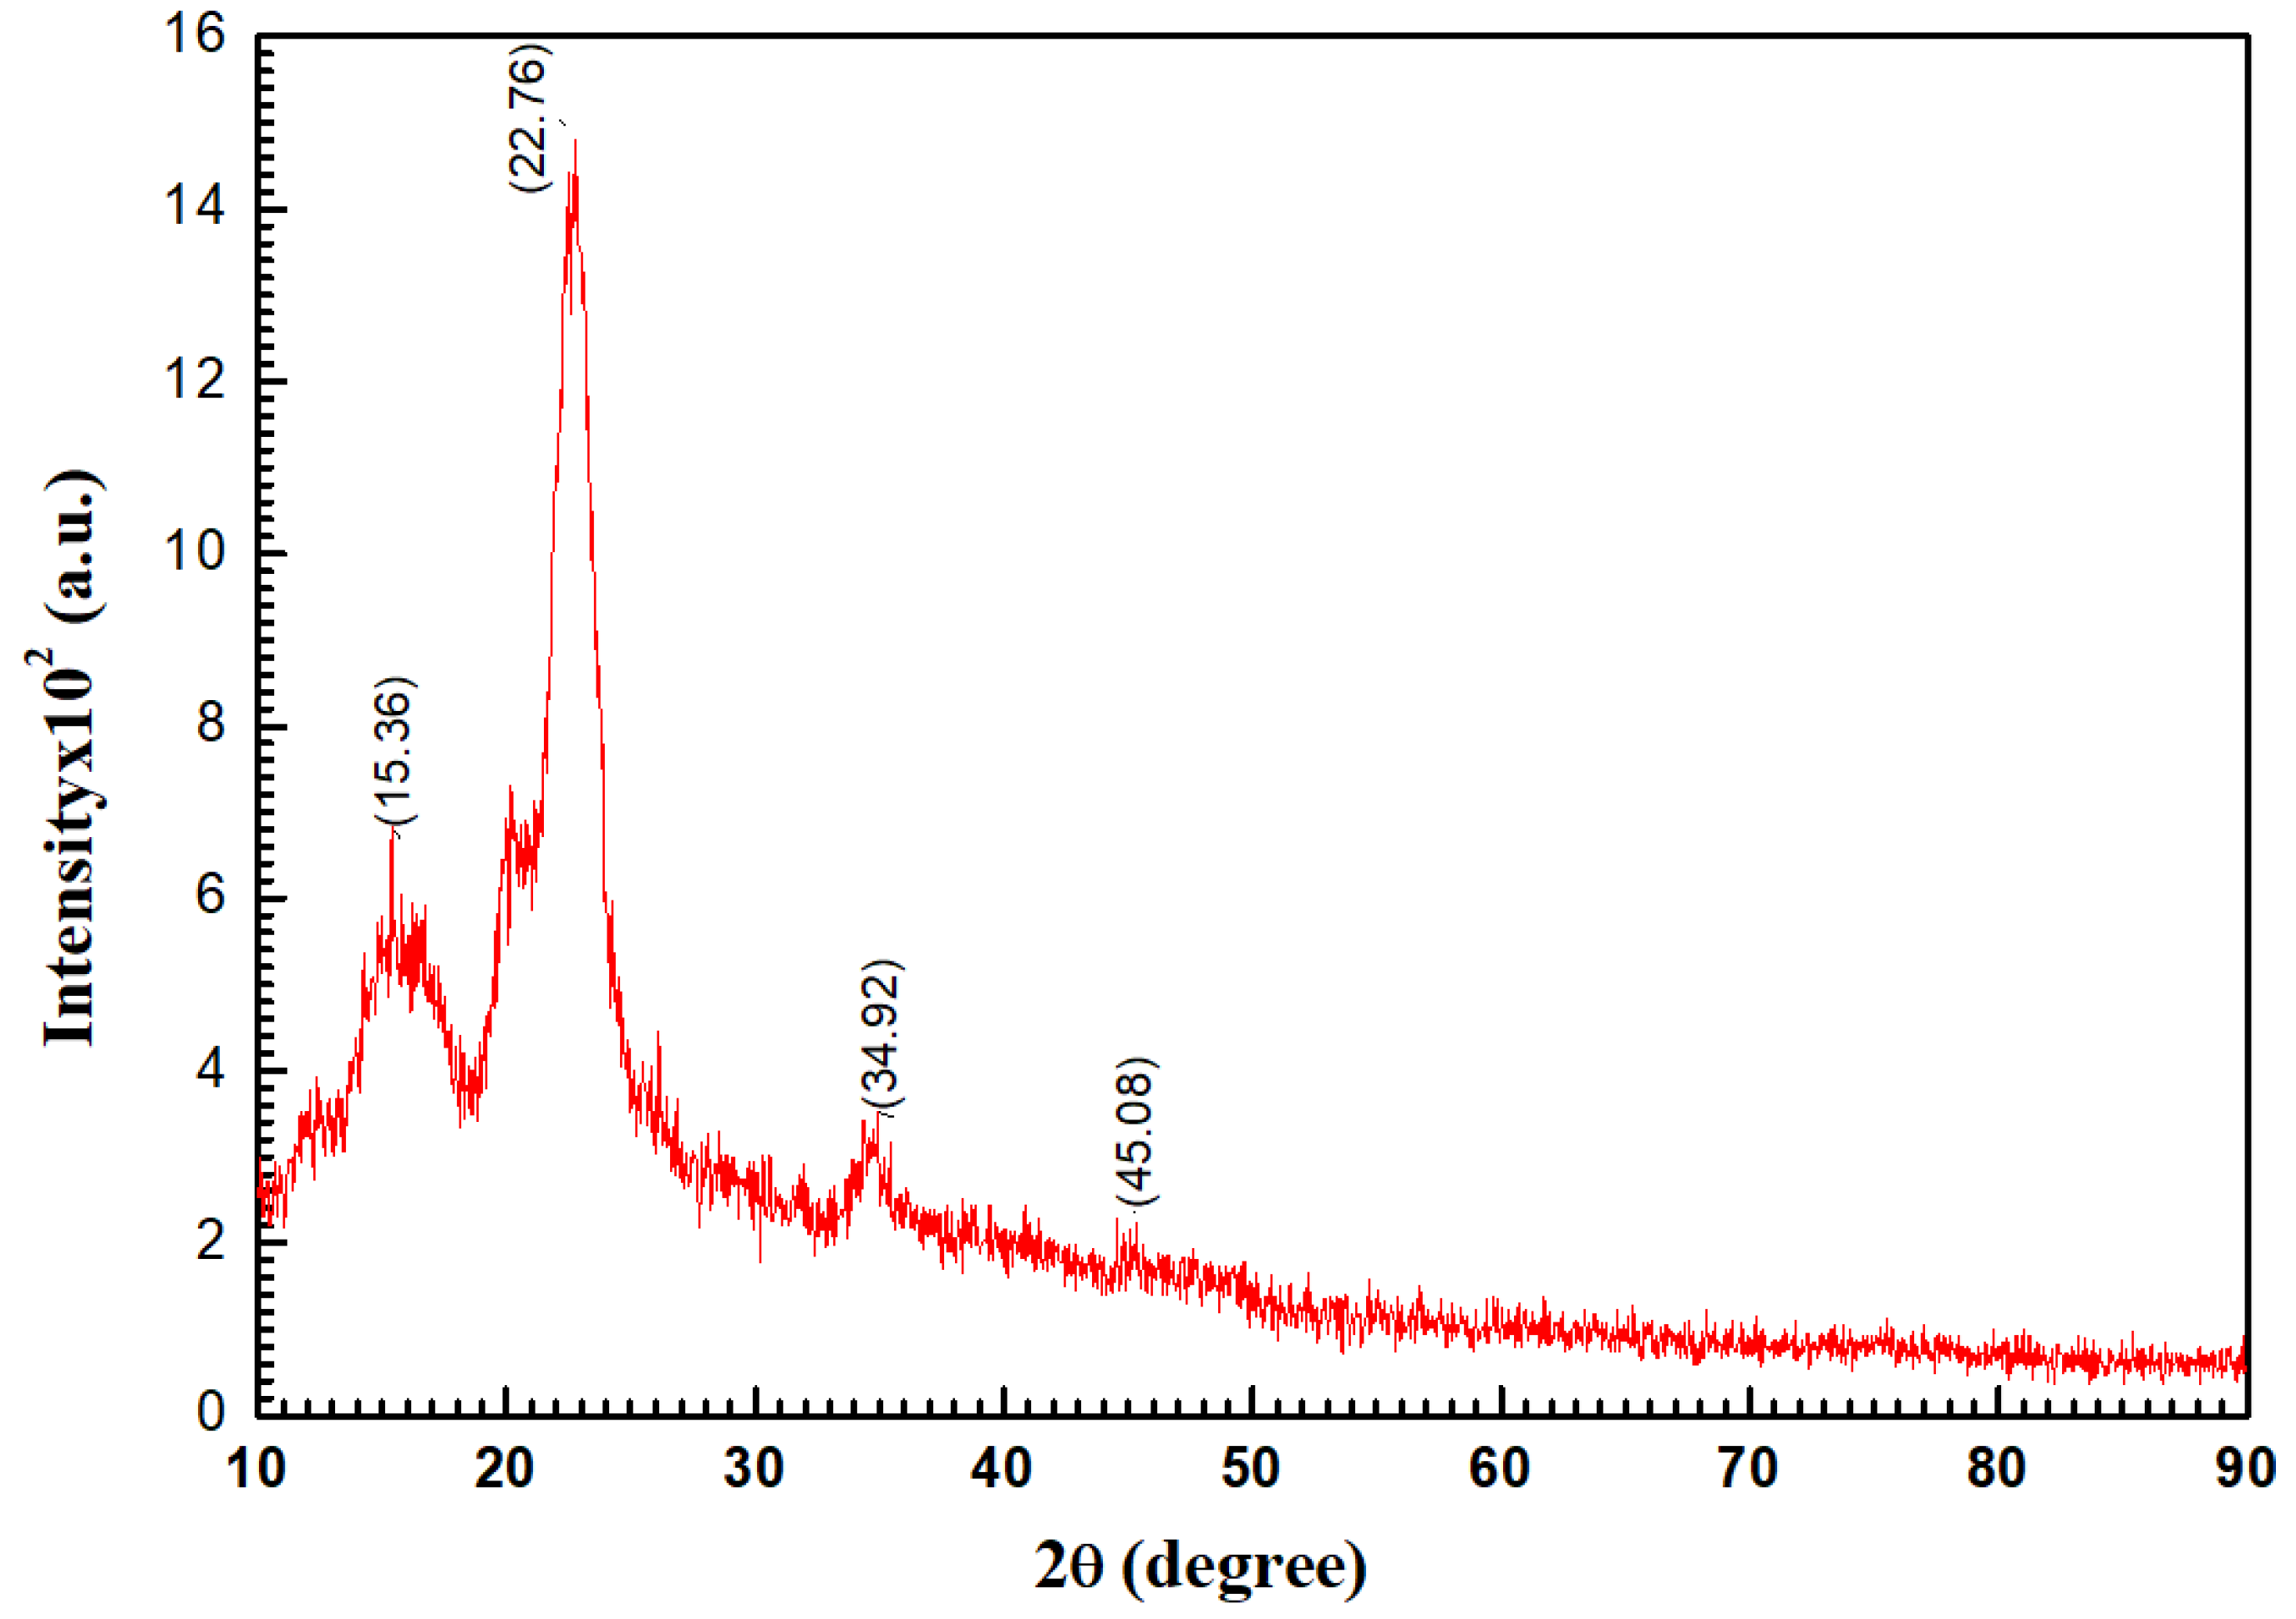
3.1.2. X-Ray Diffraction (XRD) Analysis

Figure 5 shows the XRD pattern of the cellulose powder; the broad peaks indicate the amorphous nature of the cellulose powder. The XRD data (angle of diffracted beams, Miller indices (hkl), interplanar spacing, full width at half-maximum, and crystalline size (D) of cellulose powder) are listed in Table 1. Based on the diffraction peaks, a monoclinic 2 structure of cellulose was recorded with the following lattice parameters: a = 15.9634 Å, b = 7.85020 Å, c = 10.8664 Å, α = γ = 90, and β = 97.931°. The lattice parameters were calculated from the peak position, as given by the following relation [49]:
1 d 2 = 1 s i n 2 θ ( h 2 a 2 + k 2 s i n 2 β b 2 + l 2 c 2 2 h k c o s β a c ) + l 2 c 2  
As shown in Table 1, the estimated crystallite size (D) and miller index (hkl) are dependent on the absolute values of full width at half maximum (FWHM). The data in database code_amcsd 0,017,094 agree well with the interplanar distances’ d-spacing [50], according to the American Mineralogist Crystal Structure Database. The Debye–Scherrer method was applied to assessed XRD for cellulose powder, the range of 10 ≤ 2θ ≤ 90 with 1 / d h k l = 0.0566 1 0.7446 1 , λ = 1.540562   , I 2 / I 1 = 0.5 , polarization = 0.5, and function Pseudo-Voigt. From Scherer’s formula, we obtain the following:
D = 0.9 λ F W H M . c o s θ  
where λ is the X-ray wavelength (1.541838 Å). As presented in Table 1, for cellulose powder, the XRD data from the XRD pattern were used to examine factors and features such as FWHM, the crystallite size (D), hkl indices, d-spacing (d), and peak intensity. The crystalline size D a v = 164.71   nm was within the range of 83.04–183.56 nm for cellulose powder. While, for both the experimental and PXRD models, the intensity and location of specific peaks vary only slightly, the emphasis here is mostly on their overall resemblance. Only the important comparison characteristics between the measured and the experimental data should therefore be evaluated. It is also known that instrumentation and data-collection processes are only two of the many variables that can affect the experimental PXRD pattern. Employing X-ray powder diffraction to distinguish patterns of cellulose Iα and cellulose Iβ is exceedingly difficult, due to their overlap [51].

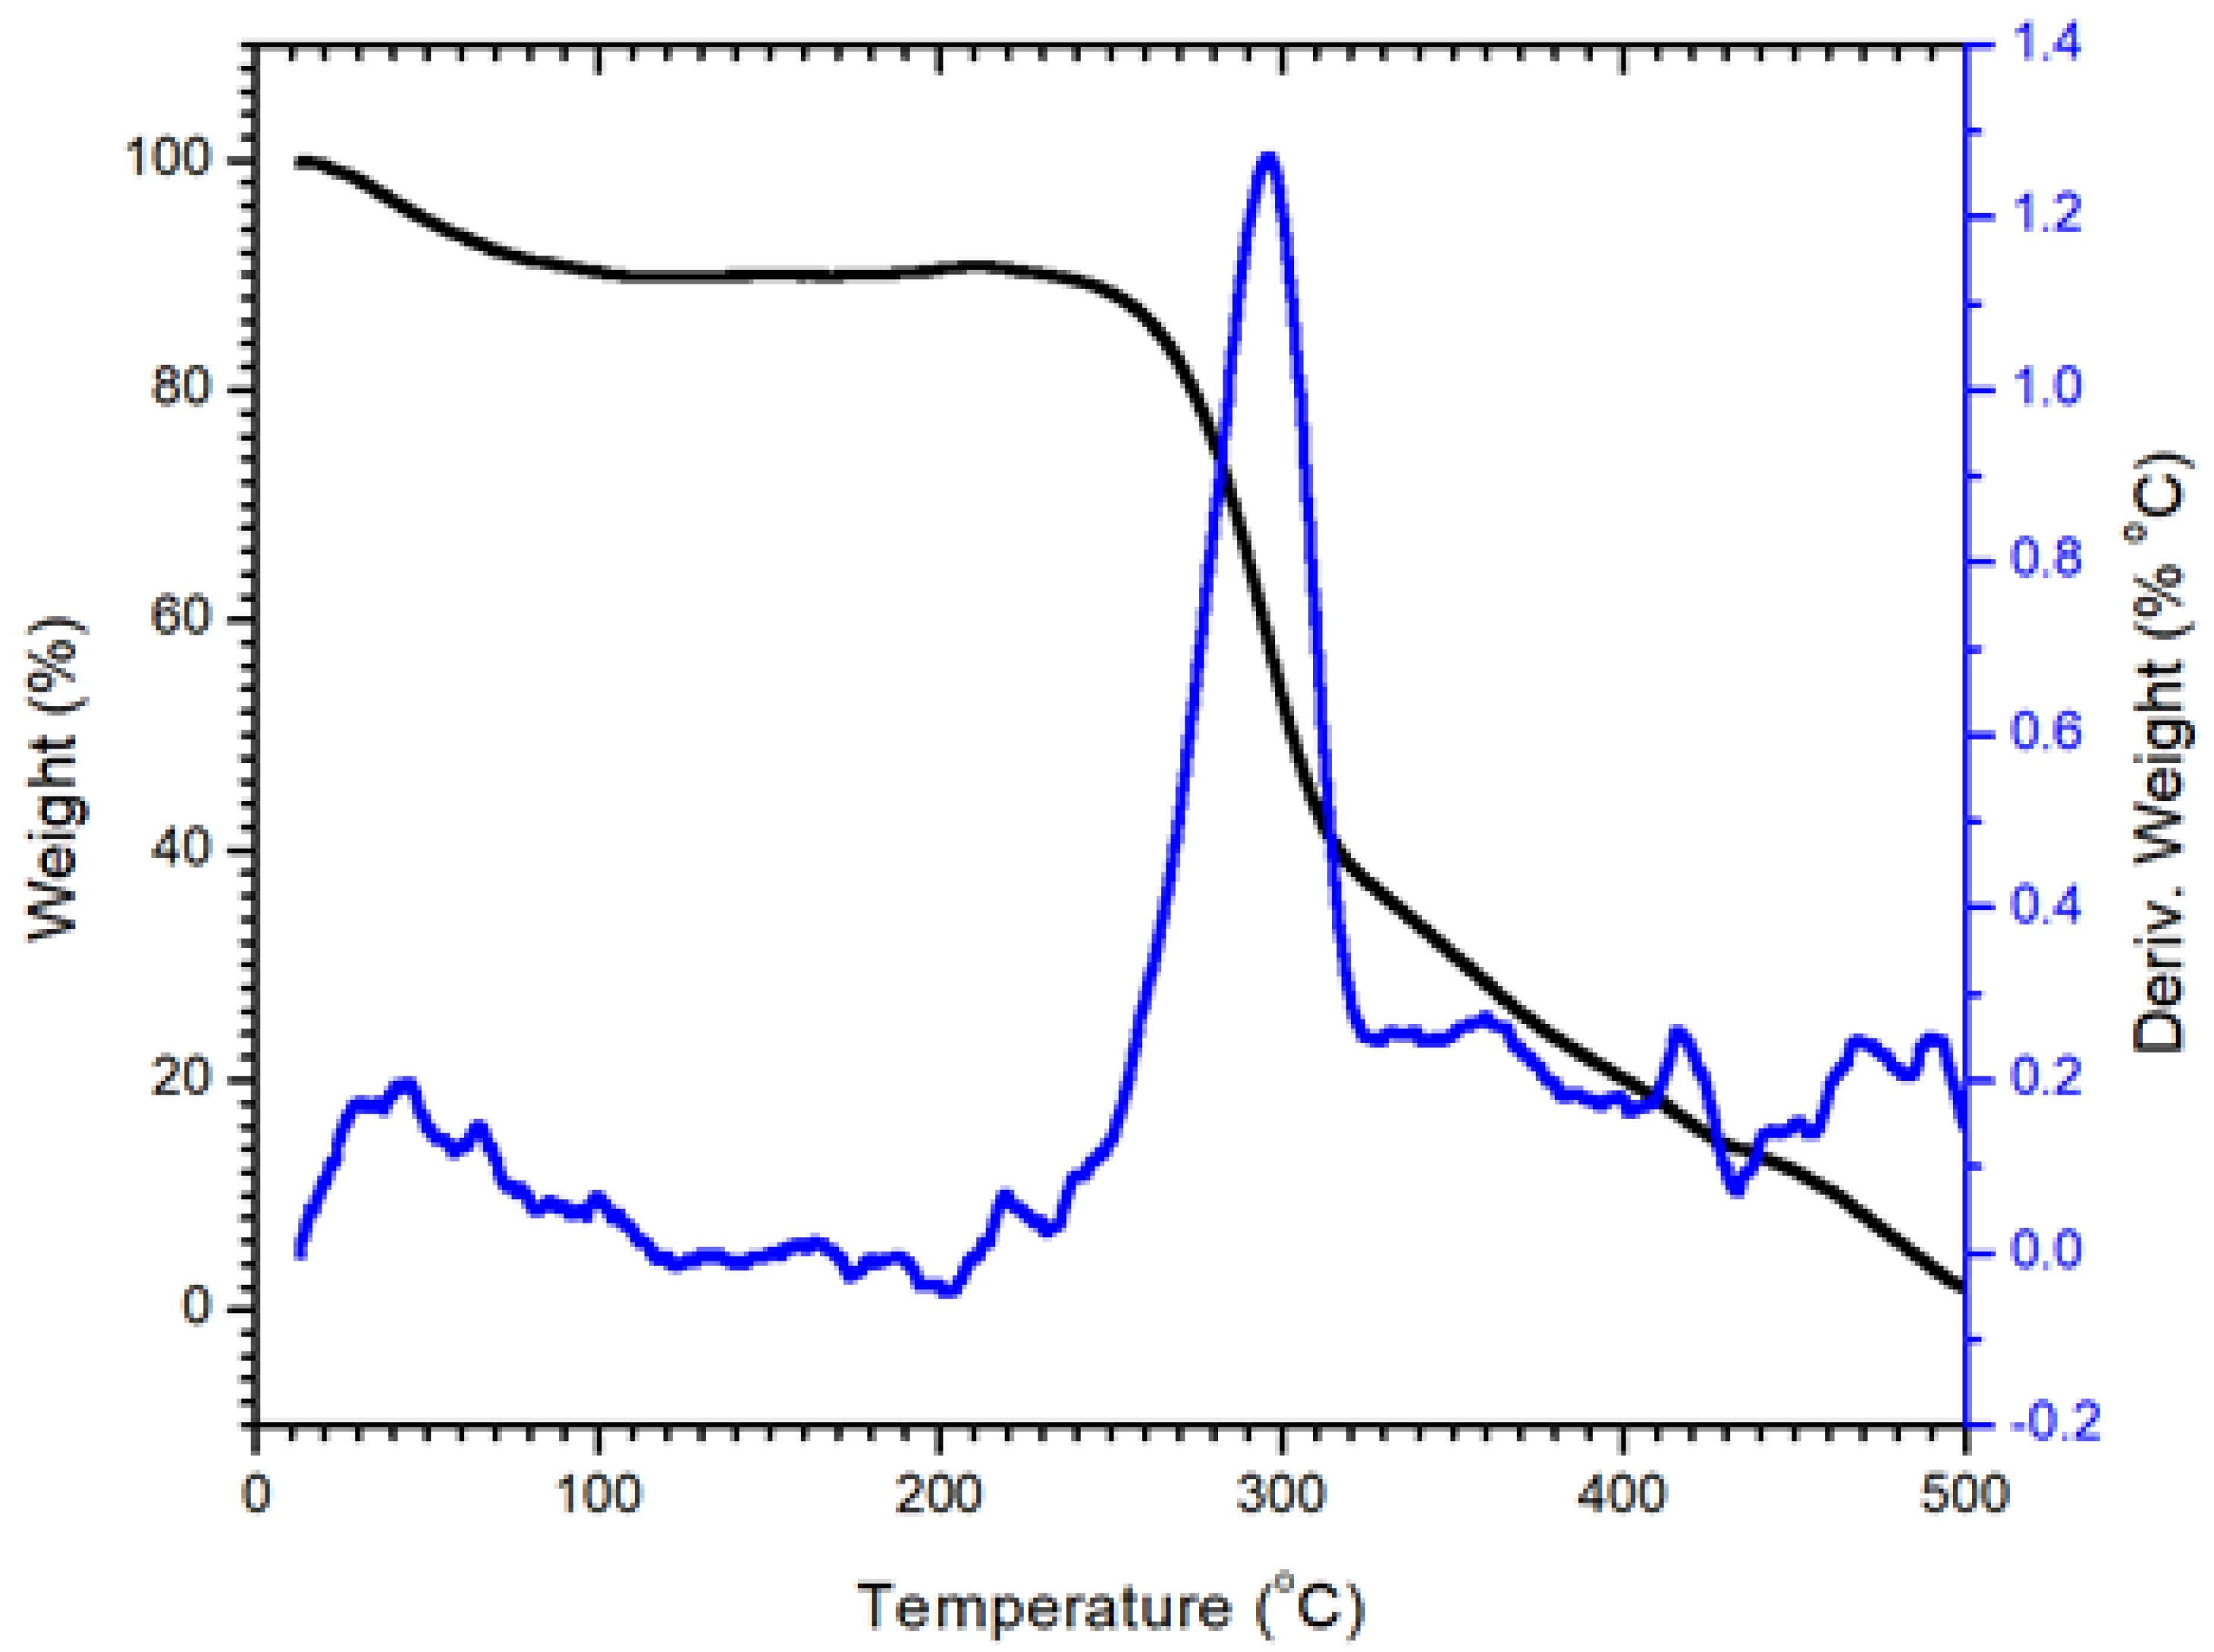
3.1.3. Thermal Analysis of Nanocellulose

The stability properties of cellulose are shown in Figure 6. At temperatures below 100 °C, moisture evaporation was observed in the cellulose samples. There was low weight loss within this stage because the amount of absorbed water or moisture in cellulose is low. Around 7% weight loss was recoded up to 100 °C. This process mostly relates to water moisture evaporation below 100 °C, as validated by the DrTGA investigation shown in Figure 7. It was found that cellulose breakdown began at 307 °C and lasted until 340 °C. These results are in a good agreement with the reported data [52]. The thermal stability of cellulose chains is enhanced by their highly ordered packing into systems (crystals) and by strong hydrogen bonding. The crystalline structure of cellulose is essential for its heat stability [53]. The observed narrow curve at DrTGA 307 °C might potentially be due to more surface area exposed to the heat and partial disruption when the temperature increased from 270 °C to 340 °C. Finally, the decomposition of cellulose was found from 330 to 500 °C. This stage can be attributed to cellulose oxidation. One medium peak can be found in the DrTGA curve at a temperature of 420 °C and refers to the decomposition of polymer chains of cellulose. A similar result was reported for nanocellulose decomposition using TGA at around 420 °C [54,55].

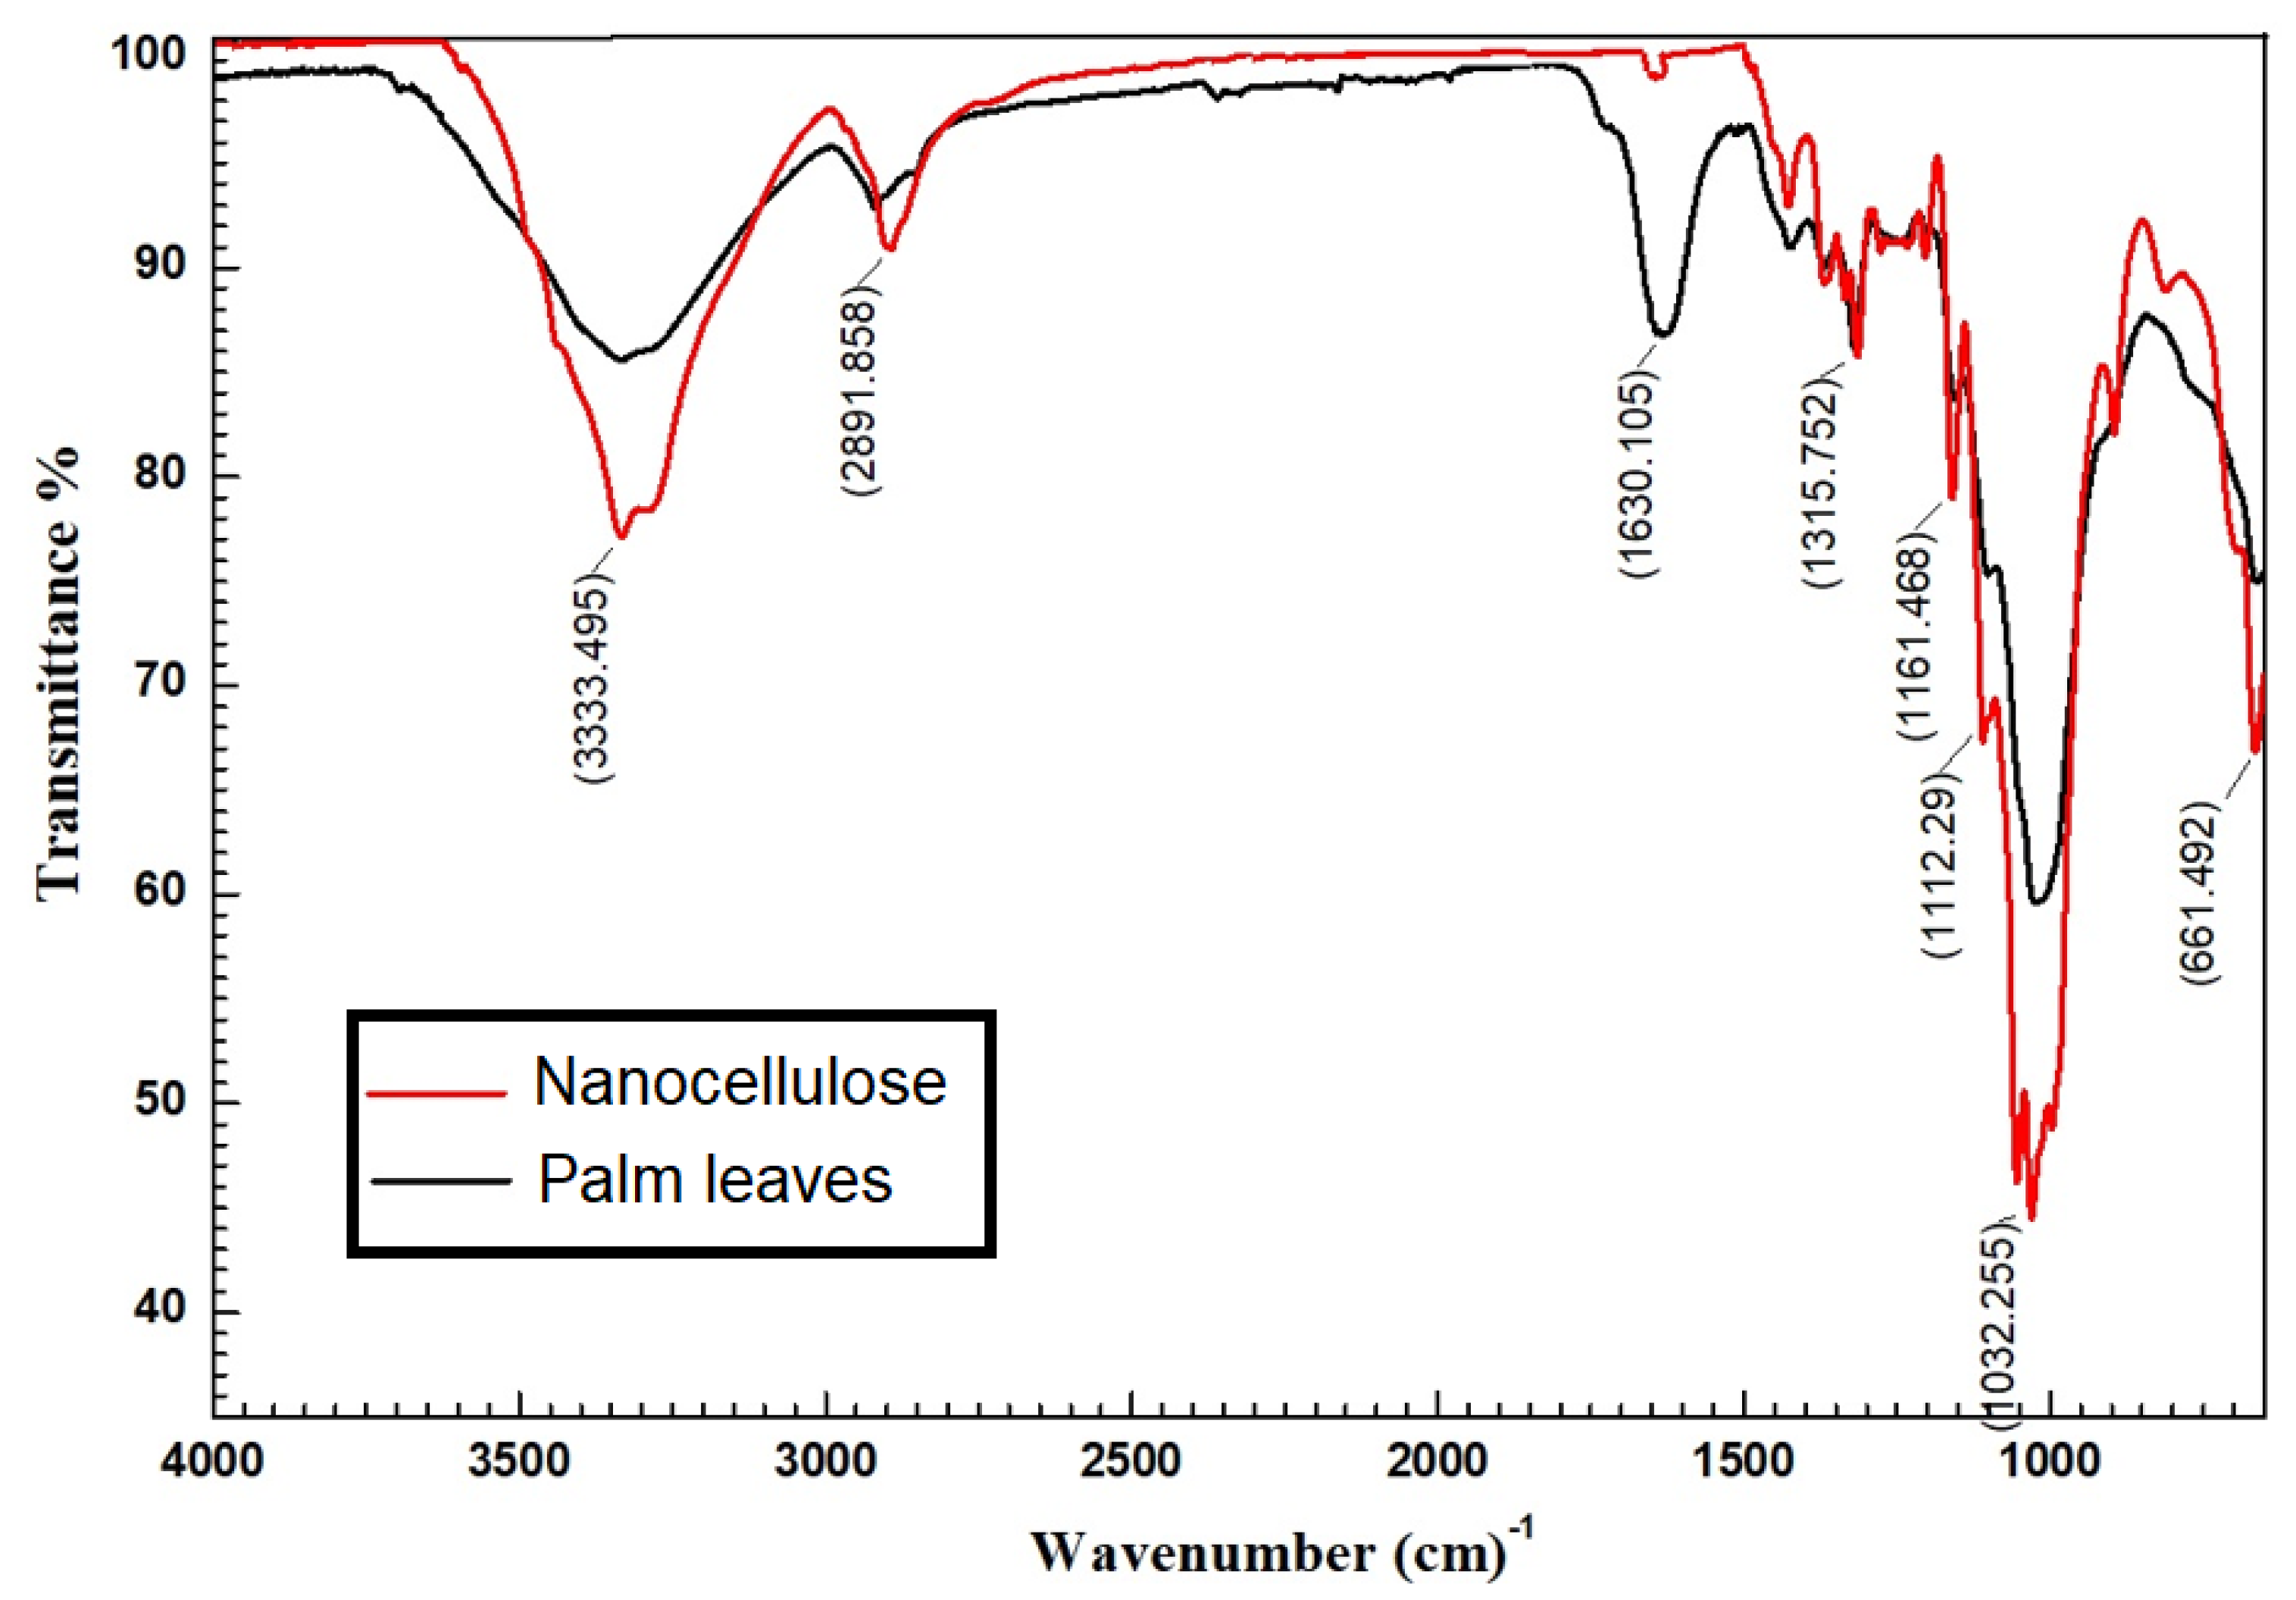
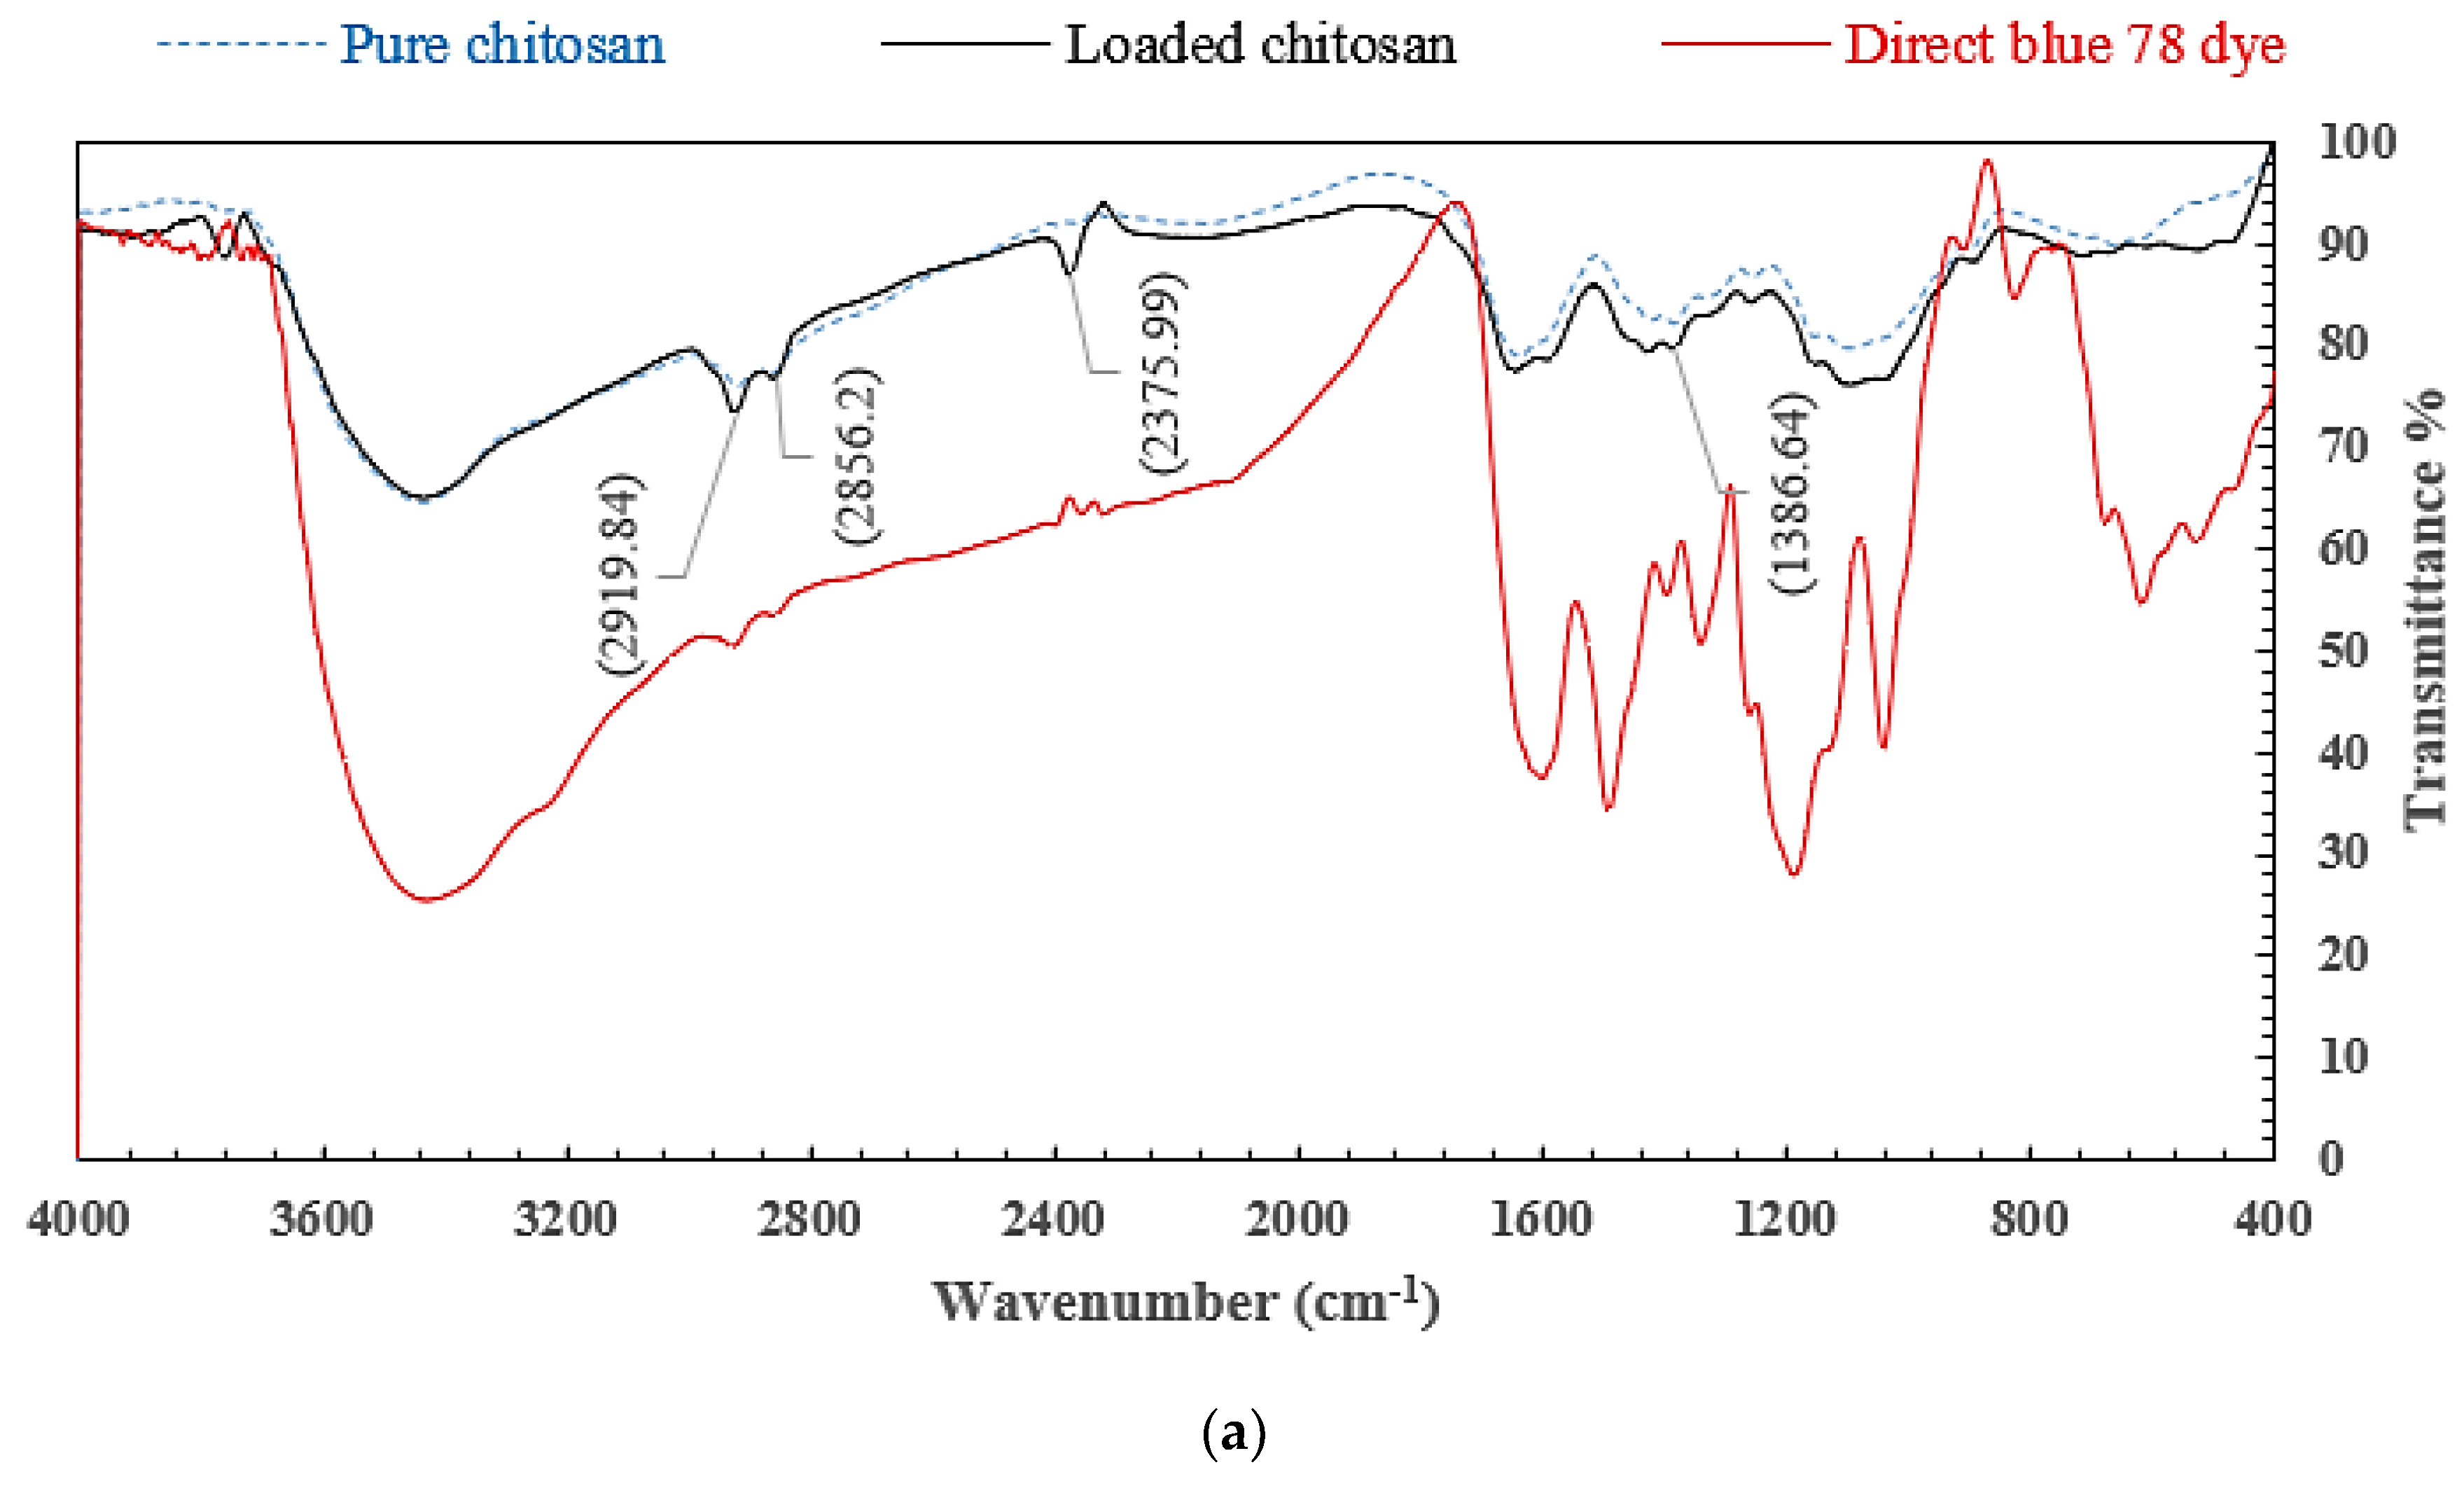
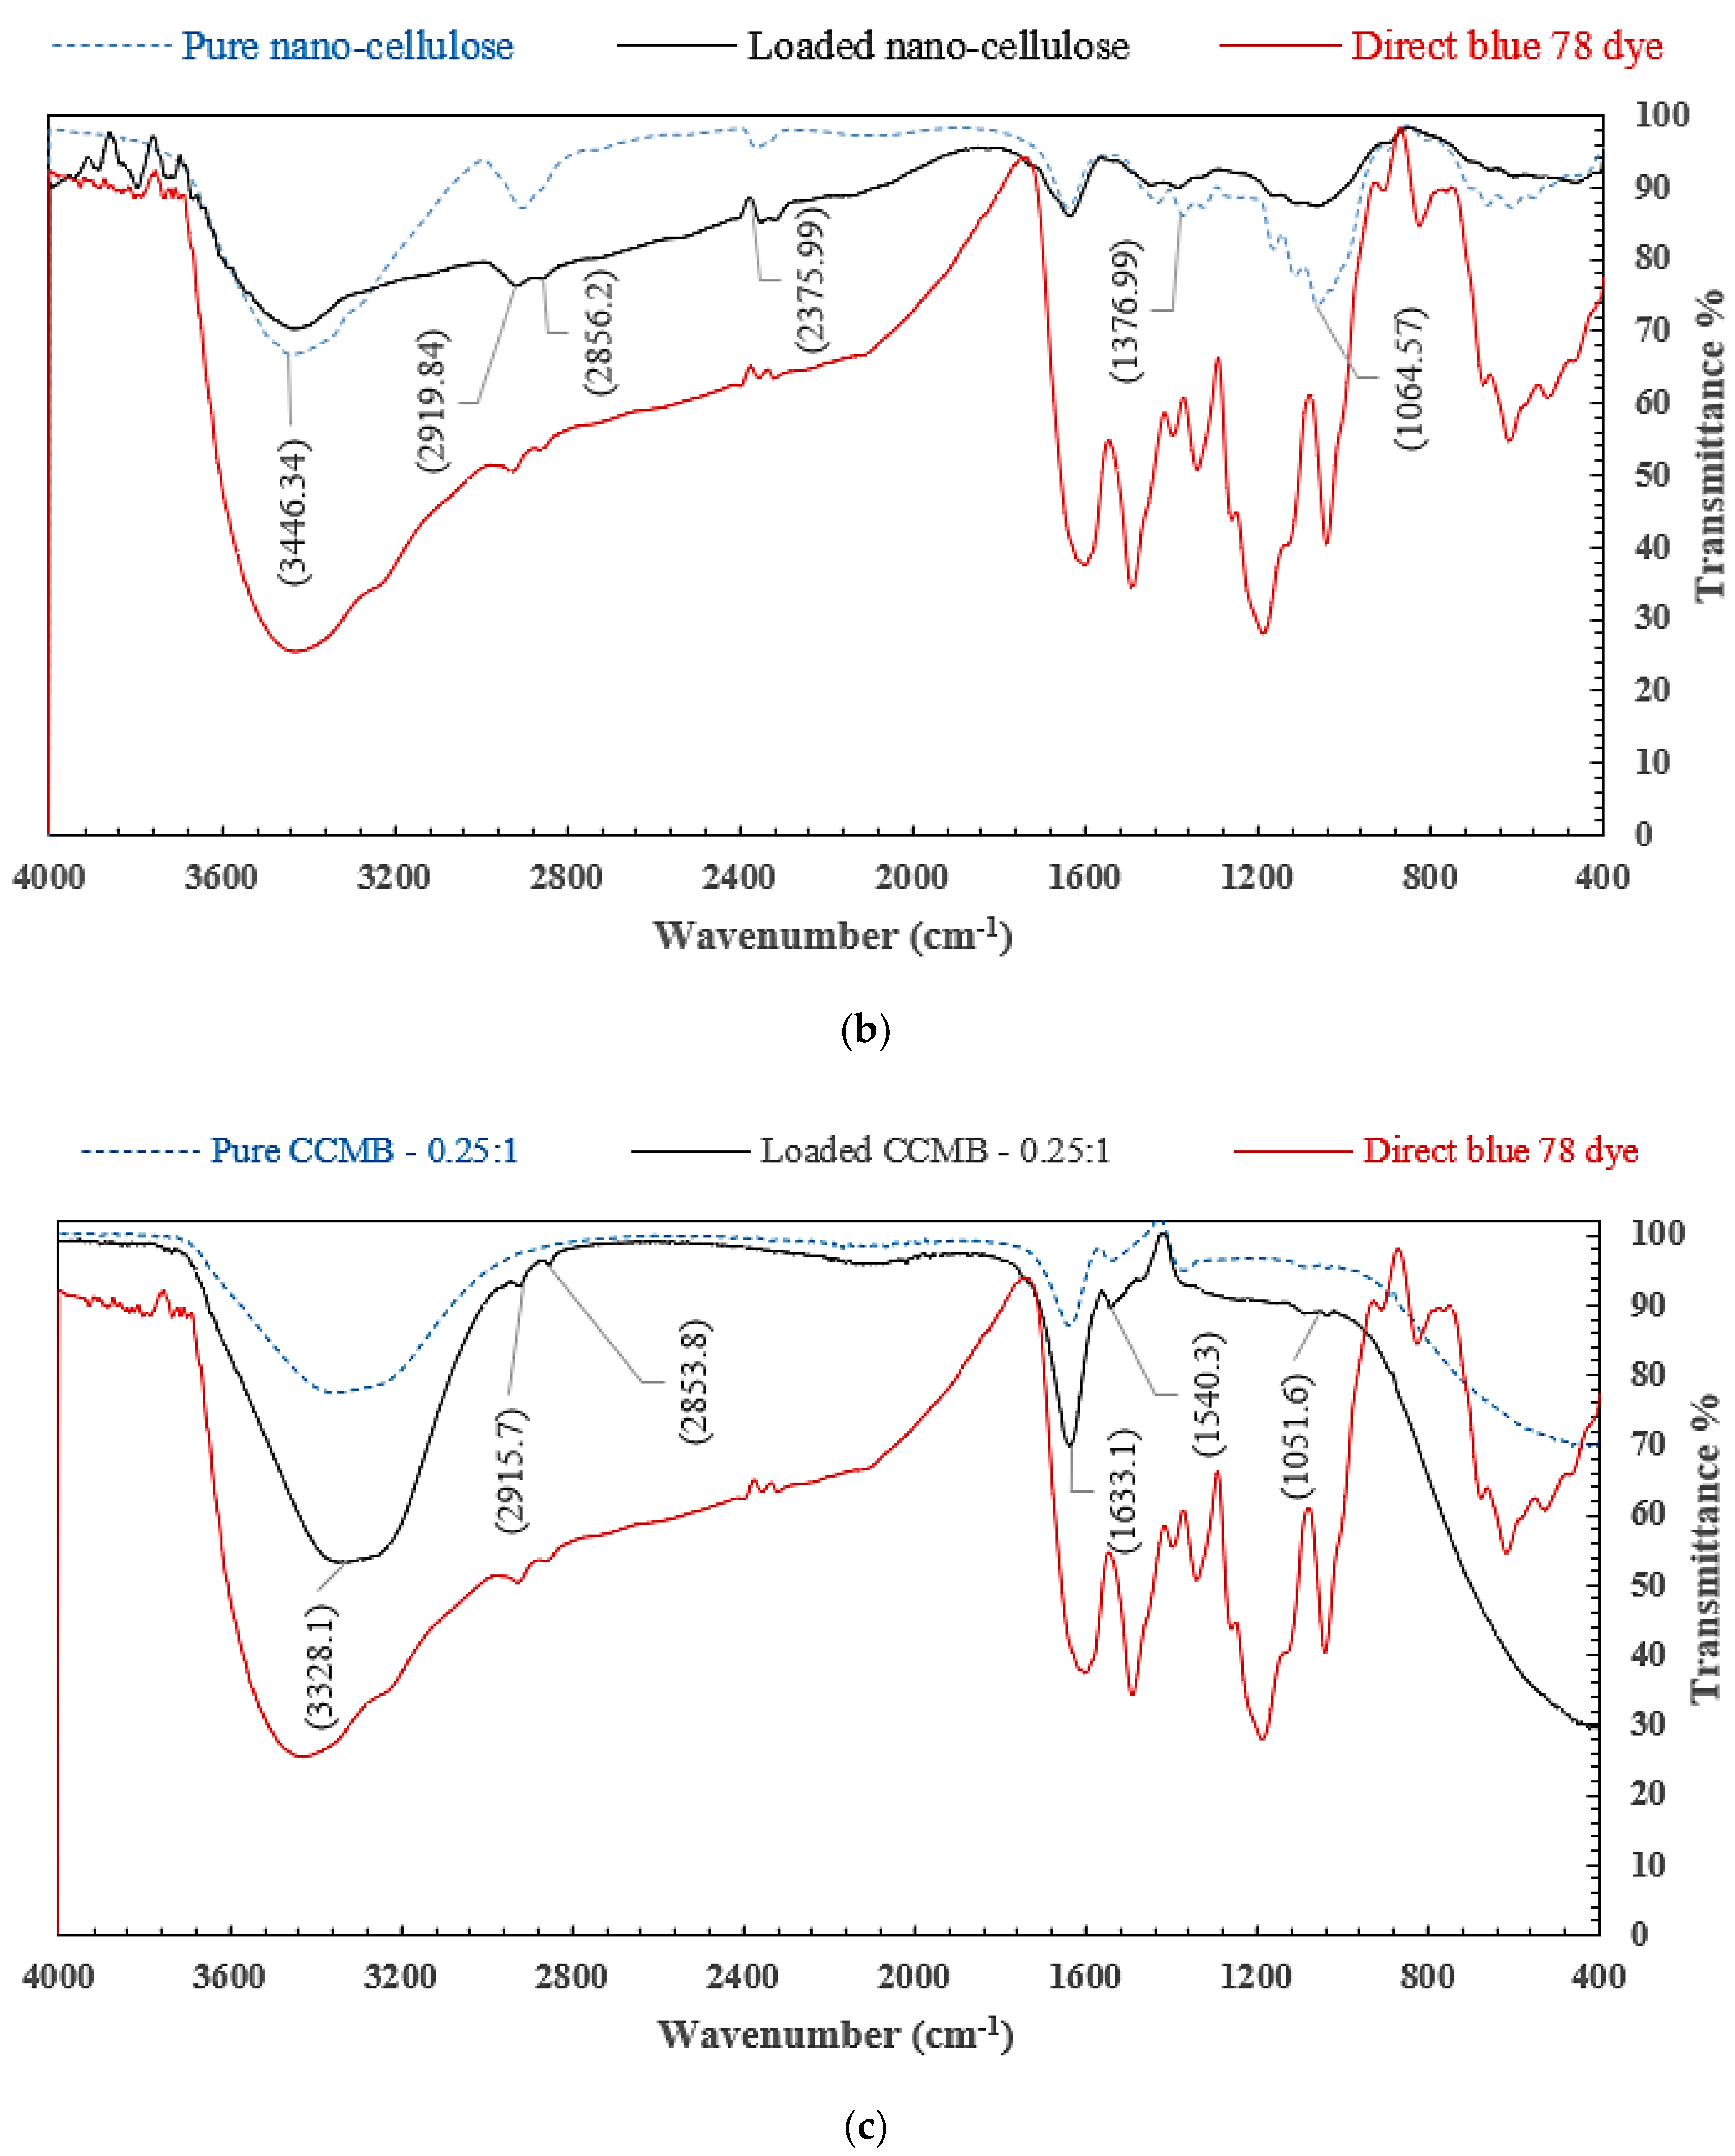
3.1.4. FTIR Analysis

The FTIR results of cellulose and palm fibers are shown in Figure 8. The results show that the cellulose has a broadband at the 3432 cm−1 region that can be attributed to O-H groups’ stretching vibration. As shown in the spectrum, the bands appearing in the regions (1322–1429), (2997–3766), (1561–1806), and (626–843) cm−1 can be attributed to the hydroxide group of water molecule and may be bending, stretching, rocking, and wagging vibrations. This indicates the presence of water molecules in the studied copolymer [56]. There were several absorption bands that were associated with the cellulose, and we it was also observed that 1160 and 1062 cm−1 were attributable to C-O bond stretching [57]. The cellulose with abundant surface hydroxyl groups was investigated by using FTIR, as shown in Figure 8. The appearance of a new peak at 1161cm−1 is associated with C=C stretching [58]. The absorption peak noticed at 1630 cm−1 refers to the O-H bond of absorbed water.
The appearance of a new peak at 2354 cm−1 that was associated with ester groups was intensively observed on cellulose. Among the three kinds of OH groups, the OH group of the sixth position acts as a primary alcohol, where most of the modification predominantly occurs [59].

3.2. Characterization of Nanocomposites

Surface Morphology of Nanocomposites

Because of the importance of surface morphology and its great influence on the adsorption process, SEM analysis was investigated for CCMB-0.25:1 in order to identify its surface morphology and nanocellulose particles’ distribution on the beads’ surface. Figure 7 shows the SEM image for the nanocellulose/chitosan microbead (CCMB) surface. The SEM images showed that all nanocellulose particles were incorporated effectively into chitosan network, and there is no agglomeration of large numbers of nanoparticles the on small surface area. This efficient distribution of nanocellulose particles on the chitosan microbeads’ outer surface resulted in the creation of a large number of adsorption active sites. Moreover, it can be noticed from the SEM analysis that CCMB has an average particle size of 2 µm, with a large number of micropores.
The efficiency of the adsorption process is affected by the distribution of cellulose particles on the bead surface; with a uniform distribution of nanocellulose particles on beads’ surface, the adsorption behavior would be improved. The BET surface area for CCMB-0.25:1 was determined (SBET = 10.4 m2/g).
In order to classify the main infrared (IR) bands of organics and determinate the adsorption mechanism (physisorption or chemosorption), pure and loaded samples of chitosan, nanocellulose, and CCMB-0.25:1 were investigated by FTIR analysis. As shown in Figure 9a, the peaks at 2919 and 2856 cm−1 can be attributed to C-H symmetric and asymmetric stretching, respectively. The cH2 bending and cH3 symmetrical deformations were confirmed by the presence of a peak at 1386 cm−1. The new peaks that appeared in the FTIR spectra for loaded chitosan when compared with the pure chitosan are attributed to the chemical bond formed between dyes molecules and -NH2 groups on the surface of chitosan particles after the adsorption process. These results were also reported by Reference [60].
Figure 9b shows the FTIR analysis of nanocellulose before and after dye adsorption. The peaks at 3446 and 2919 cm−1 can be attributed to an O-H stretching band caused by the hydrogen-bonded hydroxyl group variations of cellulose and aliphatic saturated symmetric C-H stretching variations in cellulose, respectively. The presence of bands at 1660 cm−1 can also be caused by O-H bending modes of adsorbed water. The C-O-C band was also confirmed by the pretense of a peak at 1064 cm−1. When comparing the two spectra, we noticed that there is no difference. New peaks have not yet appeared, but the peak wave number shifted to higher values. That means that chemical bonds were not formed, and the adsorption process was conducted due to the electrostatic interaction between anionic dyes molecules and H+ ions accumulated on the nanocellulose surface in acidic conditions [61].
Figure 9c shows the FTIR spectra for pure and loaded CCMB-0.25:1. It was observed that there is a significant difference. This difference is attributed to the chemical bonds formed between -SO3 groups on dye molecules and -NH3+ groups on the beads’ surface.
The most relevant difference is the appearance of bands at 2915 and 2853 cm−1. These bands originated from dye molecules attached to the beads’ surface after adsorption process. Figure 9c also shows the -OH stretching vibration, which can be represented by the peak at 3328 cm−1. The stretching frequency of the –NH2 groups can be seen from the broad band at 16,330 cm−1. The peak at 1540 cm−1 could be due to the N−H stretching vibration [62].

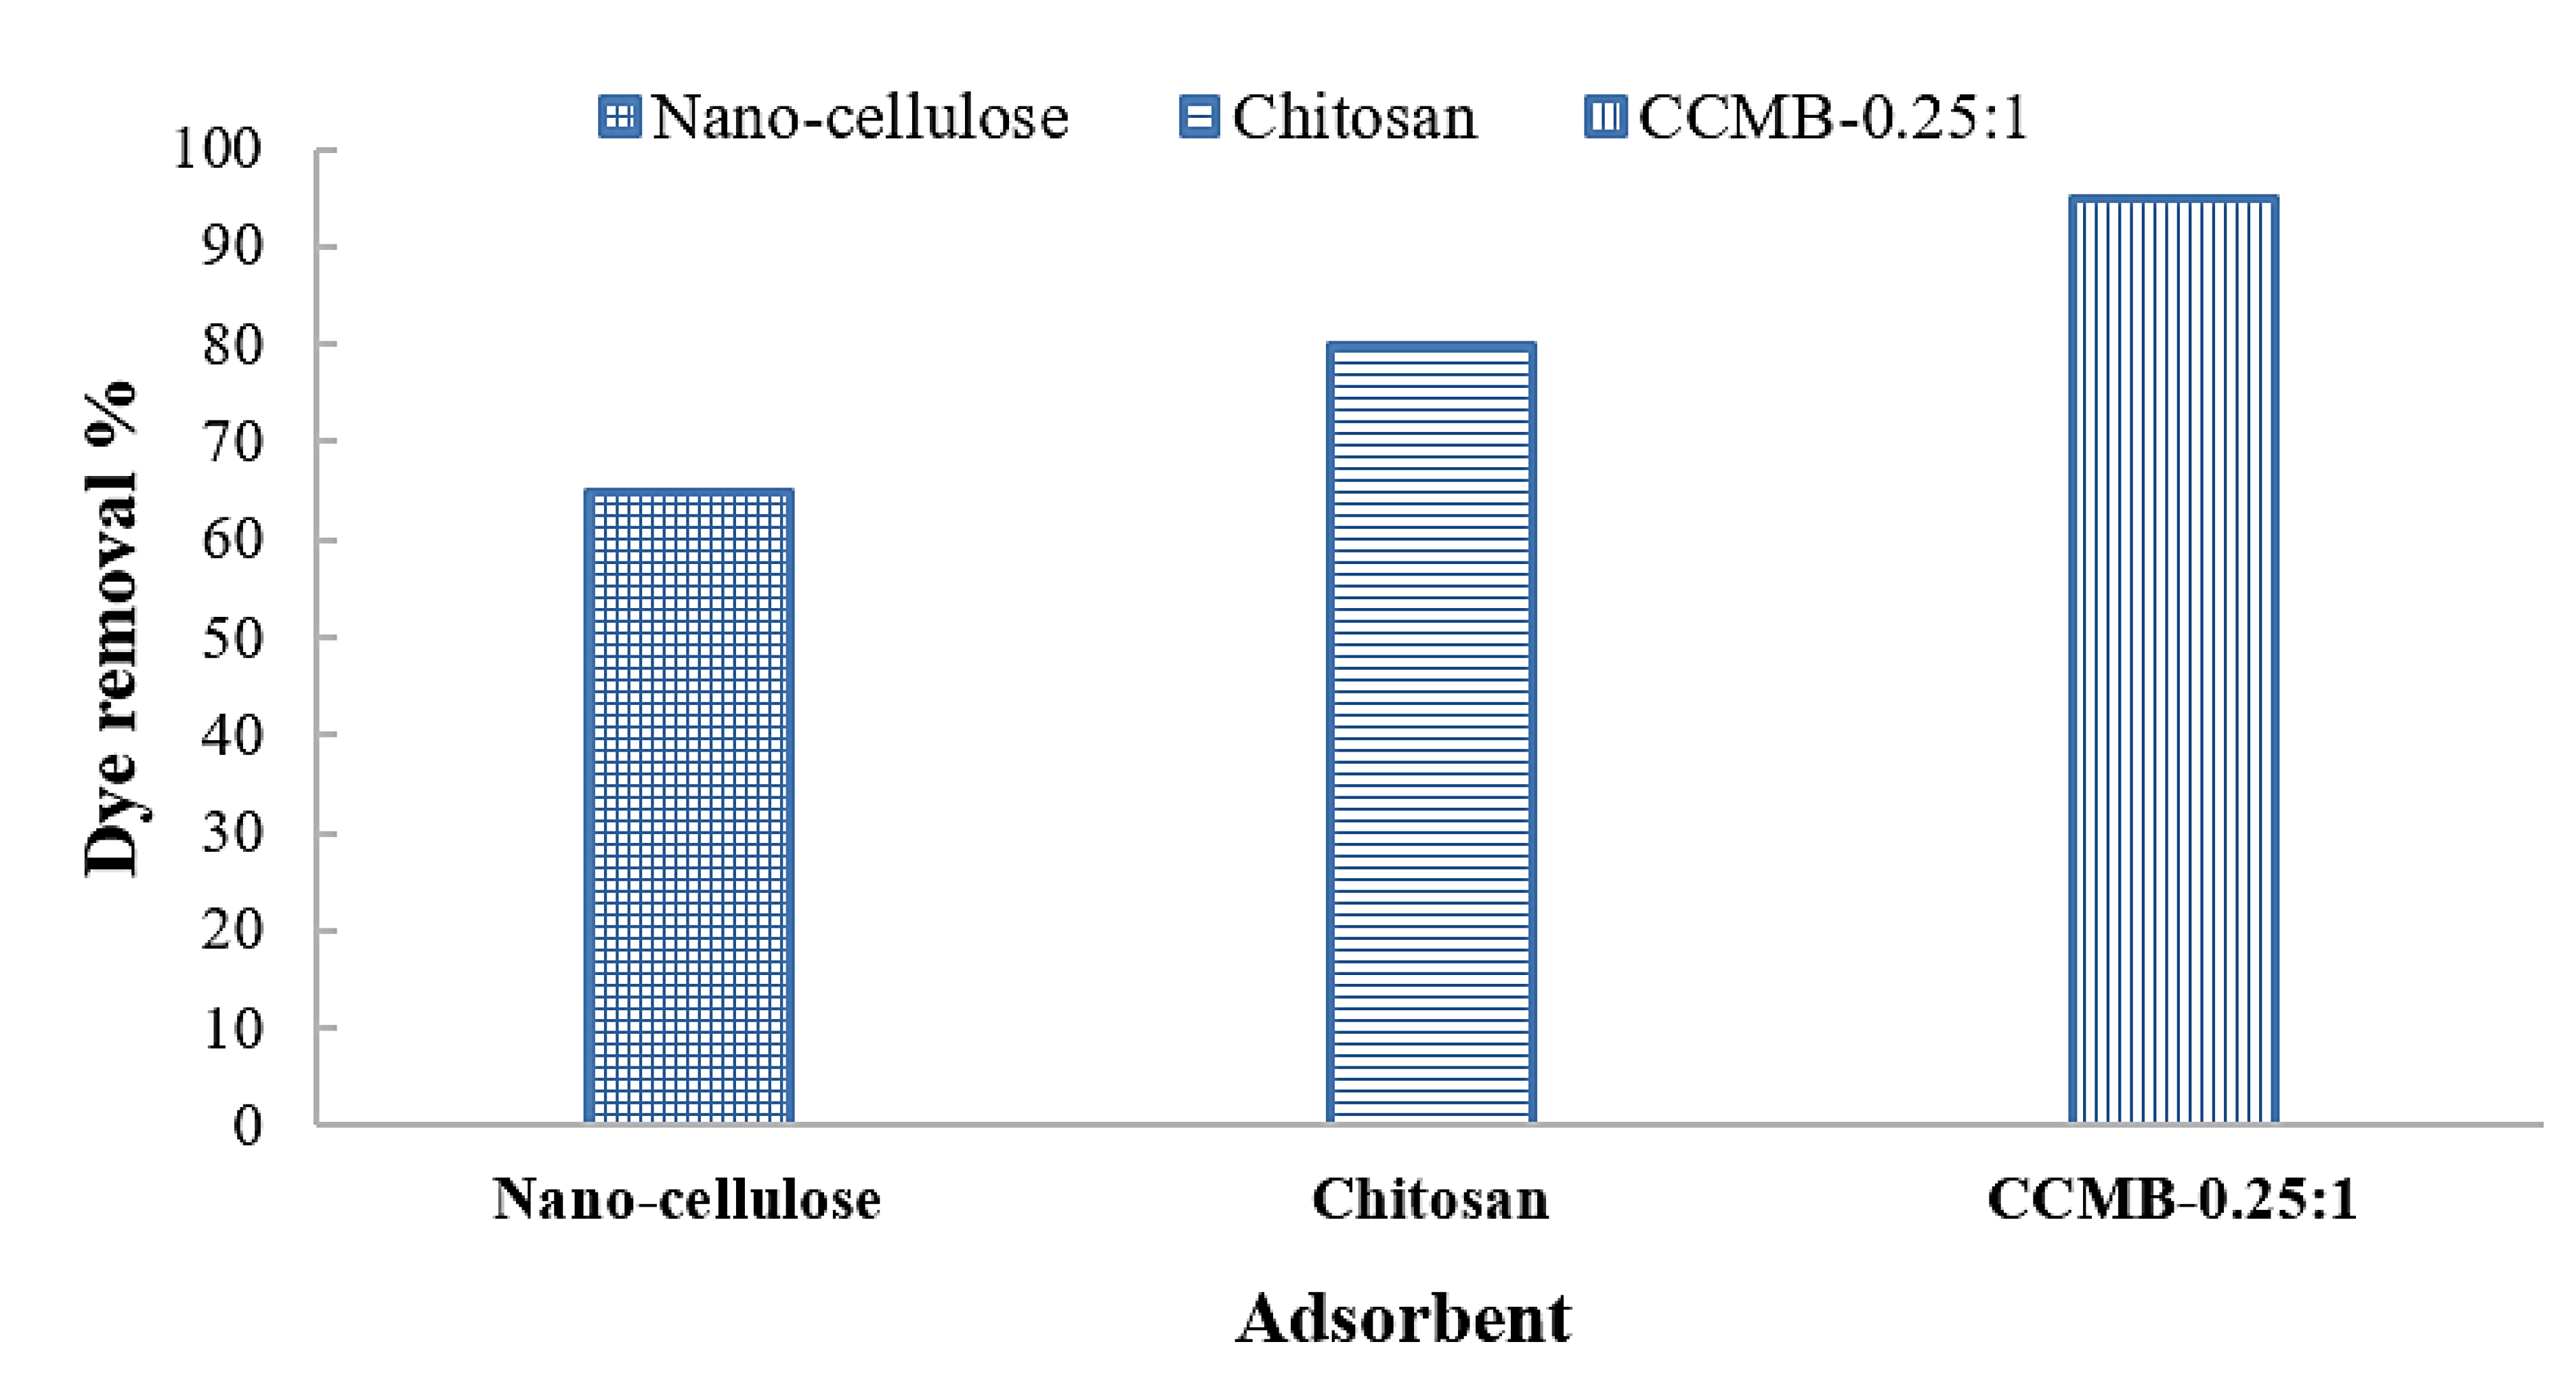
3.3. Adsorption Tests

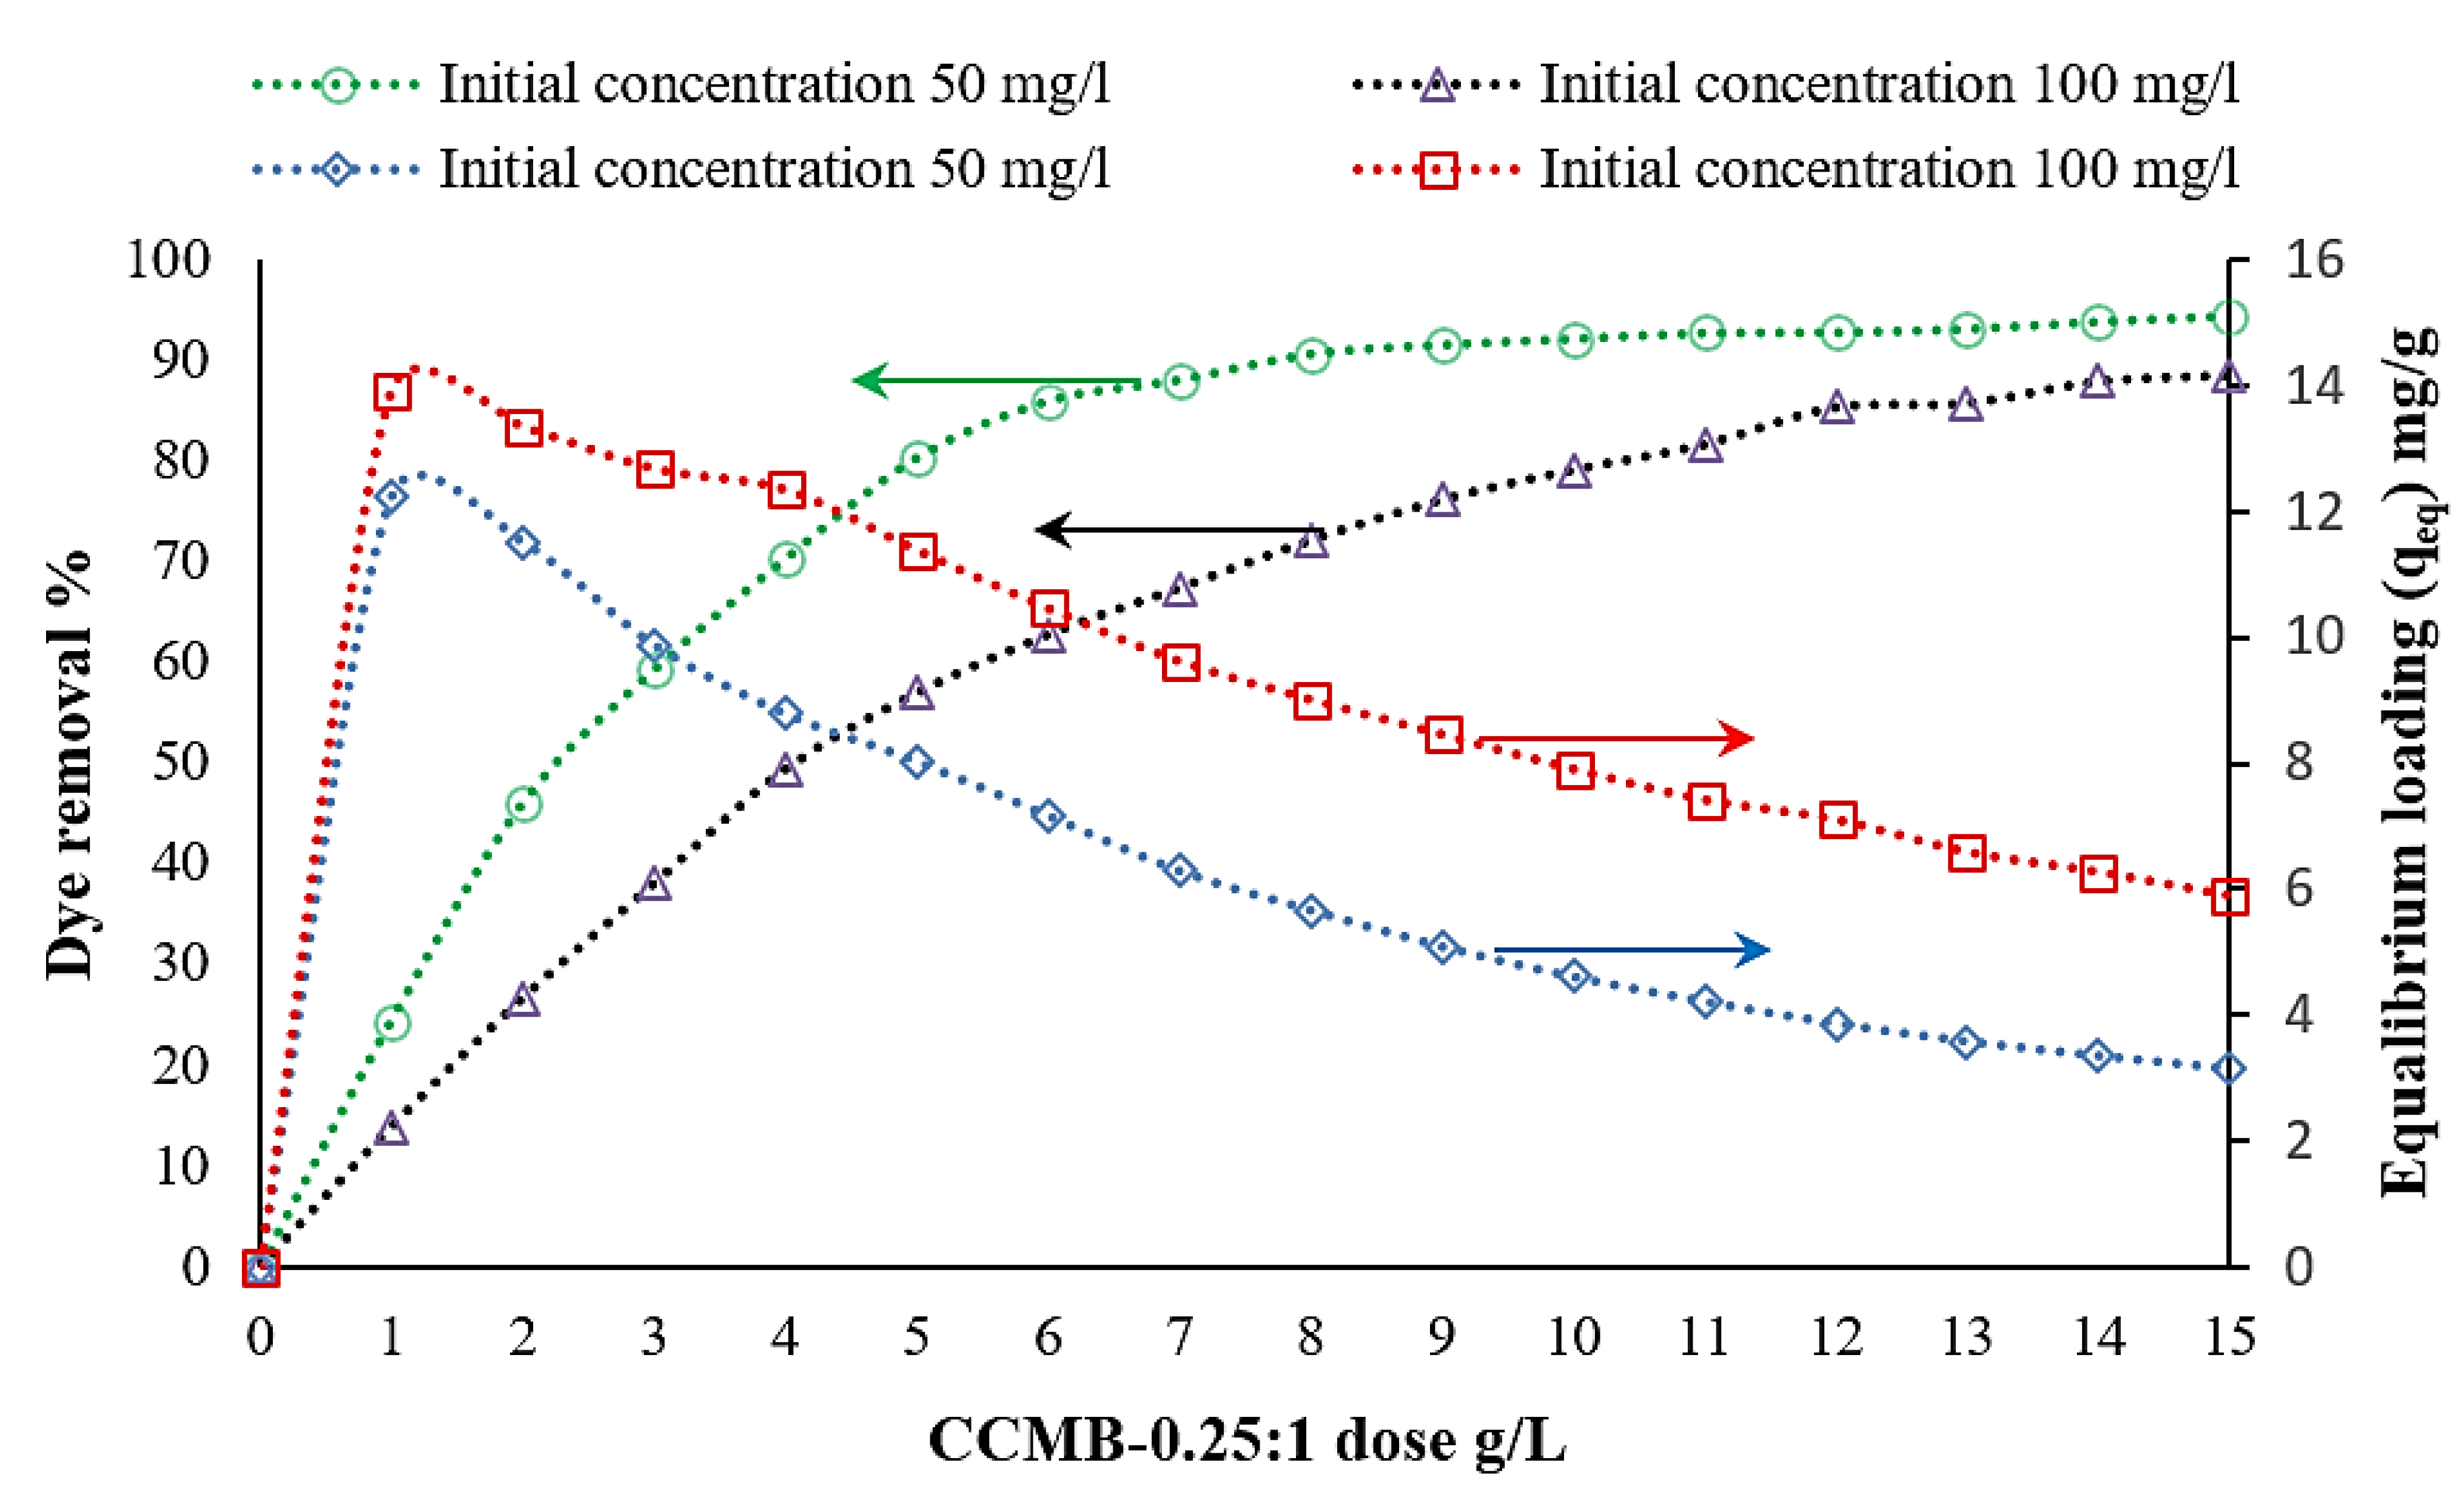
3.3.1. Effect of Adsorbent Concentration on DB78 Dye Removal Efficiency

The concentrations of chitosan, nanocellulose, and CCMB-0.25:1 were varied to investigate their effect on direct blue 78 dye removal efficiency. It was found that, by increasing the adsorbents concentration (increasing of adsorption active sites), the equilibrium loading would decrease, and the removal efficiency would increase until reaching the maximum efficiency and then approximately reach a constant value. The experiments were conducted by varying the concentration of chitosan powder from 1 to 6 g/L, nanocellulose from 0.25 to 2 g/L, and CCMB-0.25:1 from 1 to 15 g/L on DB78 dye solutions with initial concentrations of 50 and 100 mg/L, at a fixed temperature, pH, stirring speed, and mixing time.
For chitosan, it was observed from batch adsorption tests that a removal percentage of 94% can be obtained by using a chitosan dose of 3 g/L for a solution with an initial concentration of 50 mg/L, as shown in Figure 10. The maximum equilibrium loading reached was 74.4 mg/g.
For nanocellulose, it was observed that a removal percentage of 93.2% and equilibrium loading of 46.6 mg/g can be obtained by using a nanocellulose dose of 2 g/L for solutions with an initial concentration of 100 mg/L, as shown in Figure 11. The maximum equilibrium loading reached was 239 mg/g.
For CCMB-0.25:1, it was observed that a removal percentage of 92.1% and equilibrium loading of 4.6 mg/g can be obtained by using a CCMB-0.25:1 dose of 10 g/L for solutions with an initial concentration of 50 mg/L, as shown in Figure 12. The maximum equilibrium loading reached was 13.9 mg/g. Table 2 presents the optimal adsorbent concentration for direct blue 78 dye removal.

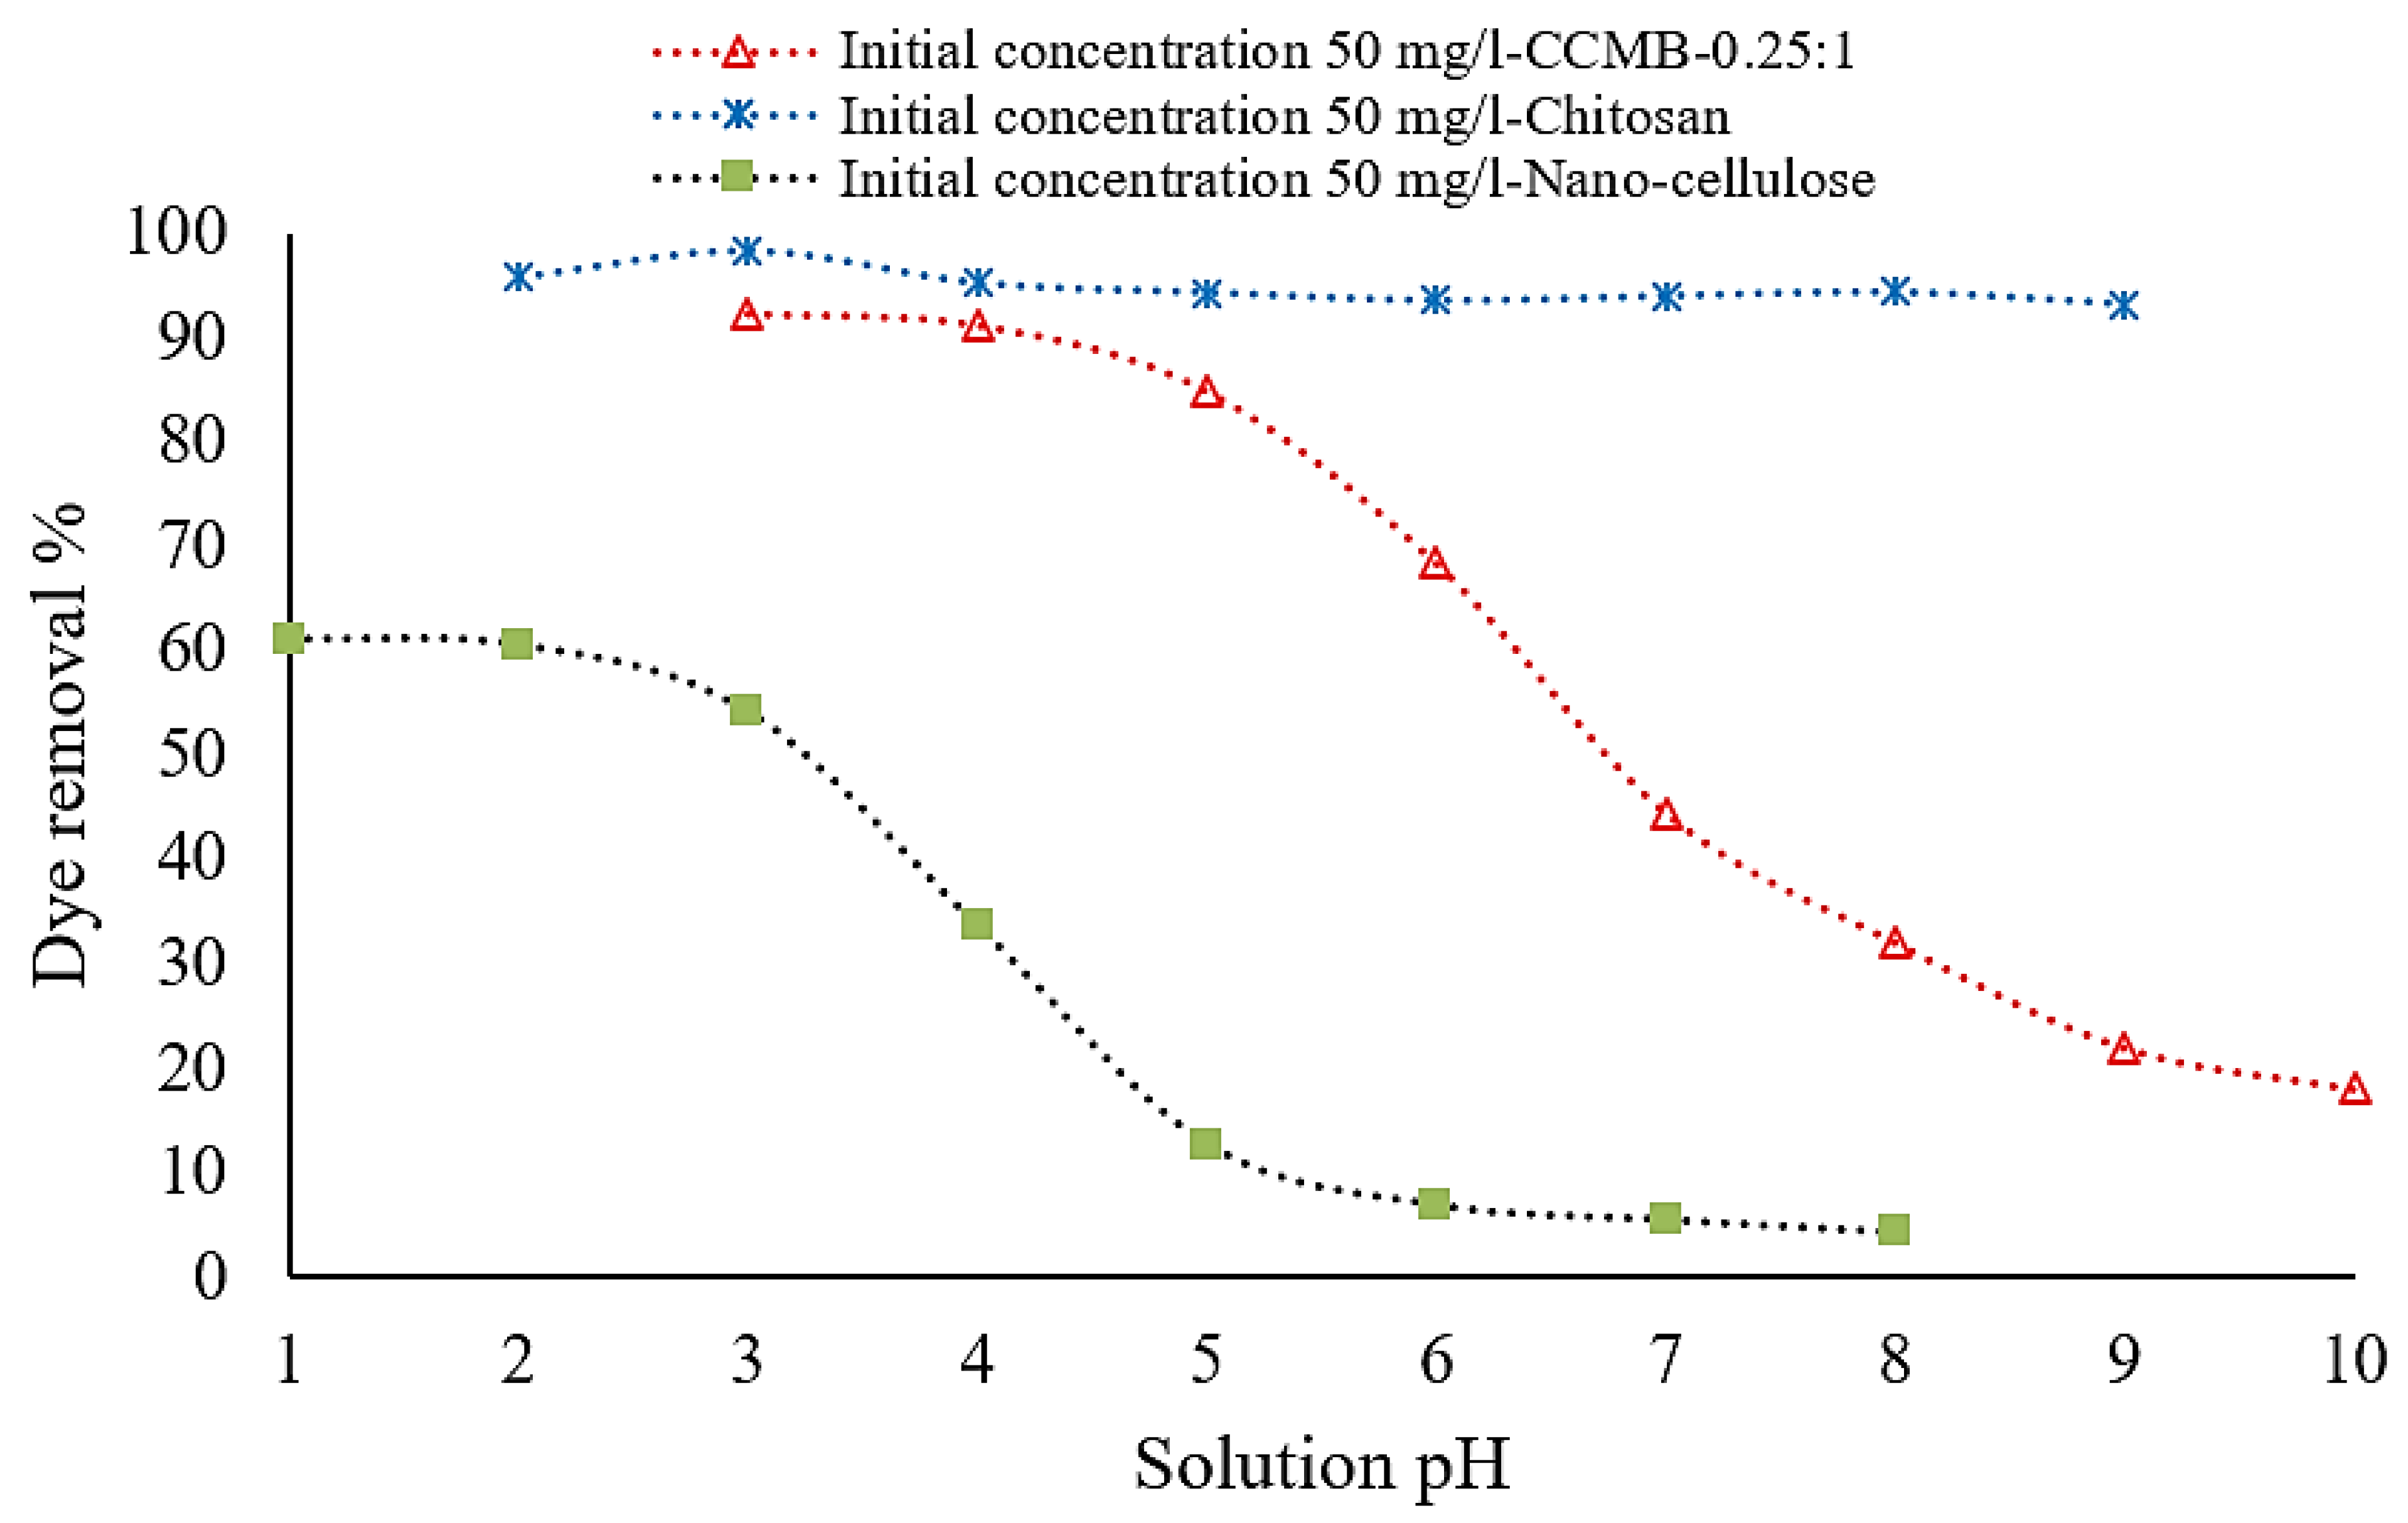
3.3.2. Effect of Solution pH on DB78 Dye Removal Efficiency

The effect of the initial pH of dye solution was experimentally investigated under a pH range from 1 to 10, and the results can be observed from Figure 13. For chitosan, the solution pH has a little effect on chitosan adsorption behavior. Chitosan reaches its maximum loading (maximum removal efficiency of 98.3%) under acidic conditions (pH = 3), in comparison with a 93% removal efficiency under alkaline conditions (pH = 9).
This can be attributed to the presence of acidic conditions, where hydrogen ions (H+) could protonate the amine groups (–NH2) of chitosan.
Chitosan–NH2 + H+ → chitosan–NH3+
The direct blue 78 dye was dissolved in aqueous solution, and the sulfonate groups were separated and converted into anionic dye ions.
DSO3Na → DSO3 + Na+
The adsorption process then ensued due to the electrostatic interaction between these two ions [63].
Chitosan–NH3+ + DSO3 → chitosan–NH3+-O3SD
The pH value is one of the most important process variables when considering dye adsorption. The adsorption of a positive charged adsorbate is favored when the pH of the solution is greater than the point of zero charge (pHpzc) of the adsorbent. The point of zero charge indicates that the net charge on the whole particle surface (i.e., the surface of the absorbent) is zero. Whereas the adsorption of negatives charges, in turn, is favored at pH levels less than pHpzc. Therefore, the adsorption of the anionic dyes is expected to be favored in solutions with pH values less than the pHpzc of the adsorbent [64].
From this point, it can be concluded that the swelling of chitosan powder into chitosan beads in the presence of acidic conditions will protonate the amine groups (NH2) into NH3+. This process will improve the electrostatic interaction between chitosan particles and dye ions and enhance the chitosan ability for anionic dyes’ removal. The adsorption process was significantly improved in the acidic solution. Therefore, it is supposed that the adsorbent surface is positively charged, and this is favorable to the adsorption of anionic dyes. The enhanced electrostatic interactions were formed between the positively charged bioadsorbent’s surface and the negatively charged SO3 group of dyes in acidic solutions.
As seen in Figure 13, the initial pH of the solution has a higher effect on the direct blue 78 dye solutions’ removal process. Nanocellulose reaches its maximum adsorption capacity for DB78 dye under acidic conditions, i.e., a pH range from 1 to 2, and then the adsorption capacity is decreased sharply during the increasing of the pH from 3 to 6, and then it decreases slowly down to a pH equal to 8. Figure 14 shows that nanocellulose particles and CCMB-0.25:1 have a negative net surface charge (Zeta potential = −63 mv) and positive net surface charge (Zeta potential = +66 mv), respectively. The negative Zeta potential value of −63 mV is attributed to the presence of highly electronegative sulfate groups on the surface of the cellulose nanoparticles. The maximum adsorption capacity for DB78 dye was found in acidic conditions within a pH range from 3 to 4, and then it decreased sharply as the pH increased from 5 to 8.

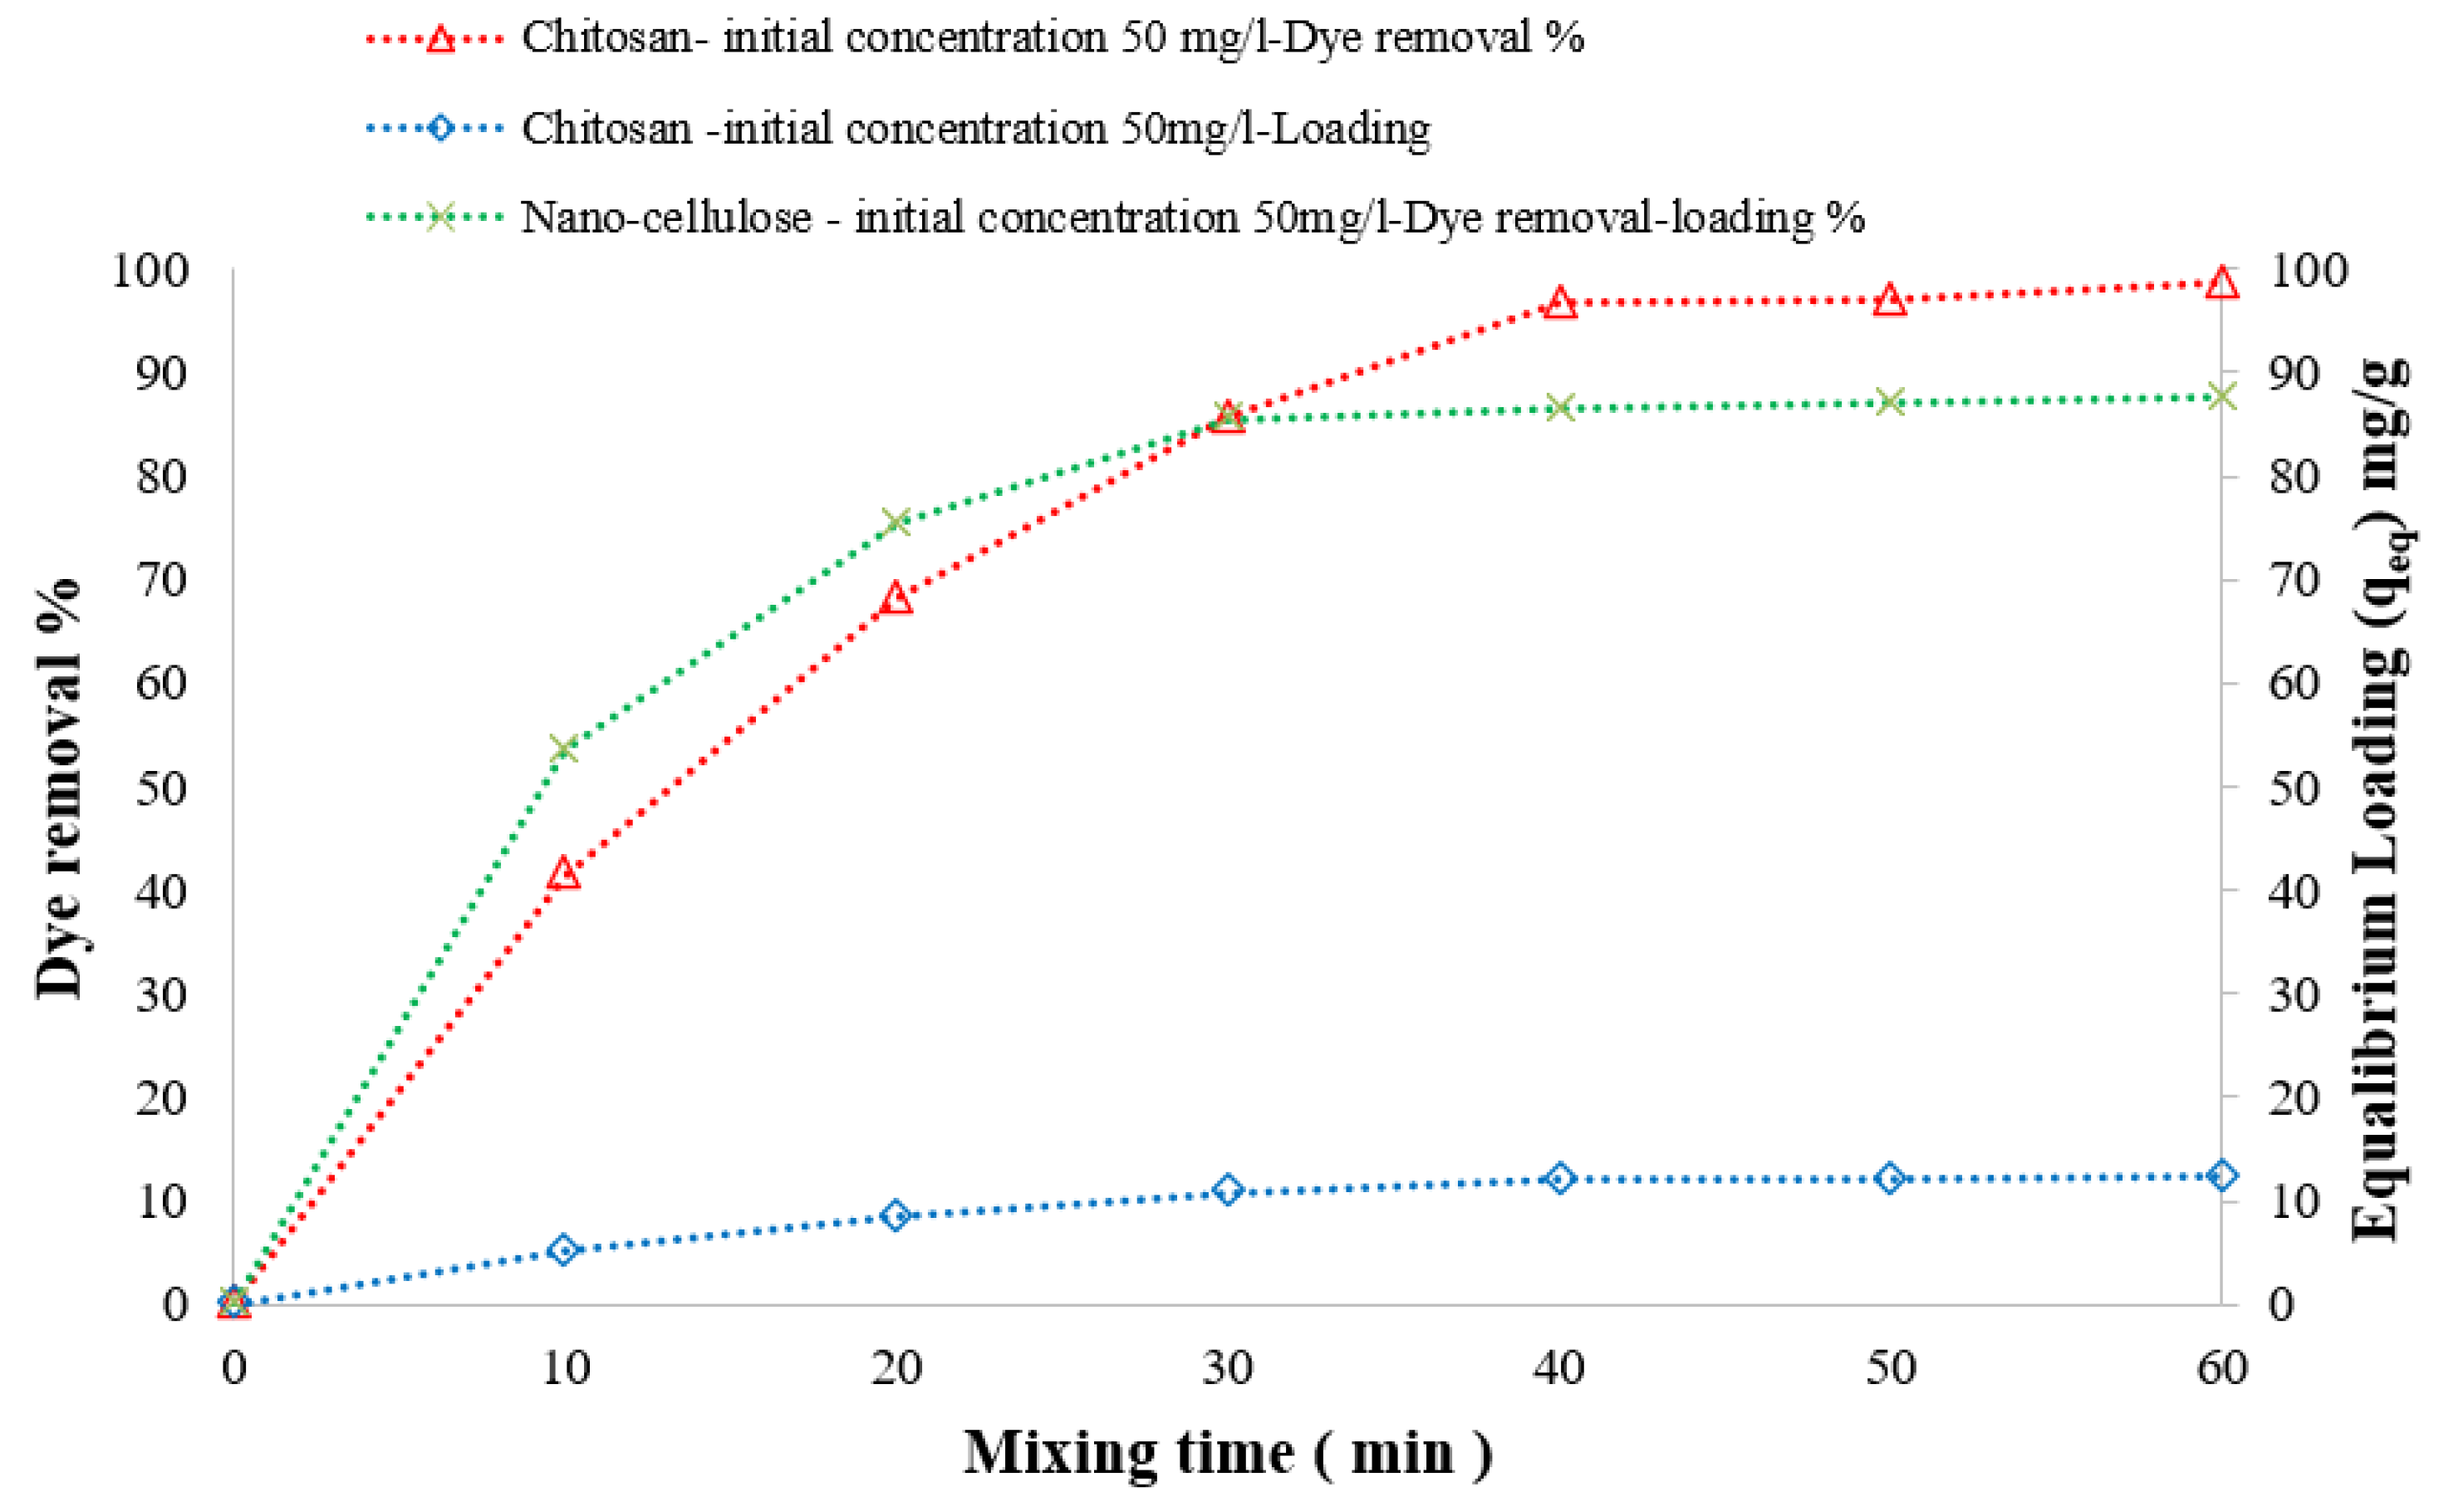
3.3.3. Effect of Mixing Time on DB78 Dye Removal Efficiency

The effect of the mixing time on both the percentage of DB78 dye removal and adsorbent loading was investigated. It is experimentally observed that the percentage of dye removal increased with the increasing mixing time, even reaching the optimal removal efficiency (equilibrium concentration, Ce); at this time, the adsorbent is reaching its maximum loading capacity (equilibrium loading, qe).
For 45 min of contact time and a 4 g/L adsorbent dose of chitosan, the equilibrium concentration decreased to 1.6 mg/L, the dye removal efficiency was 96.7%, and the optimum loading capacity was 12.1 mg/g for an initial dye concentration of 50 mg/L solution. For 30 min of contact time and 500 mg/L as the adsorbent dose of nanocellulose, the equilibrium concentration decreased to 7.2 mg/L, the dye removal efficiency was 85.7%, and the optimum loading capacity was 85.5 mg/g for an initial dye concentration of 50 mg/L solution, as shown in Figure 15. For 120 min of contact time and 10 g/L as the adsorbent dose of CCMB-0.25:1, the equilibrium concentration decreased to 3.9 mg/L, the dye removal efficiency was 92.1%, and the optimum loading capacity was 4.6 mg/g for an initial dye concentration of 50 mg/L solution, as shown in Figure 16.

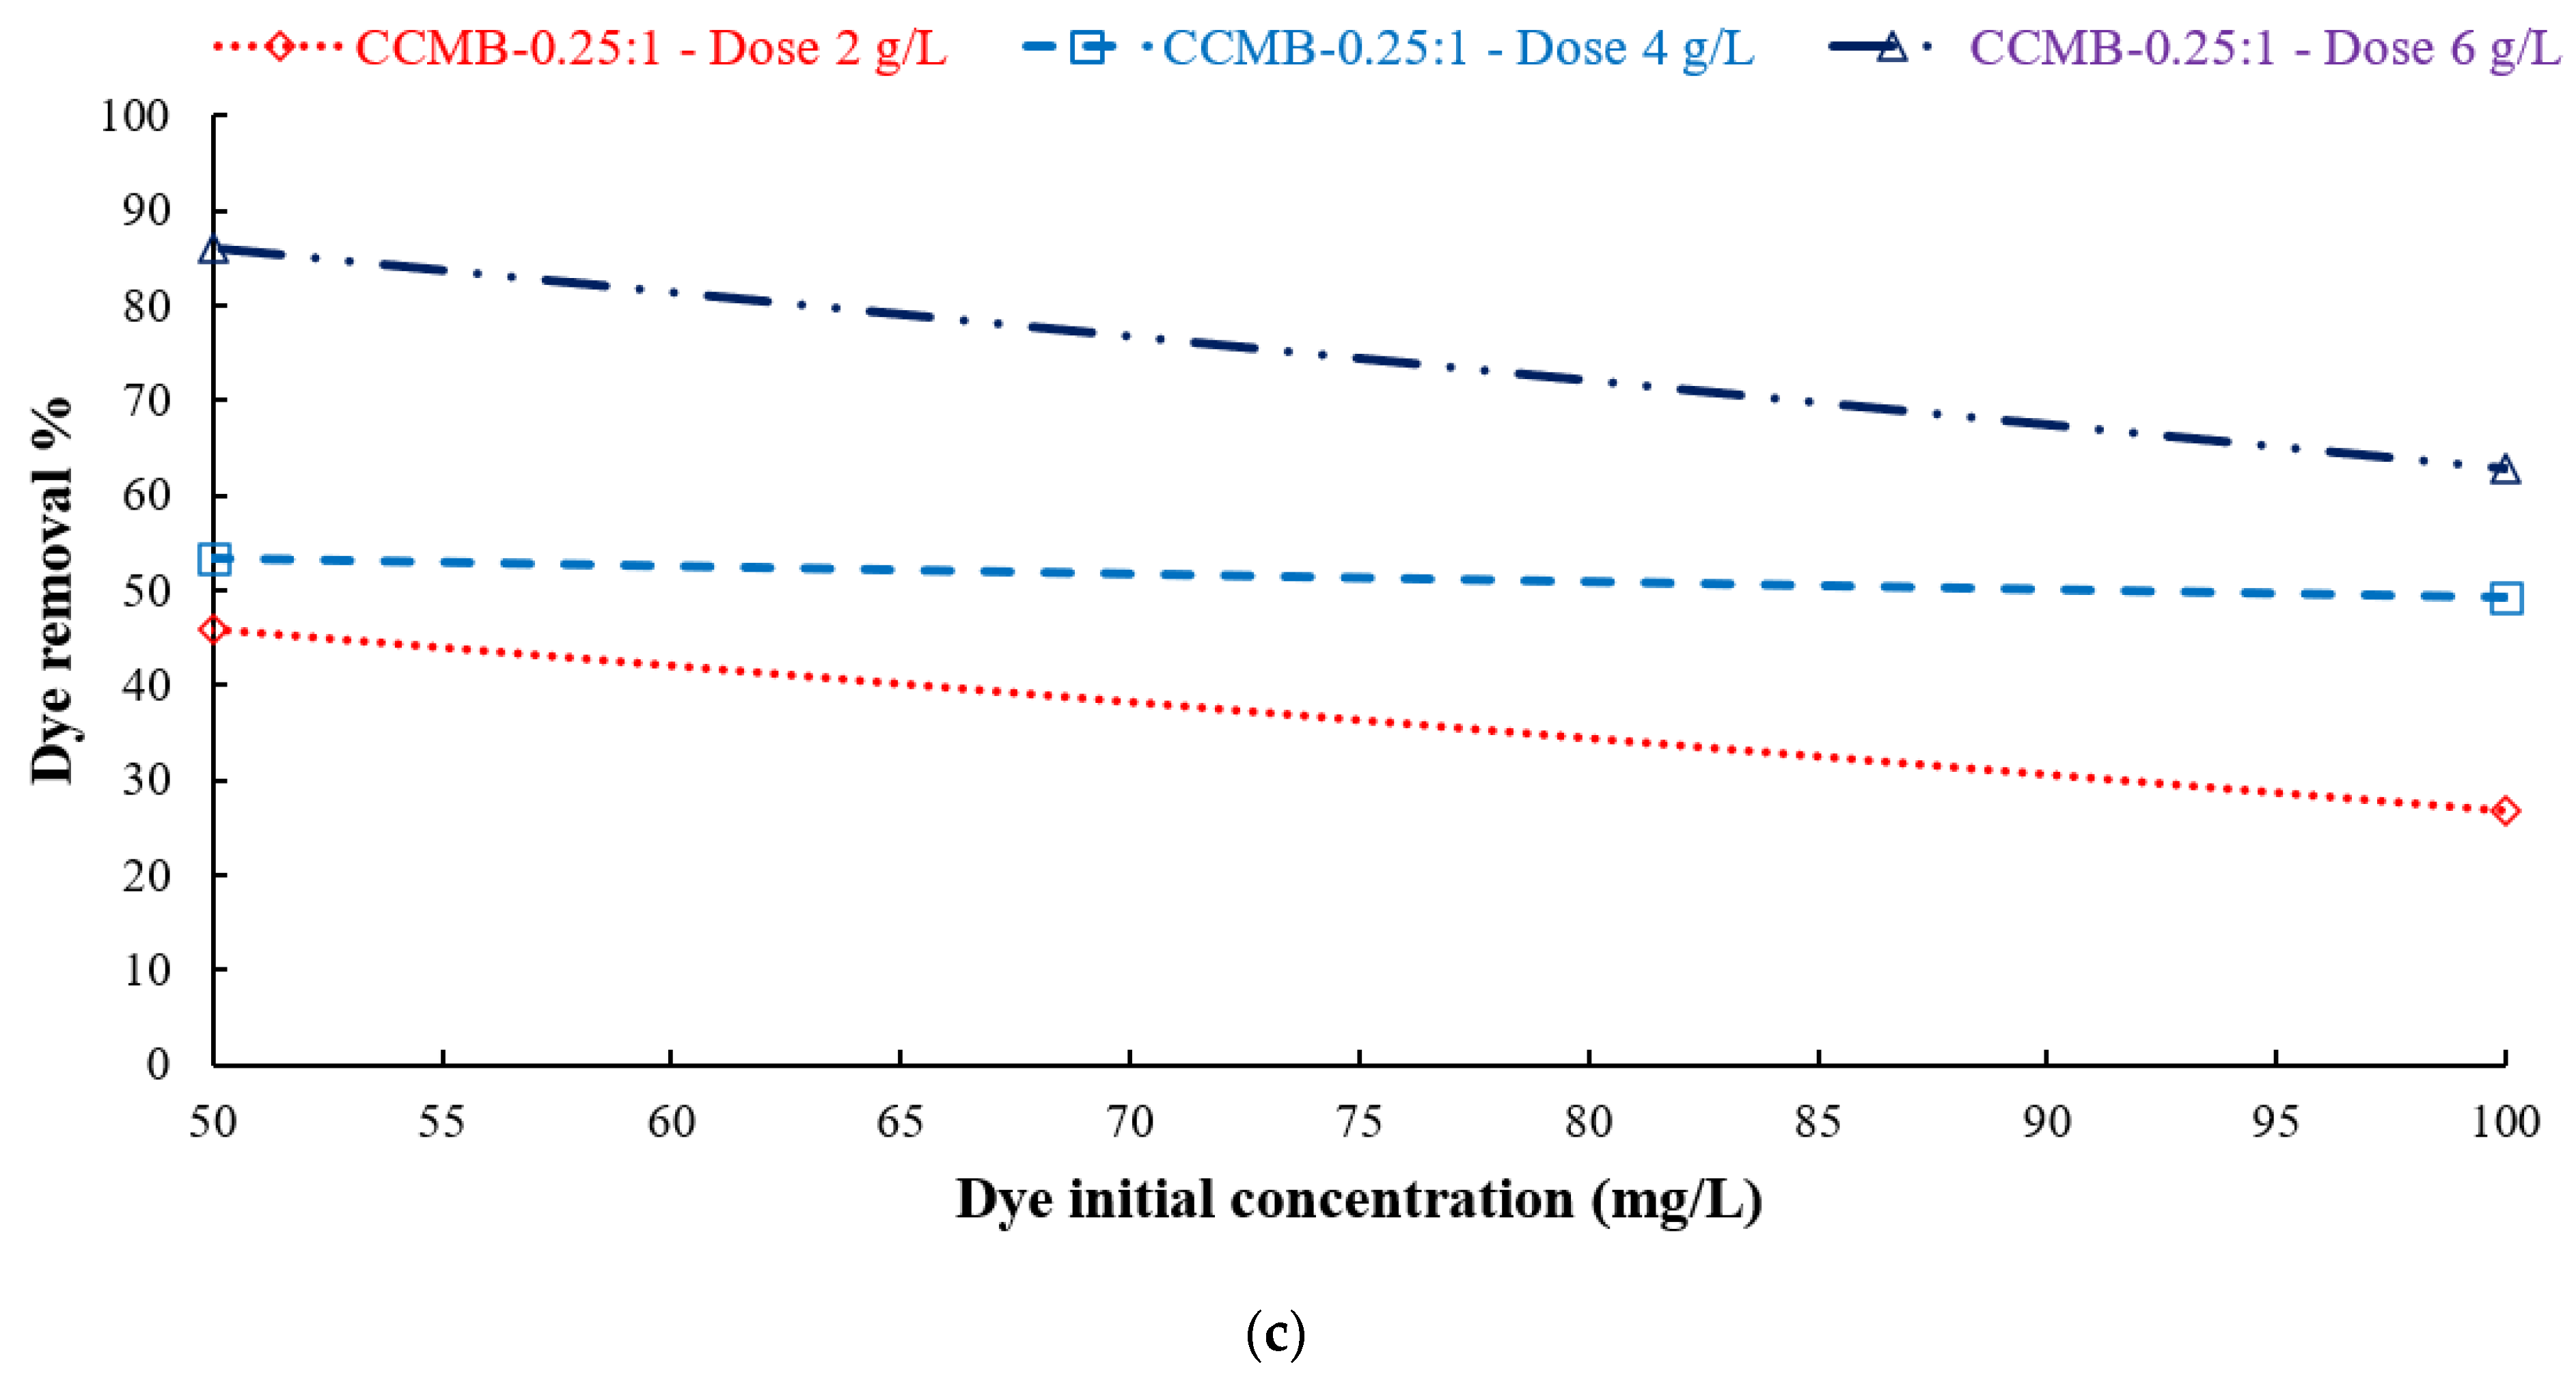
3.3.4. Effect of Dye Initial Concentration Removal Efficiency

The direct blue 78 (DB78) dye solutions had initial concentrations of 50 and 100 mg/L. Figure 17a shows that the removal efficiency at 80.3% and 77.2% from using chitosan dose 1g/L for the initial concentrations 50 and 100 mg/L, respectively. The removal efficiency was improved to 90.1% and 84.6% by using chitosan dose 2 g/L. At a higher concentration of neat chitosan (3 g/L), the removal efficiency of the direct blue 78 (DB78) dye reached 94.2% and 90.8% at the initial dye concentration 50 and 100 mg/L, respectively.
Figure 17b shows that the removal efficiency was obtained at up to 85.4% and 69.7% for the dyes’ initial concentration of 50 and 100 mg/L, respectively, using 0.5 g/L of nanocellulose. A higher removal efficiency was observed when using 0.75 g/L nanocellulose. The removal efficiency of DB78 was found to be 91.7% and 79.4% when using 1 g/L of nanocellulose for initial concentrations of 50 and 100 mg/L, respectively. For CCMB-0.25:1 at a dose of 6 g/L, the removal efficiency was 86% and 63%, respectively, for the 50 and 100 mg/L initial concentrations of the dyes, as shown in Figure 17c. These results show that the adsorption process is highly dependent on the initial concentration of dyes.

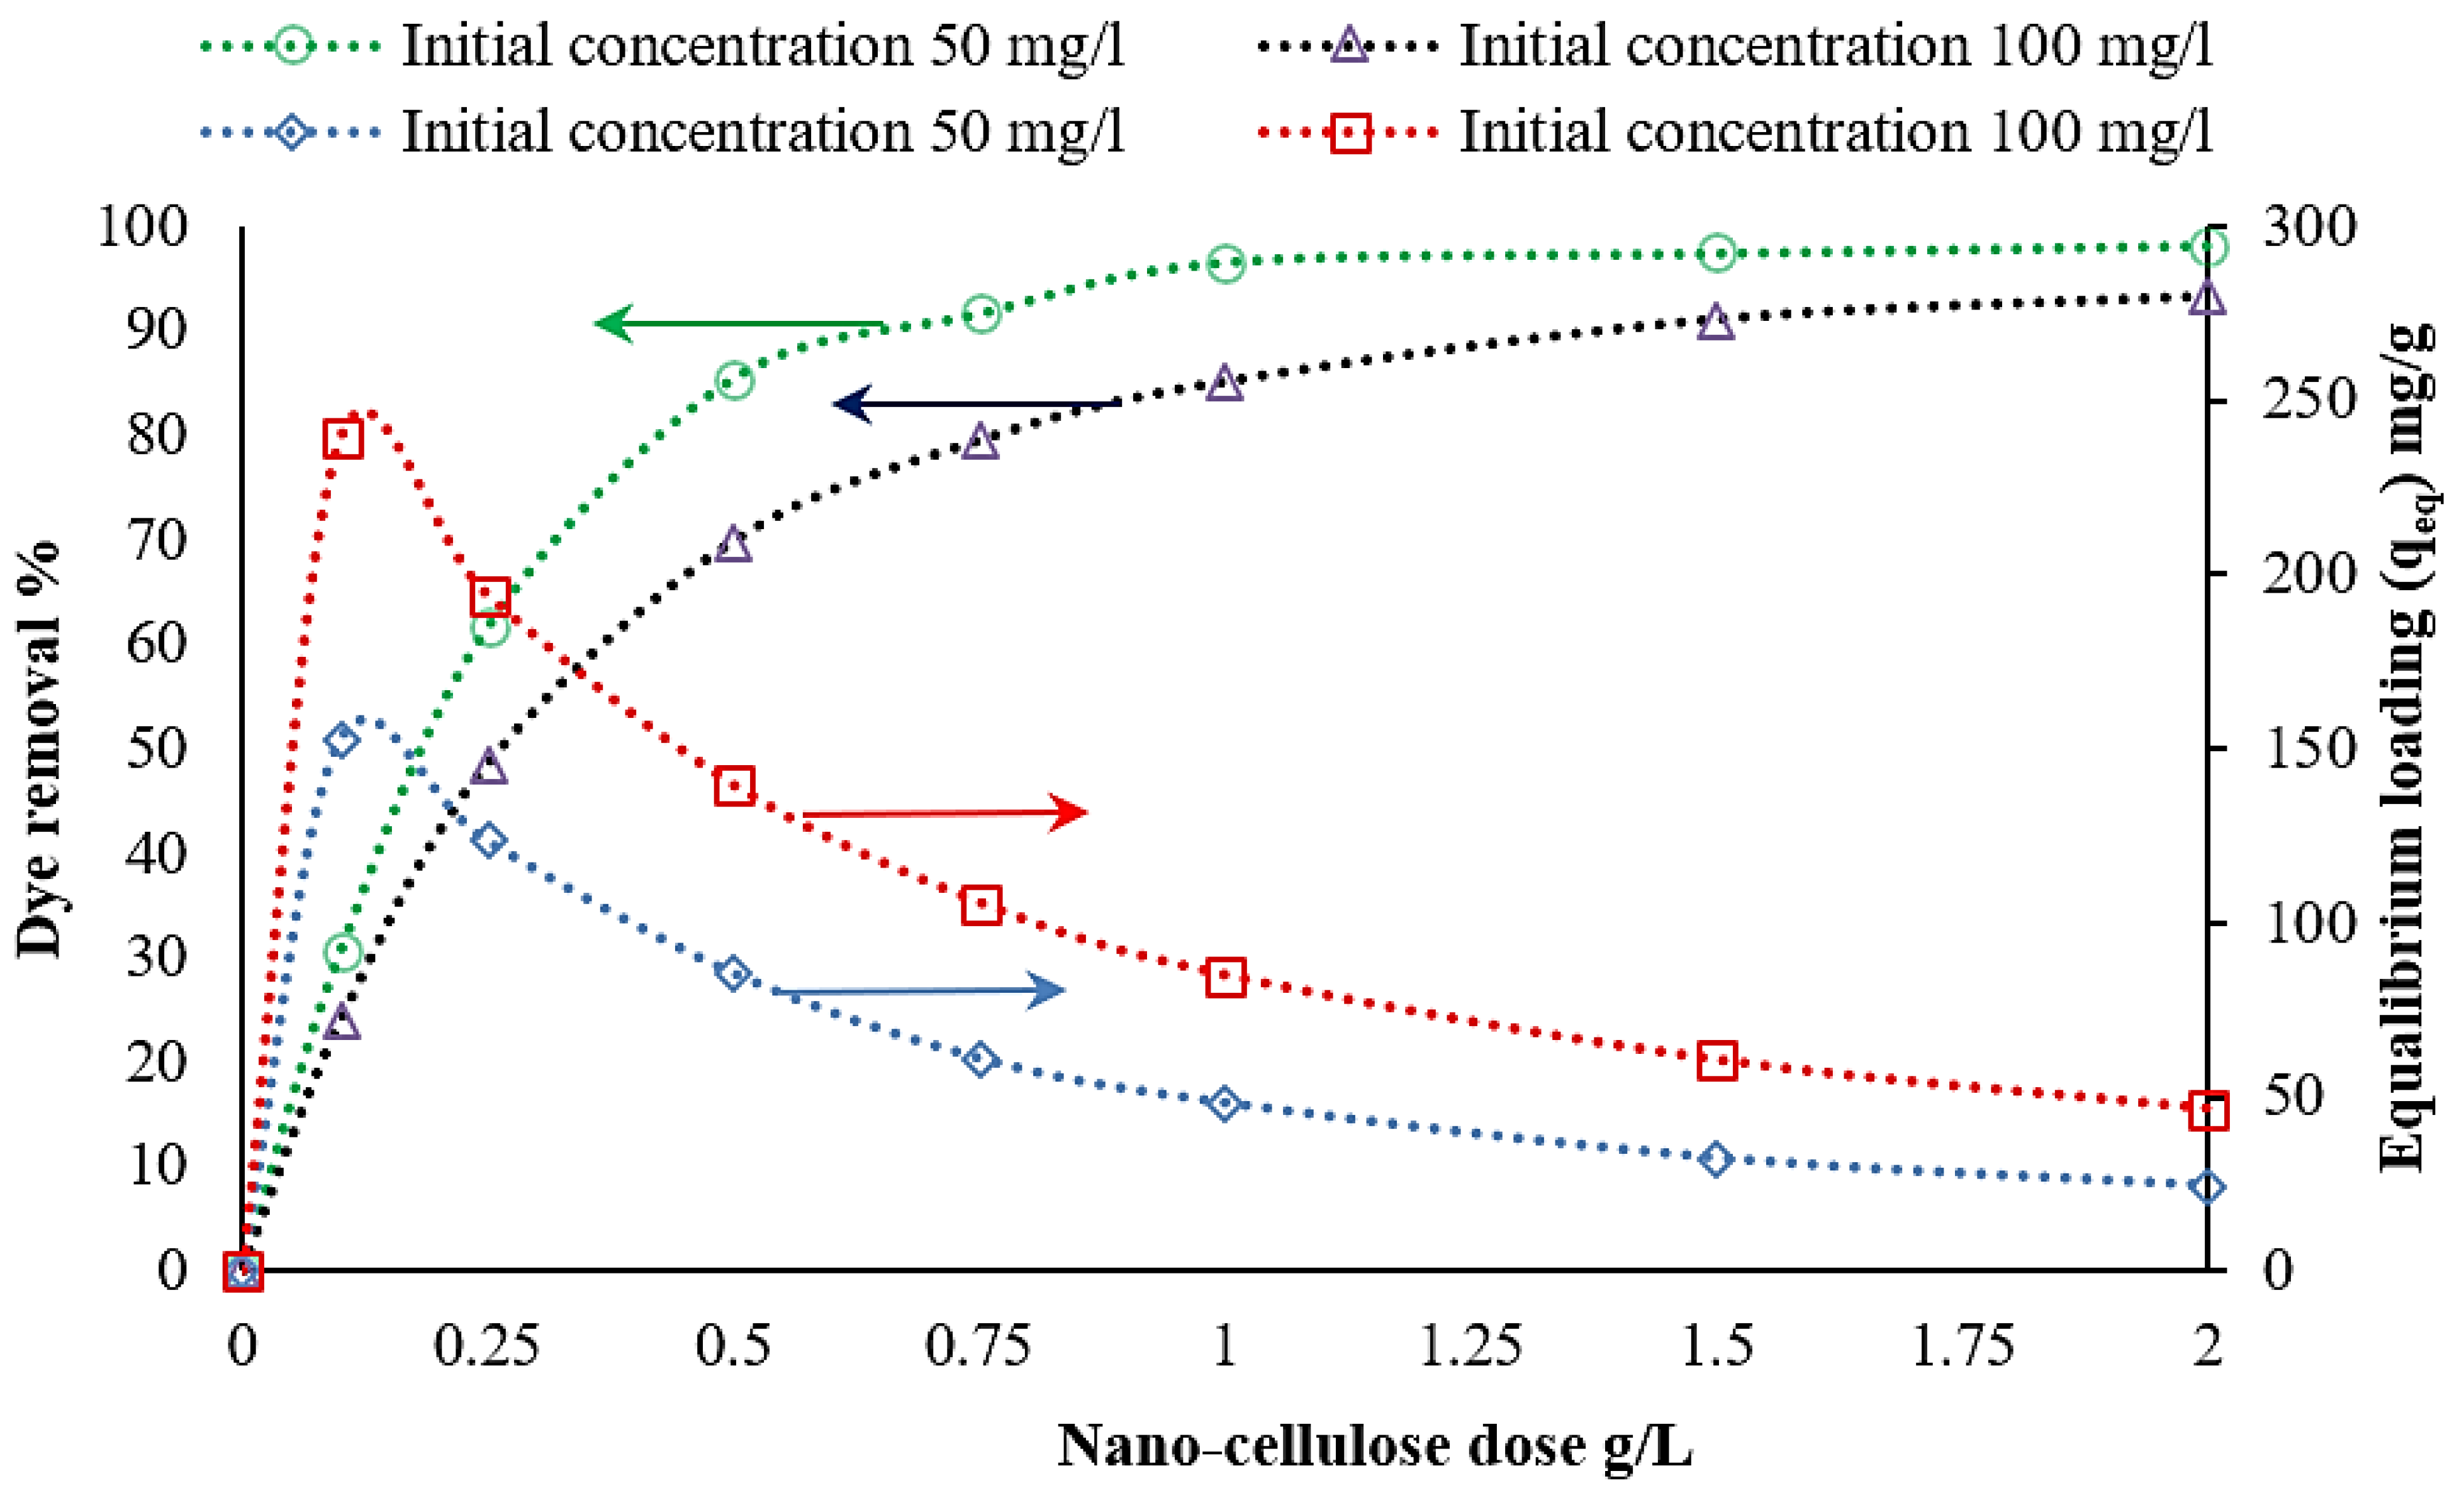
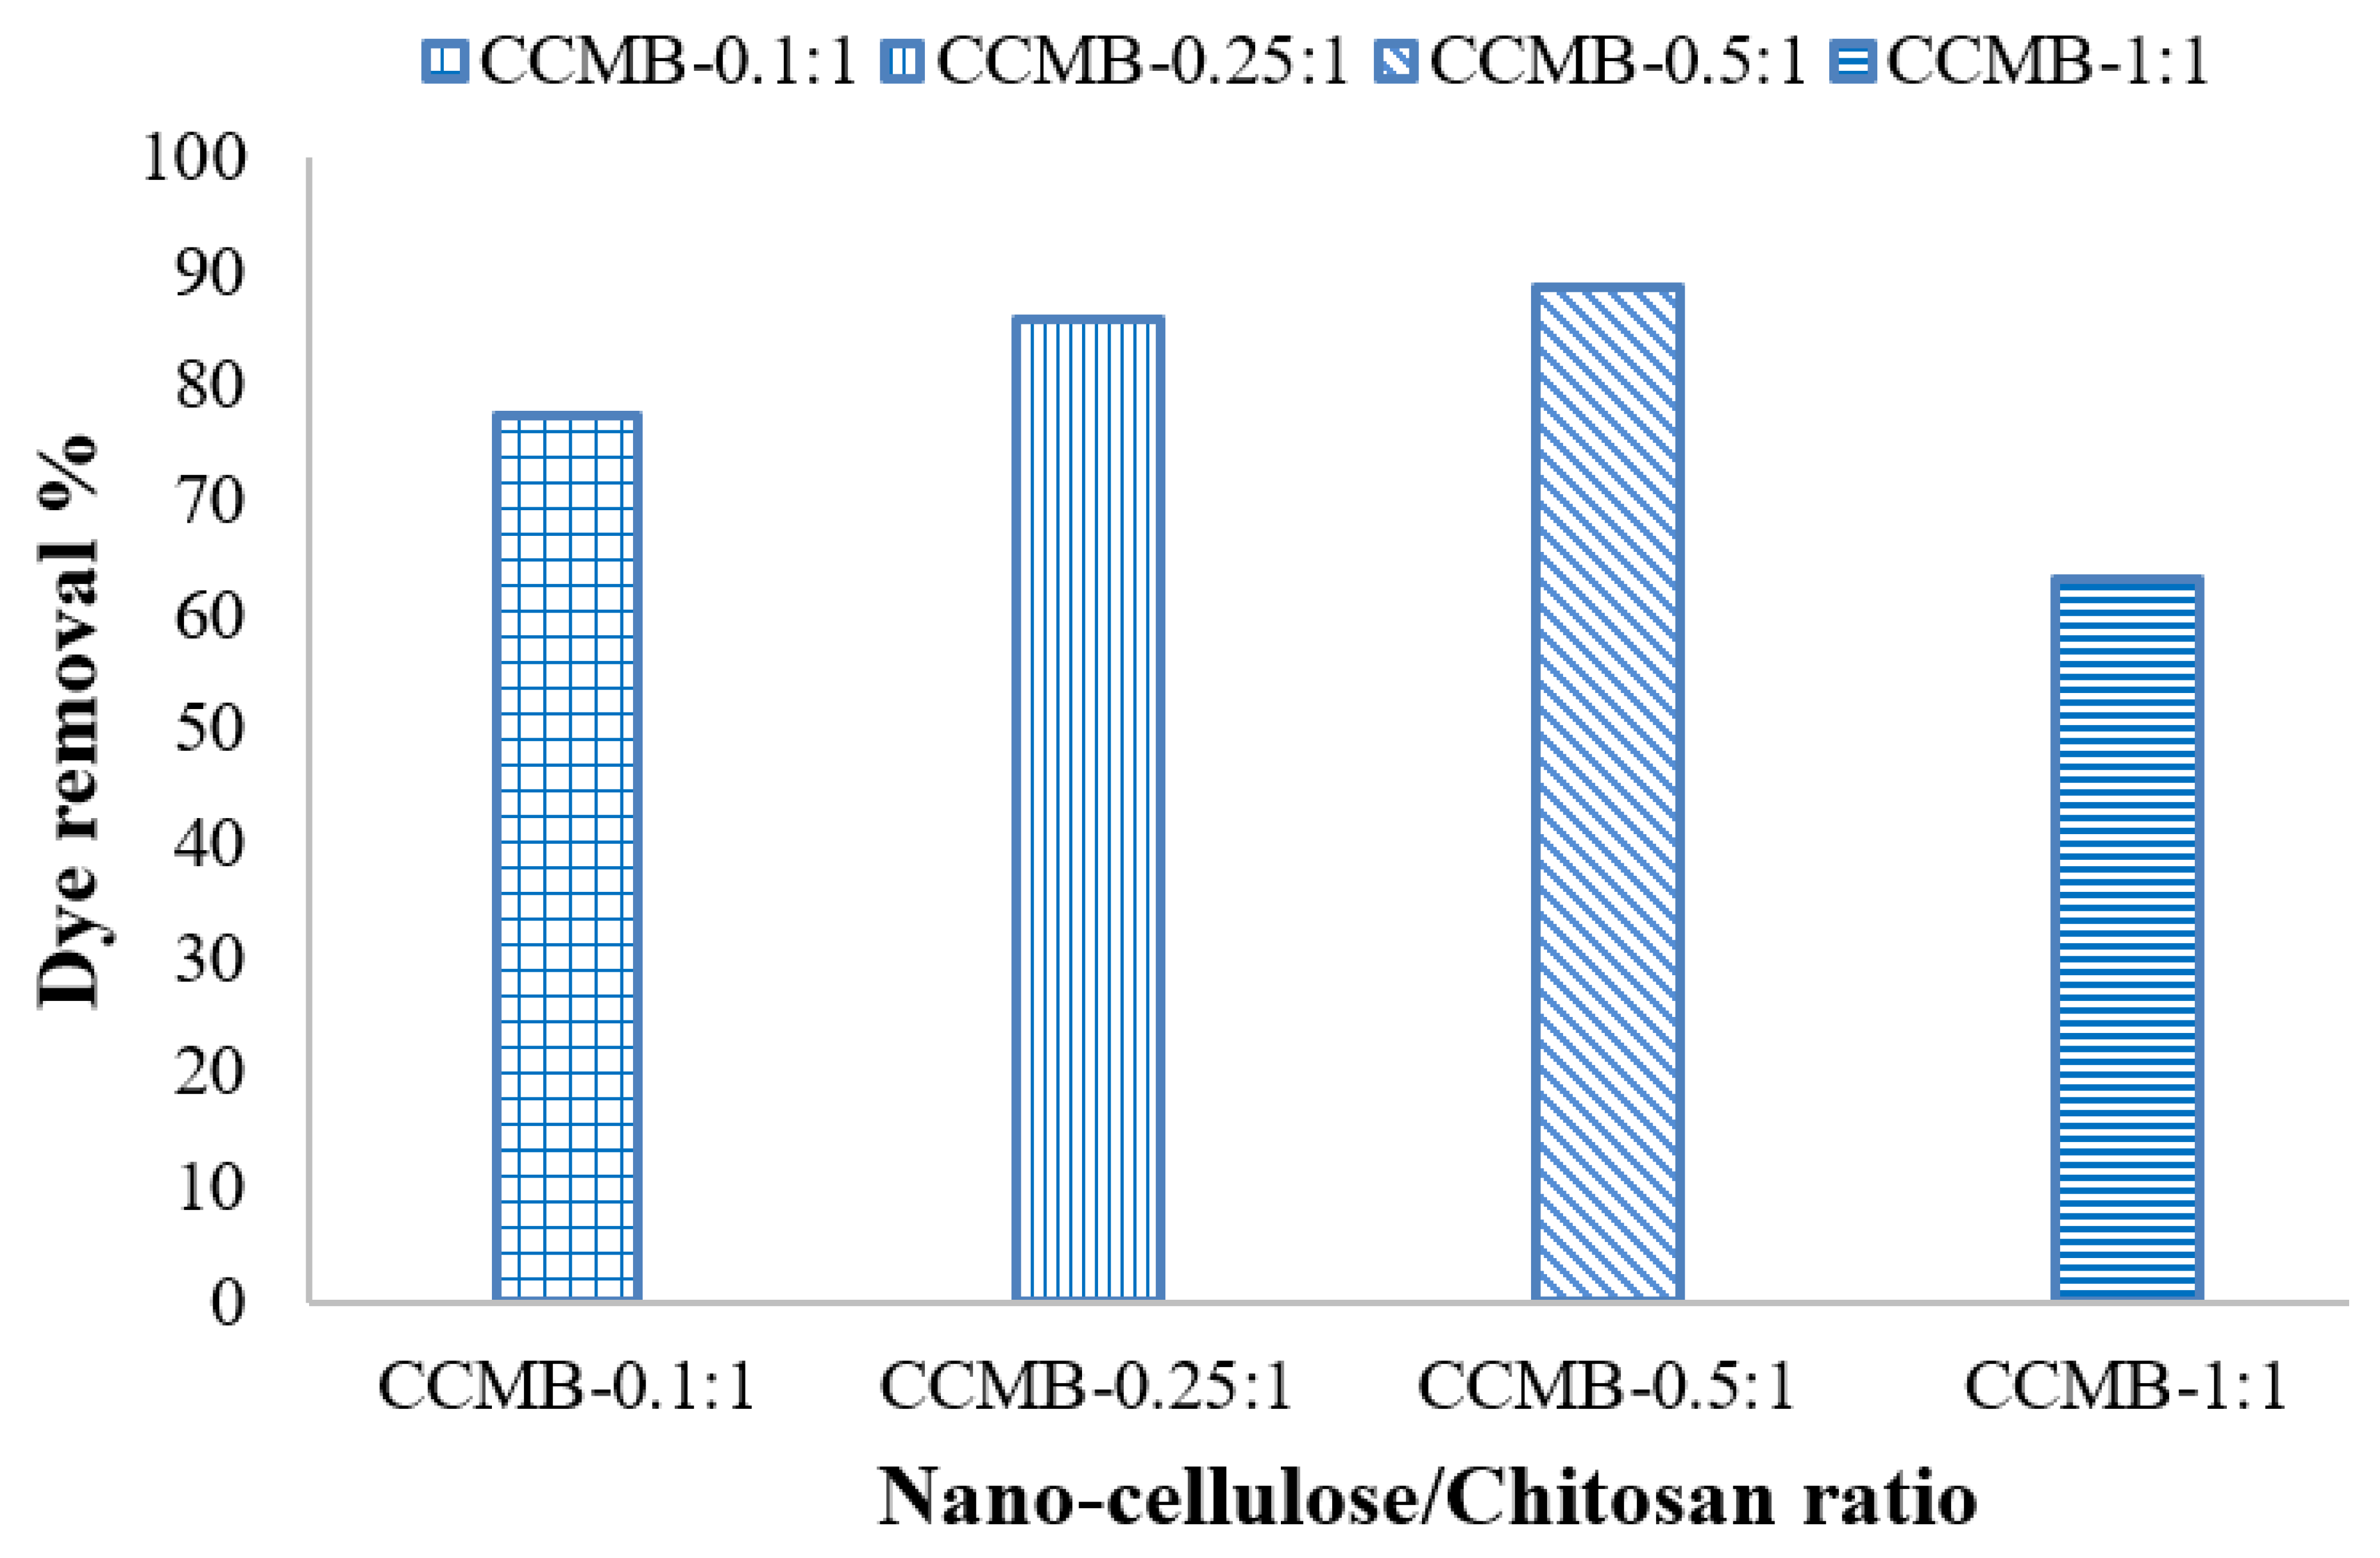
3.3.5. Effect of Nanocellulose Concentration on Removal Efficiency

To study the effect of nanocellulose loading using nanocellulose/chitosan microbeads (CCMBs) on dye-removal efficiency, a different ratios were applied: CCMB-0.1:1, CCMB-0.25:1, CCMB-0.5:1, and CCMB-1:1. The experimental results showed that the dye-removal efficiency increases with the increase nanocellulose loading, up to 0.5:1. At higher nanocellulose loads, the removal efficiency decreases, as shown in Figure 18. This can be attributed to blockage of internal porosities of chitosan by the incorporated higher nanocellulose loadings.

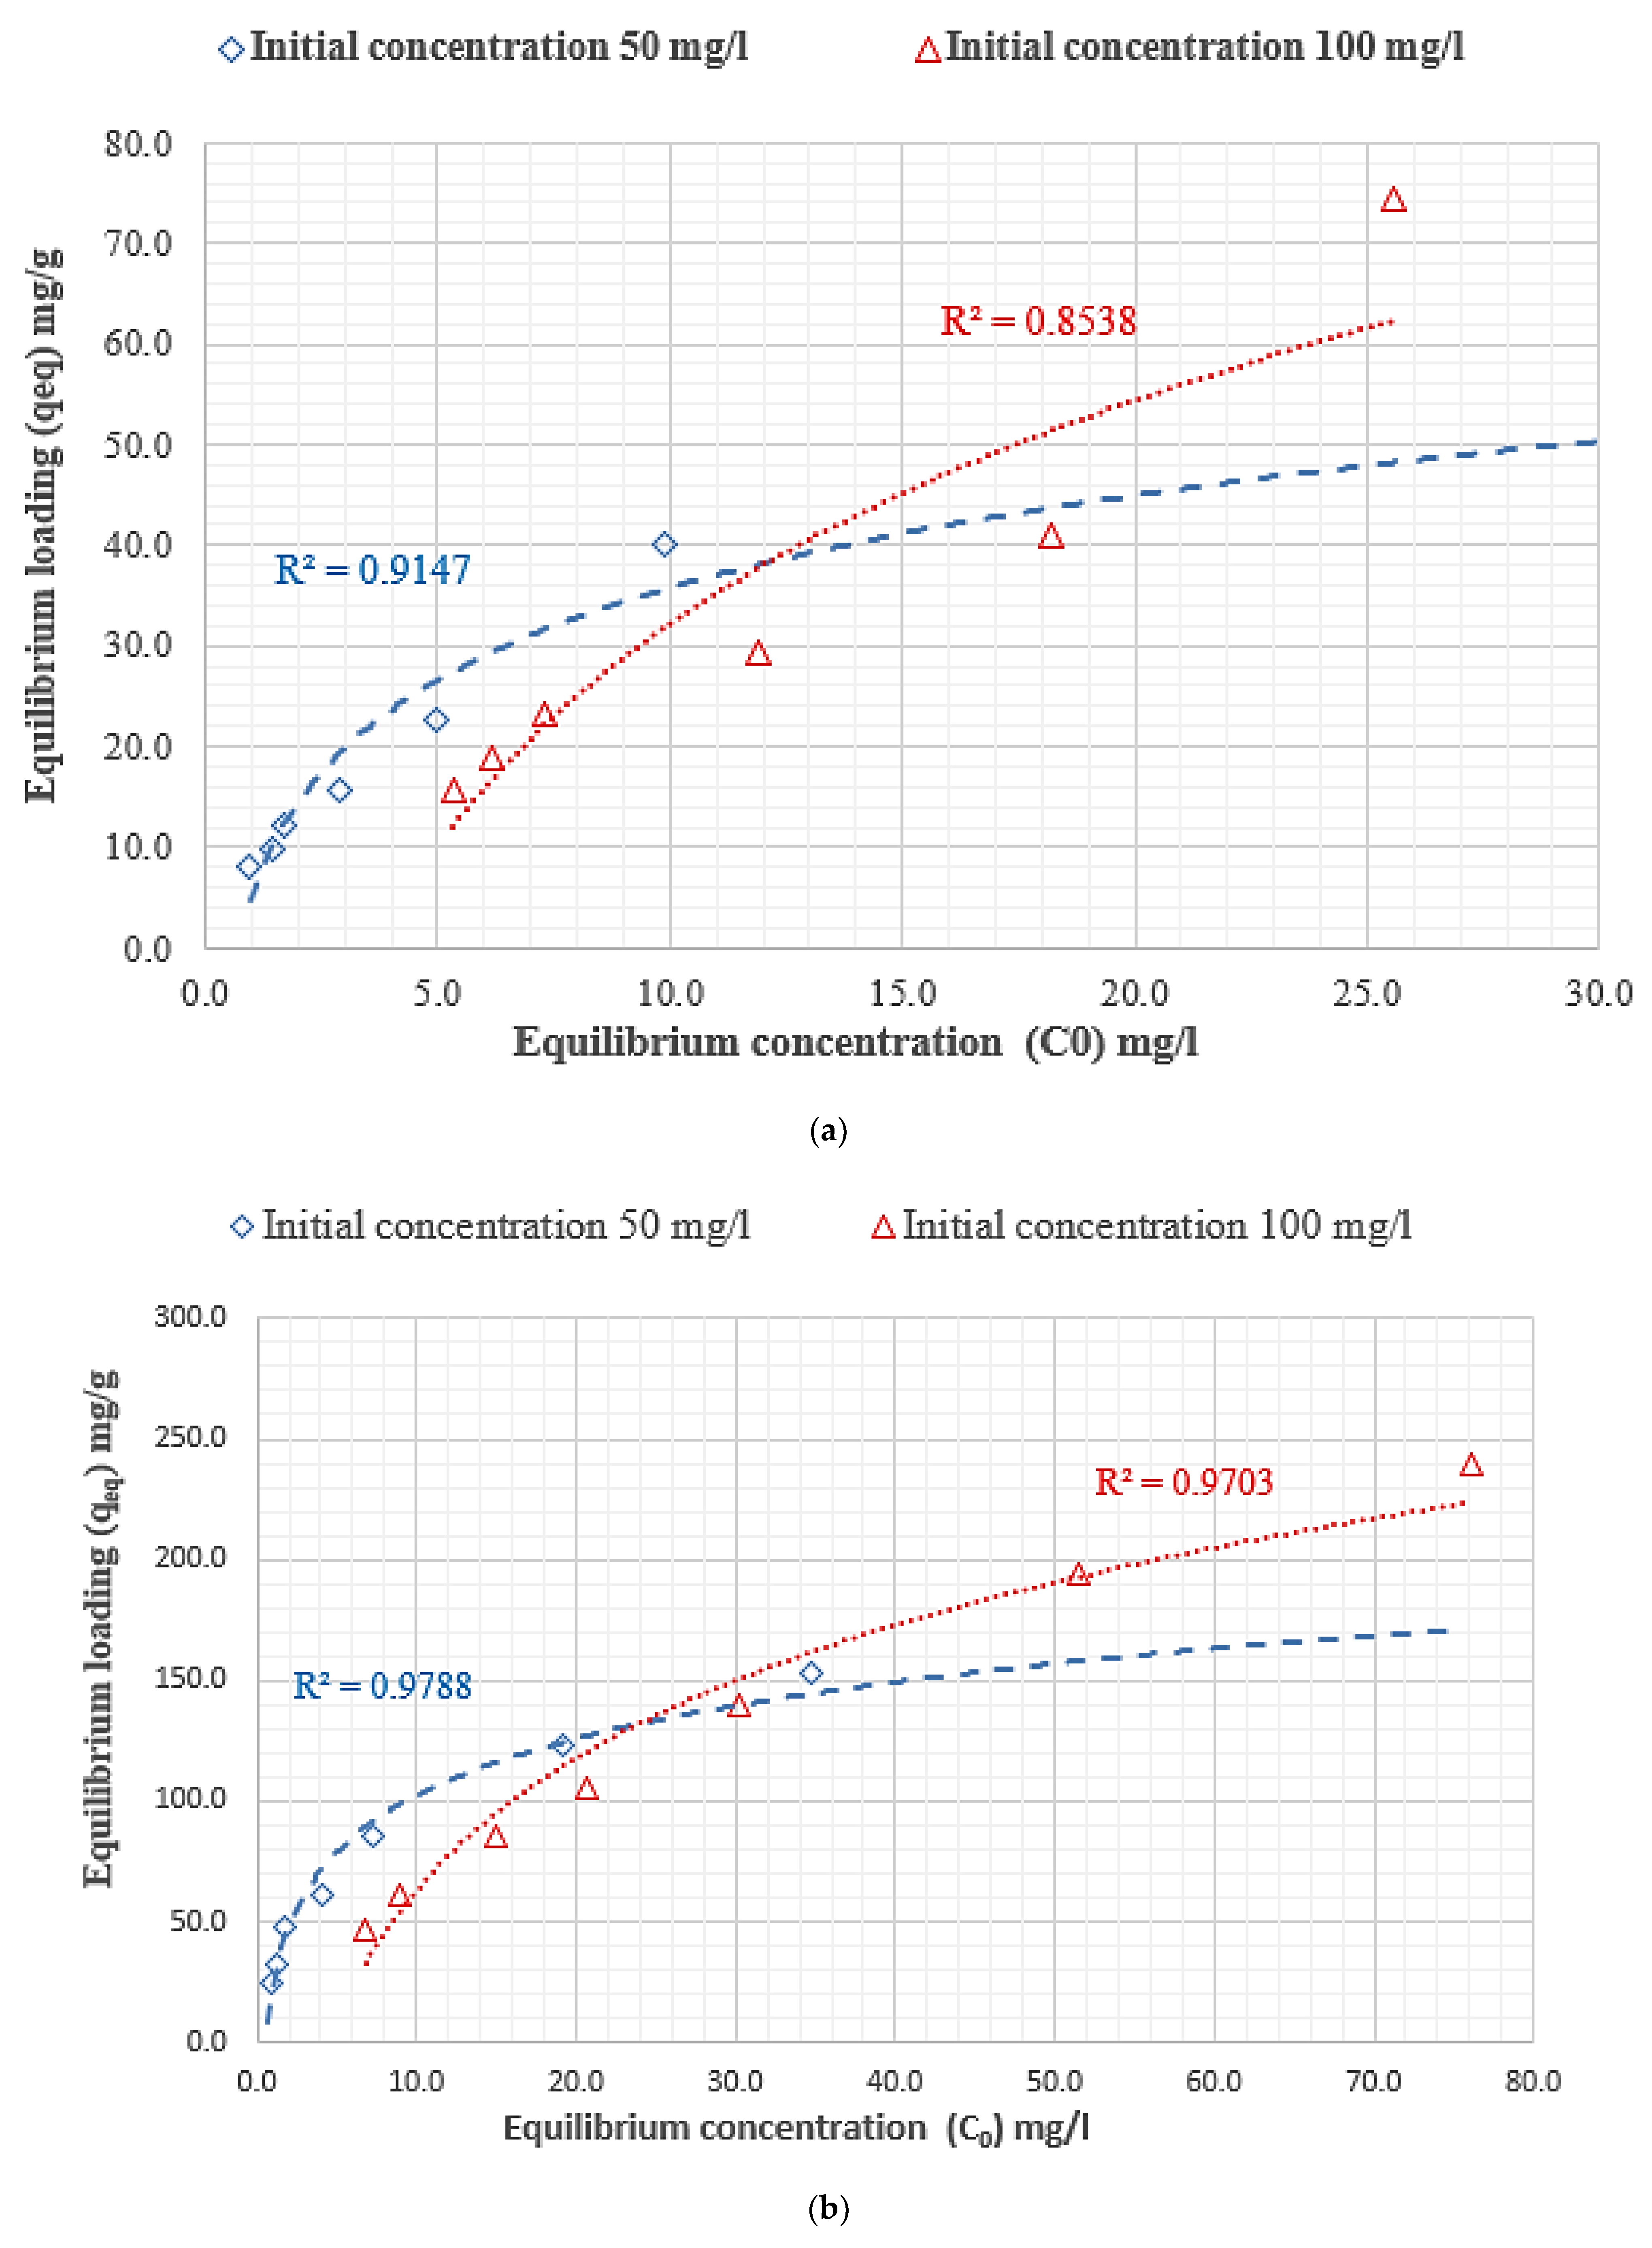
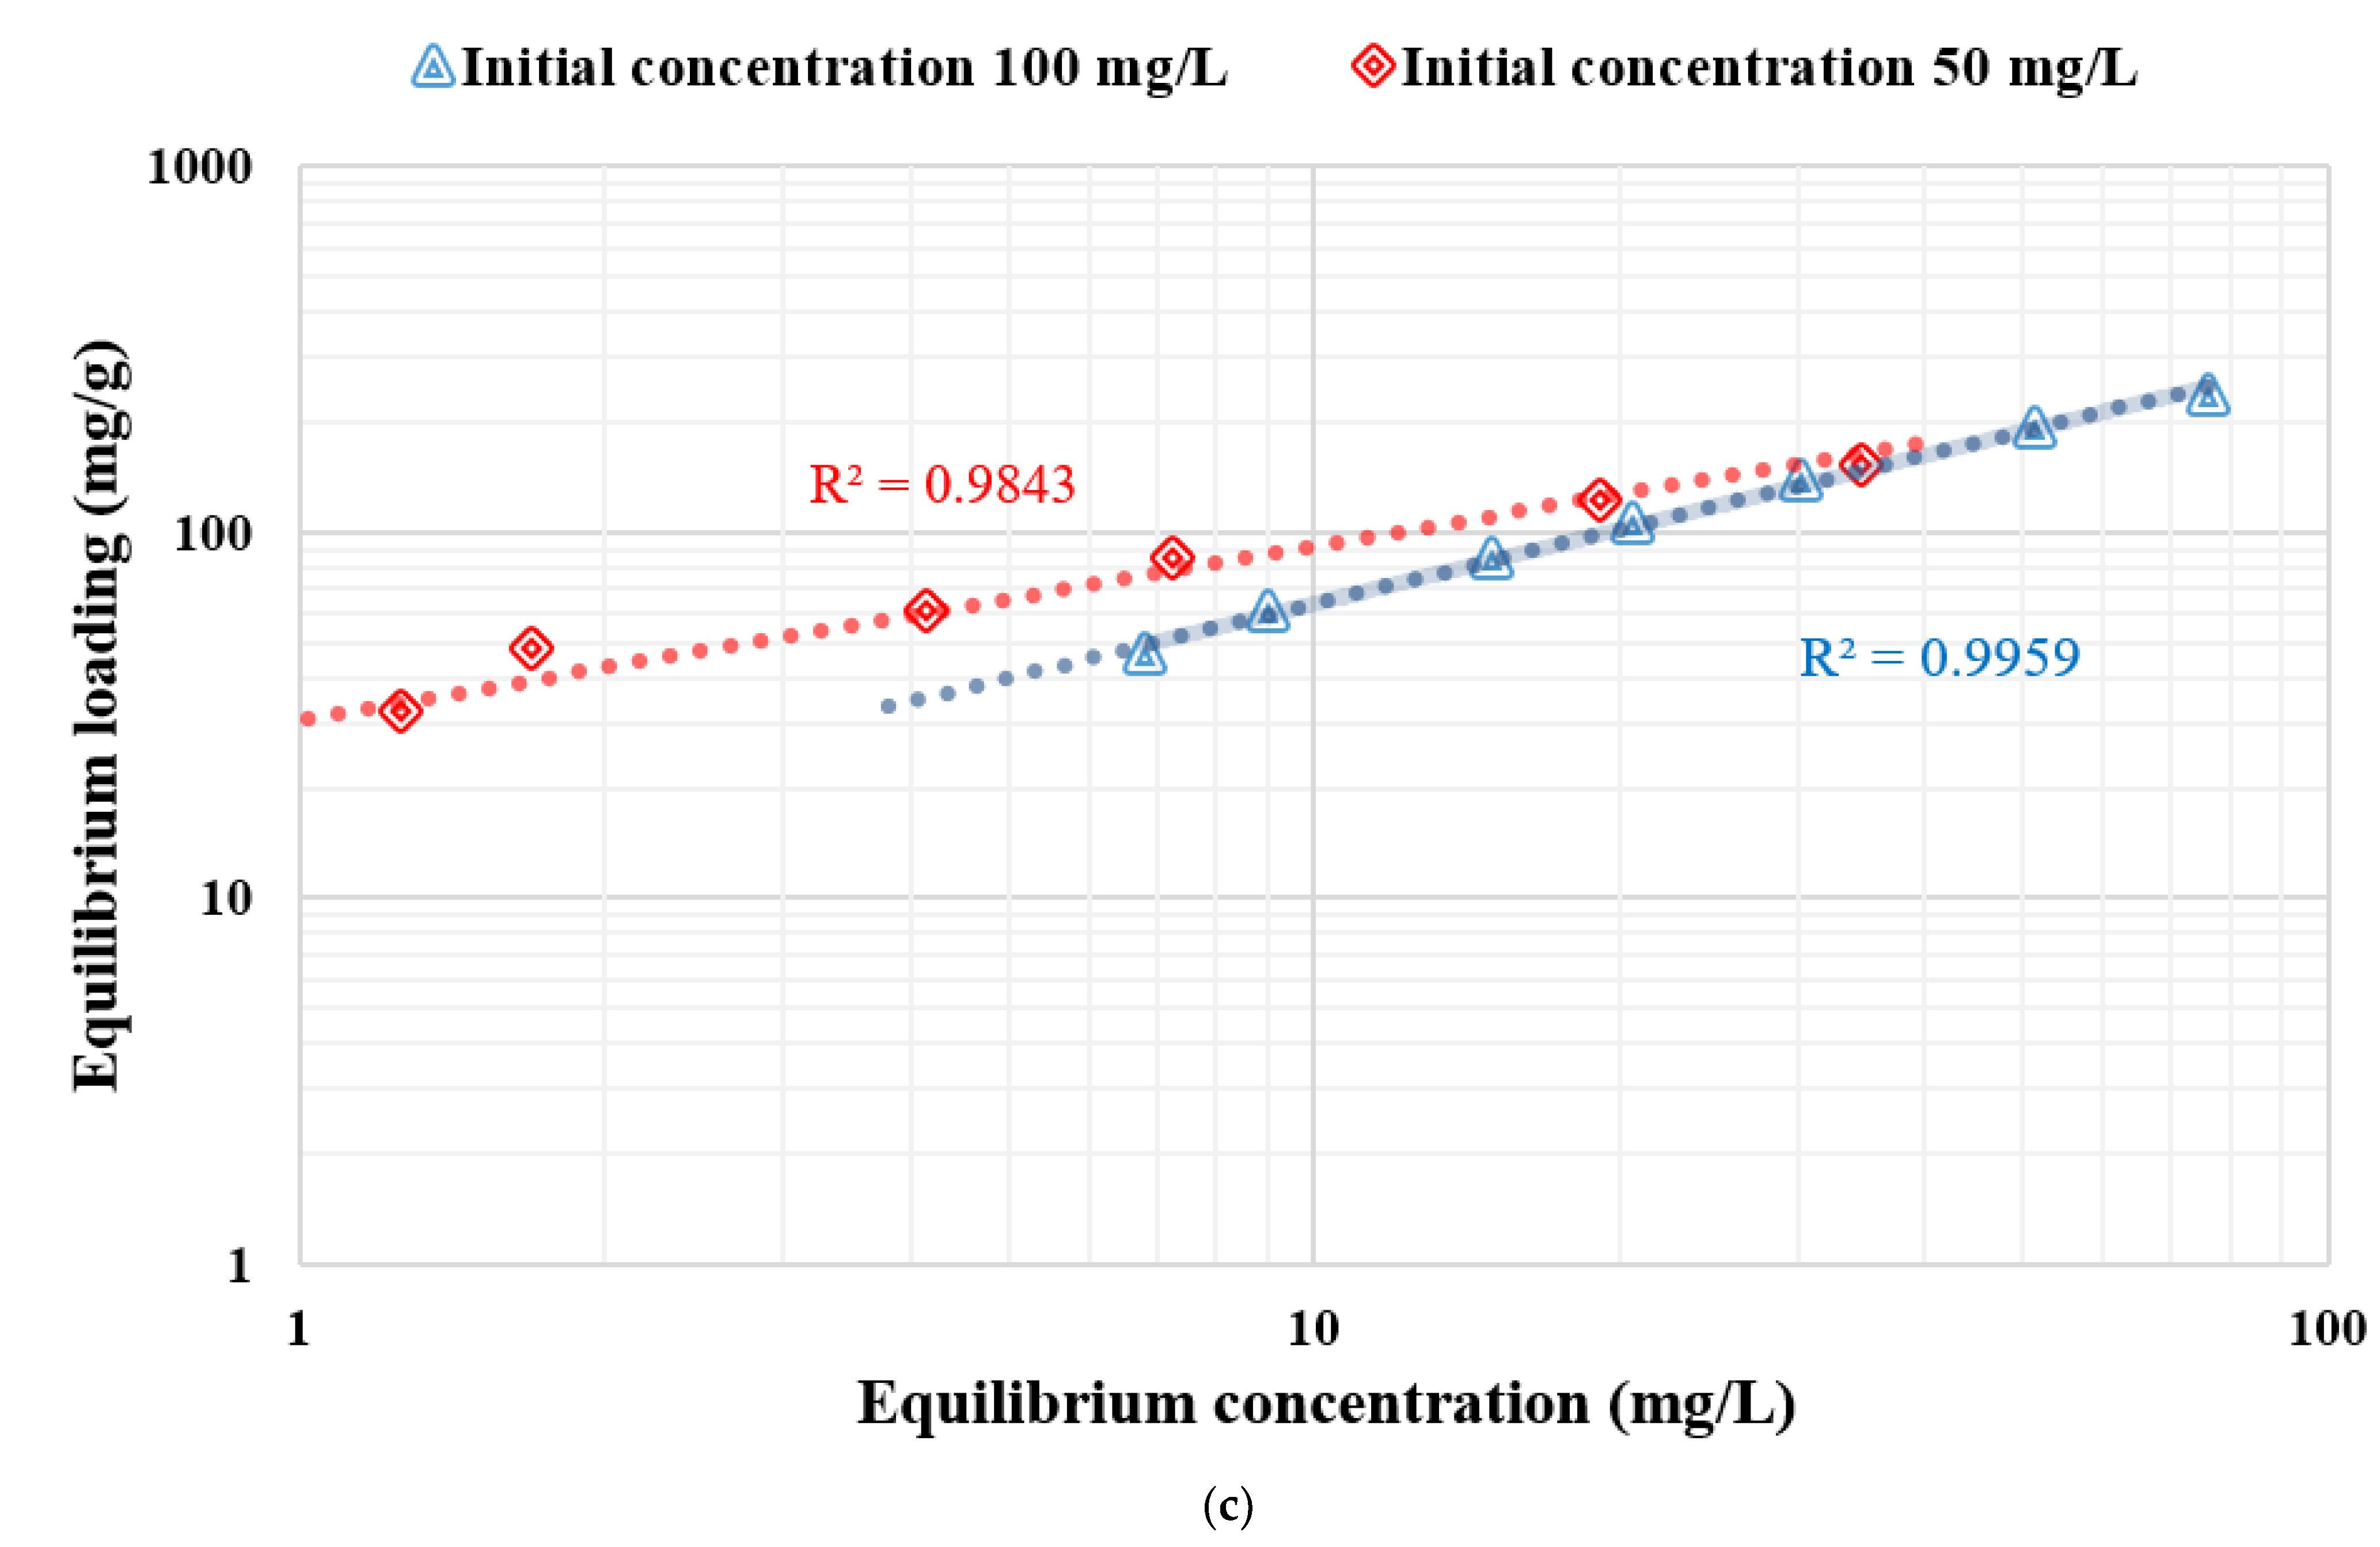
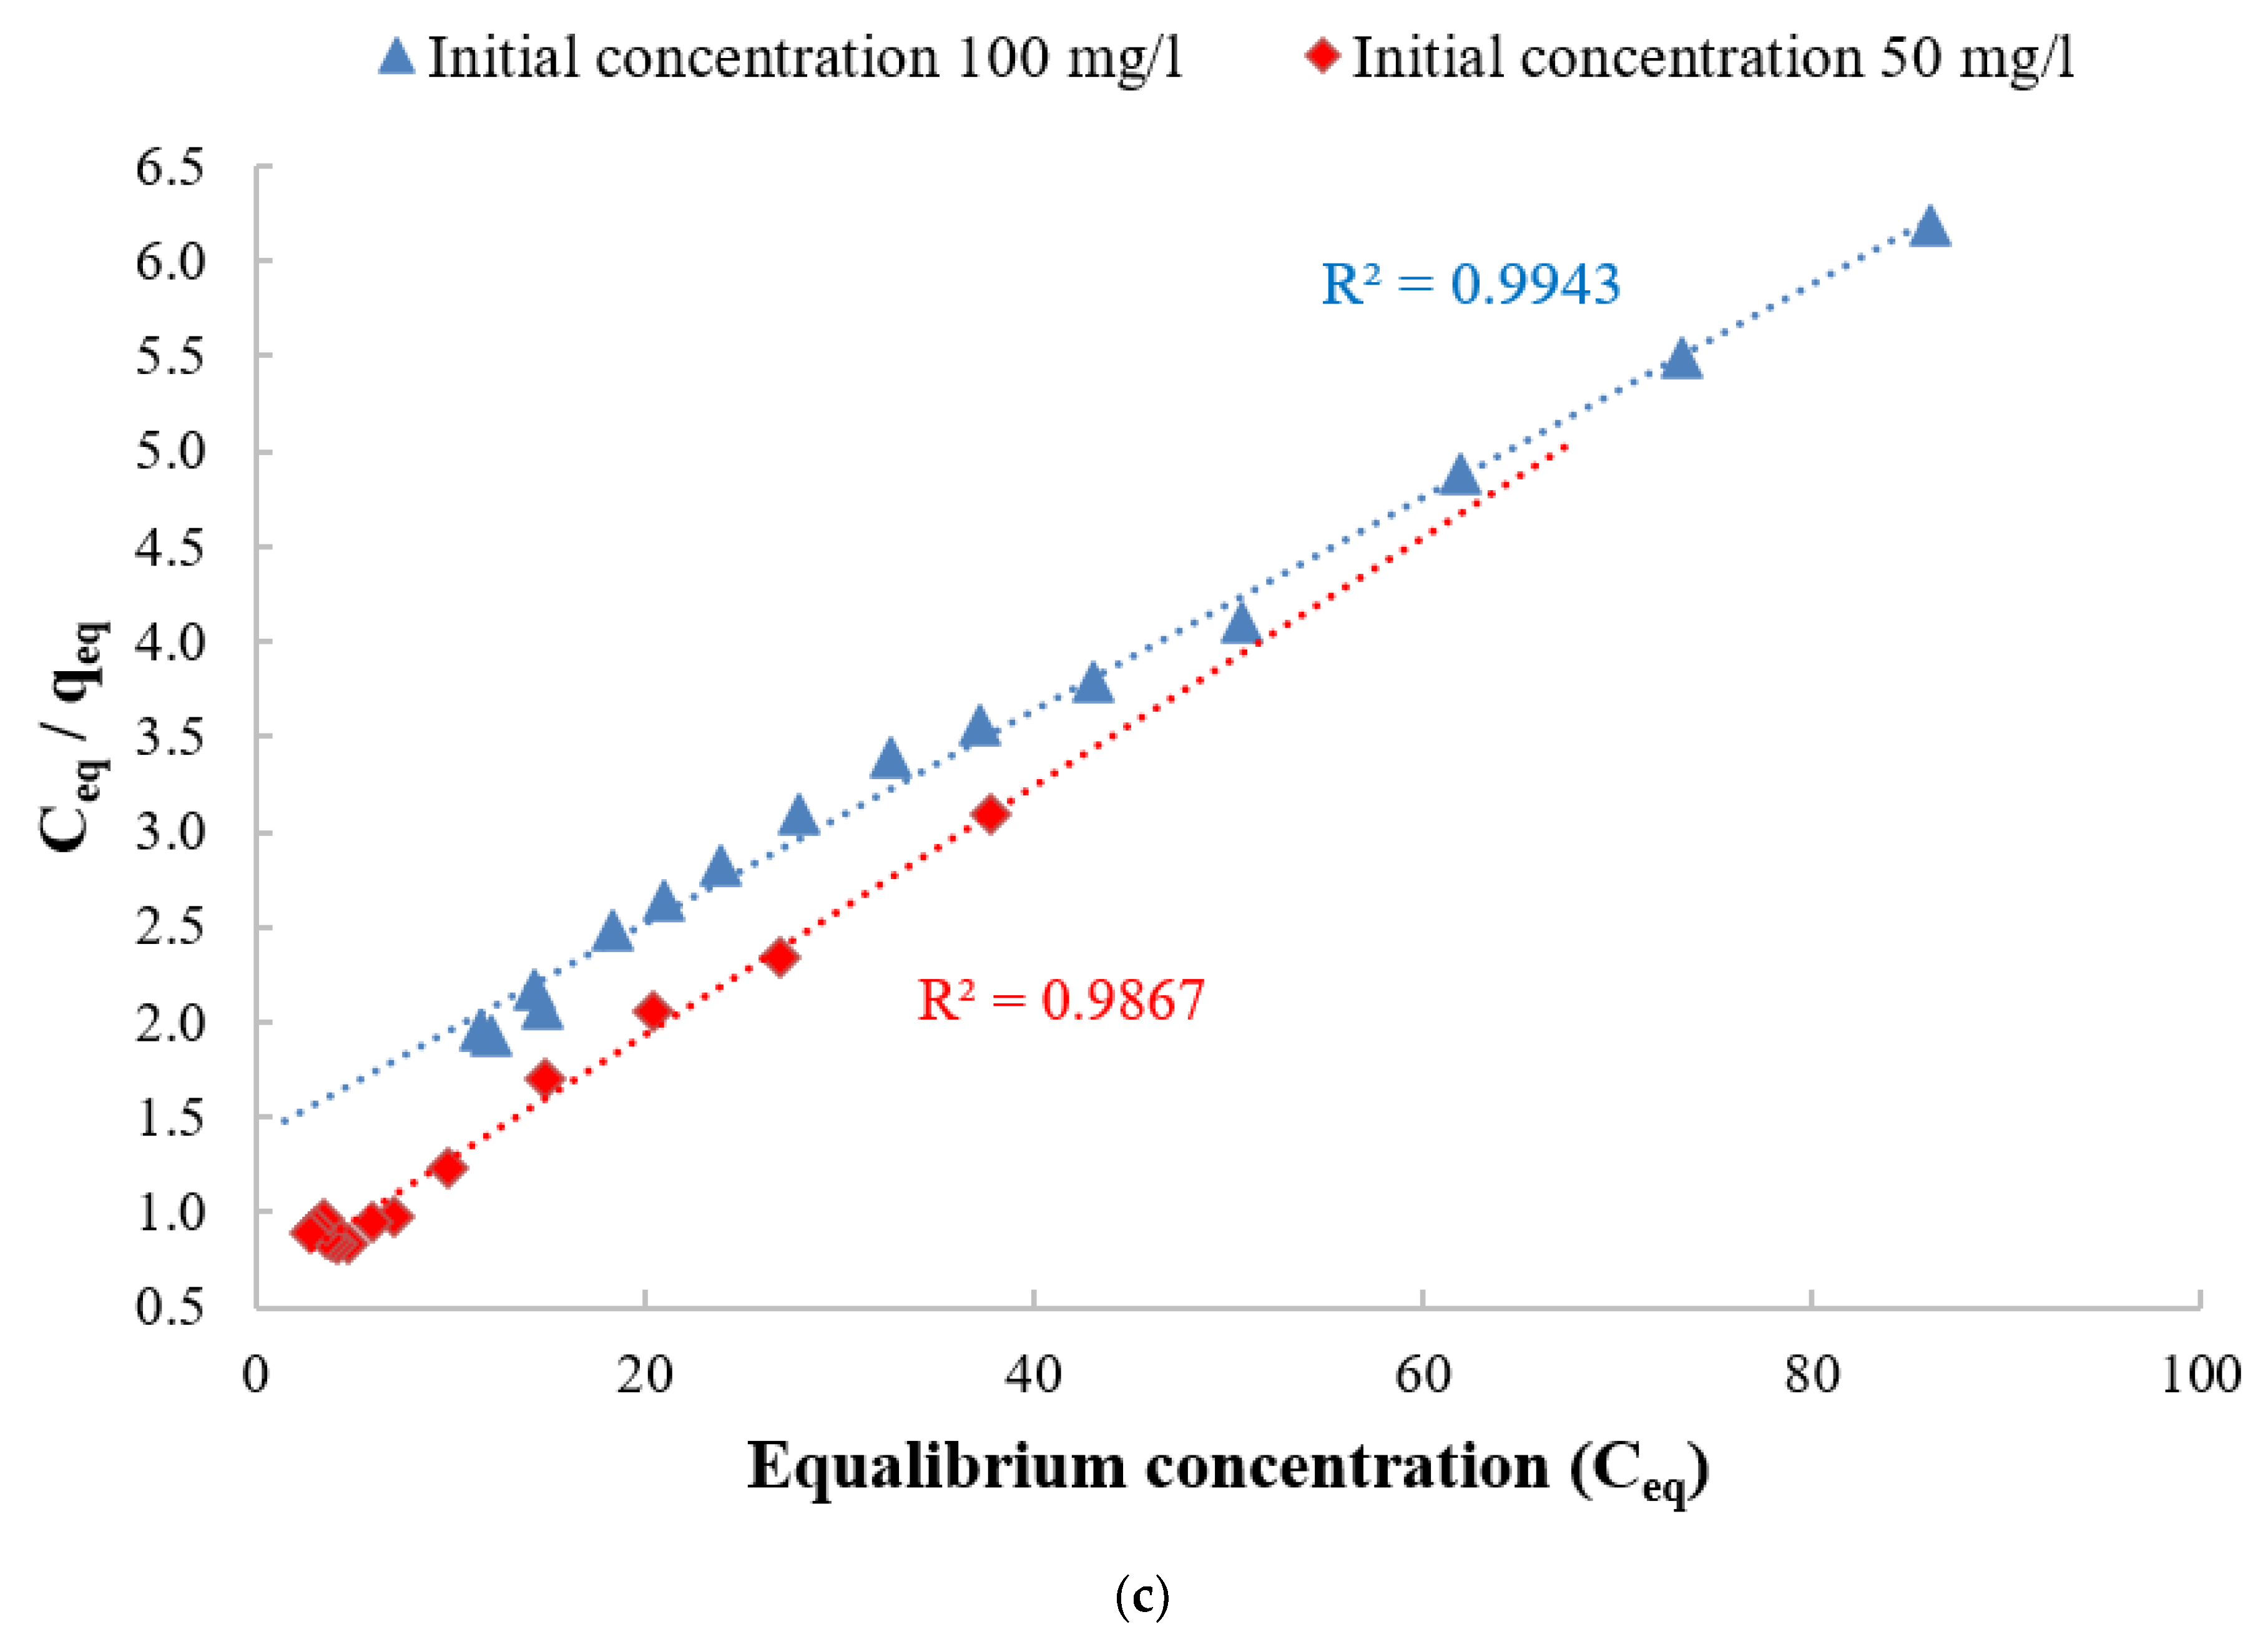
3.4. Adsorption Isotherm

As shown in Figure 19, the adsorption isothermal curve indicates the quantity of adsorbate DB78 dye that can be adsorbed by the adsorbents (chitosan, nanocellulose, and CCMB-0.25:1), qeq, in comparison to the adsorbate concentration in the liquid state (Ceq). These are essential considerations in the design of adsorption systems. Moreover, the form of the equilibrium curve helps to describe other phenomena linked with the adsorbent–adsorbate interaction. The equilibrium curves are identified in four main classes, according to the primary slope, and the subgroups are described for each class based on the upper parts’ shapes and the slope changes: (a) S curves or vertical orientation isotherm, (b) L curves or normal or “Langmuir” isotherms, (c) H curves or high-affinity isotherms, and (d) C curves or constant partition isotherm [65].
The initial shape of the equilibrium curve (L shape) in Figure 19 follows the basic premise that, the higher the solute concentration, the greater the adsorption capacity, until the number of adsorption site clearance is limited, and competition occurs between the solute molecules for the available sites. This isotherm type indicates that the adsorption occurs due to relatively weak forces, such as “van der Waals forces”. There are several isothermal models (equations) available, and the two important isotherms are selected in this study, namely the Freundlich and Langmuir isotherms.
The Freundlich isotherm believes that the adsorption happens on a heterogeneous surface, and the adsorbed mass increases exponentially with an increase in concentration [66]. This isotherm explains equilibrium on heterogeneous surfaces, and, hence, capacity is not presumed to be a monolayer. In liquid phase, this isotherm is given by Equation (6):
Qe = Kf Ce 1/nf
where kF is the Freundlich fixed value (kF unit = mg/g, where c = 1/nF is the heterogeneity factor). This isotherm focuses on integrating the role of adsorbent–adsorbate surface interactions. Figure 20 indicates the application of equilibrium data according to the Freundlich isotherm. For chitosan as an adsorbent, the Freundlich constant kf values were 8.02 and 3.65, and the heterogeneity factor 1/nf values were 0.67 and 0.88, respectively, for solutions with the initial concentrations of 50 and 100 mg/L. For nanocellulose as an adsorbent, the Freundlich constant kf values were 30.6 and 13.49 mg/L, and the heterogeneity factor 1/nf values were 0.47 and 0.67 for the initial concentration of 50 and 100 mg/L, respectively. For CCMB-0.25:1 as an adsorbent, the Freundlich constant kf values were 2.18 and 2.12, and the heterogeneity factor 1/nf values were 0.51 and 0.43 with the initial concentrations of 50 and 100 mg/L.
The Langmuir isotherm believes that sorption occurs within the adsorbent at different homogeneous sites, and it has been successfully applied to several processes of sorption. The isotherm’s physical simplicity is based on some assumptions: Adsorption cannot occur beyond monolayer coverage. Each site can hold only one adsorbate molecule. All sites are energetically equivalent, and the surface is uniform. The linear form of the Langmuir isotherm is given by Equation (7):
(Ce/qe) = (1/Q0 b) + (Ce/Q0)
where Ce is the equilibrium concentration (mg/L), qe is the mass adsorbed at equilibrium (mg/g), Q0 is the adsorbent loading (mg/g), and b is the adsorption energy (Langmuir fixed value L/mg). The values of Q0 and b were determined from the slope and intercept of the linear plots Ce/qe versus Ce, resulting in a straight line of slope 1/Q0, corresponding to the total coverage of monolayer (mg/g), and the intercept is 1/Q0b [67,68].
Figure 21 indicates the application of equilibrium data according to the Langmuir isotherm. For chitosan, the adsorbent loading value (Q0) was 73.5 mg/g, and the Langmuir fixed value (b) was 0.107 L/mg for the initial concentration of 50 mg/L. For nanocellulose, the adsorbent loading value (Q0) was 175.4 mg/g, and the Langmuir fixed value (b) value was 0.16 and 1/mg. For CCMB-0.25:1, the adsorbent loading value (Q0) was 15.3 mg/g, and the Langmuir fixed value (b) was 1.03 L/mg.
It was observed from the listed adsorption isothermal models in Table 3 that they follow the Freundlich isotherm for chitosan as an adsorbent. The Langmuir isotherm is for CCMB-0.25:1 as an adsorbent, and both the Freundlich and Langmuir are for nanocellulose as an adsorbent.

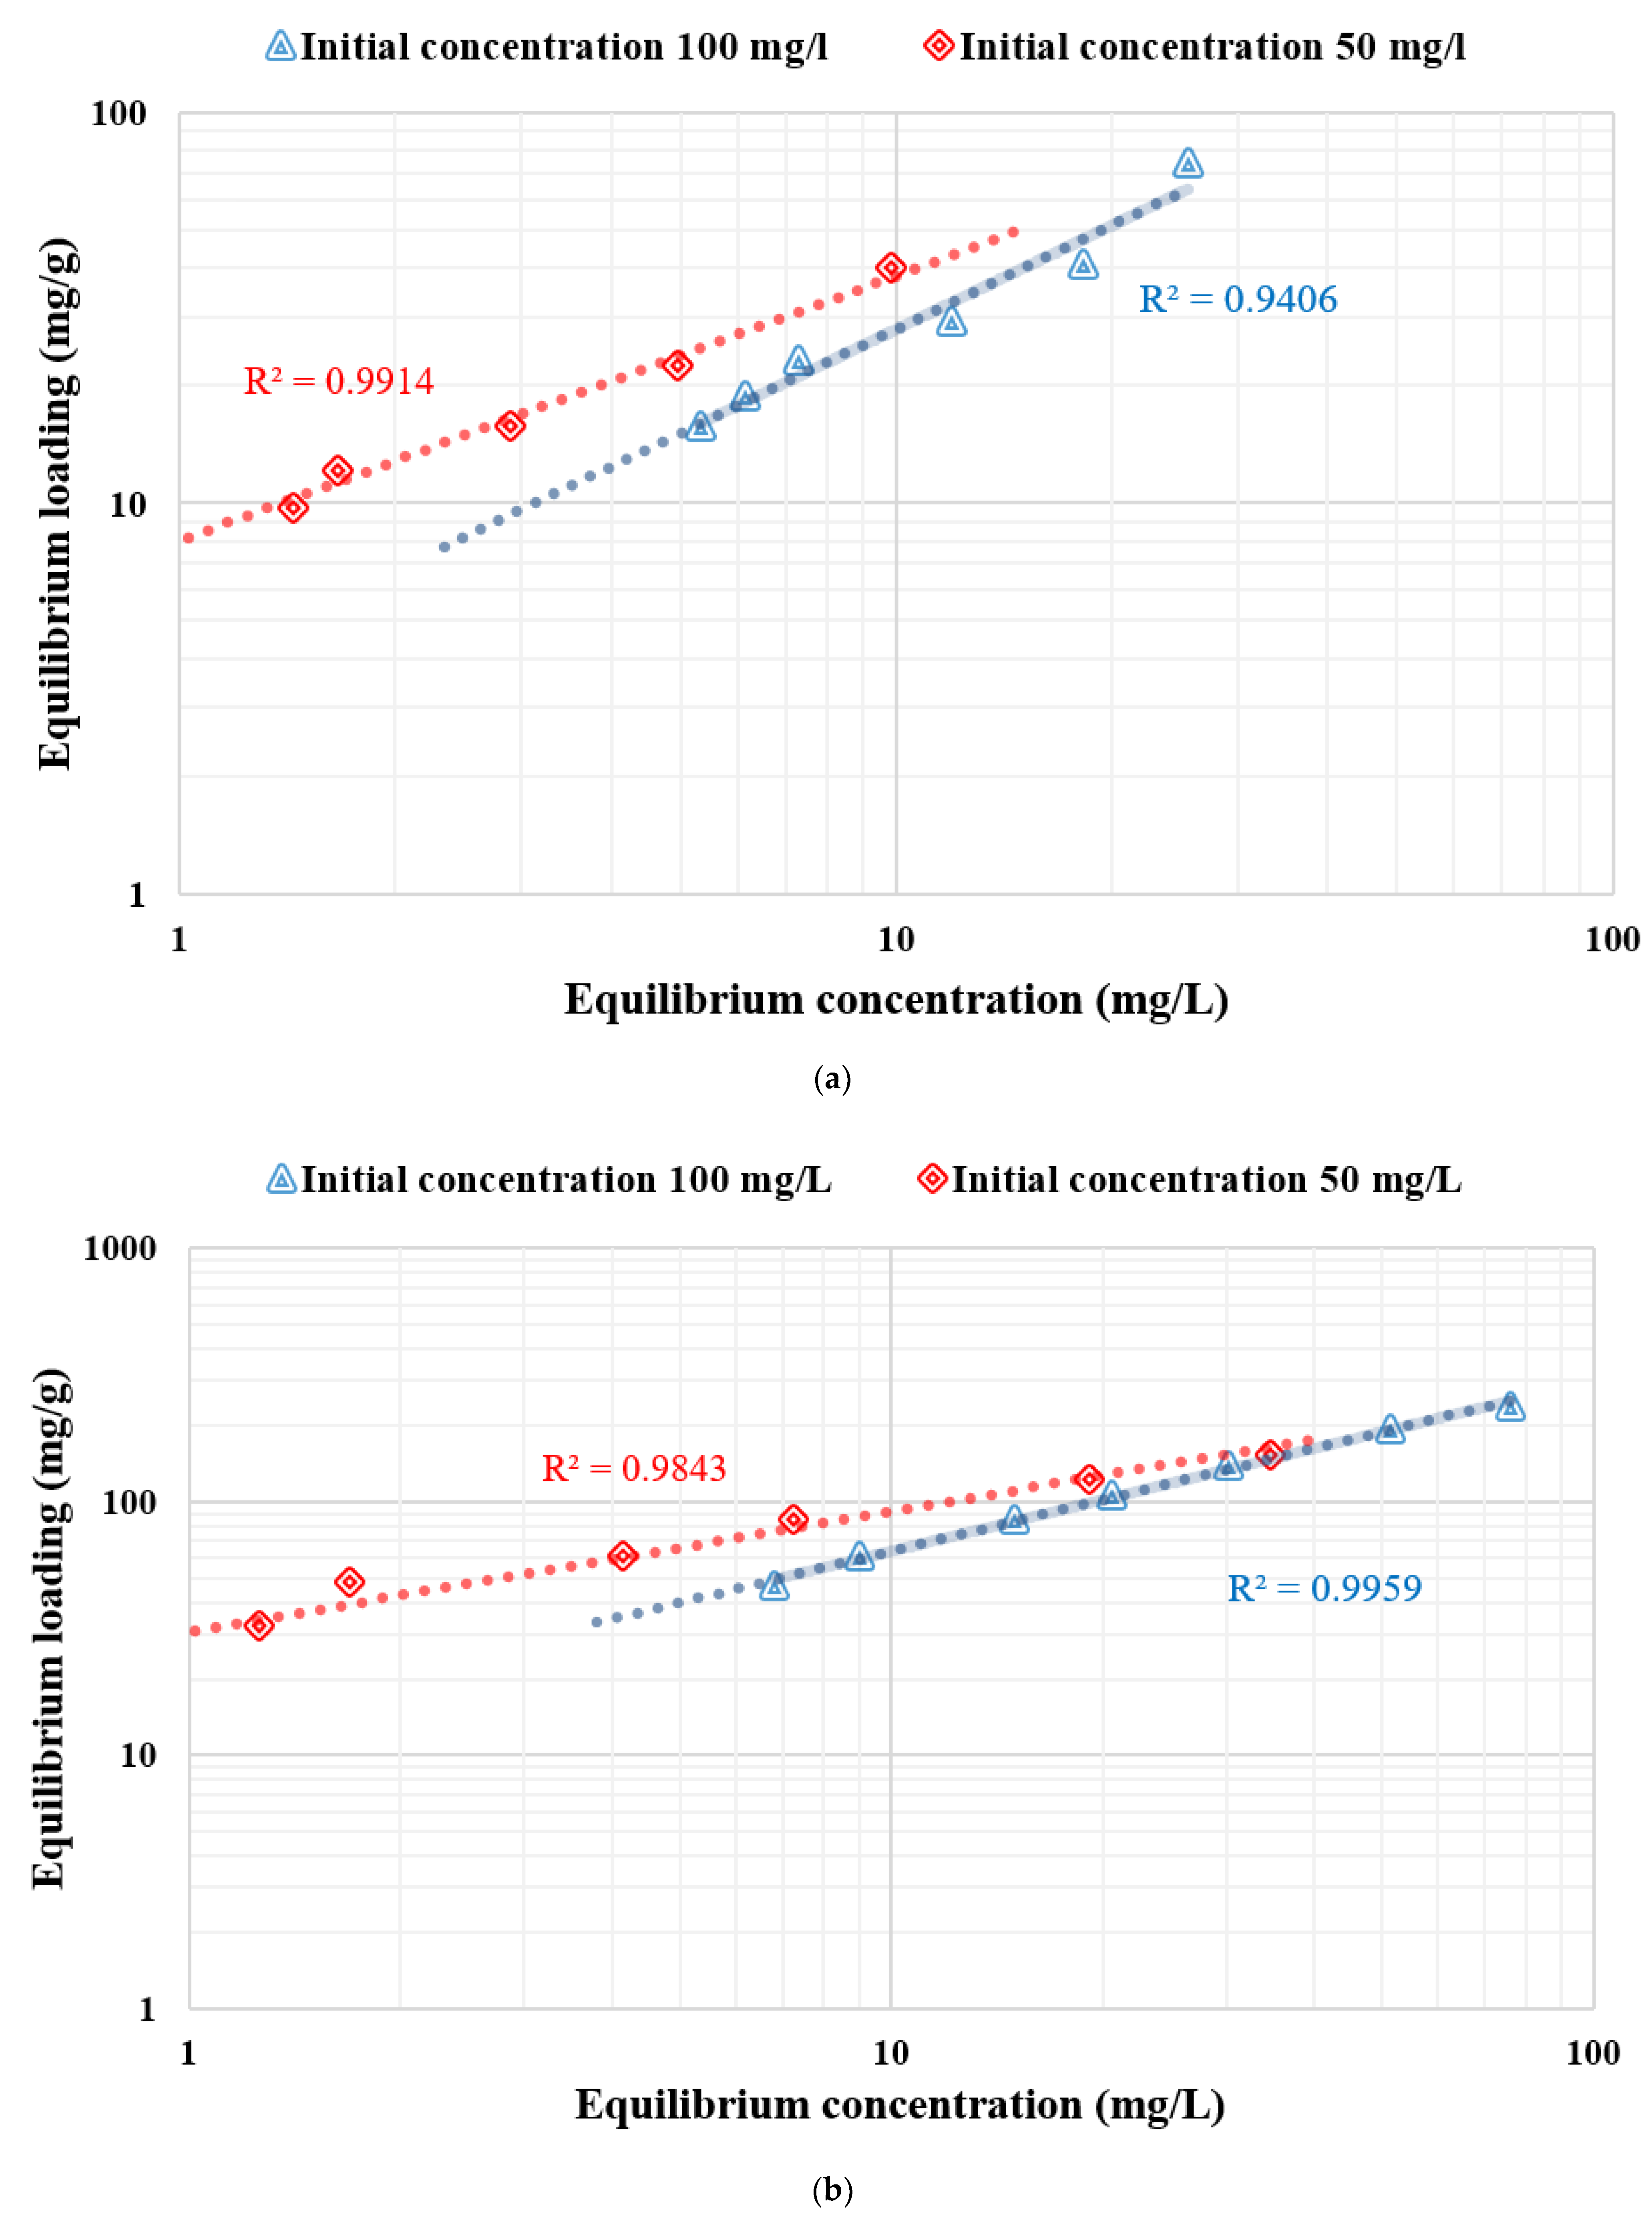
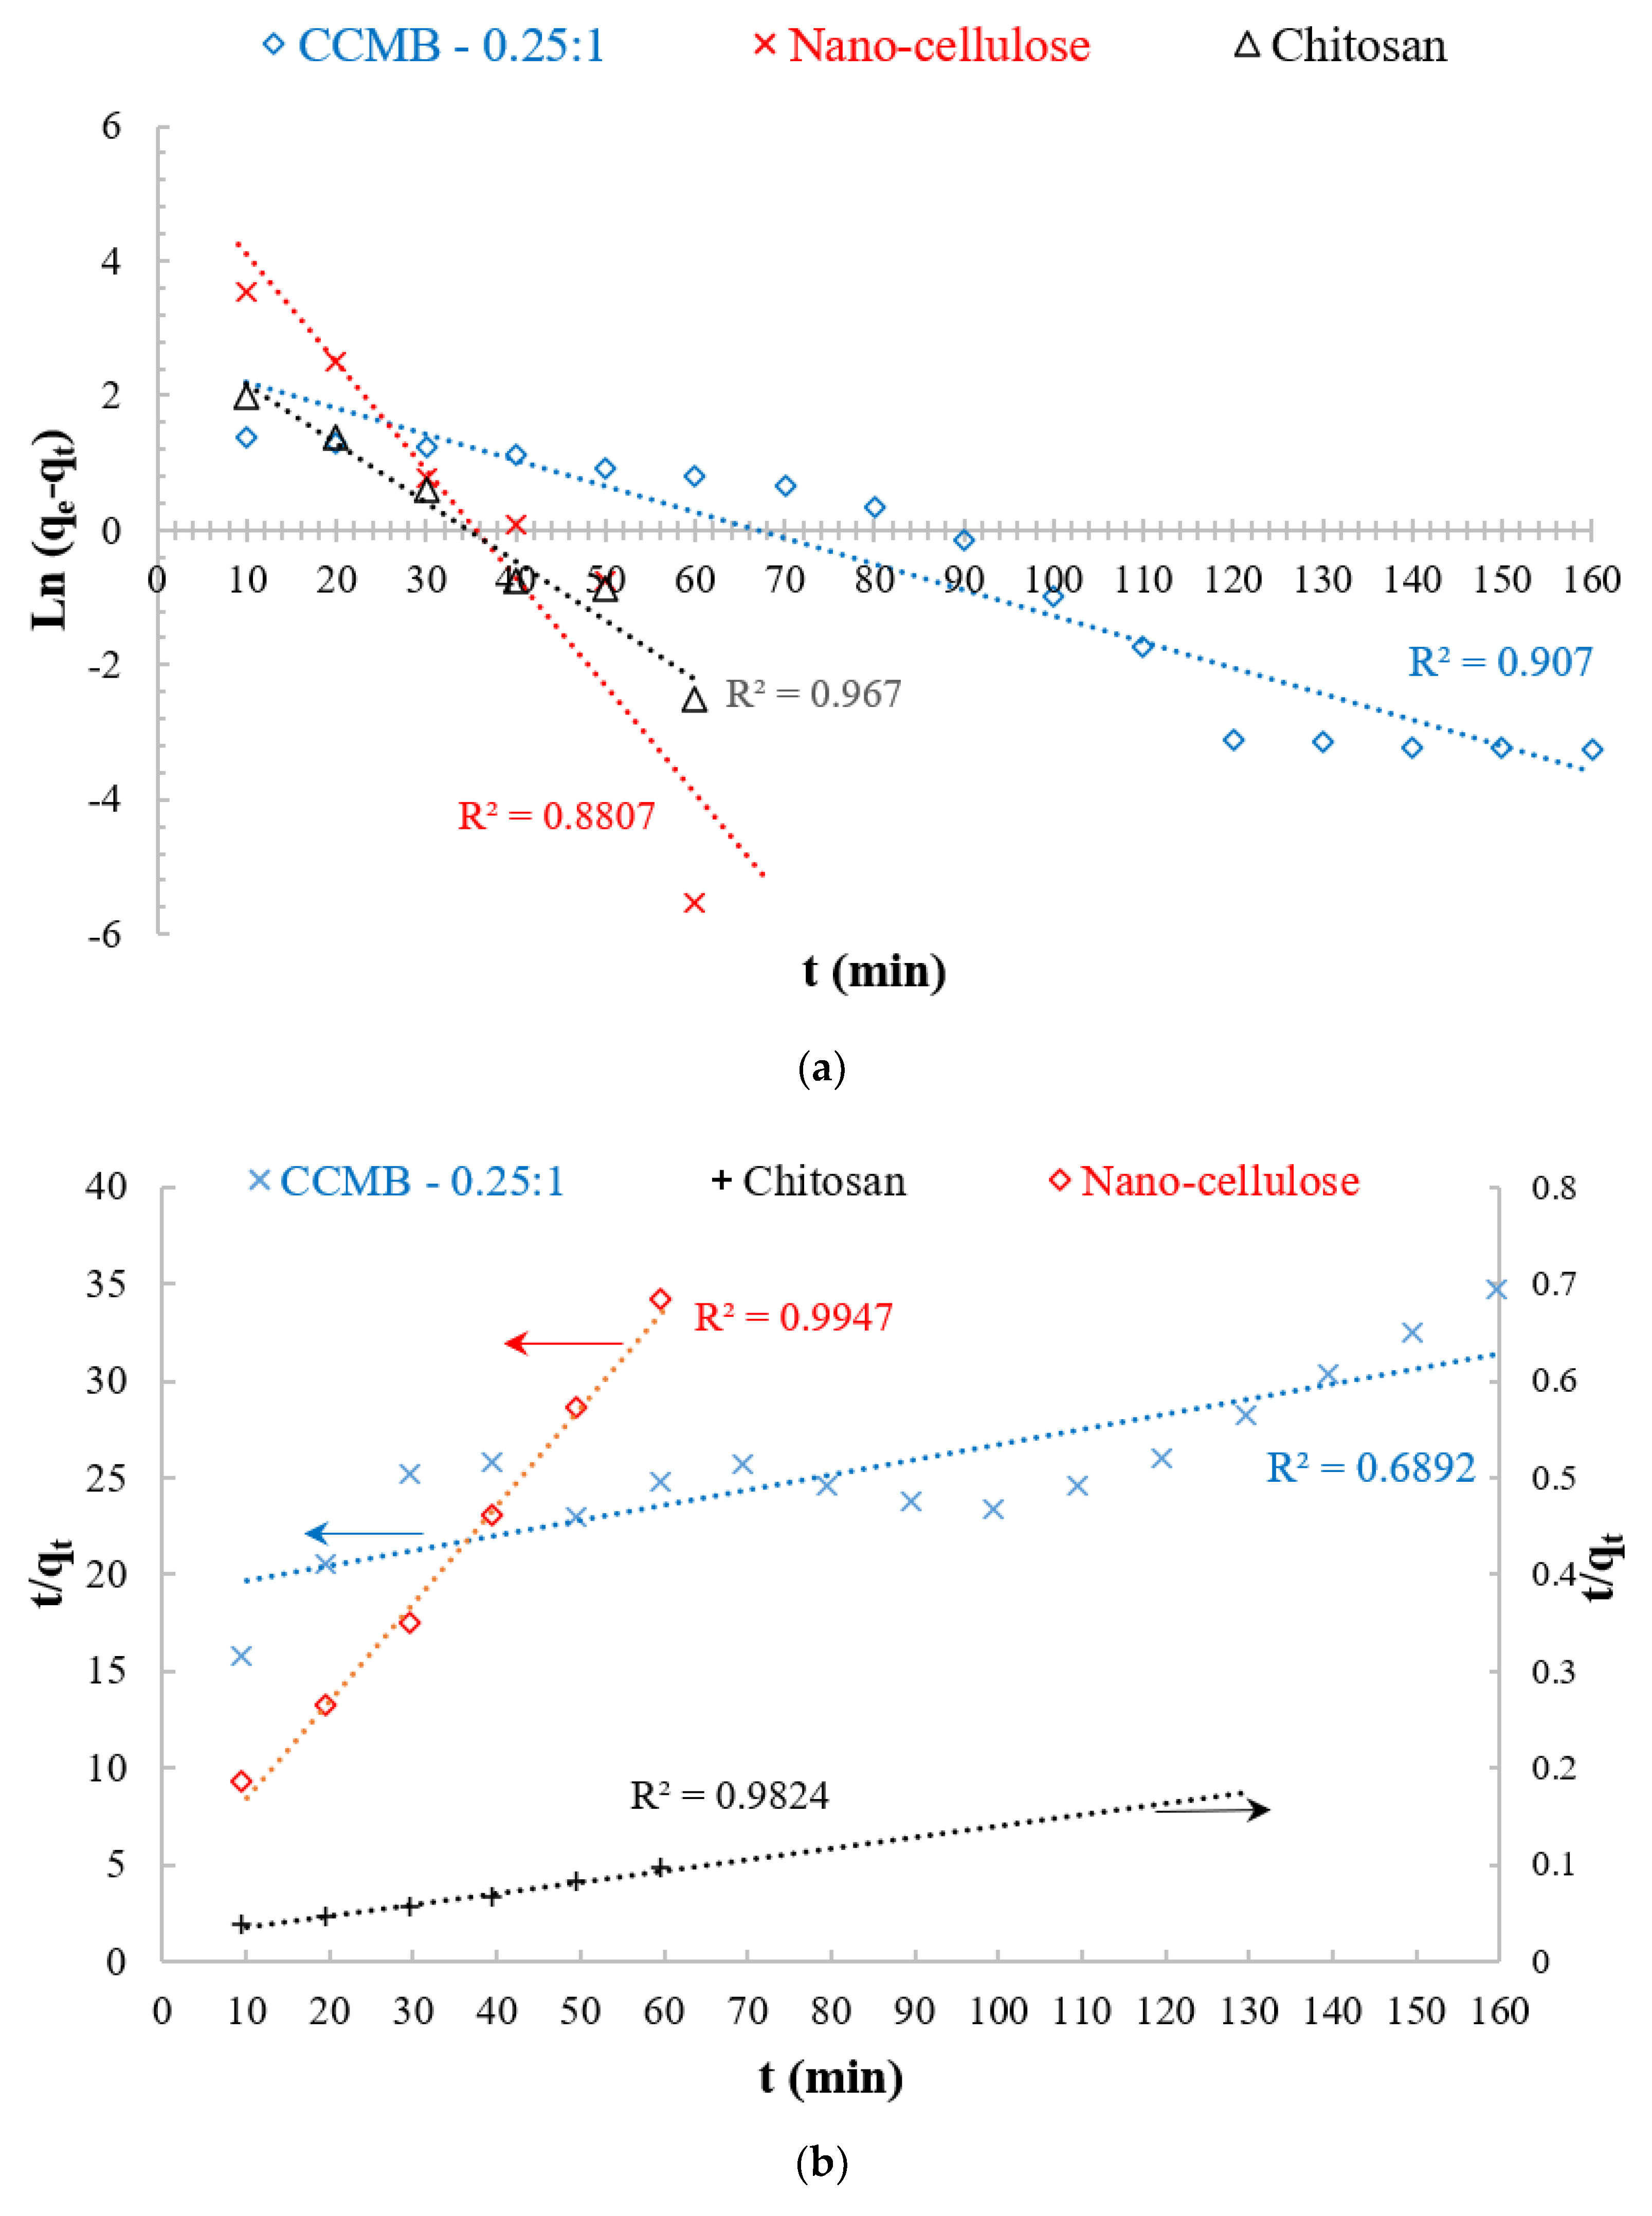
3.5. Adsorption Kinetics

In order to understand the mechanism of adsorption process, the kinetic studies were conducted by extracting and analyzing the samples at time intervals of 10 min until the consecutive residue dye concentrations became closer. The kinetic data for the adsorption process of DB78 dye onto chitosan, nanocellulose, and CCMB-0.25:1 with an initial dye concentration of 50 mg/L were examined with the well-known kinetic models, namely pseudo first-order model (PFO) and pseudo second-order model (PSO). The plotting of these kinetic models is shown in Figure 22.
Pseudo first-order equation:
The pseudo first-order kinetic equation was used for the adsorption analysis. The linear form of this equation is as follows:
ln (qe-qt) = ln qe–k1 t
where qe (mg/g) and qt (mg/g) are the amounts of adsorbed adsorbate at equilibrium and at time, t, respectively. K1 (min−1) is the rate constant of pseudo first-order model.
Pseudo second-order equation:
The adsorption kinetics can also be described by the pseudo second-order model. The linear form of the pseudo-second-order equation is expressed as follows:
(t/qt) = (1/k2qe2) + (1/qe) t
where k2 (g/mg min) is the equilibrium rare constant of pseudo second-order adsorption; and qe (mg/g) and qt (mg/g) are the amounts of adsorbed adsorbate at equilibrium and at time, t, respectively [69,70].
Figure 22 shows the linear plots of PFO and PSO models of CCMB-0.25:1, nanocellulose, and chitosan. The kinetic parameters are listed in Table 4. On the basis of the low correlation coefficient for PSO and the high value for PFO, the adsorption abilities of CCMB-0.25:1 follow PFO rather than PSO; on the other hand, the adsorption behavior of nanocellulose and chitosan follows PSO rather than PFO. These results suggested that, for CCMB-0.25:1, PFO can best predict the kinetic process. The value of qe = 12.8 mg/g calculated by PFO was more similar to practical qe = 11.5 mg/g than PSO. For nanocellulose and chitosan, PSO can best predict the kinetic process. The values of mg/g calculated by PFO were more similar to practical qe = 11.5 mg/g than PFO, as shown in Table 4. For chitosan, the applicability of the PSO model indicates the interaction between dye molecules and amino groups. Hence, the adsorption system is chemical adsorption. It was reported that the adsorption process of DB78 dye onto chitosan is best fitted to pseudo second order with a chemical adsorption mechanism [71].
The chitosan in powder form showed a high adsorption capacity, as shown in Figure 23; this capacity can be attributed to its high surface area, but it needs longer sedimentation time (8 h). For the chitosan microbeads formed, the swelling of chitosan powder into microbeads in the presence of acidic conditions improved its adoption capacity, due to the protonation of amine groups (NH2) into NH3+. This modification process led to a significant decrease in sedimentation time. Surface area of chitosan in the form of beads is less than the surface area of chitosan in powder form. Therefore, the chitosan microbeads were loaded with cellulose nanoparticles in order to improve the surface area and increase its adsorption capacity.
CCMB has shown a good adsorption capacity, in addition to remarkable short sedimentation time, with a low dose. Five minutes is sufficient to complete the sedimentation process. “Based on the experimental results, maximum removal efficiency 80% can be achieved using chitosan dose 1 g/L. While 65% removal was obtained using nano-cellulose dose 0.25 g/L. In the case of CCMB-0.25:1, 1 g/L of chitosan and 0.25 g/L of nano-cellulose can produce a microbead with a remarkable adsorption capacity of. Removal efficiency 95% with optimal dose 10 g/L was achieved using CCMB-0.25:1”, as shown in Figure 23. Figure 24 shows the adsorption process of DB78 dye, using adsorbents (chitosan, nanocellulose, and CCMB). It was observed that clear water can be obtained in the presence of chitosan powder after a long sedimentation time, i.e., 8 h. CCMB showed the lowest sedimentation time (5 min). Chitosan powder and cellulose nanoparticles showed longer sedimentation times than CCMB.

4. Conclusions

The removal of direct blue 78 dye (anionic) from single-component synthetic wastewater by adsorption with nanocellulose, chitosan, and novel nanocellulose/chitosan microbeads (CCMB) was experimentally investigated. An altered microbead with different nanocellulose/chitosan ratios (0.1:1, 0.25:1, 0.5:1, and 1:1) was synthetized in order to study the effect of nanocellulose dose on removal efficiency. The removal efficiency increases with an increasing nanocellulose dosage in synthetic microbeads up to a nanocellulose/chitosan ratio 0.5:1, and then the efficiency decreases with an increasing nanocellulose dosage. The adsorption process is highly dependent on the initial solution pH; the CCMB-0.25:1 reaches its maximum loading under acidic conditions (pH 3.5). It was observed from experimental studies that removal efficiencies of 94%, 91.7%, and 92.1% can be obtained by using the adsorbents chitosan, nanocellulose, and CCMB-0.25:1, respectively, for dye solution with an initial concentration 50 mg/L. Equilibrium studies have shown that the initial shape of the equilibrium curve is an L-shape, meaning that the adsorption process resulted from electrostatic interaction between dyes molecules and adsorbent particles (physical forces). Adsorption studies were modeled by using the Langmuir and Freundlich isothermal models. Therefore, chitosan, nanocellulose, and CCMB could be highly efficient sorbents for removing anionic contaminants. The abovementioned excellent performances of chitosan, nanocellulose, and CCMB demonstrated them as promising dye adsorbents for wastewater treatment.

Author Contributions

Conceptualization, M.B., M.S.Z., M.H.A.-A. and I.M.; methodology, M.B., M.S.Z. and M.H.A.-A.; software, M.B.; validation, M.B., M.S.Z., M.H.A.-A. and I.M.; formal analysis M.B., M.S.Z., M.H.A.-A. and I.M.; investigation, M.B., M.S.Z. and M.H.A.-A.; resources, M.B., M.S.Z. and M.H.A.-A.; data curation, M.B., M.S.Z. and M.H.A.-A.; writing—original draft preparation, M.B., M.S.Z. and M.H.A.-A.; writing—review and editing, M.B., M.S.Z., M.H.A.-A. and I.M.; visualization, M.B., M.S.Z., M.H.A.-A. and I.M.; supervision, M.B., M.S.Z., M.H.A.-A. and I.M.; funding acquisition, M.B. All authors have read and agreed to the published version of the manuscript.

Funding

This project was funded by the Deanship of Scientific Research (DSR), King Abdulaziz University, Jeddah, under grant No. (G 327-829-38).

Institutional Review Board Statement

Not applicable.

Informed Consent Statement

Not applicable.

Data Availability Statement

Further data is available on request from the authors.

Acknowledgments

This project was funded by the Deanship of Scientific Research (DSR), King Abdulaziz University, Jeddah, under grant No. (G 327-829-38). The authors, therefore, acknowledge and thank DSR for technical and financial support.

Conflicts of Interest

The authors declare no conflict of interest.

References

  1. Ramya, M.; Karthika, M.; Selvakumar, R.; Raj, B.; Ravi, K. A facile and efficient single step ball milling process for synthesis of partially amorphous Mg-Zn-Ca alloy powders for dye degradation. J. Alloy. Compd. 2017, 696, 185–192. [Google Scholar] [CrossRef]
  2. Gómez, V.; Larrechi, M.; Callao, M. Kinetic and adsorption study of acid dye removal using activated carbon. Chemosphere 2007, 69, 1151–1158. [Google Scholar] [CrossRef] [PubMed]
  3. Sandid, A.M.; Bassyouni, M.; Nehari, D.; Elhenawy, Y. Experimental and simulation study of multichannel air gap membrane distillation process with two types of solar collectors. Energy Convers. Manag. 2021, 243, 114431. [Google Scholar] [CrossRef]
  4. Zoromba, M.S.; Abdel-Aziz, M.H. Ecofriendly method to synthesize poly (o-aminophenol) based on solid state polymerization and fabrication of nanostructured semiconductor thin film. Polymers 2017, 120, 20–29. [Google Scholar] [CrossRef]
  5. Elhenawy, Y.; Elminshawy, N.A.S.; Bassyouni, M.; Alhathal Alanezi, A.; Drioli, E. Experimental and theoretical investigation of a new air gap membrane distillation module with a corrugated feed channel. J. Membr. Sci. 2020, 594, 117461. [Google Scholar] [CrossRef]
  6. Nair, A.K.; Kumar, B.V.; Kalaiarasan, G.; Babu, P.J. TiO2 nanosheet incorporated polysulfone ultrafiltration membranes for dye removal. Desalination Water Treat. 2018, 107, 324–331. [Google Scholar] [CrossRef]
  7. Elhady, S.; Bassyouni, M.; Mansour, R.A.; Elzahar, M.H.; Abdel-Hamid, S.; Elhenawy, Y.; Saleh, M.Y. Oily Wastewater Treatment Using Polyamide Thin Film Composite Membrane Technology. Membranes 2020, 10, 84. [Google Scholar] [CrossRef]
  8. El-Mehalmey, W.A.; Safwat, Y.; Bassyouni, M.; Alkordi, M.H. Strong Interplay between Polymer Surface Charge and MOF Cage Chemistry in Mixed-Matrix Membrane for Water Treatment Applications. ACS Appl. Mater. Interfaces 2020, 12, 27625–27631. [Google Scholar] [CrossRef]
  9. Zoromba, M.S.; Ismail, M.I.; Bassyouni, M.; Abdel-Aziz, M.H.; Salah, N.; Alshahrie, A.; Memic, A. Fabrication and characterization of poly (aniline-co-o-anthranilic acid)/magnetite nanocomposites and their application in wastewater treatment. Colloids Surf. A Physicochem. Eng. Asp. 2017, 520, 121–130. [Google Scholar] [CrossRef]
  10. Bassyouni, M.; Abdel-Aziz, M.H.; Zoromba, M.S.; Abdel-Hamid, S.M.S.; Drioli, E. A review of polymeric nanocomposite membranes for water purification. J. Ind. Eng. Chem. 2019, 73, 19–46. [Google Scholar] [CrossRef]
  11. Elrasheedy, A.; Nady, N.; Bassyouni, M.; El-Shazly, A. Metal Organic Framework Based Polymer Mixed Matrix Membranes: Review on Applications in Water Purification. Membranes 2019, 9, 88. [Google Scholar] [CrossRef] [PubMed] [Green Version]
  12. Abdel-Aziz, M.H.; El-Ashtoukhy, E.-S.; Zoromba, M.S.; Bassyouni, M.; Sedahmed, G. Removal of nitrates from water by electrocoagulation using a cell with horizontally oriented Al serpentine tube anode. J. Ind. Eng. Chem. 2020, 82, 105–112. [Google Scholar] [CrossRef]
  13. Bassyouni, M.; Mansi, A.E.; Elgabry, A.; Ibrahim, B.A.; Kassem, O.A.; Alhebeshy, R. Utilization of carbon nanotubes in removal of heavy metals from wastewater: A review of the CNTs’ potential and current challenges. Appl. Phys. A 2019, 126, 38. [Google Scholar] [CrossRef]
  14. Eteba, A.; Bassyouni, M.; Saleh, M. Removal of Hazardous Organic Pollutants Using Fly Ash. Environ. Ecol. Res. 2021, 9, 196–203. [Google Scholar] [CrossRef]
  15. Qiao, L.; Wang, S.; Wang, T.; Yu, S.; Guo, S.; Du, K. High-strength and low-swelling chitosan/cellulose microspheres as a high-efficiency adsorbent for dye removal. Cellulose 2021, 28, 9323–9333. [Google Scholar] [CrossRef]
  16. Chatterjee, S.; Chatterjee, T.; Woo, S.H. Adsorption of Congo Red from Aqueous Solutions Using Chitosan Hydrogel Beads Formed by Various Anionic Surfactants. Sep. Sci. Technol. 2011, 46, 986–996. [Google Scholar] [CrossRef]
  17. Staroń, P.; Chwastowski, J. Raphia-Microorganism Composite Biosorbent for Lead Ion Removal from Aqueous Solutions. Materials 2021, 14, 7482. [Google Scholar] [CrossRef]
  18. Staroń, P.; Płecka, A.; Chwastowski, J. Lead Sorption by Chrysanthemum indicum: Equilibrium, Kinetic, and Desorption Studies. Water Air Soil Pollut. 2021, 232, 1–14. [Google Scholar] [CrossRef]
  19. Staroń, P.; Sorys, P.; Chwastowski, J. Equilibrium and Kinetic Study of Ammonium Sorption by Raphia farinifera. Water Air Soil Pollut. 2019, 230, 243. [Google Scholar] [CrossRef] [Green Version]
  20. Ibrahim, N.A.; Abdellatif, F.H.; Hasanin, M.S.; Abdellatif, M.M. Fabrication, characterization, and potential application of modified sawdust sorbents for efficient removal of heavy metal ions and anionic dye from aqueous solutions. J. Clean. Prod. 2021, 332, 130021. [Google Scholar] [CrossRef]
  21. Mateo, S.; Peinado, S.; Morillas-Gutiérrez, F.; La Rubia, M.D.; Moya, A.J. Nanocellulose from Agricultural Wastes: Products and Applications—A Review. Processes 2021, 9, 1594. [Google Scholar] [CrossRef]
  22. Hashem, A.H.; Hasanin, M.; Kamel, S.; Dacrory, S. A new approach for antimicrobial and antiviral activities of biocompatible nanocomposite based on cellulose, amino acid and graphene oxide. Colloids Surfaces B Biointerfaces 2021, 209, 112172. [Google Scholar] [CrossRef] [PubMed]
  23. Youssef, A.; Hasanin, M.; El-Aziz, M.A.; Turky, G. Conducting chitosan/hydroxylethyl cellulose/polyaniline bionanocomposites hydrogel based on graphene oxide doped with Ag-NPs. Int. J. Biol. Macromol. 2020, 167, 1435–1444. [Google Scholar] [CrossRef] [PubMed]
  24. Hammad, A.A.; El-Aziz, M.A.; Hasanin, M.; Kamel, S. A novel electromagnetic biodegradable nanocomposite based on cellulose, polyaniline, and cobalt ferrite nanoparticles. Carbohydr. Polym. 2019, 216, 54–62. [Google Scholar] [CrossRef] [PubMed]
  25. Dacrory, S.; Hashem, A.H.; Hasanin, M. Synthesis of cellulose based amino acid functionalized nano-biocomplex: Characterization, antifungal activity, molecular docking and hemocompatibility. Environ. Nanotechnol. Monit. Manag. 2021, 15, 100453. [Google Scholar] [CrossRef]
  26. Abitbol, T.; Rivkin, A.; Cao, Y.; Nevo, Y.; Abraham, E.; Ben-Shalom, T.; Lapidot, S.; Shoseyov, O. Nanocellulose, a tiny fiber with huge applications. Curr. Opin. Biotechnol. 2016, 39, 76–88. [Google Scholar] [CrossRef] [PubMed]
  27. Morais, J.P.S.; Rosa, M.F.; Filho, M.M.S.; Nascimento, L.D.; Nascimento, D.M.; Cassales, A.R. Extraction and characterization of nanocellulose structures from raw cotton linter. Carbohydr. Polym. 2013, 91, 229–235. [Google Scholar] [CrossRef] [Green Version]
  28. Abdul Rahman, N.H.; Chieng, B.W.; Ibrahim, N.A.; Abdul Rahman, N. Extraction and characterization of cellulose nanocrystals from tea leaf waste fibers. Polymers 2017, 9, 588. [Google Scholar] [CrossRef] [Green Version]
  29. Iskandar, M.A.; Yahya, E.B.; Khalil, H.P.S.A.; Rahman, A.A.; Ismail, M.A. Recent Progress in Modification Strategies of Nanocellulose-Based Aerogels for Oil Absorption Application. Polymers 2022, 14, 849. [Google Scholar] [CrossRef]
  30. Beaumont, M.; Jahn, E.; Mautner, A.; Veigel, S.; Böhmdorfer, S.; Potthast, A.; Gindl-Altmutter, W.; Rosenau, T. Facile Preparation of Mechanically Robust and Functional Silica/Cellulose Nanofiber Gels Reinforced with Soluble Polysaccharides. Nanomaterials 2022, 12, 895. [Google Scholar] [CrossRef]
  31. Morcillo-Martín, R.; Espinosa, E.; Rabasco-Vílchez, L.; Sanchez, L.M.; de Haro, J.; Rodríguez, A. Cellulose Nanofiber-Based Aerogels from Wheat Straw: Influence of Surface Load and Lignin Content on Their Properties and Dye Removal Capacity. Biomolecules 2022, 12, 232. [Google Scholar] [CrossRef] [PubMed]
  32. Abdelraof, M.; El Saied, H.; Hasanin, M.S. Green Immobilization of Glucanobacter xylinum onto Natural Polymers to Sustainable Bacterial Cellulose Production. Waste Biomass-Valorization 2022, 13, 2053–2069. [Google Scholar] [CrossRef]
  33. Ouellette, R.J.; Rawn, J.D. Organic Chemistry: Structure, Mechanism, Synthesis; Academic Press: Cambridge, MA, USA, 2018. [Google Scholar]
  34. Nia, M.H.; Tavakolian, M.; Kiasat, A.R.; van de Ven, T.G. Hybrid Aerogel Nanocomposite of Dendritic Colloidal Silica and Hairy Nanocellulose: An Effective Dye Adsorbent. Langmuir 2020, 36, 11963–11974. [Google Scholar] [CrossRef] [PubMed]
  35. Mok, C.F.; Ching, Y.C.; Abu Osman, N.A.; Muhamad, F.; Hai, N.D.; Choo, J.H.; Hassan, C.R. Adsorbents for removal of cationic dye: Nanocellulose reinforced biopolymer composites. J. Polym. Res. 2020, 27, 1–15. [Google Scholar] [CrossRef]
  36. Vivod, V.; Neral, B.; Mihelič, A.; Kokol, V. Highly efficient film-like nanocellulose-based adsorbents for the removal of loose reactive dye during textile laundering. Text. Res. J. 2018, 89, 975–988. [Google Scholar] [CrossRef]
  37. Putro, J.N.; Santoso, S.P.; Soetaredjo, F.E.; Ismadji, S.; Ju, Y.-H. Nanocrystalline cellulose from waste paper: Adsorbent for azo dyes removal. Environ. Nanotechnol. Monit. Manag. 2019, 12, 100260. [Google Scholar] [CrossRef]
  38. Jamshaid, A.; Hamid, A.; Muhammad, N.; Naseer, A.; Ghauri, M.; Iqbal, J.; Shah, N.S. Cellulose-based Materials for the Removal of Heavy Metals from Wastewater–An Overview. ChemBioEng Rev. 2017, 4, 240–256. [Google Scholar] [CrossRef]
  39. Marotta, A.; Luzzi, E.; Salzano de Luna, M.; Aprea, P.; Ambrogi, V.; Filippone, G. Chitosan/Zeolite Composite Aerogels for a Fast and Effective Removal of Both Anionic and Cationic Dyes from Water. Polymers 2021, 13, 1691. [Google Scholar] [CrossRef]
  40. Lopez-Barbosa, N.; Campaña, A.L.; Cruz, J.C.; Ornelas-Soto, N.; Osma, J.F. Enhanced Catalytic Dye Decolorization by Microencapsulation of Laccase from P. Sanguineus CS43 in Natural and Synthetic Polymers. Polymers 2020, 12, 1353. [Google Scholar] [CrossRef]
  41. Chiu, C.-W.; Wu, M.-T.; Lee, J.C.-M.; Cheng, T.-Y. Isothermal Adsorption Properties for the Adsorption and Removal of Reactive Blue 221 Dye from Aqueous Solutions by Cross-Linked β-Chitosan Glycan as Acid-Resistant Adsorbent. Polymers 2018, 10, 1328. [Google Scholar] [CrossRef] [Green Version]
  42. Sayyouh, M.H.; Al-Blehed, M.S.; Attia, A.M. The effect of alkaline and polymer additives on phase behaviour of surfactant-oil-brine system at high salinity conditions. Rev. De L’institut Français Du Pétrole 1993, 48, 359–369. [Google Scholar] [CrossRef]
  43. Hidayat, E.; Harada, H.; Mitoma, Y.; Yonemura, S.; A Halem, H.I. Rapid Removal of Acid Red 88 by Zeolite/Chitosan Hydrogel in Aqueous Solution. Polymers 2022, 14, 893. [Google Scholar] [CrossRef] [PubMed]
  44. Kyzas, G.Z.; Bikiaris, D.N.; Mitropoulos, A. Chitosan adsorbents for dye removal: A review. Polym. Int. 2017, 66, 1800–1811. [Google Scholar] [CrossRef]
  45. Sakkayawong, N.; Thiravetyan, P.; Nakbanpote, W. Adsorption mechanism of synthetic reactive dye wastewater by chitosan. J. Colloid Interface Sci. 2005, 286, 36–42. [Google Scholar] [CrossRef] [PubMed]
  46. Pang, Y.L.; Tan, J.H.; Lim, S.; Chong, W.C. A State-of-the-Art Review on Biowaste Derived Chitosan Biomaterials for Biosorption of Organic Dyes: Parameter Studies, Kinetics, Isotherms and Thermodynamics. Polymers 2021, 13, 3009. [Google Scholar] [CrossRef] [PubMed]
  47. Alsamman, M.T.; Sánchez, J. Chitosan- and Alginate-Based Hydrogels for the Adsorption of Anionic and Cationic Dyes from Water. Polymers 2022, 14, 1498. [Google Scholar] [CrossRef]
  48. Sánchez-Duarte, R.G.; López-Cervantes, J.; Sánchez-Machado, D.I.; Correa-Murrieta, M.A.; Núñez-Gastélum, J.A.; Rodríguez-Núñez, J.R. Chitosan-based adsorbents gels for the removal of tris-azo dye: Isotherms and kinetics studies. Environ. Eng. Manag. J. 2016, 15, 2469–2478. [Google Scholar]
  49. Pal, P.; Pal, A. Dye removal using waste beads: Efficient utilization of surface-modified chitosan beads generated after lead adsorption process. J. Water Process Eng. 2019, 31, 100882. [Google Scholar] [CrossRef]
  50. Abd-Elmageed, A.A.I.; Ibrahim, S.M.; Bourezgui, A.; Al-Hossainy, A.F. Synthesis, DFT studies, fabrication, and optical characterization of the [ZnCMC] TF polymer (organic/inorganic) as an optoelectronic device. New J. Chem. 2020, 44, 8621–8637. [Google Scholar] [CrossRef]
  51. Arletti, R.; Quartieri, S.; Vezzalini, G. Elastic behavior of zeolite boggsite in silicon oil and aqueous medium: A case of high-pressure-induced over-hydration. Am. Miner. 2010, 95, 1247–1256. [Google Scholar] [CrossRef]
  52. Santmartí, A.; Lee, K.-Y. Crystallinity and Thermal Stability of Nanocellulose. In Nanocellulose and Sustainability: Production, Properties, Applications, and Case Studies; CRC Press: Boca Raton, FL, USA, 2018; pp. 67–86. [Google Scholar] [CrossRef]
  53. Jin, L.; Sun, Q.; Xu, Q.; Xu, Y. Adsorptive removal of anionic dyes from aqueous solutions using microgel based on nanocellulose and polyvinylamine. Bioresour. Technol. 2015, 197, 348–355. [Google Scholar] [CrossRef] [PubMed]
  54. Yang, H.; Yan, R.; Chen, H.; Lee, D.H.; Zheng, C. Characteristics of hemicellulose, cellulose and lignin pyrolysis. Fuel 2007, 86, 1781–1788. [Google Scholar] [CrossRef]
  55. Rebouillat, S.; Pla, F. State of the Art Manufacturing and Engineering of Nanocellulose: A Review of Available Data and Industrial Applications. J. Biomater. Nanobiotechnol. 2013, 4, 165–188. [Google Scholar] [CrossRef] [Green Version]
  56. Movaghgharnezhad, S.; Mirabi, A.; Toosi, M.R.; Rad, A.S. Synthesis of cellulose nanofibers functionalized by dithiooxamide for preconcentration and determination of trace amounts of Cd(II) ions in water samples. Cellulose 2020, 27, 8885–8898. [Google Scholar] [CrossRef]
  57. Evdokimova, O.L.; Evdokimova, A.V.; Kusova, T.V.; Agafonov, A.V. Preparation of hybrid nanocomposites based on nanoscale cellulose and magnetic nanoparticles with photocatalytic properties. Inorg. Mater. Appl. Res. 2020, 11, 371–376. [Google Scholar] [CrossRef]
  58. Tavakolian, M.; Wiebe, H.; Sadeghi, M.A.; Van De Ven, T.G. Dye Removal Using Hairy Nanocellulose: Experimental and Theoretical Investigations. ACS Appl. Mater. Interfaces 2019, 12, 5040–5049. [Google Scholar] [CrossRef]
  59. Li, M.; Wang, Z.; Li, B. Adsorption behaviour of congo red by cellulose/chitosan hydrogel beads regenerated from ionic liquid. Desalination Water Treat. 2016, 57, 16970–16980. [Google Scholar] [CrossRef]
  60. Wang, Y.; Zhao, L.; Peng, H.; Wu, J.; Liu, Z.; Guo, X. Removal of Anionic Dyes from Aqueous Solutions by Cellulose-Based Adsorbents: Equilibrium, Kinetics, and Thermodynamics. J. Chem. Eng. Data 2016, 61, 3266–3276. [Google Scholar] [CrossRef]
  61. Khalil, H.A.; Yusra, A.I.; Bhat, A.H.; Jawaid, M. Cell wall ultrastructure, anatomy, lignin distribution, and chemical composition of Malaysian cultivated kenaf fiber. Ind. Crops Prod. 2010, 31, 113–121. [Google Scholar] [CrossRef]
  62. Fernandes Queiroz, M.; Melo, K.R.T.; Sabry, D.A.; Sassaki, G.L.; Rocha, H.A.O. Does the Use of Chitosan Contribute to Oxalate Kidney Stone Formation? Mar. Drugs 2014, 13, 141–158. [Google Scholar] [CrossRef]
  63. Chen, Y.W.; Lee, H.V.; Hamid, S.B.A. Preparation of Nanostructured Cellulose via Cr(III)- and Mn(II)-Transition Metal Salt Catalyzed Acid Hydrolysis Approach. BioResources 2016, 11, 7224–7241. [Google Scholar] [CrossRef] [Green Version]
  64. Lamaming, J.; Hashim, R.; Leh, C.P.; Sulaiman, O.; Sugimoto, T.; Nasir, M. Isolation and characterization of cellulose nanocrystals from parenchyma and vascular bundle of oil palm trunk (Elaeis guineensis). Carbohydr. Polym. 2015, 134, 534–540. [Google Scholar] [CrossRef] [PubMed]
  65. Morán, J.I.; Alvarez, V.A.; Cyras, V.P.; Vázquez, A. Cyras, Analia Va’zquez, extraction of cellulose and preparation of nanocellulose from sisal fibers. Cellulose 2008, 15, 149–159. [Google Scholar] [CrossRef]
  66. Mazlita, Y.; Lee, H.V.; Hamid, S.B.A. Hamid, Preparation of Cellulose Nanocrystals Bio-Polymer From Agro-Industrial Wastes: Separation and Characterization. Polym. Polym. Compos. 2016, 24, 719–728. [Google Scholar]
  67. Nasir, M.; Hashim, R.; Sulaiman, O.; Nordin, N.A.; Lamaming, J.; Asim, M. Laccase, an Emerging Tool to Fabricate Green Composites: A Review. BioResources 2015, 10, 6262–6284. [Google Scholar] [CrossRef] [Green Version]
  68. Abraham, E.; Deepa, B.; Pothan, L.A.; Jacob, M.; Thomas, S.; Cvelbar, U.; Anandjiwala, R. Extraction of nanocellulose fibrils from lignocellulosic fibres: A novel approach. Carbohydr. Polym. 2011, 86, 1468–1475. [Google Scholar] [CrossRef]
  69. Hussain, A.; Farooq, A.; Bassyouni, M.I.; Sait, H.H.; El-Wafa, M.A.; Hasan, S.W.; Ani, F.N. Pyrolysis of Saudi Arabian date palm waste: A viable option for converting waste into wealth. Life Sci. J. 2014, 11, 667–671. [Google Scholar] [CrossRef]
  70. Gutub, S.A.; Bassyouni, M. Dissolved solids adsorption of freshwater using synthesized bio-foam composite. Life Sci. J. 2013, 10, 464–471. [Google Scholar]
  71. Murcia-Salvador, A.; Pellicer, J.A.; Fortea, M.I.; Gómez-López, V.M.; Rodríguez-López, M.I.; Núñez-Delicado, E.; Gabaldón, J.A. Adsorption of Direct Blue 78 Using Chitosan and Cyclodextrins as Adsorbents. Polymers 2019, 11, 1003. [Google Scholar] [CrossRef] [Green Version]
Figure 1. Published papers related to utilization of chitosan and cellulose for dye removal. Obtained from ScienceDirect. Search words, respectively, were chitosan adsorption for dye removal and cellulose adsorption for dye removal.
Polymers 14 01852 g001
Figure 2. (a) Chemical structure of nanocellulose. (b) Chemical structure of chitosan. (c) Chemical structure of direct blue 78 dye.
Polymers 14 01852 g002
Figure 3. The preparation process for nanocellulose/chitosan beads (CCMB-0.25:1).
Polymers 14 01852 g003
Figure 4. Particle size distribution of nanocellulose.
Polymers 14 01852 g004
Figure 5. XRD pattern of cellulose sample.
Polymers 14 01852 g005
Figure 6. Thermal analysis TG and DrTGA for cellulose at 20–500 °C.
Polymers 14 01852 g006
Figure 7. SEM image with different magnification for nanocellulose/chitosan microbead (CCMB-0.25:1).
Polymers 14 01852 g007
Figure 8. FTIR analysis of cellulose and palm leaves.
Polymers 14 01852 g008
Figure 9. FTIR spectra for (a) pure and loaded chitosan, (b) pure and loaded nanocellulose, and (c) BD78 dye and CCMB-0.25:1 before and after adsorption process.
Polymers 14 01852 g009aPolymers 14 01852 g009b
Figure 10. Effect of chitosan concentration on DB78 dye removal efficiency (temperature of 22 °C, pH of 8.5, mixing speed of 150 r.p.m., and contact time of 45 min).
Polymers 14 01852 g010
Figure 11. Effect of nanocellulose concentration on DB78 dye removal efficiency (temperature of 22 °C, pH of 2, mixing speed of 150 r.p.m., and contact time of 30 min).
Polymers 14 01852 g011
Figure 12. Effect of CCMB-0.25:1 concentration on DB78 dye removal efficiency (temperature of 22 °C, pH of 3.5, mixing speed of 150 r.p.m., and contact time of 120 min).
Polymers 14 01852 g012
Figure 13. Effect of pH value on DB78 dye removal efficiency (temperature of 22 °C, pH of 1–10, and mixing speed of 150 r.p.m.).
Polymers 14 01852 g013
Figure 14. Zeta potential analysis of nanocellulose and nanocellulose/chitosan microbead (CCMB-0.25:1).
Polymers 14 01852 g014
Figure 15. Effect of mixing time on DB78 dye removal efficiency. Adsorbents are chitosan and nanocellulose; temperature, 22 °C; pH, 8.5–2; and mixing speed, 150 r.p.m.
Polymers 14 01852 g015
Figure 16. Effect of mixing time on DB78 dye removal efficiency. Adsorbent, CCMB-0.25:1; temperature of 22 °C; pH of 3; and mixing speed of 150 r.p.m.
Polymers 14 01852 g016
Figure 17. Effect of dye initial concentration on removal efficiency using different adsorbents: (a) chitosan, (b) nanocellulose, and (c) CCMB-0.25:1.
Polymers 14 01852 g017aPolymers 14 01852 g017b
Figure 18. Effect of nanocellulose concentration in microbeads on removal efficiency.
Polymers 14 01852 g018
Figure 19. Adsorption isotherm for direct blue 78 dye removal using adsorbents (a) chitosan, (b) nanocellulose, and (c) CCMB-0.25:1.
Polymers 14 01852 g019aPolymers 14 01852 g019b
Figure 20. Freundlich adsorption isotherm for direct blue 78 dye removal using adsorbents (a) chitosan, (b) nanocellulose, and (c) CCMB-0.25:1.
Polymers 14 01852 g020aPolymers 14 01852 g020b
Figure 21. Langmuir adsorption isotherm for direct blue 78 dye removal using adsorbents (a) chitosan, (b) nanocellulose, and (c) CCMB-0.25:1.
Polymers 14 01852 g021aPolymers 14 01852 g021b
Figure 22. Adsorption kinetic studies: (a) pseudo first-order model and (b) pseudo second-order model.
Polymers 14 01852 g022
Figure 23. Effect of adsorbent type on dye removal efficiency.
Polymers 14 01852 g023
Figure 24. The adsorption process of DB78 dye by using adsorbents (chitosan, nanocellulose, and CCMB-0.25:1).
Polymers 14 01852 g024
Table 1. The computation data resulted from the application Refine Version 3.0 Software Program (Kurt Barthelme’s and Bob Downs) for [Indol-4Ap]TF.
Symmetry CompounddhklObservedCalculatedFWHMDav
2d2d
Parameters15.4535.729611115.3315.88201.3 × 10−55.729683.04
a = 15.96 Å; b = 7.85 Å; c = 10.87 Å20.3324.425305120.3324.42504 × 10−61.7565270.86
α = γ = 90, β = 97.931°22.6553.920102022.6353.974003.9201121.37
V = 1400 (22), rmse (a) = 1.05 × 10−334.5752.592023 2 ¯ 34.5752.6130−1 × 10−62.5920183.56
Machine error = −0.48
Average 3.5995164.71
(a) Root mean square error.
Table 2. Optimal adsorbent concentrations for direct blue 78 dye removal.
AdsorbentInitial Concentration 50 mg/LInitial Concentration 100 mg/L
Dose (g/L)Loading (mg/g)Removal %Dose (g/L)Loading (mg/g)Removal %
Chitosan315.794.2518.7793.85
Nanocellulose148.396.6246.6935
CCMB-0.25:195.0891.52145.988.4
Table 3. Comparison of adsorption isothermal models for adsorbents (chitosan, nanocellulose, and CCMB-0.25:1).
AdsorbentDB78 Dye Initial Concentration (mg/L)Langmuir IsothermalFreundlich IsothermalFollowed
Q0 (mg/g)b (L/mg)R2Kf (mg/g)1/nR2
Chitosan5073.50.1070.85148.020.670.9914Freundlich
100384.60.00740.16583.650.880.9406Freundlich
Nanocellulose50175.40.160.986730.60.470.9843Langmuir
1004000.0180.98813.490.670.9959Freundlich
CCMB-0.25:15015.311.03060.98672.180.510.9428Langmuir
10017.790.04040.99432.120.430.9841Langmuir
Table 4. Kinetic models parameters.
Kinetic Model ParametersPseudo First-Order ModelPseudo Second-Order Model
K1 (1/min)qe (mg/g)R2K2 (g/mg min)qe (mg/g)R2
CCMB-0.25:10.038512.80.9070.000313.20.689
Nanocellulose0.15942920.88070.0015990.9947
Chitosan0.086720.90.9672.80717.270.9824
Publisher’s Note: MDPI stays neutral with regard to jurisdictional claims in published maps and institutional affiliations.

