
The Effect of Agglomeration on the Electrical and Mechanical Properties of Polymer Matrix Nanocomposites Reinforced with Carbon Nanotubes


Abstract
:1. Introduction
2. Materials and Methods
2.1. Materials and Samples Preparation
2.2. Experimental Procedure
2.3. Numerical Procedure
2.4. Digimat FE Modelling
2.5. MATLAB Modelling
3. Results and Discussion
3.1. Mechanical Properties
3.2. Electrical Properties
4. Conclusions
Author Contributions
Funding
Institutional Review Board Statement
Informed Consent Statement
Data Availability Statement
Conflicts of Interest
References
- Tamayo-Vegas, S.; Muhsan, A.; Tarfaoui, M.; Lafdi, K.; Chang, L. Effect of CNT additives on the electrical properties of derived nanocomposites (experimentally and numerical investigation). Mater. Today Proc. 2021, 52, 3–9. [Google Scholar] [CrossRef]
- Tarfaoui, M.; Lafdi, K.; El Moumen, A. Mechanical properties of carbon nanotubes based polymer composites. Compos. Part B Eng. 2016, 103, 113–121. [Google Scholar] [CrossRef]
- Tamayo-Vegas, S.; Lafdi, K. Experimental and modelling of temperature-dependent mechanical properties of CNT/polymer nanocomposites. Mater. Today Proc. 2022, 57, 607–614. [Google Scholar] [CrossRef]
- Maghsoudlou, M.A.; Barbaz Isfahani, R.; Saber-Samandari, S.; Sadighi, M. Effect of interphase, curvature and agglomeration of SWCNTs on mechanical properties of polymer-based nanocomposites: Experimental and numerical investigations. Compos. Part B Eng. 2019, 175, 107119. [Google Scholar] [CrossRef]
- Alian, A.R.; El-Borgi, S.; Meguid, S.A. Multiscale modeling of the effect of waviness and agglomeration of CNTs on the elastic properties of nanocomposites. Comput. Mater. Sci. 2016, 117, 195–204. [Google Scholar] [CrossRef]
- Gong, S.; Zhu, Z.H.; Meguid, S.A. Carbon nanotube agglomeration effect on piezoresistivity of polymer nanocomposites. Polymer 2014, 55, 5488–5499. [Google Scholar] [CrossRef]
- Manta, A.; Tserpes, K.I. Numerical computation of electrical conductivity of carbon nanotube-filled polymers. Compos. Part B Eng. 2016, 100, 240–246. [Google Scholar] [CrossRef]
- Bao, W.S.; Meguid, S.A.; Zhu, Z.H.; Pan, Y.; Weng, G.J. A novel approach to predict the electrical conductivity of multifunctional nanocomposites. Mech. Mater. 2012, 46, 129–138. [Google Scholar] [CrossRef]
- Nilsson, F.; Krückel, J.; Schubert, D.W.; Chen, F.; Unge, M.; Gedde, U.W.; Hedenqvist, M.S. Simulating the effective electric conductivity of polymer composites with high aspect ratio fillers. Compos. Sci. Technol. 2016, 132, 16–23. [Google Scholar] [CrossRef]
- Bao, W.S.; Meguid, S.A.; Zhu, Z.H.; Meguid, M.J. Modeling electrical conductivities of nanocomposites with aligned carbon nanotubes. Nanotechnology 2011, 22, 485704. [Google Scholar] [CrossRef]
- Zeng, X.; Xu, X.; Shenai, P.M.; Kovalev, E.; Baudot, C.; Mathews, N.; Zhao, Y. Characteristics of the electrical percolation in carbon nanotubes/polymer nanocomposites. J. Phys. Chem. C 2011, 115, 21685–21690. [Google Scholar] [CrossRef]
- Bauhofer, W.; Kovacs, J.Z. A review and analysis of electrical percolation in carbon nanotube polymer composites. Compos. Sci. Technol. 2009, 69, 1486–1498. [Google Scholar] [CrossRef]
- Hu, N.; Masuda, Z.; Yan, C.; Yamamoto, G.; Fukunaga, H.; Hashida, T. The electrical properties of polymer nanocomposites with carbon nanotube fillers. Nanotechnology 2008, 19, 215701. [Google Scholar] [CrossRef] [PubMed] [Green Version]
- Hu, N.; Karube, Y.; Yan, C.; Masuda, Z.; Fukunaga, H. Tunneling effect in a polymer/carbon nanotube nanocomposite strain sensor. Acta Mater. 2008, 56, 2929–2936. [Google Scholar] [CrossRef] [Green Version]
- Kirkpatrick, S. Percolation and Conduction. Rev. Mod. Phys. 1973, 45, 574–588. [Google Scholar] [CrossRef]
- Kirkpatrick, S. Classical Transport in Disordered Media: Scaling and Effective-Medium Theories. Phys. Rev. Lett. 1971, 27, 1722. [Google Scholar] [CrossRef]
- Mohiuddin, M.; Hoa, S.V. Estimation of contact resistance and its effect on electrical conductivity of CNT/PEEK composites. Compos. Sci. Technol. 2013, 79, 42–48. [Google Scholar] [CrossRef]
- Ounaies, Z.; Park, C.; Wise, K.E.; Siochi, E.J.; Harrison, J.S. Electrical properties of single wall carbon nanotube reinforced polyimide composites. Compos. Sci. Technol. 2003, 63, 1637–1646. [Google Scholar] [CrossRef]
- Meguid, S.A.; Weng, G.J. Micromechanics and Nanomechanics of Composite Solids; Springer: New York, NY, USA, 2017. [Google Scholar]
- Simoes, R.; Silva, J.; Vaia, R.; Sencadas, V.; Costa, P.; Gomes, J.; Lanceros-Méndez, S. Low percolation transitions in carbon nanotube networks dispersed in a polymer matrix: Dielectric properties, simulations and experiments. Nanotechnology 2009, 20, 035703. [Google Scholar] [CrossRef]
- Chanteli, A.; Tserpes, K.I. Finite element modeling of carbon nanotube agglomerates in polymers. Compos. Struct. 2015, 132, 1141–1148. [Google Scholar] [CrossRef]
- Taherian, R. Experimental and analytical model for the electrical conductivity of polymer-based nanocomposites. Compos. Sci. Technol. 2016, 123, 17–31. [Google Scholar] [CrossRef]
- Govorov, A.; Wentzel, D.; Miller, S.; Kanaan, A.; Sevostianov, I. Electrical conductivity of epoxy-graphene and epoxy-carbon nanofibers composites subjected to compressive loading. Int. J. Eng. Sci. 2018, 123, 174–180. [Google Scholar] [CrossRef]
- Karevan, M.; Pucha, R.V.; Bhuiyan, M.A.; Kalaitzidou, K. Effect of Interphase Modulus and Nanofiller Agglomeration on the Tensile Modulus of Graphite Nanoplatelets and Carbon Nanotube Reinforced Polypropylene Nanocomposites. Carbon Lett. 2010, 11, 325–331. [Google Scholar] [CrossRef] [Green Version]
- Shi, D.L.; Feng, X.Q.; Huang, Y.Y.; Hwang, K.C.; Gao, H. The effect of nanotube waviness and agglomeration on the elastic property of carbon nanotube-reinforced composites. J. Eng. Mater. Technol. Trans. ASME 2004, 126, 250–257. [Google Scholar] [CrossRef]
- Romanov, V.S.; Lomov, S.V.; Verpoest, I.; Gorbatikh, L. Stress magnification due to carbon nanotube agglomeration in composites. Compos. Struct. 2015, 133, 246–256. [Google Scholar] [CrossRef]
- Loos, M. Carbon Nanotube Reinforced Composites, 1st ed.; William Andrew: Oxford, UK, 2015; Volume 3, ISBN 9781455778980. [Google Scholar]
- Atlukhanova, L.B.; Kozlov, G.V. A carbon nanotubes aggregation in polymer nanocomposites. Mater. Sci. Forum 2018, 935, 55–60. [Google Scholar] [CrossRef]
- Hosseinpour, K.; Ghasemi, A.R. Agglomeration and aspect ratio effects on the long-term creep of carbon nanotubes/fiber/polymer composite cylindrical shells. J. Sandw. Struct. Mater. 2021, 23, 1272–1291. [Google Scholar] [CrossRef]
- Chen, X.; Alian, A.R.; Meguid, S.A. Modeling of CNT-reinforced nanocomposite with complex morphologies using modified embedded finite element technique. Compos. Struct. 2019, 227, 111329. [Google Scholar] [CrossRef]
- Golbang, A.; Famili, M.H.N.; Shirvan, M.M.M. A method for quantitative characterization of agglomeration degree in nanocomposites. Compos. Sci. Technol. 2017, 145, 181–186. [Google Scholar] [CrossRef]
- Yang, Q.S.; He, X.Q.; Liu, X.; Leng, F.F.; Mai, Y.W. The effective properties and local aggregation effect of CNT/SMP composites. Compos. Part B Eng. 2012, 43, 33–38. [Google Scholar] [CrossRef]
- Pan, J.; Bian, L. Influence of agglomeration parameters on carbon nanotube composites. Acta Mech. 2017, 228, 2207–2217. [Google Scholar] [CrossRef]
- Yellampalli, S. (Ed.) Functionalization of Carbon Nanotubes; IntechOpen: London, UK, 2011. [Google Scholar]
- Hirsch, A. Functionalization of Single-Walled Carbon Nanotubes. Angew. Chemie-Int. Ed. 2002, 41, 1853–1859. [Google Scholar] [CrossRef]
- Khare, K.S.; Khabaz, F.; Khare, R. Effect of carbon nanotube functionalization on mechanical and thermal properties of cross-linked epoxy-carbon nanotube nanocomposites: Role of strengthening the interfacial interactions. ACS Appl. Mater. Interfaces 2014, 6, 6098–6110. [Google Scholar] [CrossRef] [PubMed]
- Rahmat, M.; Hubert, P. Carbon nanotube-polymer interactions in nanocomposites: A review. Compos. Sci. Technol. 2011, 72, 72–84. [Google Scholar] [CrossRef]
- Goyal, R.K. Nanomaterials and Nanocomposites: Synthesis, Properties, Characterization Techniques, and Applications; CRC Press: Boca Raton, FL, USA, 2017; ISBN 9781498761673. [Google Scholar]
- Jarali, C.S.; Basavaraddi, S.R.; Kiefer, B.; Pilli, S.C.; Lu, Y.C. Modeling of the effective elastic properties of multifunctional carbon nanocomposites due to agglomeration of straight circular carbon nanotubes in a polymer matrix. J. Appl. Mech. Trans. ASME 2014, 81, 021010. [Google Scholar] [CrossRef]
- Zare, Y.; Rhee, K.Y. The mechanical behavior of CNT reinforced nanocomposites assuming imperfect interfacial bonding between matrix and nanoparticles and percolation of interphase regions. Compos. Sci. Technol. 2017, 144, 18–25. [Google Scholar] [CrossRef]
- Ajayan, B.P.M.; Schadler, L.S.; Giannaris, C.; Rubio, A. Single-Walled Carbon Nanotube-Polymer Composites: Strength and Weakness. Adv. Mater. 2000, 12, 750–753. [Google Scholar] [CrossRef]
- Zare, Y.; Rhee, K.Y. A power model to predict the electrical conductivity of CNT reinforced nanocomposites by considering interphase, networks and tunneling condition. Compos. Part B Eng. 2018, 155, 11–18. [Google Scholar] [CrossRef]
- Zare, Y.; Rhee, K.Y.; Hui, D. Influences of nanoparticles aggregation/agglomeration on the interfacial/interphase and tensile properties of nanocomposites. Compos. Part B Eng. 2017, 122, 41–46. [Google Scholar] [CrossRef]
- Poorsolhjouy, A.; Naei, M.H. Effects of carbon nanotubes’ dispersion on effective mechanical properties of nanocomposites: A finite element study. J. Reinf. Plast. Compos. 2015, 34, 1315–1328. [Google Scholar] [CrossRef]
- Tornabene, F.; Fantuzzi, N.; Bacciocchi, M.; Viola, E. Effect of agglomeration on the natural frequencies of functionally graded carbon nanotube-reinforced laminated composite doubly-curved shells. Compos. Part B 2016, 89, 187–218. [Google Scholar] [CrossRef]
- Zare, Y. Study of nanoparticles aggregation/agglomeration in polymer particulate nanocomposites by mechanical properties. Compos. Part A Appl. Sci. Manuf. 2016, 84, 158–164. [Google Scholar] [CrossRef]
- Ward, B. A Numerical Resistor Network Model for the Determination of Electrical Properties of Nanocomposites. Master Dissertation, Rice University, Huston, TX, USA, 2011. [Google Scholar]
- Fang, W.; Jang, H.W.; Leung, S.N. Evaluation and modelling of electrically conductive polymer nanocomposites with carbon nanotube networks. Compos. Part B Eng. 2015, 83, 184–193. [Google Scholar] [CrossRef]
- Halpin, J.; Kardos, J. The Halpin-Tsai equations: A review. Polym. Eng. Sci. 1976, 16, 344–352. [Google Scholar] [CrossRef]
- Ayatollahi, M.R.; Shadlou, S.; Shokrieh, M.M.; Chitsazzadeh, M. Effect of multi-walled carbon nanotube aspect ratio on mechanical and electrical properties of epoxy-based nanocomposites. Polym. Test. 2011, 30, 548–556. [Google Scholar] [CrossRef]
- Silva, J.; Lanceros-Mendez, S.; Simoes, R. Effect of cylindrical filler aggregation on the electrical conductivity of composites. Phys. Lett. Sect. A Gen. At. Solid State Phys. 2014, 378, 2985–2988. [Google Scholar] [CrossRef]
- Kovacs, J.Z.; Velagala, B.S.; Schulte, K.; Bauhofer, W. Two percolation thresholds in carbon nanotube epoxy composites. Compos. Sci. Technol. 2007, 67, 922–928. [Google Scholar] [CrossRef] [Green Version]
- Sandler, J.; Shaffer, M.S.P.; Prasse, T.; Bauhofer, W.; Schulte, K.; Windle, A.H. Development of a dispersion process for carbon nanotubes in an epoxy matrix and the resulting electrical properties. Polymer 1999, 40, 5967–5971. [Google Scholar] [CrossRef]
- Sandler, J.K.W.; Kirk, J.E.; Kinloch, I.A.; Shaffer, M.S.P.; Windle, A.H. Ultra-low electrical percolation threshold in carbon-nanotube-epoxy composites. Polymer 2003, 44, 5893–5899. [Google Scholar] [CrossRef]
- Kilbride, B.E.; Coleman, J.N.; Fraysse, J.; Fournet, P.; Cadek, M.; Drury, A.; Hutzler, S.; Roth, S.; Blau, W.J. Experimental observation of scaling laws for alternating current and direct current conductivity in polymer-carbon nanotube composite thin films. J. Appl. Phys. 2002, 92, 4024–4030. [Google Scholar] [CrossRef]
- Celzard, A.; McRae, E.; Deleuze, C.; Dufort, M. Critical concentration in percolating systems containing a high-aspect-ratio filler. Phys. Rev. B-Condens. Matter Mater. Phys. 1996, 53, 6209–6214. [Google Scholar] [CrossRef] [PubMed]
- Munson-Mcgee, S.H. Estimation of the critical concentration in an anisotropic percolation network. Phys. Rev. B 1991, 43, 3331–3336. [Google Scholar] [CrossRef] [PubMed]


| Properties | Epoxy | MWCNT |
|---|---|---|
| Density (g/cm3) | 1.21 | 2.1 |
| Young’s modulus (MPa) | 1650 | 500,000 |
| Poisson’s ratio | 0.3 | 0.261 |
| Electrical conductivity (S/cm) | 2.1 × 10⁻⁷ | 5 × 101–5 × 10⁵ |
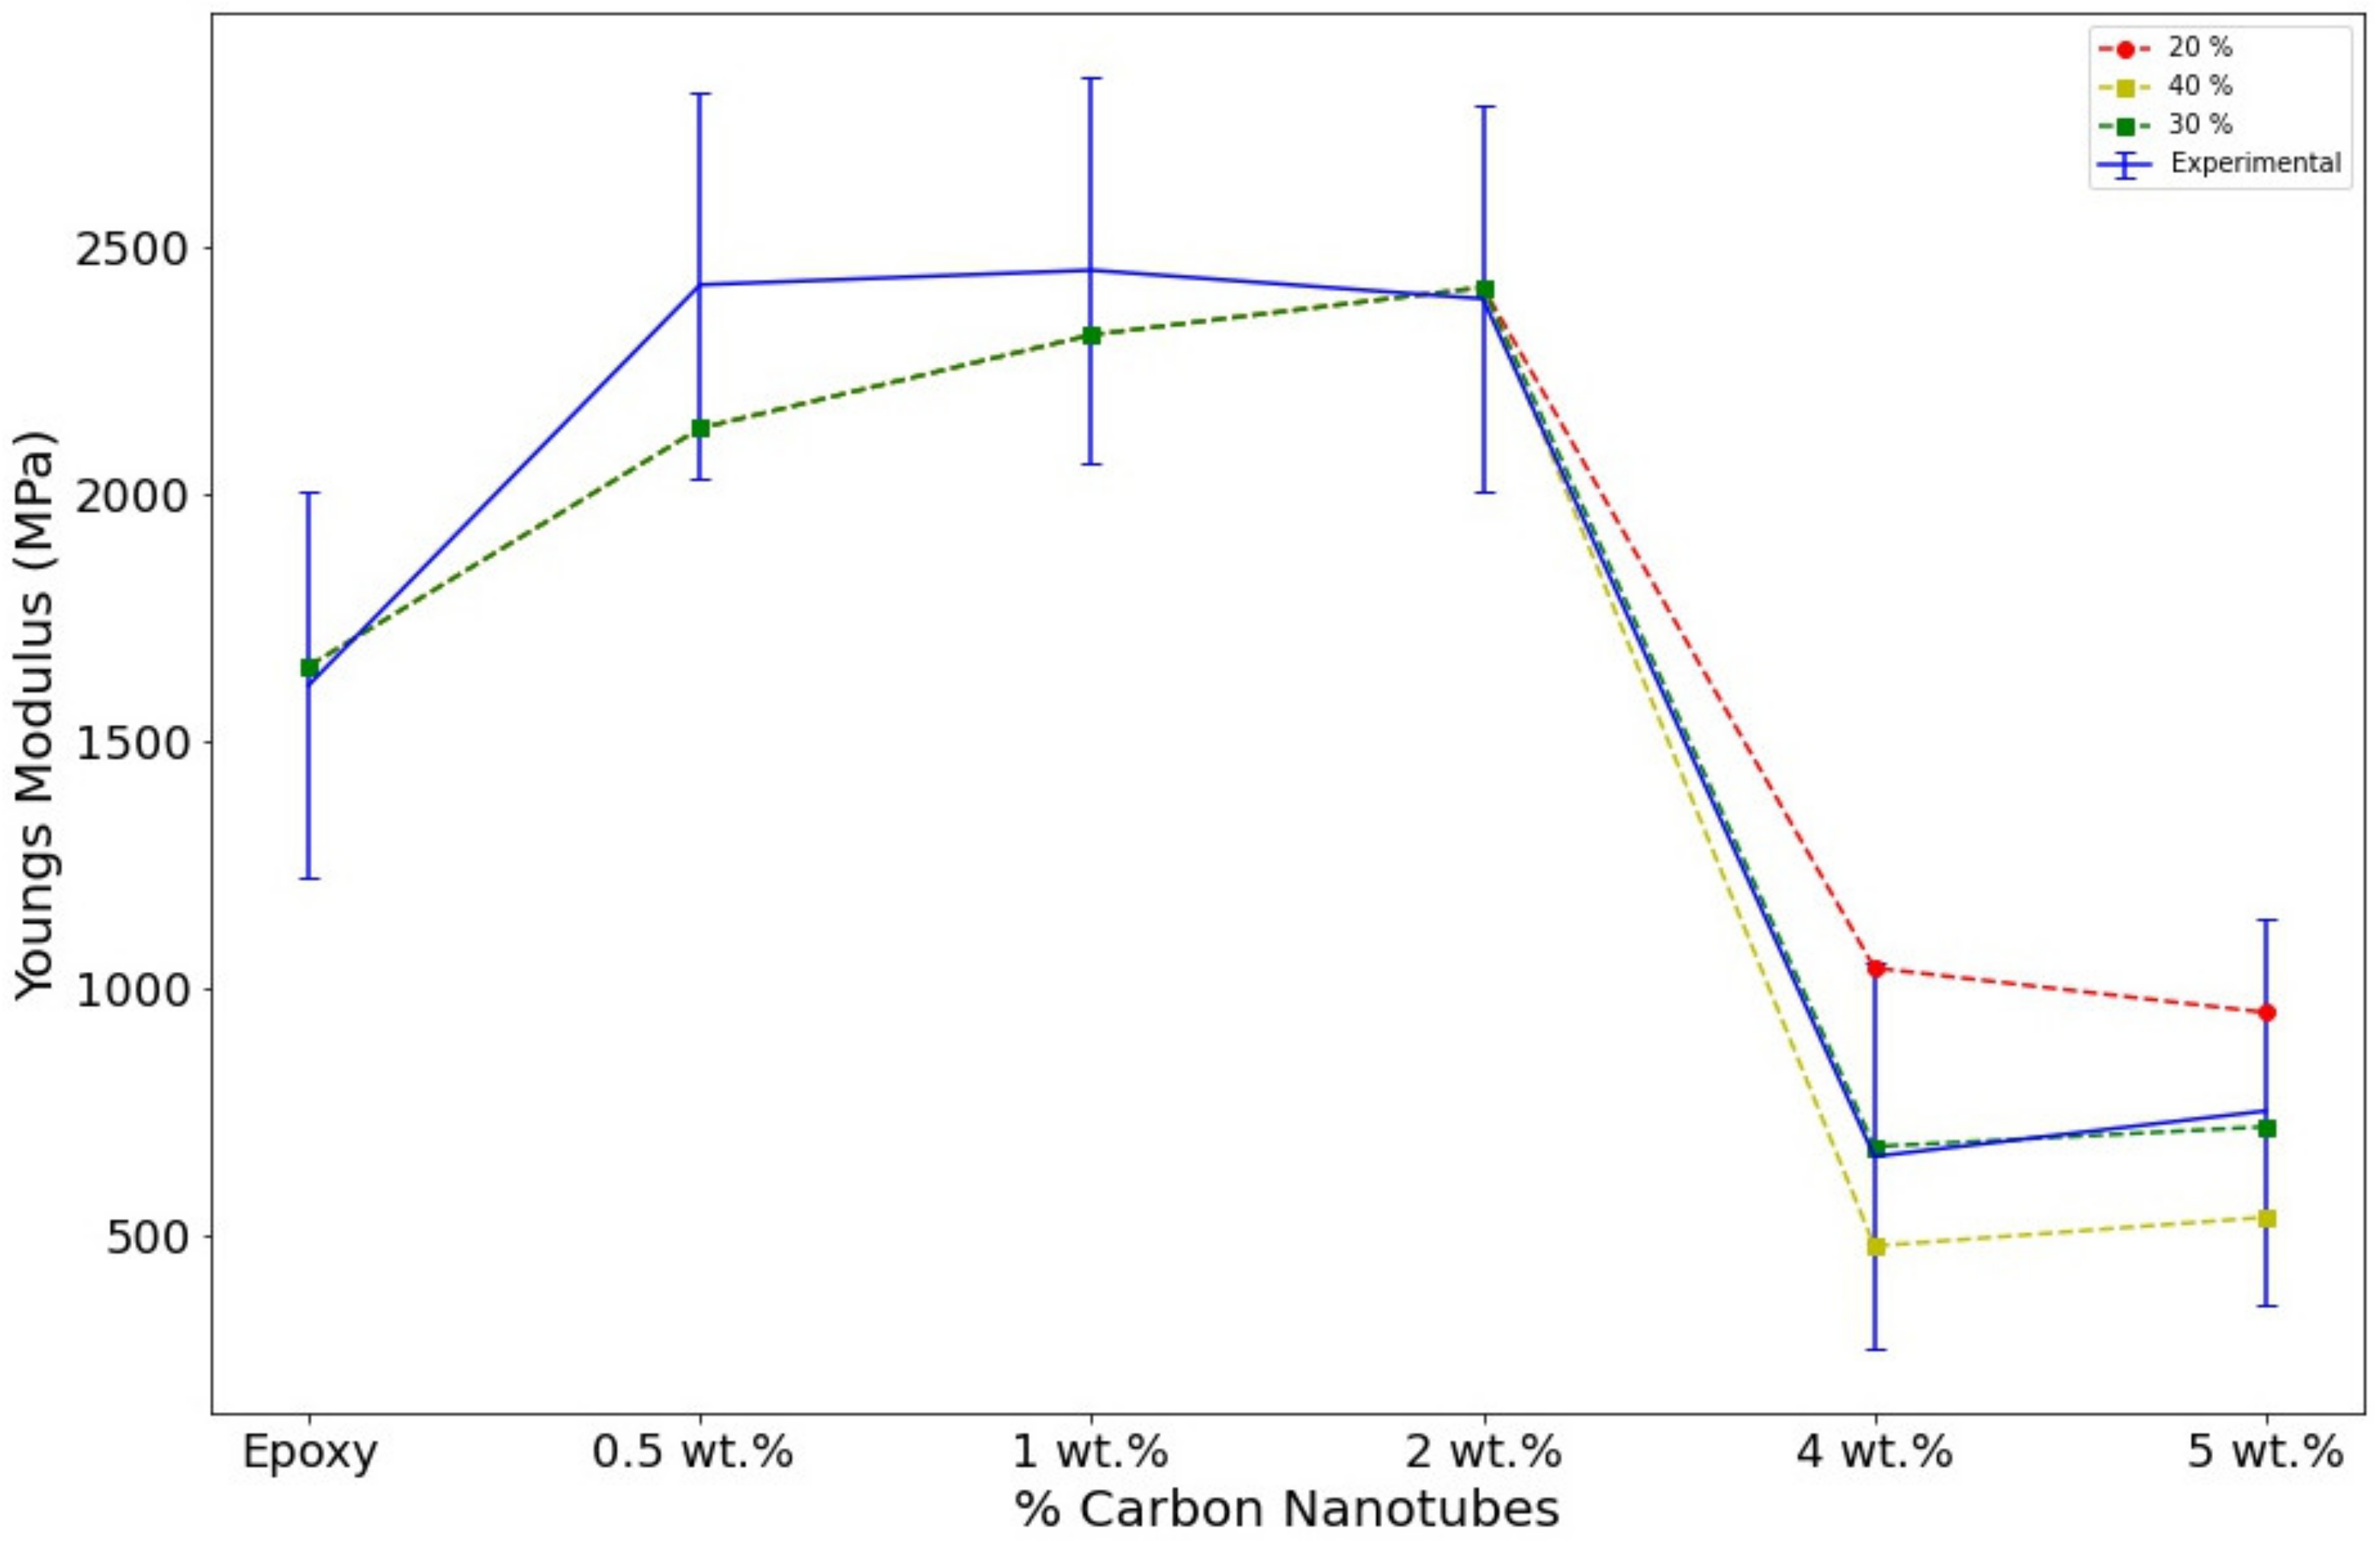
| Samples | Experimental | FEA | 20% | 30% | 40% |
|---|---|---|---|---|---|
| 0 wt.% | 1611 | 1611 | - | - | - |
| 0.5 wt.% | 2420 | 2131 | - | - | - |
| 1 wt.% | 2450 | 2320 | - | - | - |
| 2 wt.% | 2392 | 2416 | - | - | - |
| 4 wt.% | 659 | 679 | 1040 | 679 | 478 |
| 5 wt.% | 751 | 719 | 950 | 719 | 536 |
| Samples | D1 = 0.3 (%) | D2 = 0.4 (%) | D3 = 0.5 (%) |
|---|---|---|---|
| 0 wt.% | 0 | 0 | 0 |
| 0.5 wt.% | 8 | 10 | 10 |
| 1 wt.% | 12 | 18 | 26 |
| 2 wt.% | 47.27 | 98 | 98 |
| 4 wt.% | 96 | 100 | 100 |
| 5 wt.% | 100 | 100 | 100 |
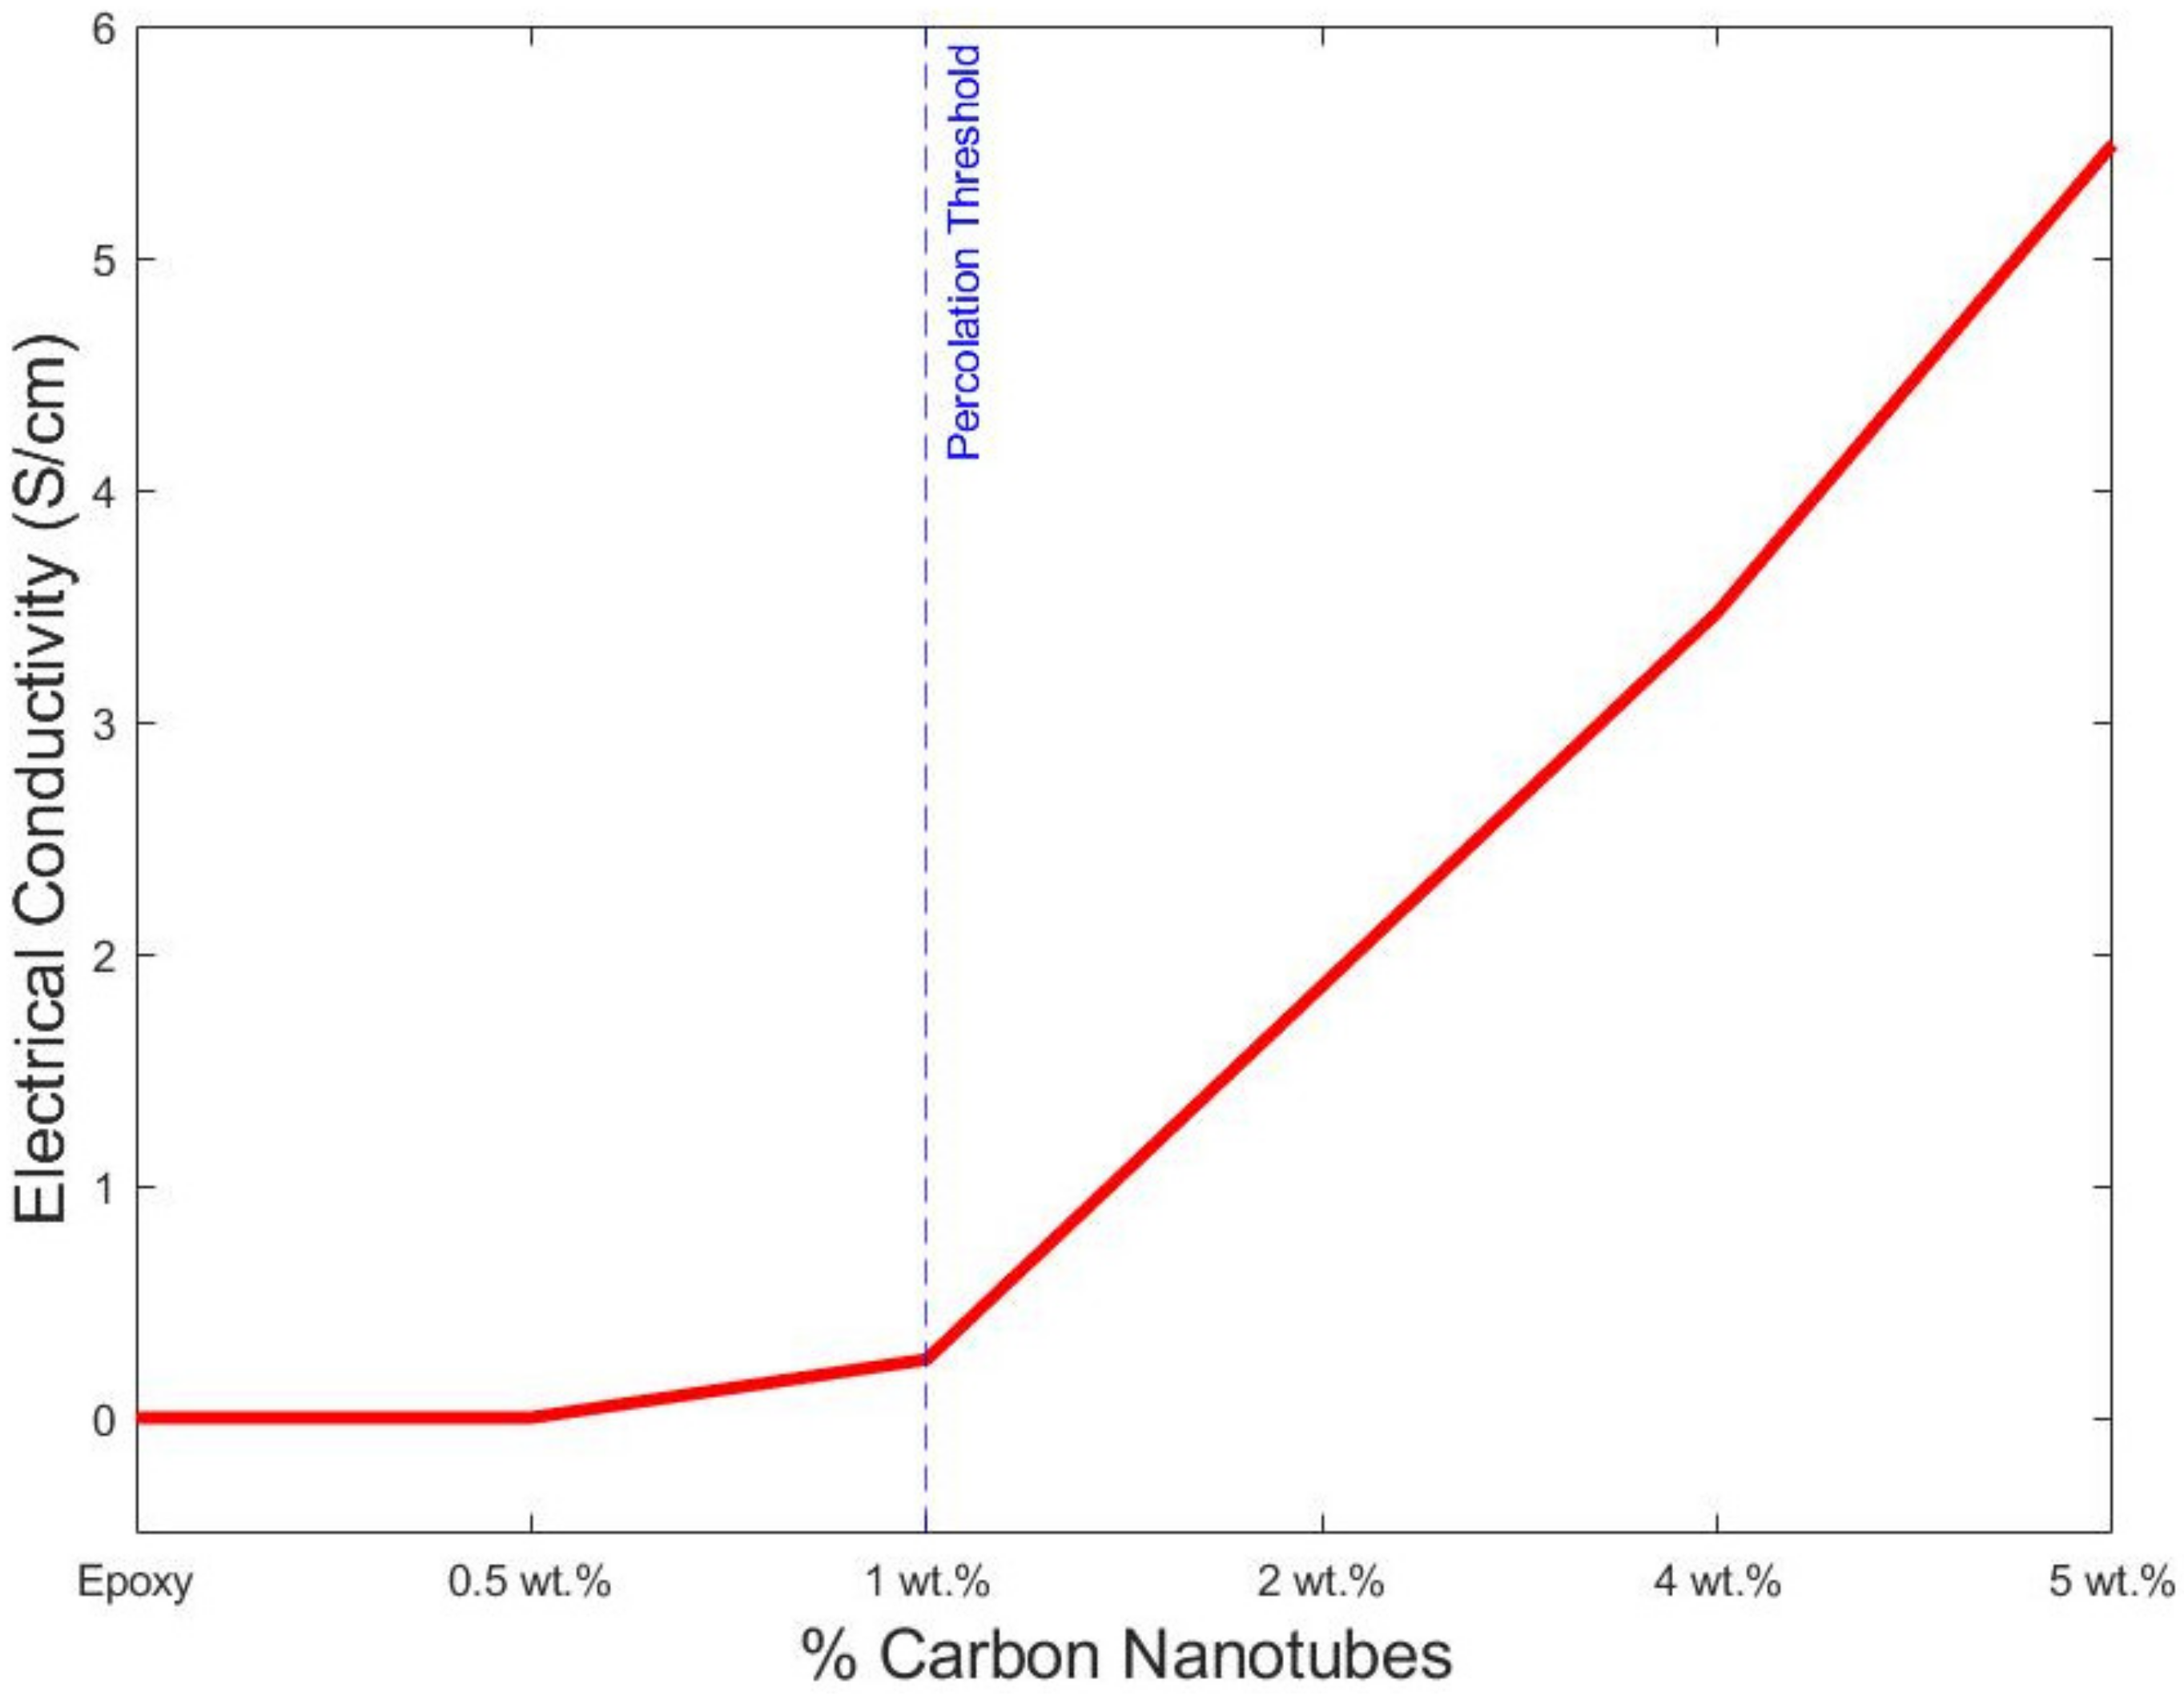
| Samples | Experimental | FEA | D1 = 0.3 | D2 = 0.4 | D3 = 0.5 |
|---|---|---|---|---|---|
| 0 wt.% | 2.123 × 10⁻⁷ | 2.123 × 10⁻⁷ | |||
| 0.5 wt.% | 2.123 × 10⁻⁵ | 2.15 × 10⁻⁷ | 4.9 × 10⁻² | 7.774 × 10⁻² | 1.68 × 10⁻¹ |
| 1 wt.% | 5.195 × 10⁻⁴ | 1.167 10−6 | 8.13 × 10⁻² | 2.361 × 10⁻¹ | 3.7754 × 10⁻¹ |
| 2 wt.% | 0.2512 | 0.222 | 0.9300 | 1.5609 | 1.366 |
| 4 wt.% | 3.472 | 3.160 | 2.658 | 2.7572 | 4.161 |
| 5 wt.% | 5.549 | 5.2190 | 4.2644 | 5.2208 | 5.32 |
Publisher’s Note: MDPI stays neutral with regard to jurisdictional claims in published maps and institutional affiliations. |
© 2022 by the authors. Licensee MDPI, Basel, Switzerland. This article is an open access article distributed under the terms and conditions of the Creative Commons Attribution (CC BY) license (https://creativecommons.org/licenses/by/4.0/).
Share and Cite
Tamayo-Vegas, S.; Muhsan, A.; Liu, C.; Tarfaoui, M.; Lafdi, K. The Effect of Agglomeration on the Electrical and Mechanical Properties of Polymer Matrix Nanocomposites Reinforced with Carbon Nanotubes. Polymers 2022, 14, 1842. https://doi.org/10.3390/polym14091842
Tamayo-Vegas S, Muhsan A, Liu C, Tarfaoui M, Lafdi K. The Effect of Agglomeration on the Electrical and Mechanical Properties of Polymer Matrix Nanocomposites Reinforced with Carbon Nanotubes. Polymers. 2022; 14(9):1842. https://doi.org/10.3390/polym14091842
Chicago/Turabian StyleTamayo-Vegas, Sebastian, Ali Muhsan, Chang Liu, Mostapha Tarfaoui, and Khalid Lafdi. 2022. "The Effect of Agglomeration on the Electrical and Mechanical Properties of Polymer Matrix Nanocomposites Reinforced with Carbon Nanotubes" Polymers 14, no. 9: 1842. https://doi.org/10.3390/polym14091842
APA StyleTamayo-Vegas, S., Muhsan, A., Liu, C., Tarfaoui, M., & Lafdi, K. (2022). The Effect of Agglomeration on the Electrical and Mechanical Properties of Polymer Matrix Nanocomposites Reinforced with Carbon Nanotubes. Polymers, 14(9), 1842. https://doi.org/10.3390/polym14091842