
Experiments and Finite Element Simulations of Composite Laminates Following Low Velocity On-Edge Impact Damage


Abstract
:1. Introduction
2. Experimental Method
2.1. Specimen
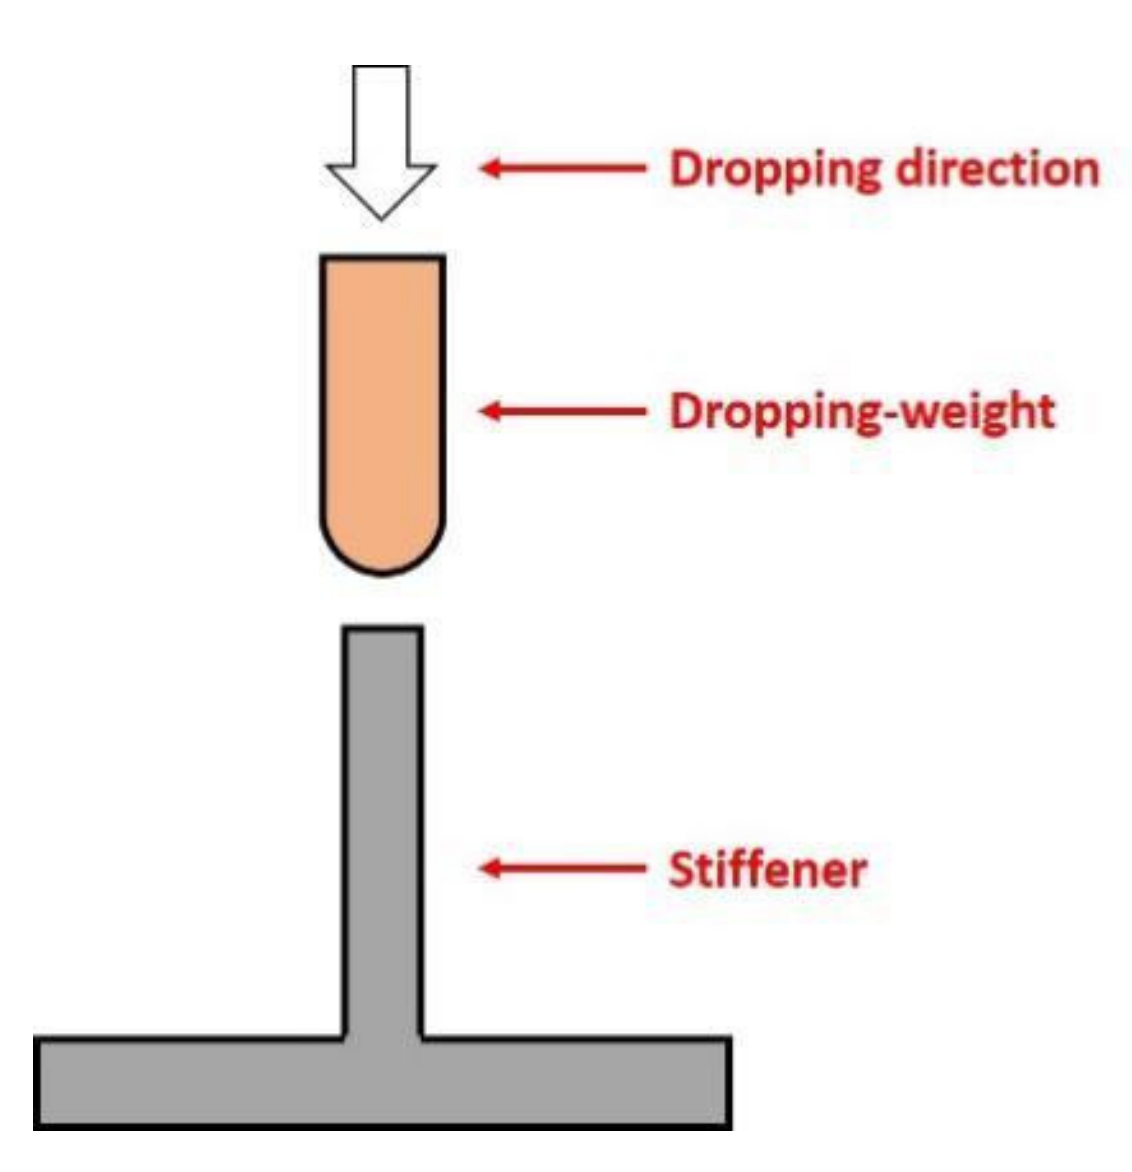
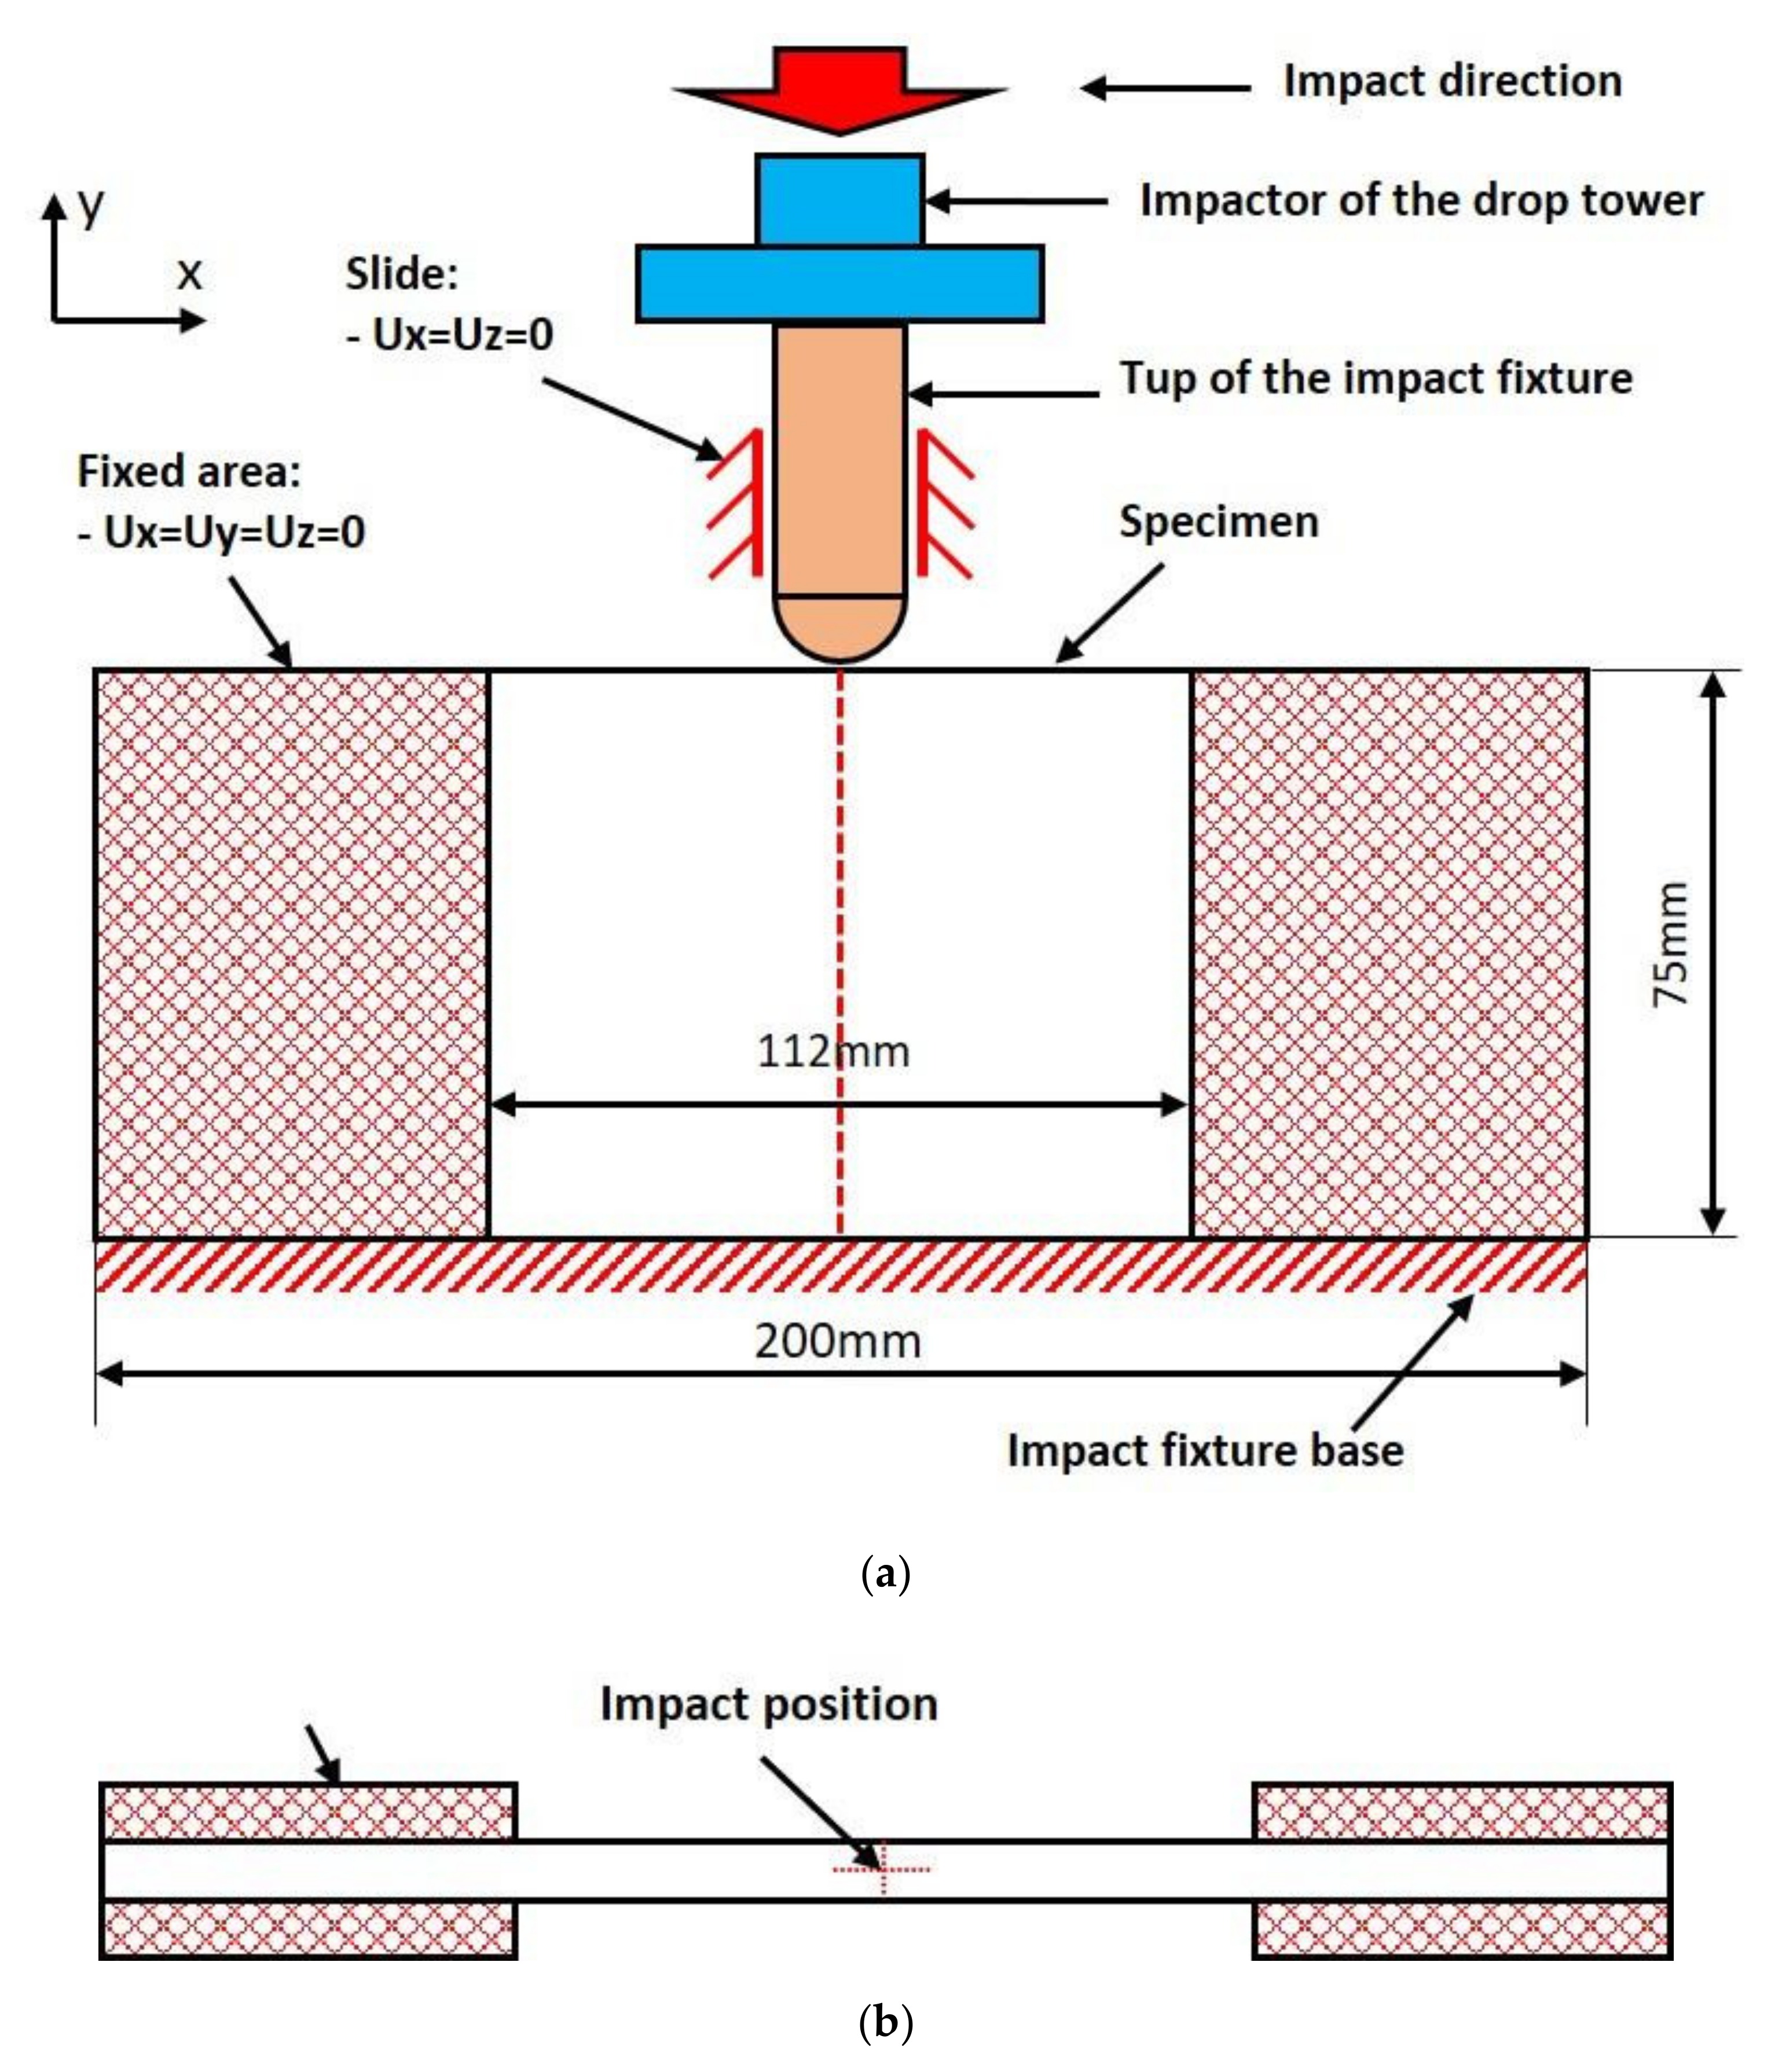
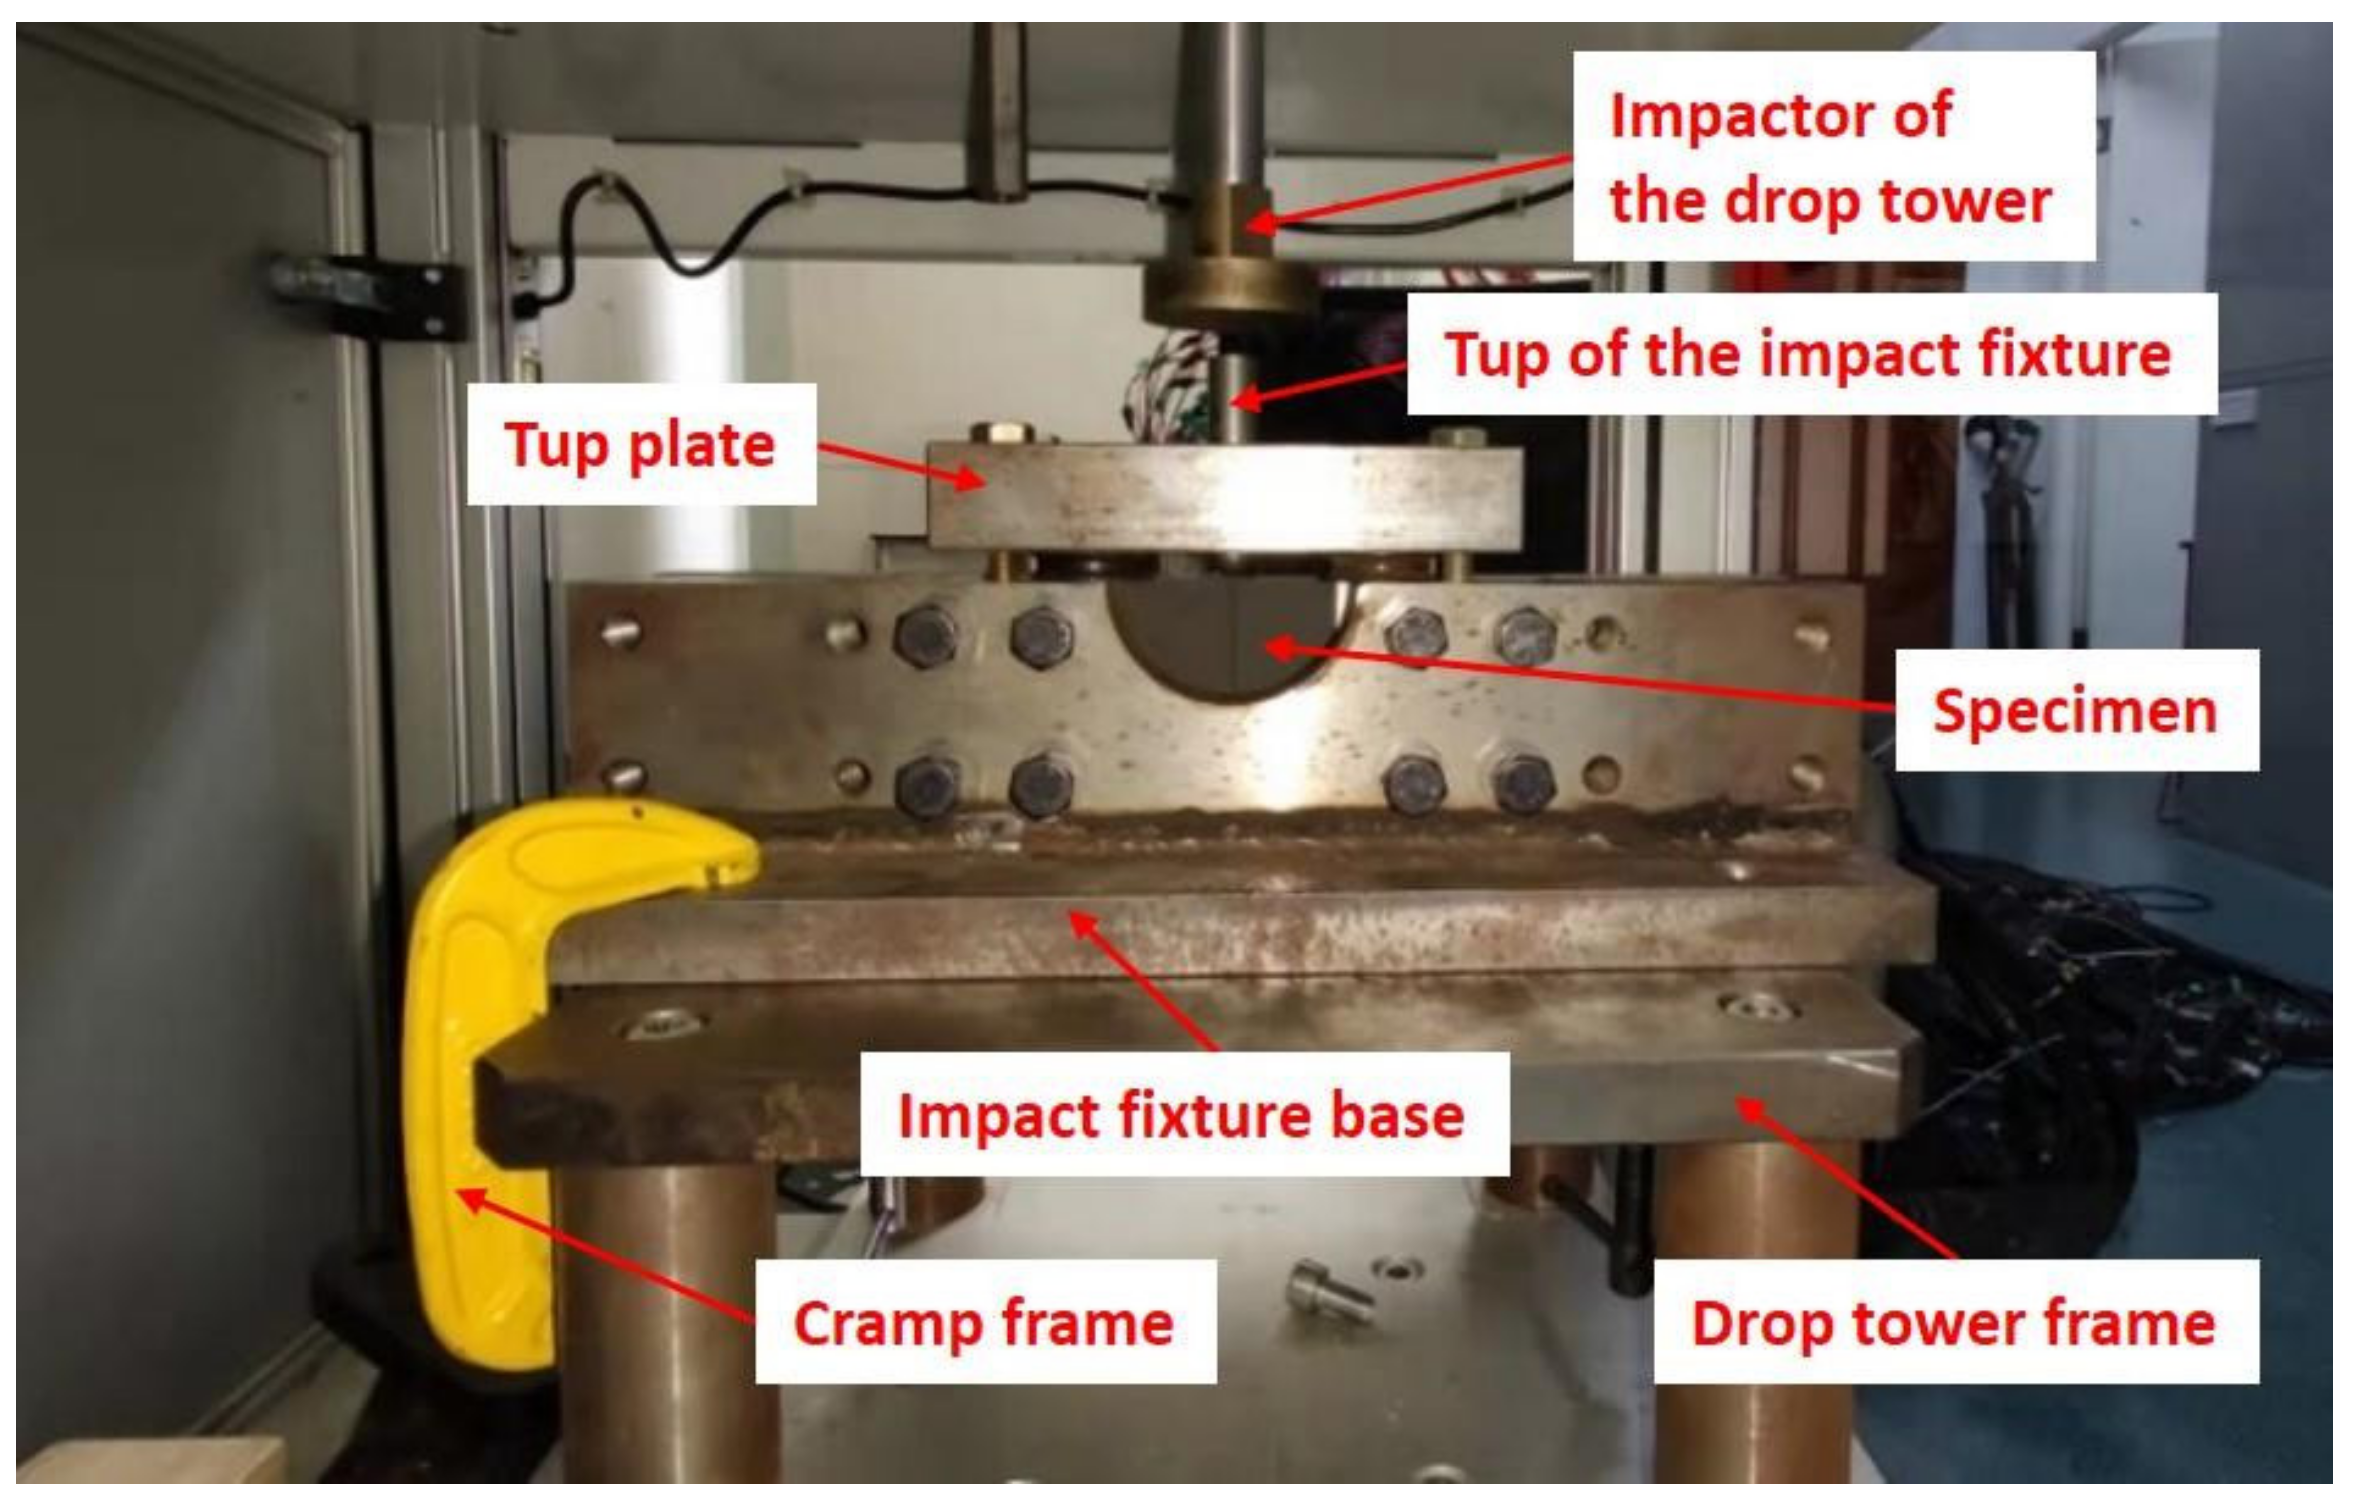
2.2. On-Edge Impact Test
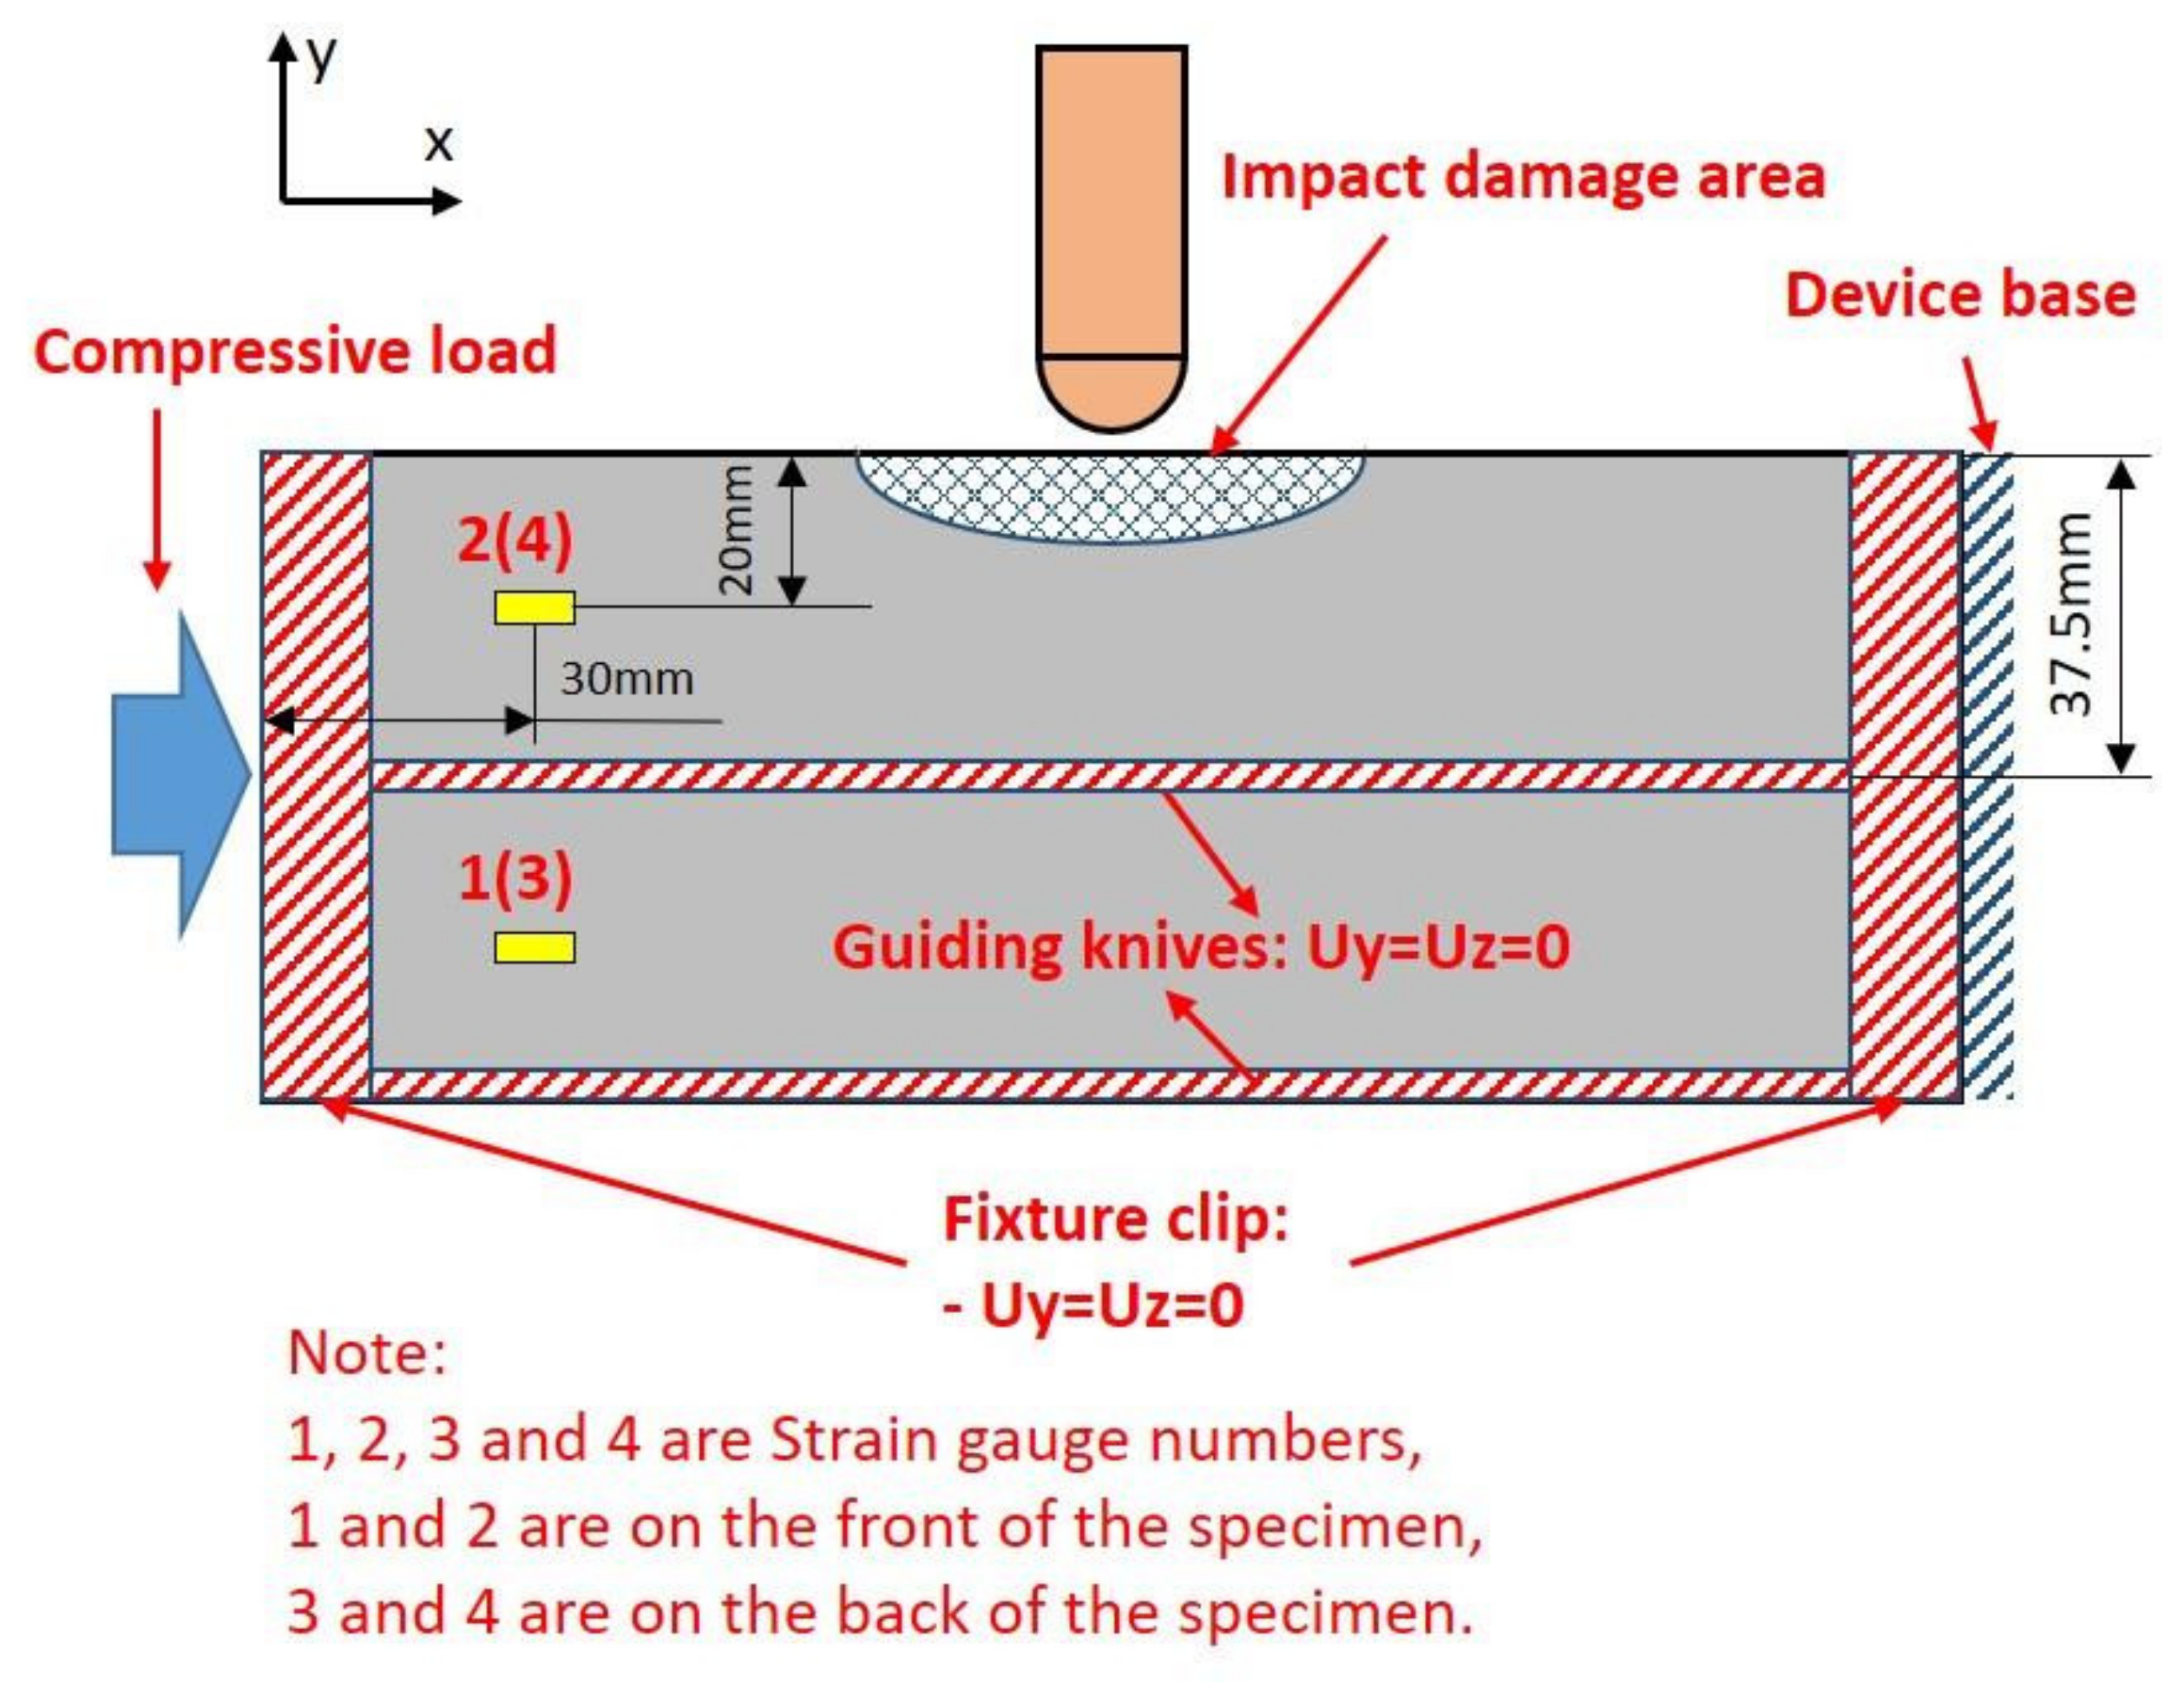
2.3. CAEI Test
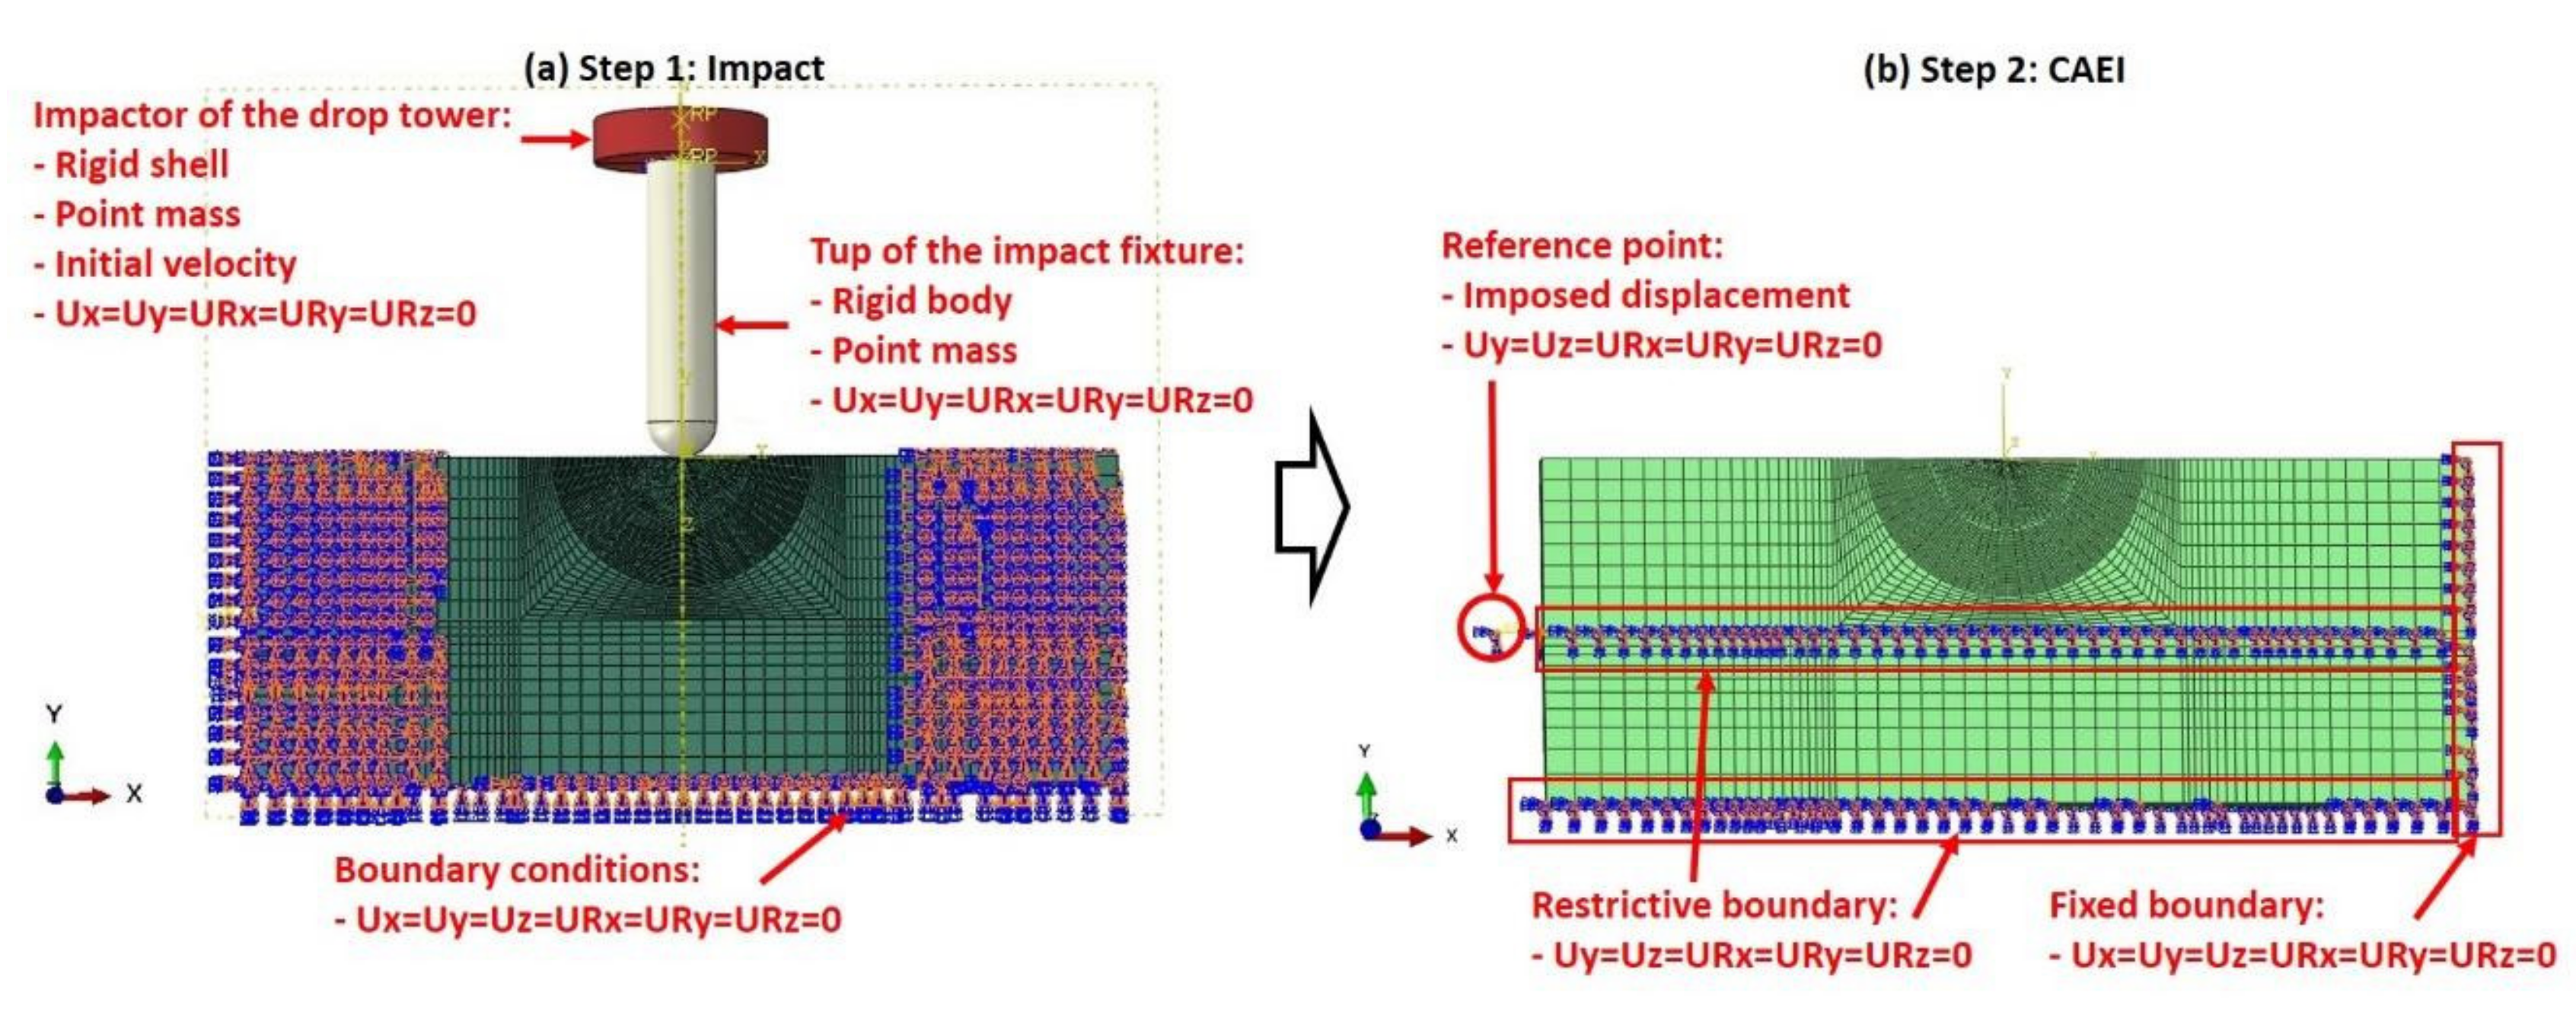
3. Numerical Simulation
3.1. Finite Element Model
3.2. Intralaminar Failure Criterion
- Damage of fiber
- 2.
- Matrix failure
3.3. Interlaminar Damage
3.4. Impact Simulation
3.5. Compression Simulation
4. Results Analysis and Discussion
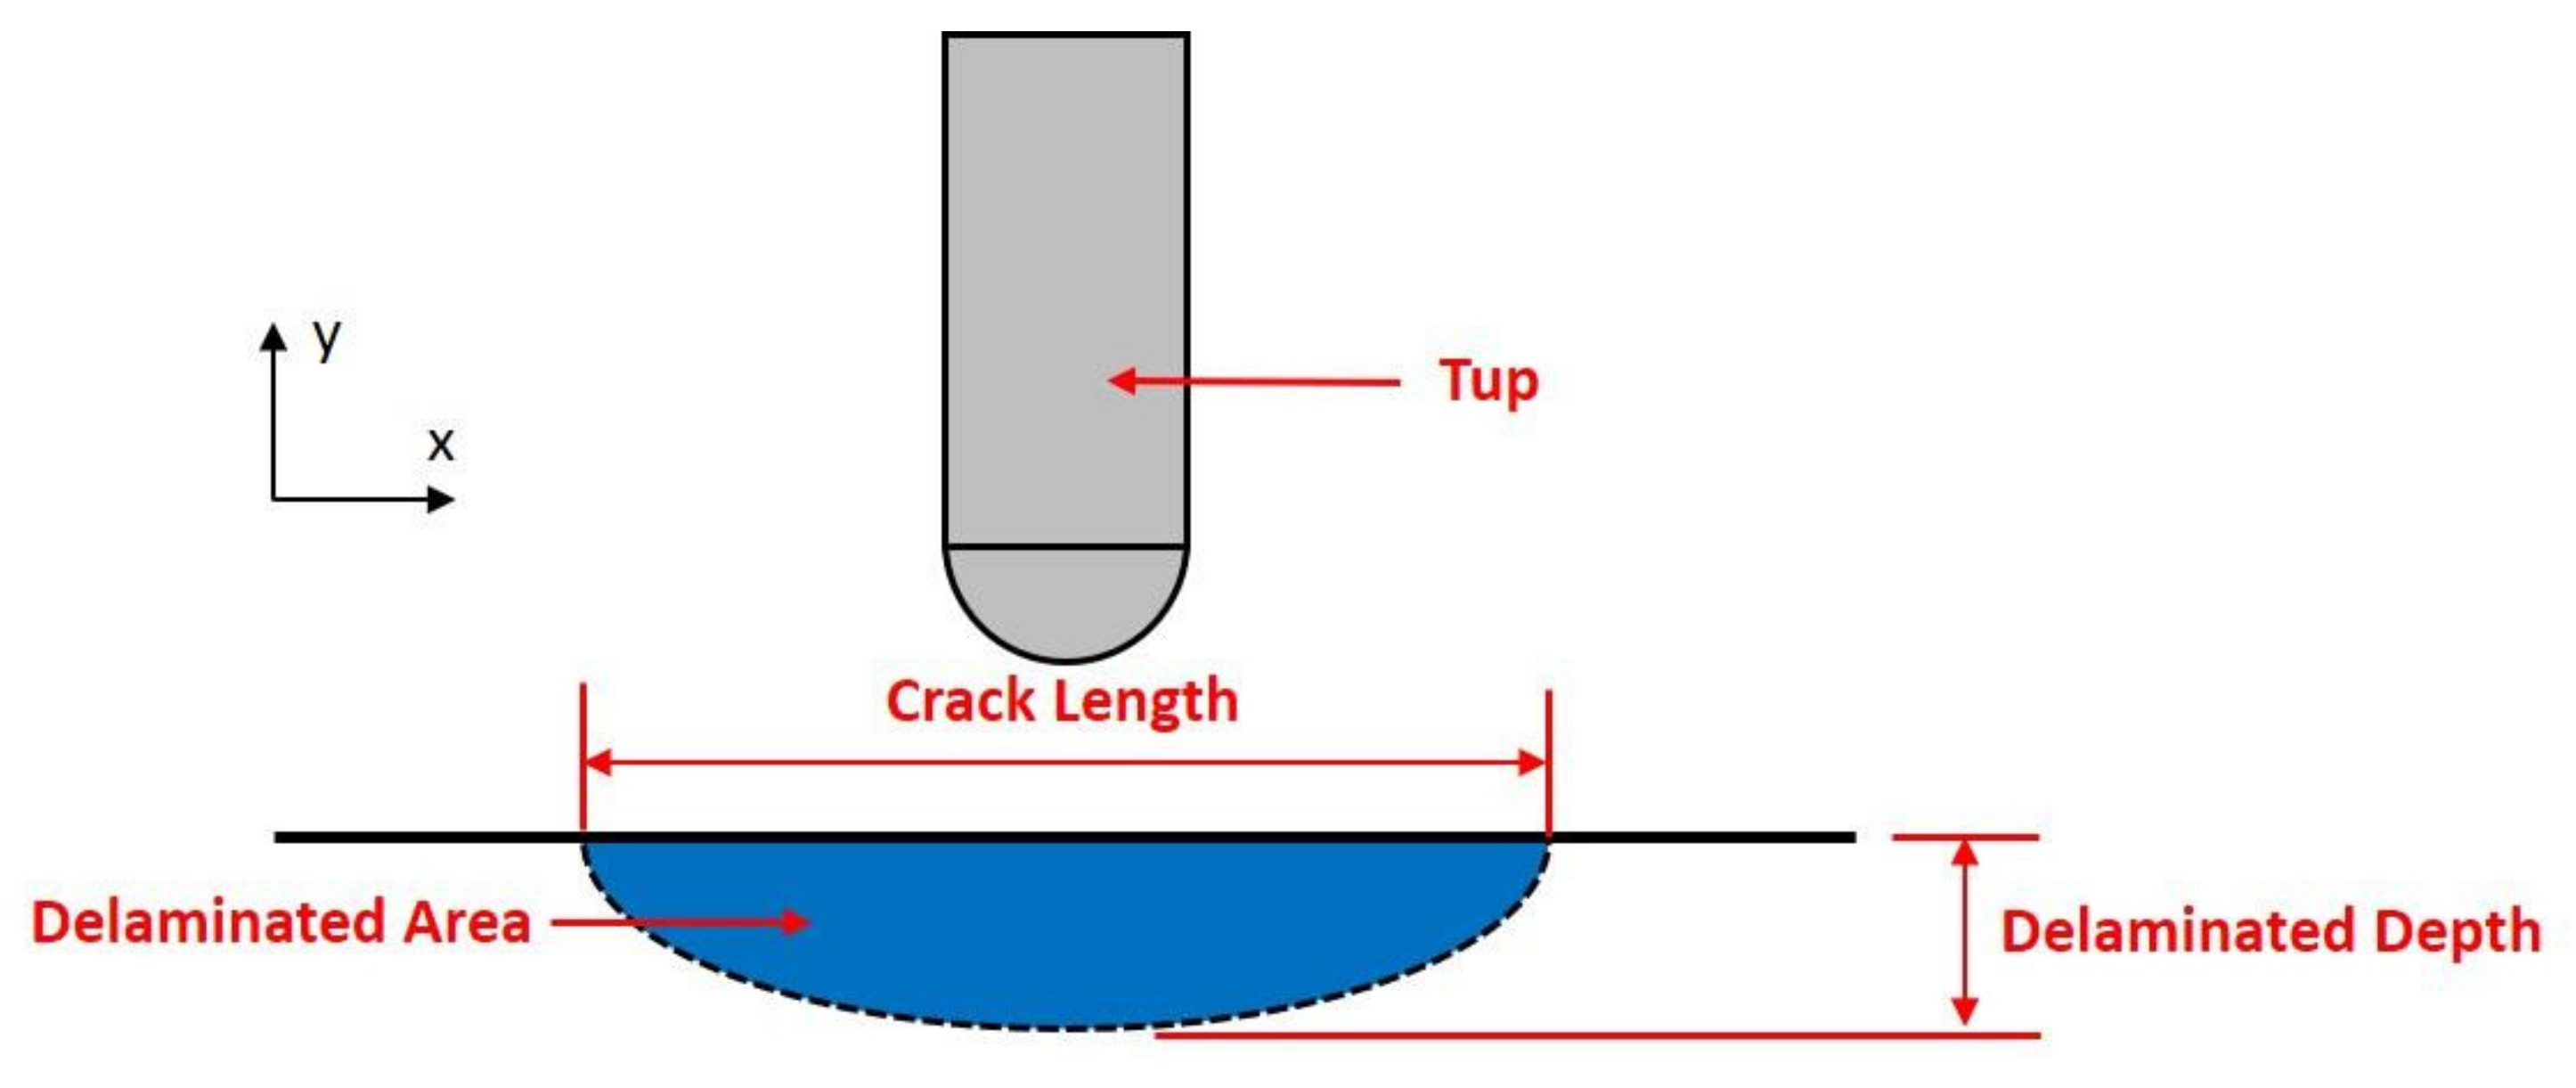
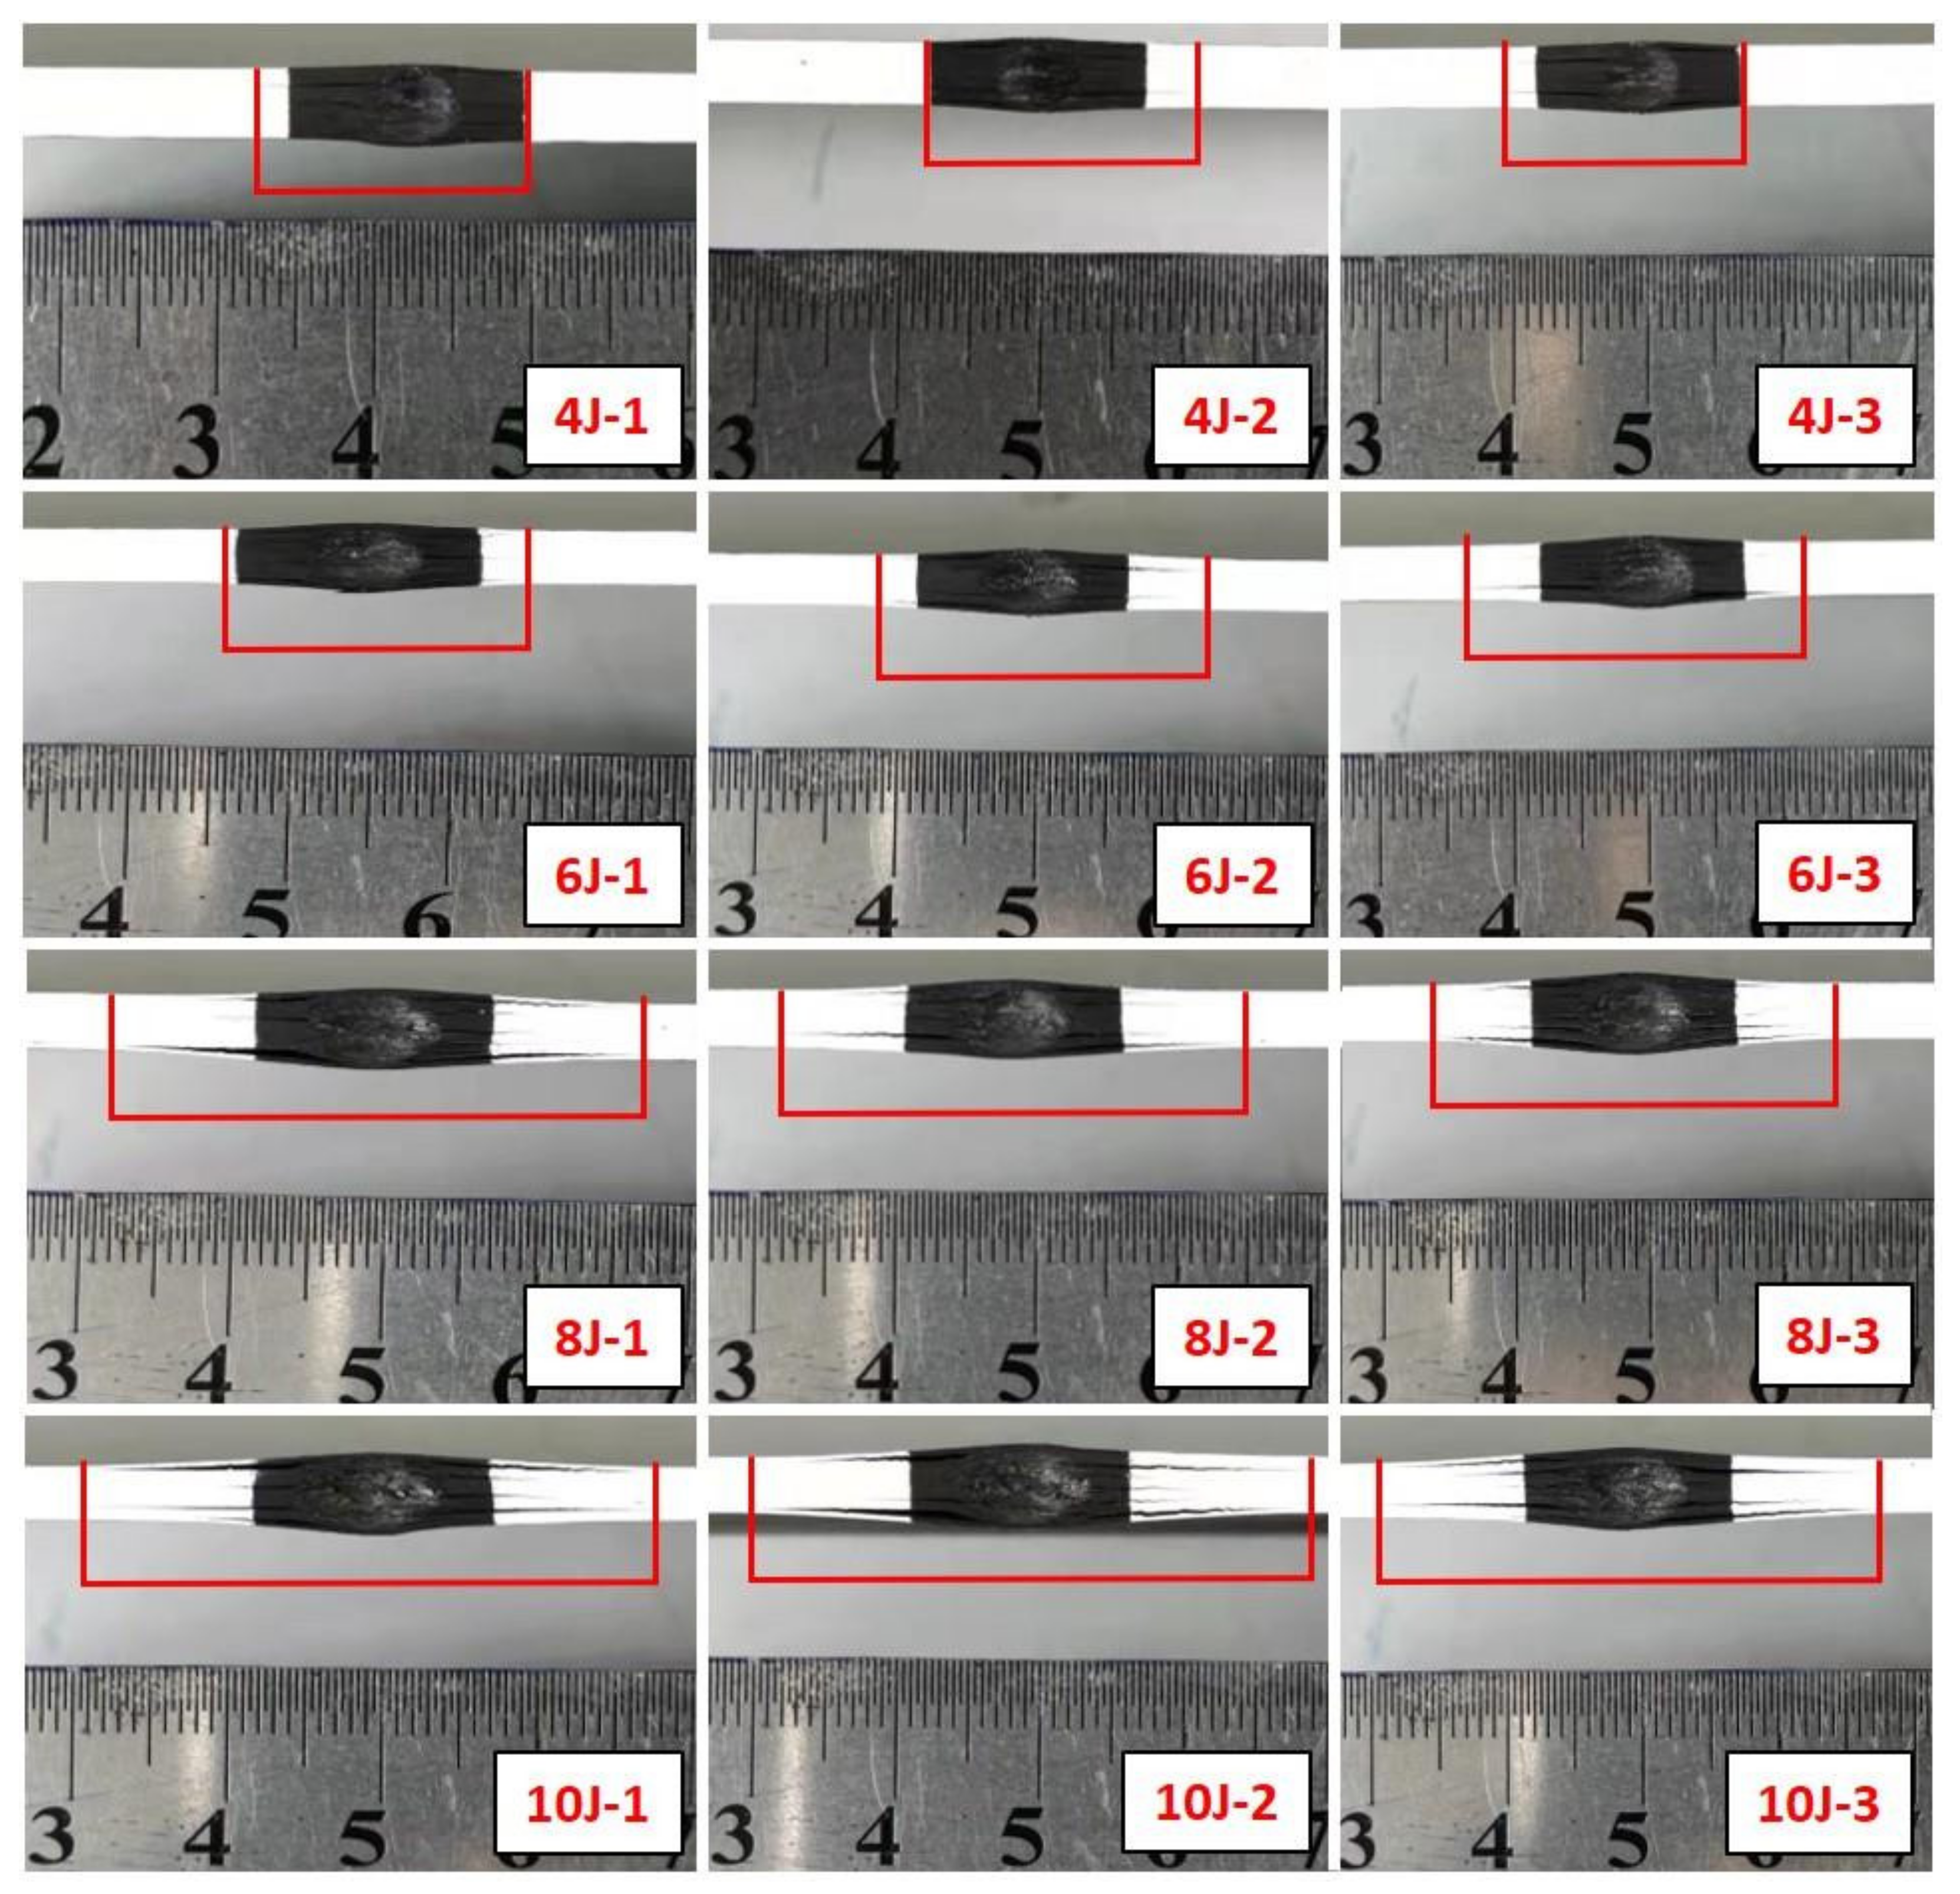
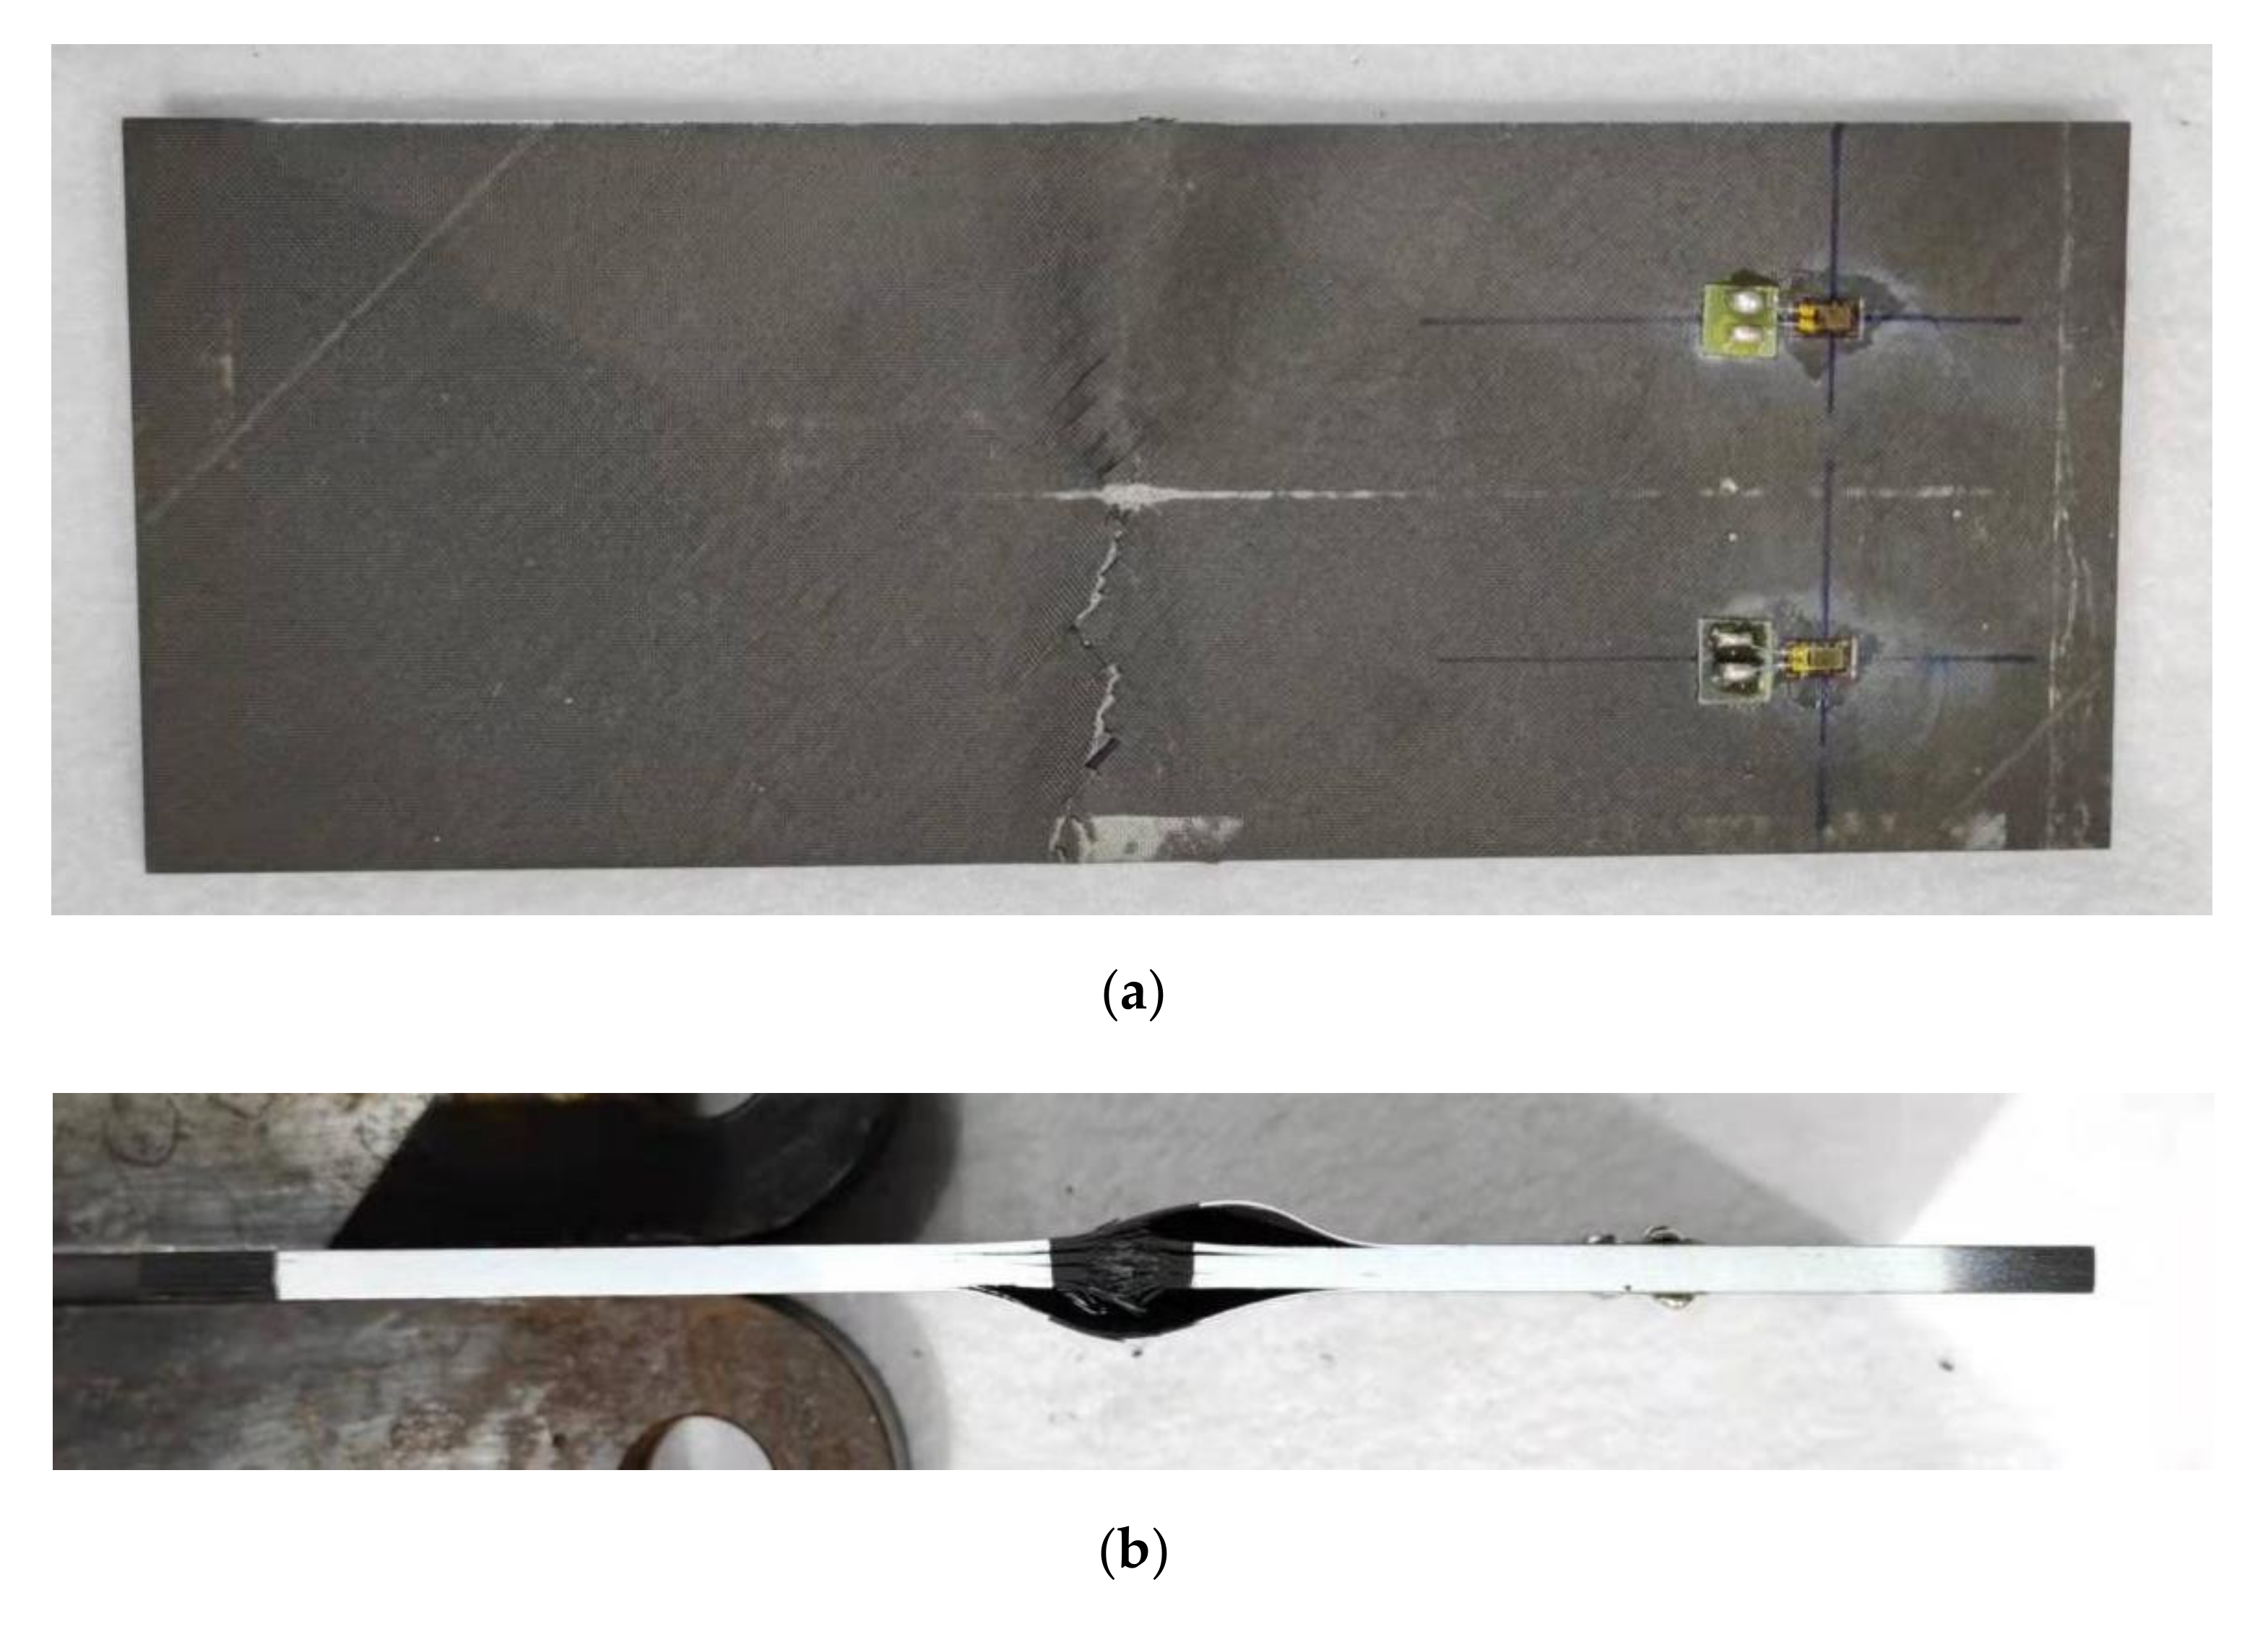
4.1. Impact Damage
4.2. CAEI Experimental Results
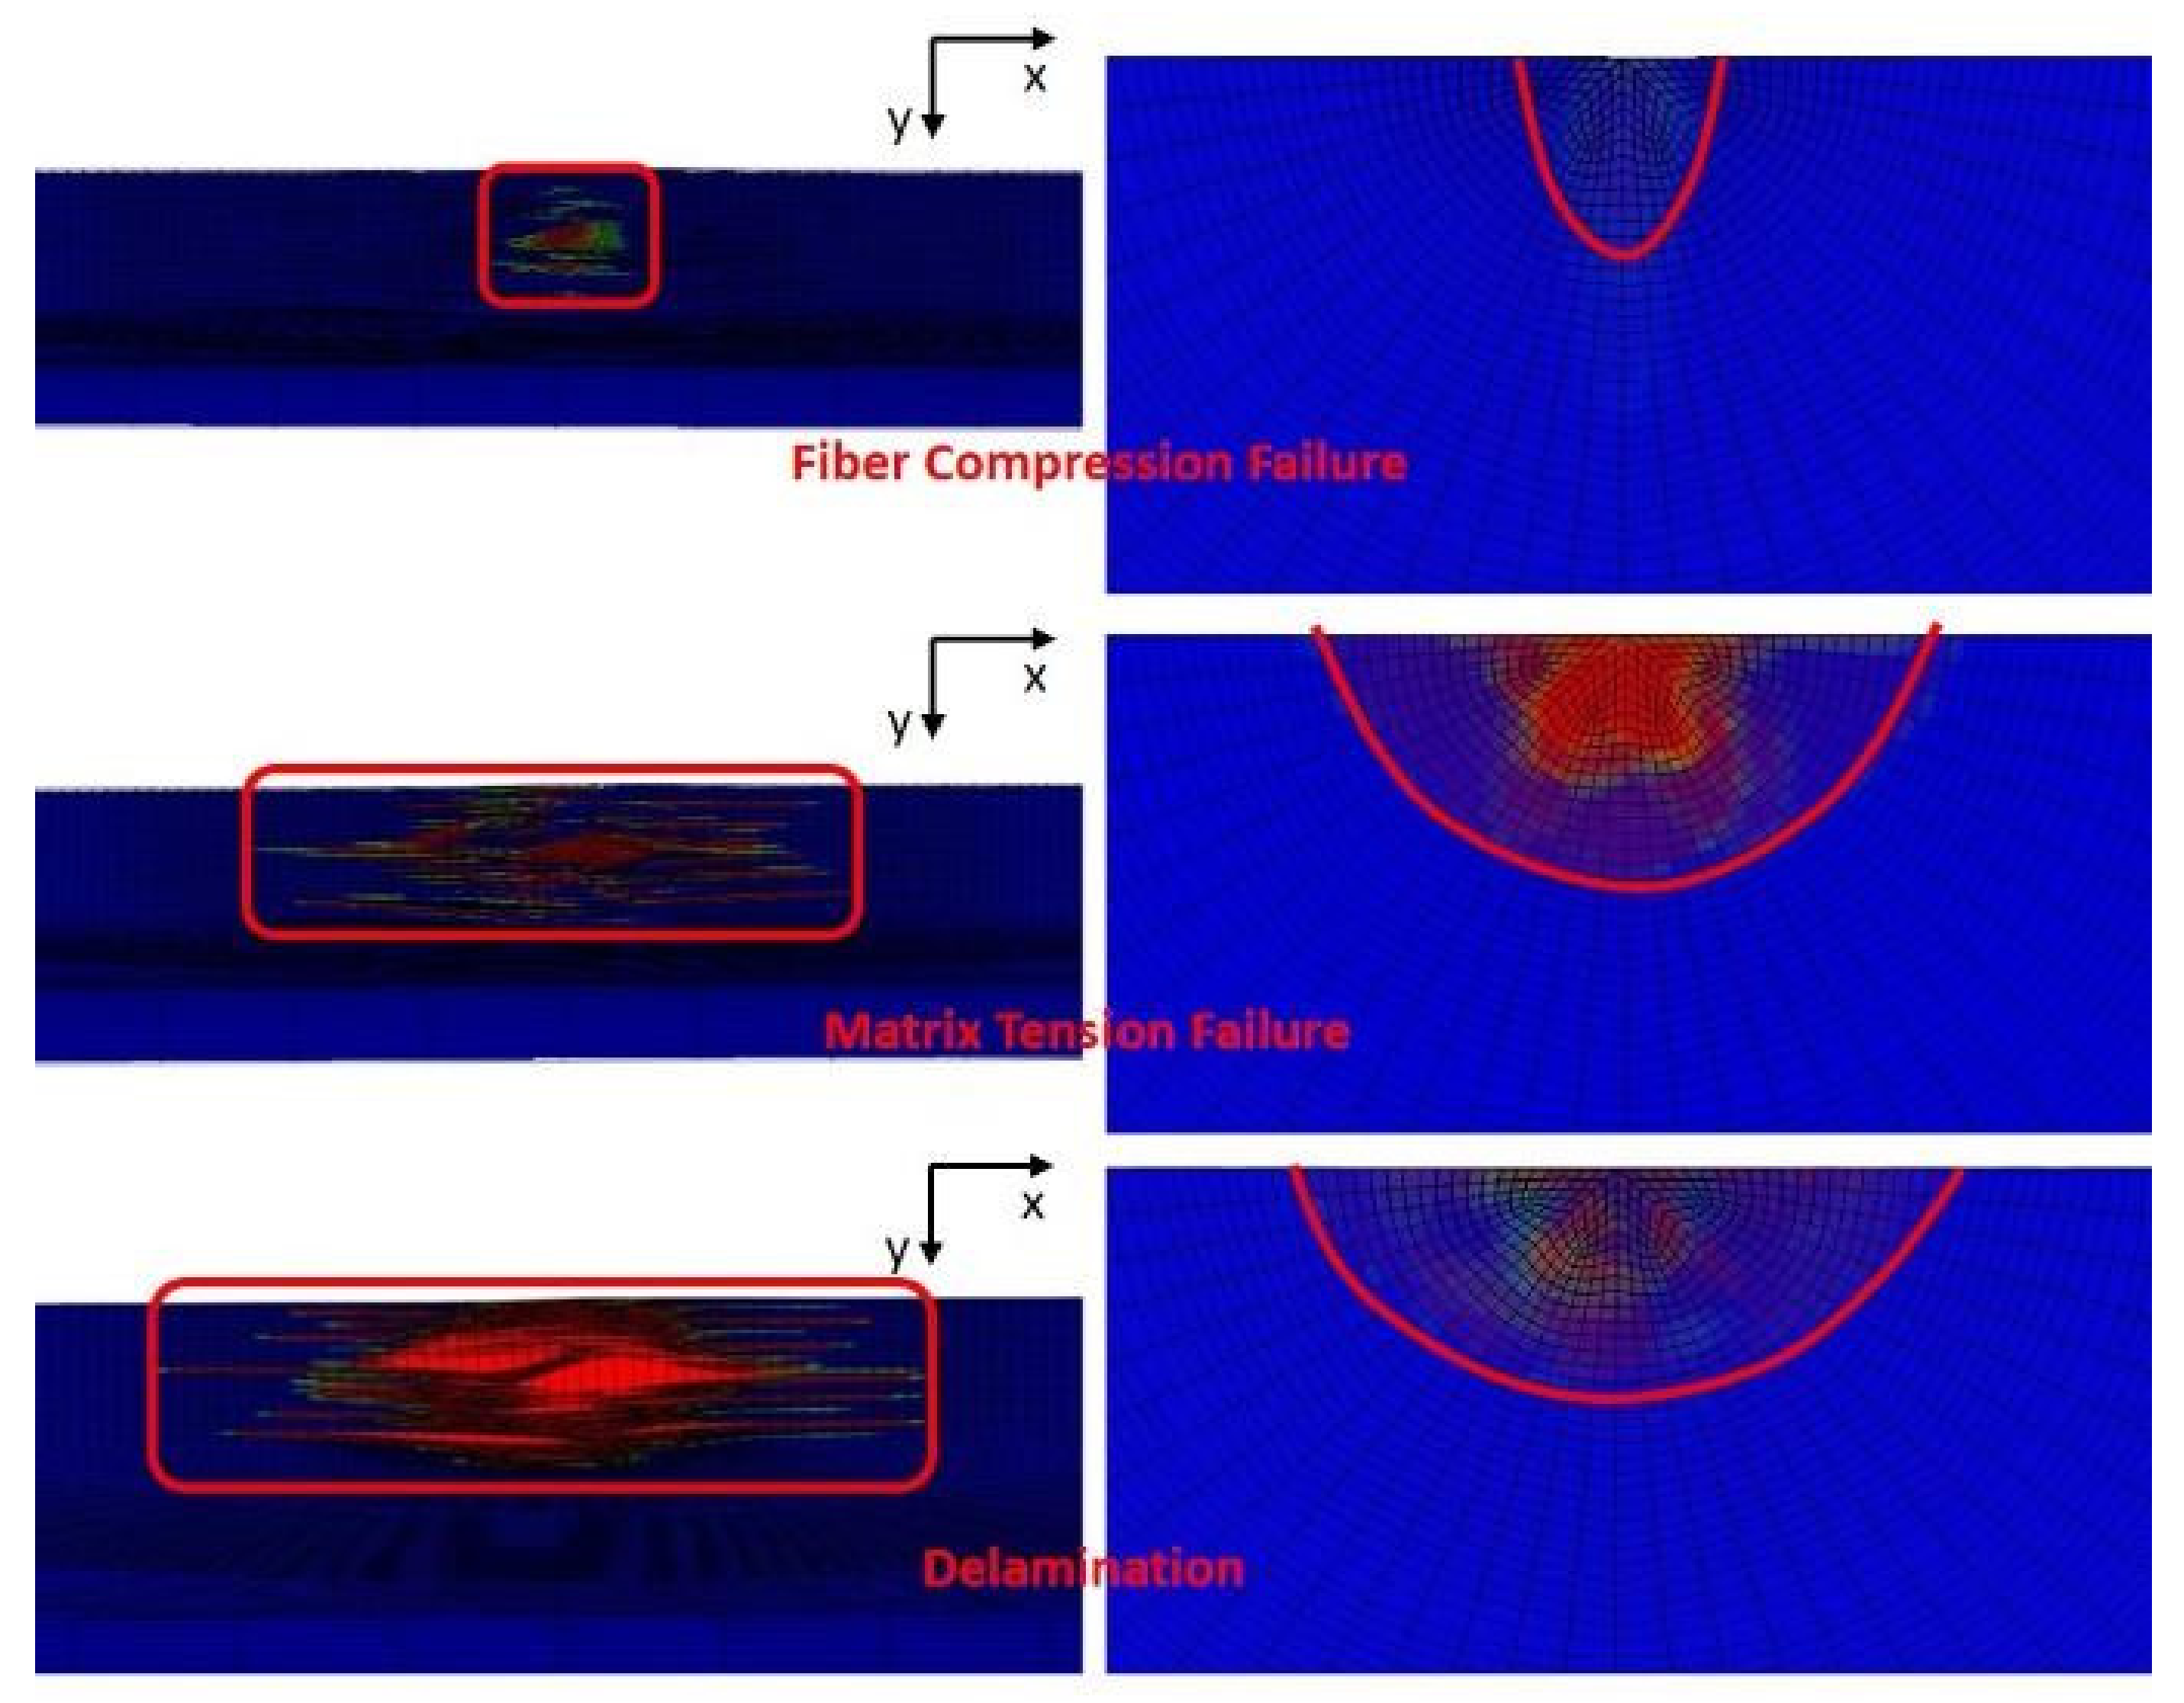
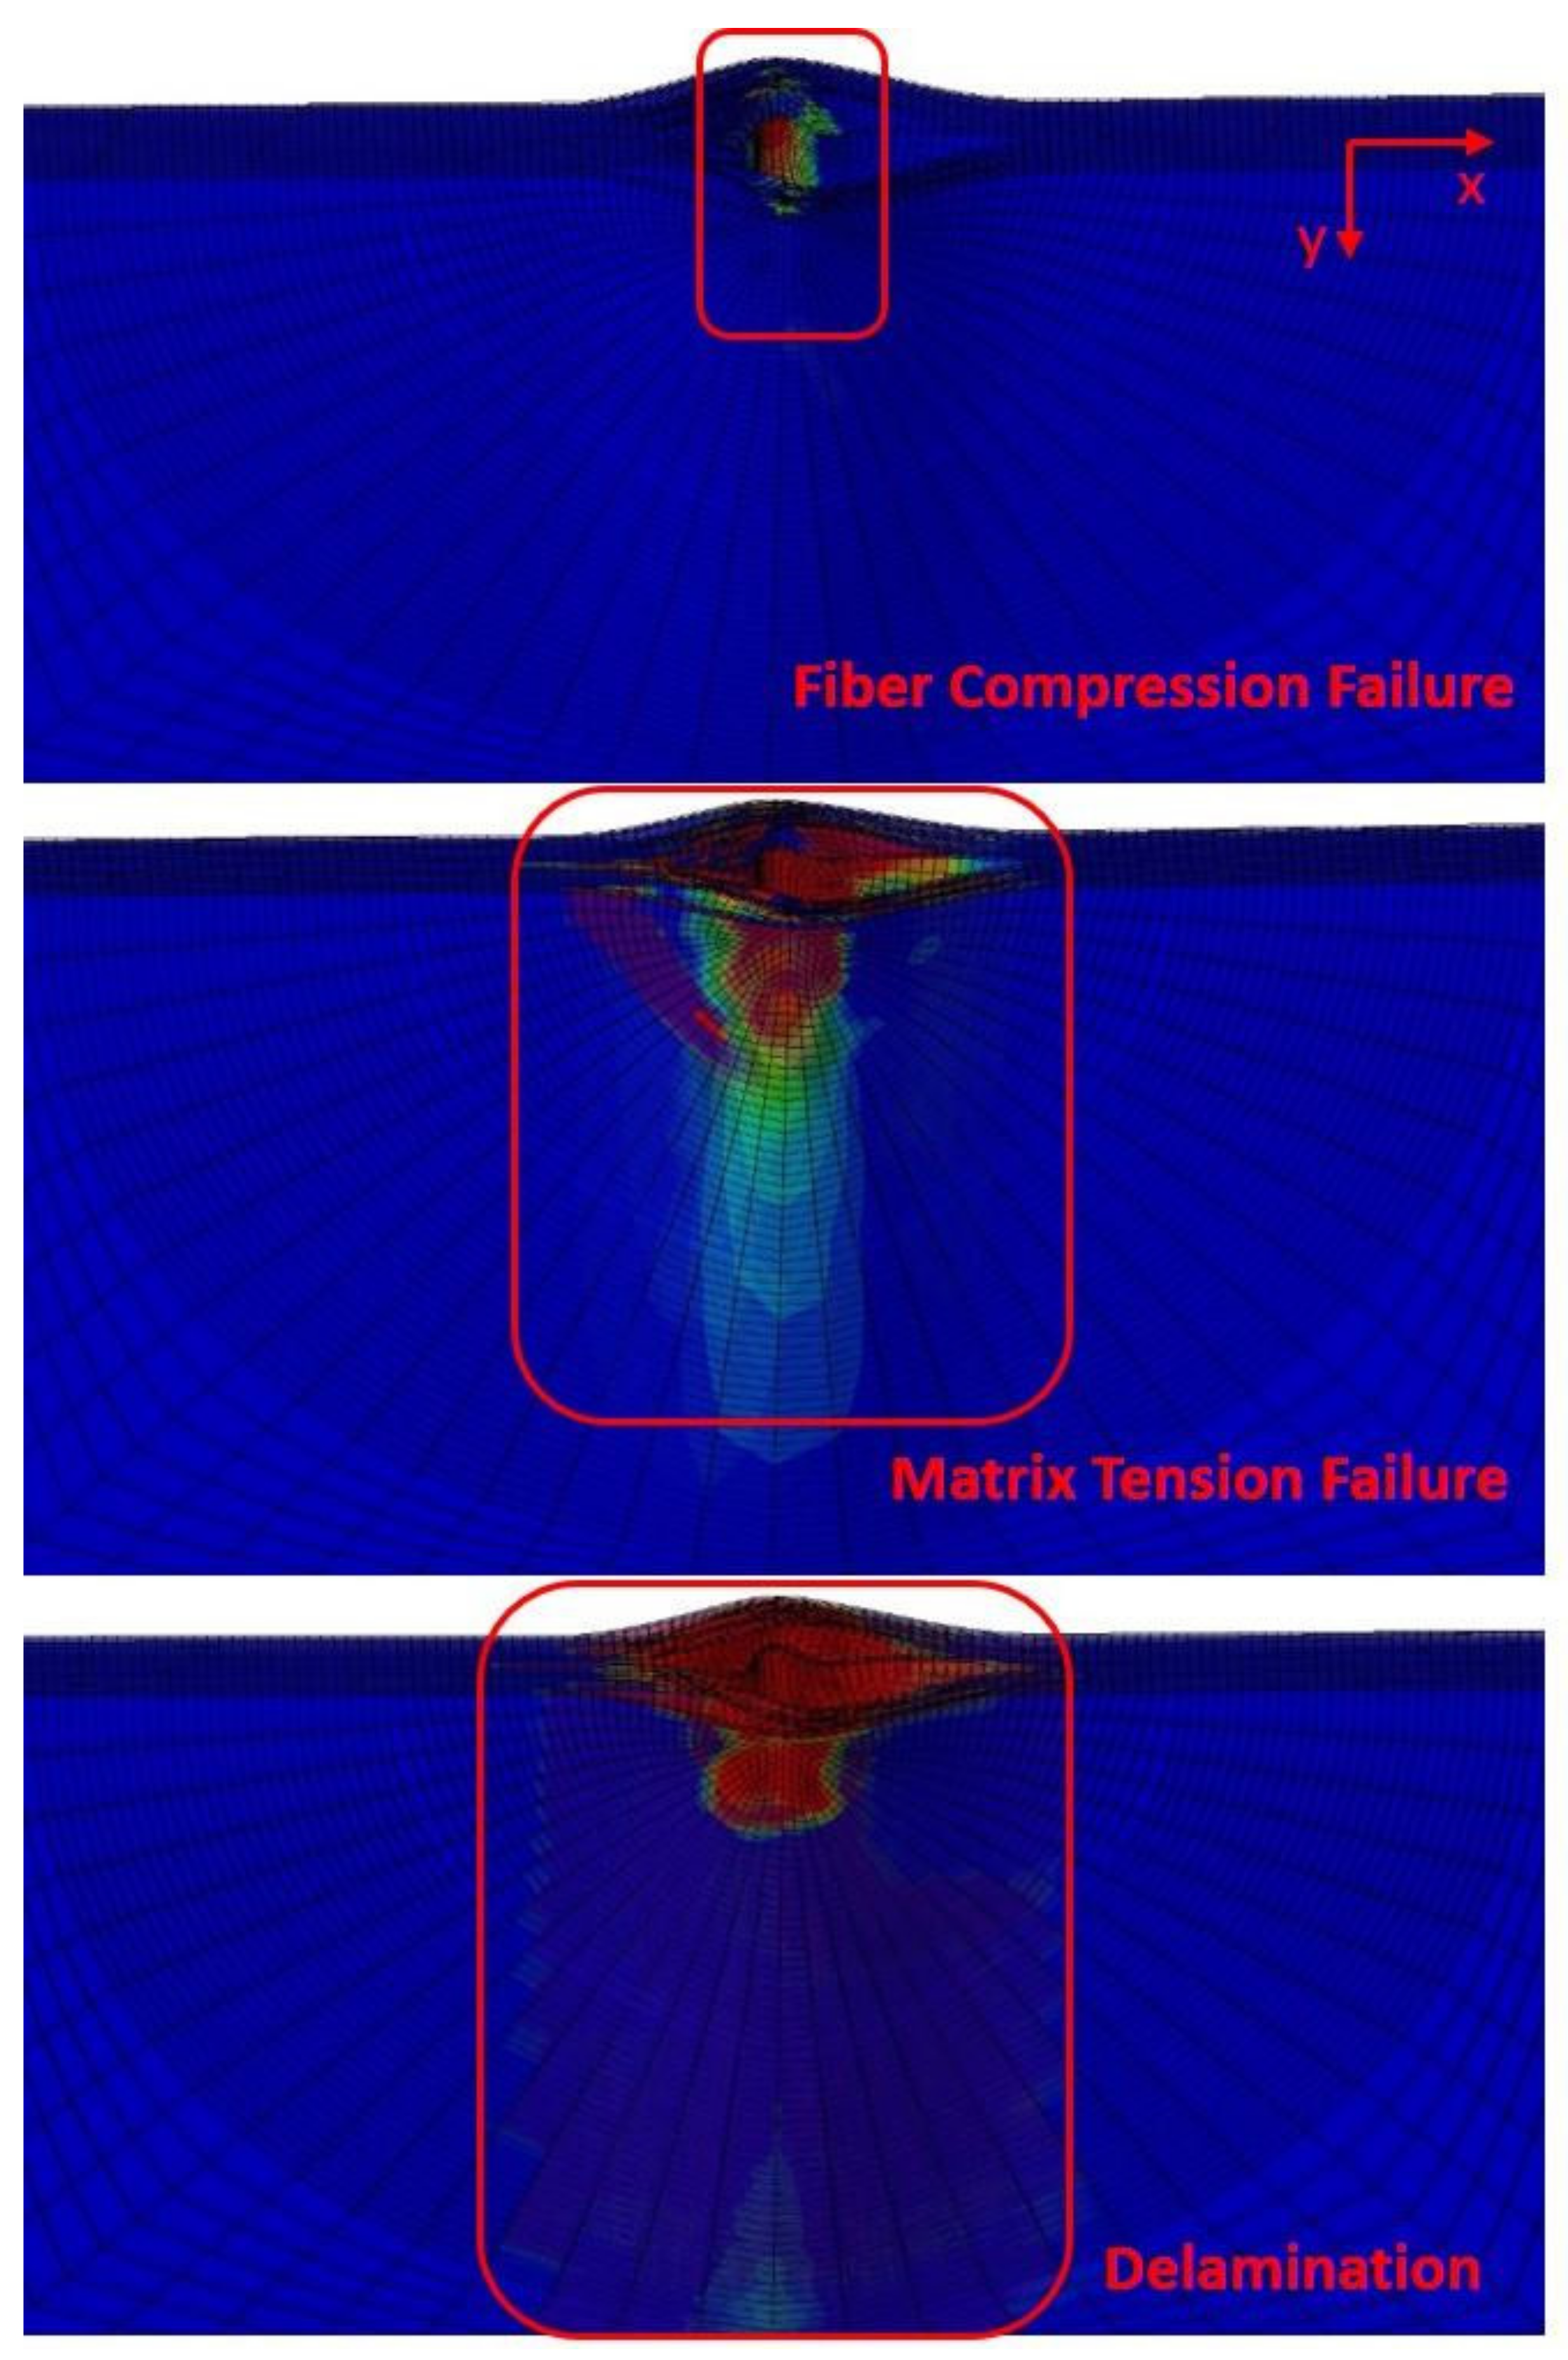
4.3. Finite Element Simulation Results
- (1)
- Damage morphology of simulation results
- (2)
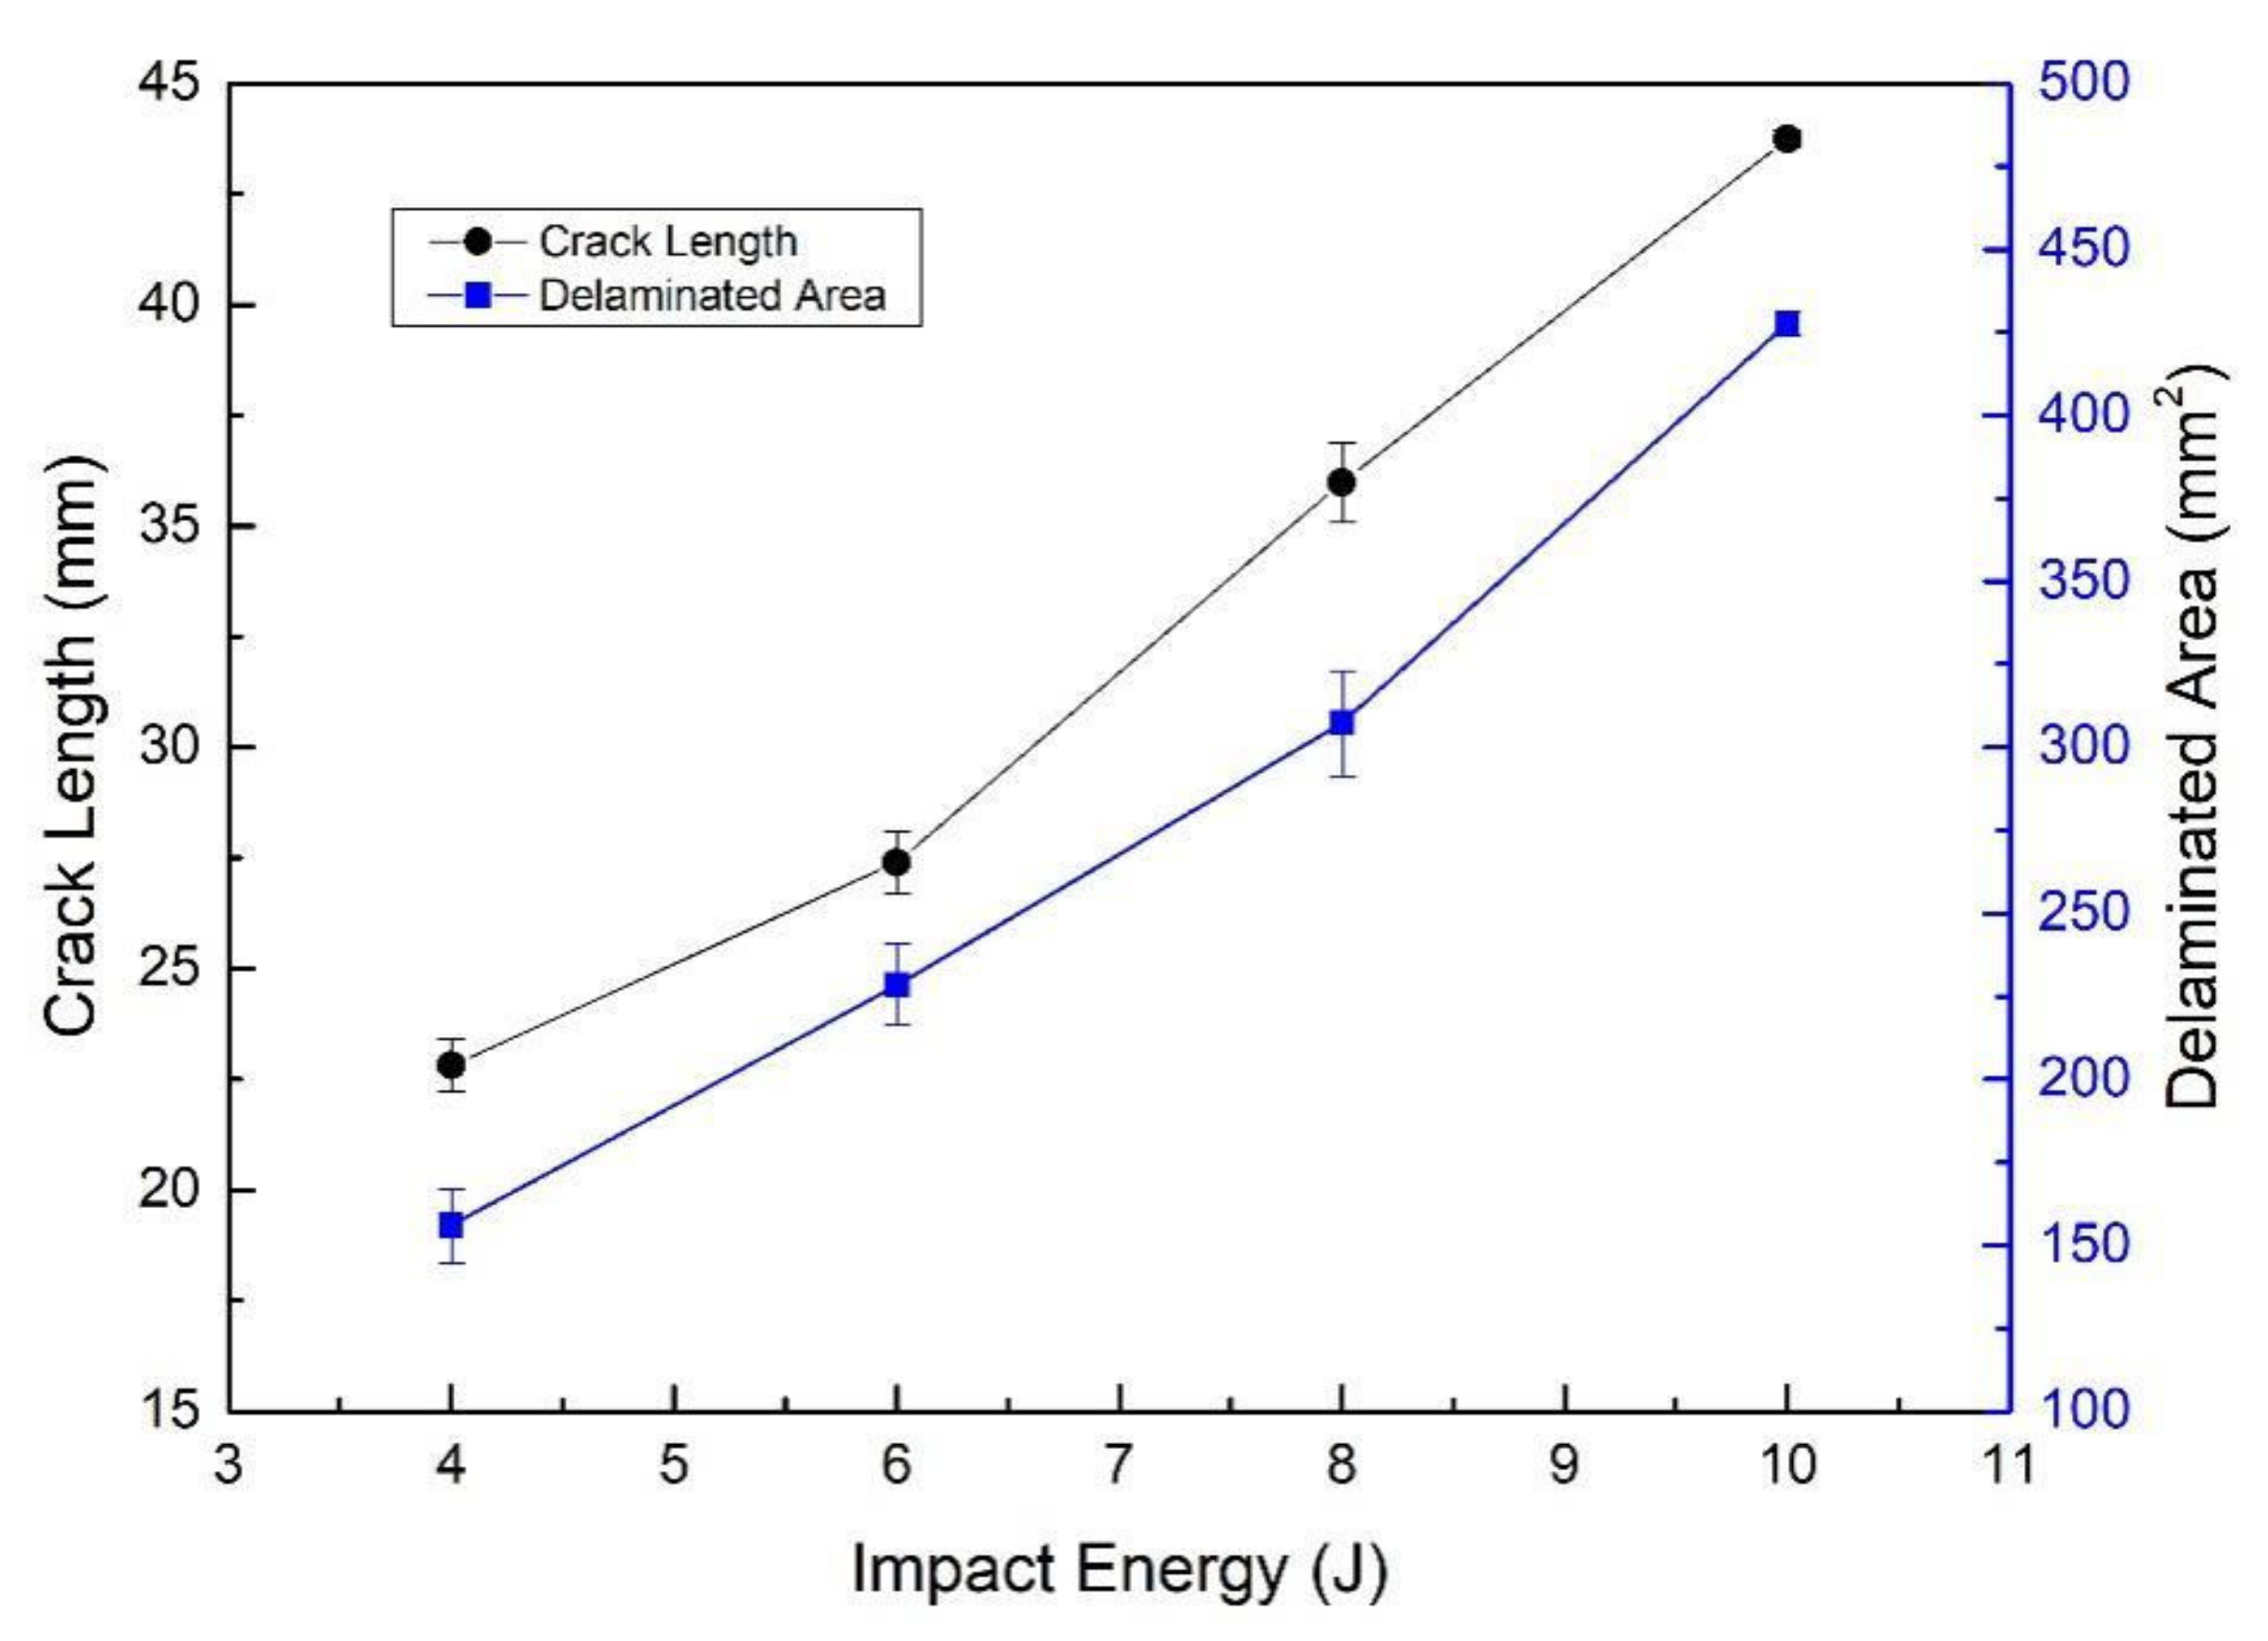
- Damage size after impact
- (3)
- Residual compressive strength
- (4)
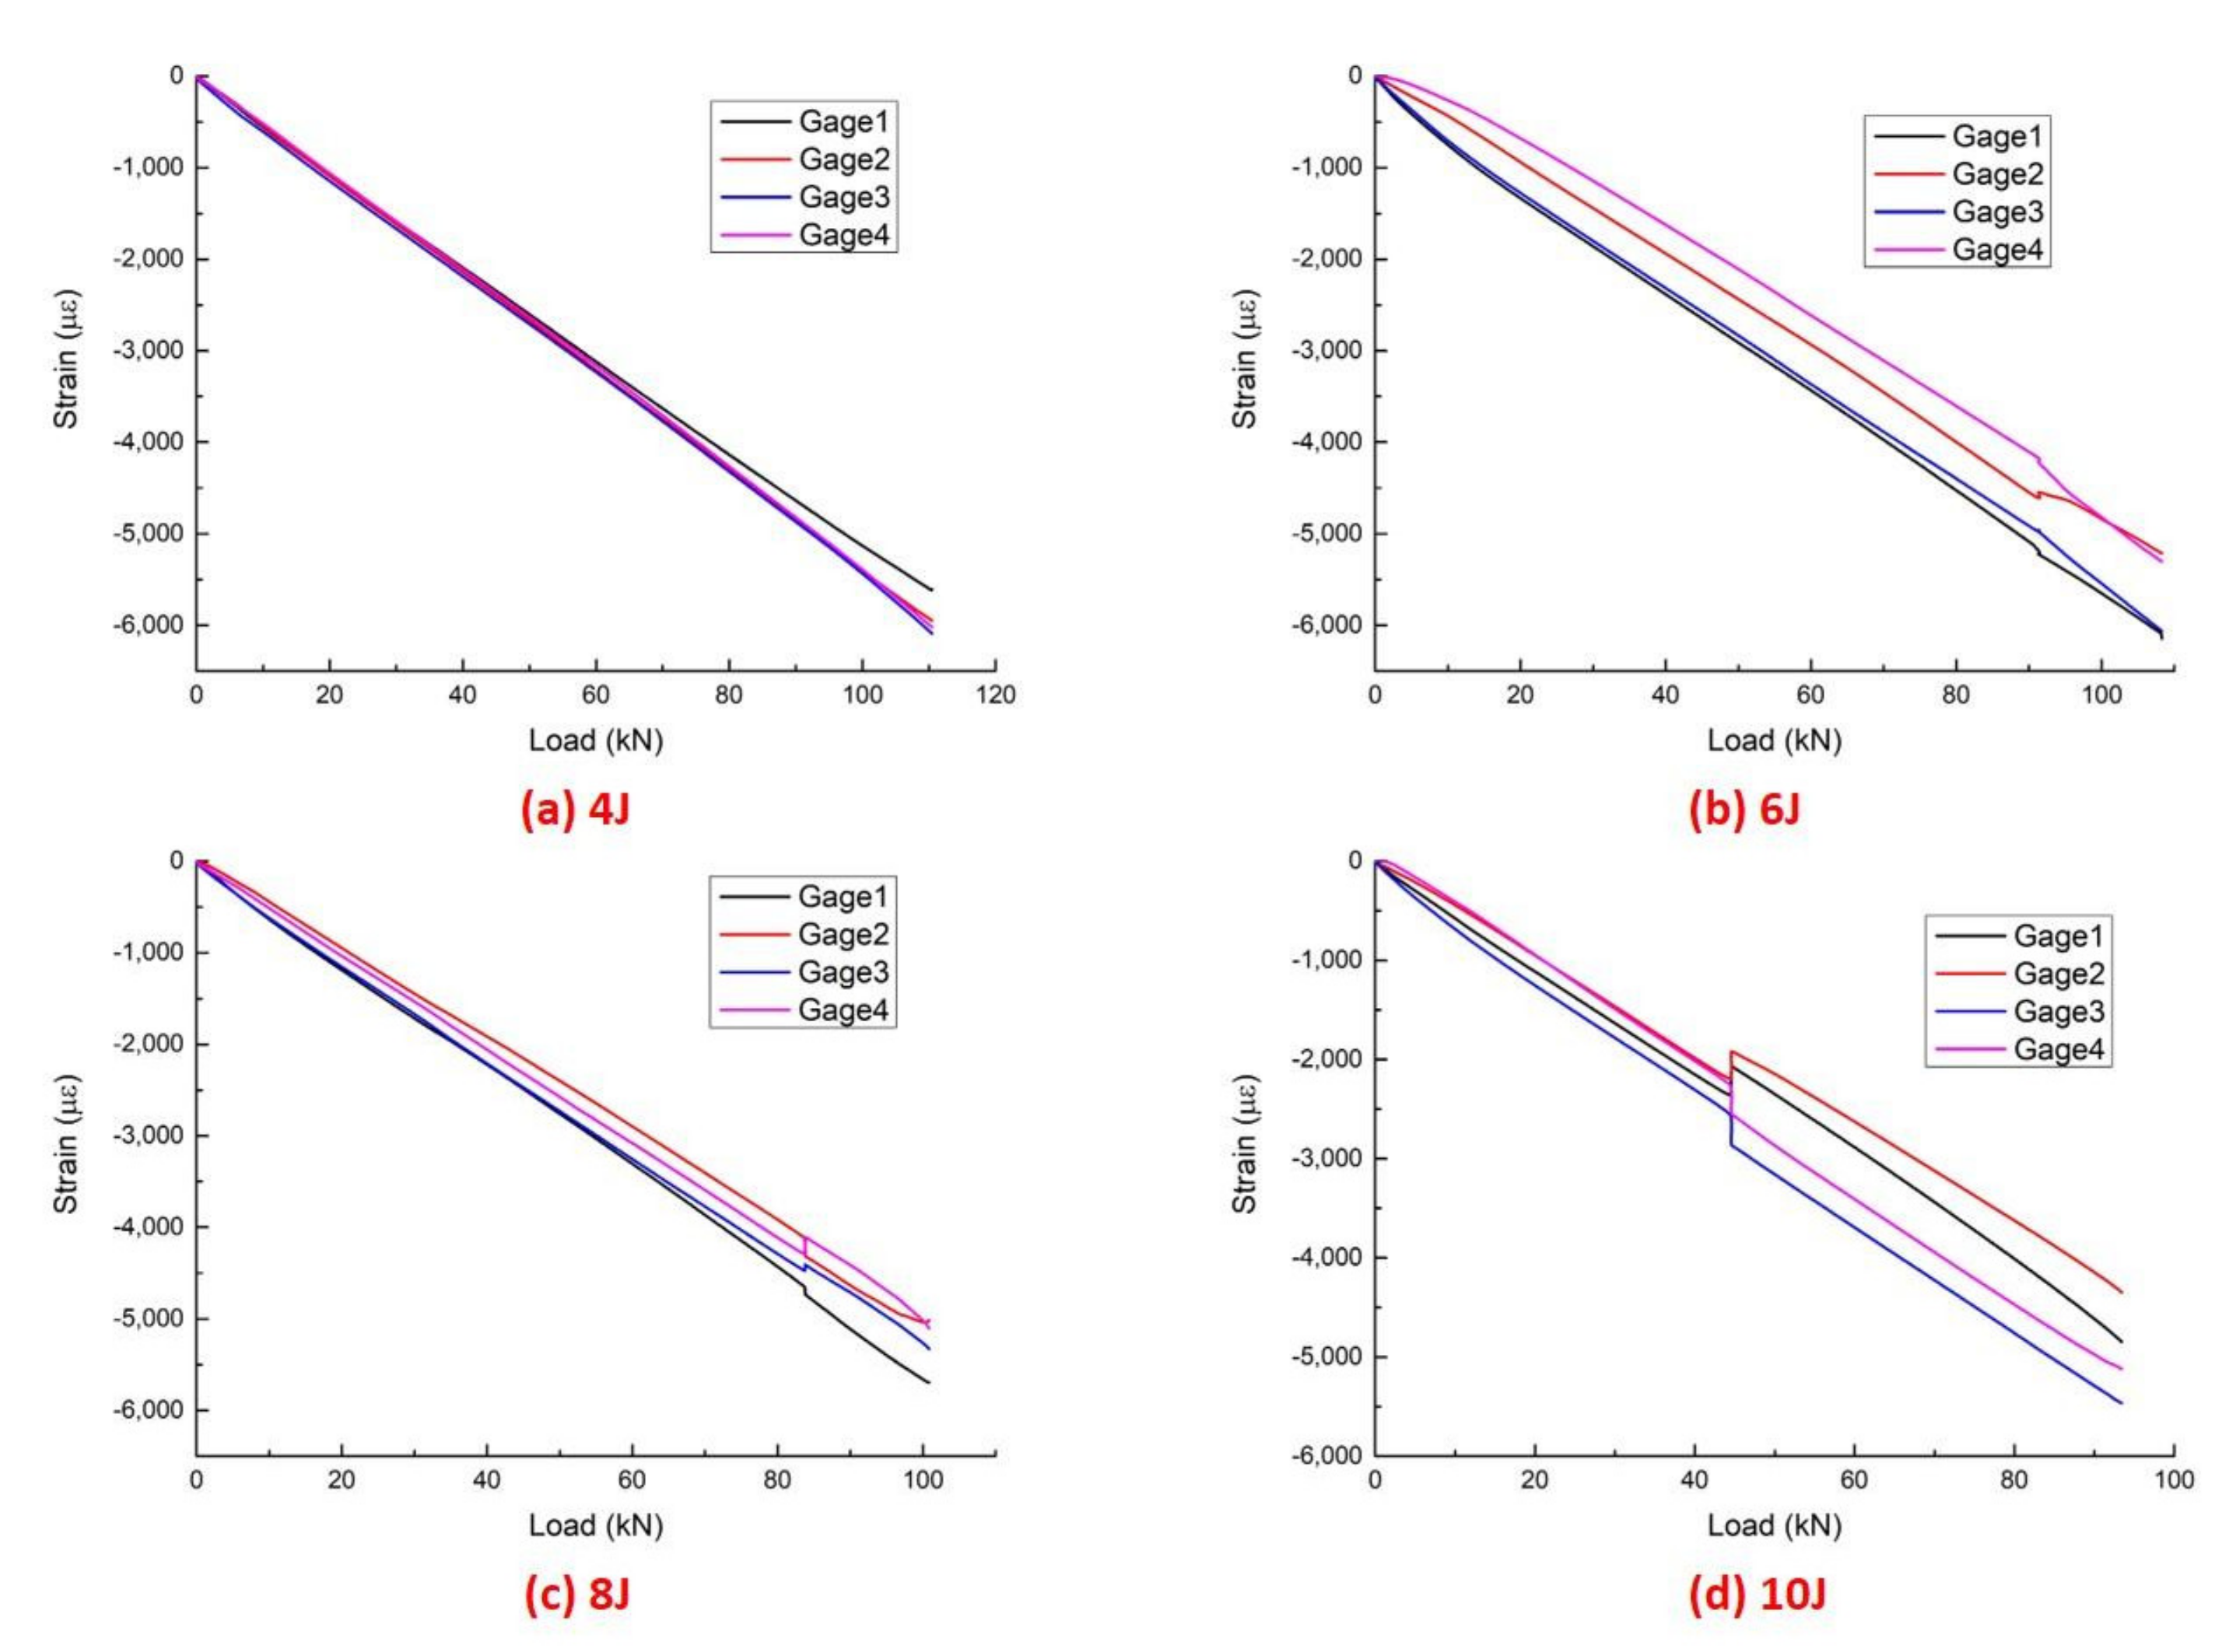
- Longitudinal strain
5. Conclusions
- A novel impact fixture was designed to execute on-edge impact to make sure the location of the impact was perfectly on the middle edge of the specimen. The impact morphologies show that a good effect appears from the impact fixture. The impact damage extent was established through Ultrasonic C-scanning inspection of the laminates. Indentations and cracks could barely be seen by naked eyes on all the impacted specimens. There were multiple cracks after impact, and the longer cracks appeared in the outer layer of the laminates. The damage morphologies of the delamination of the laminates are nearly semi-ellipse, and the long axis is vertical to the impact loading direction. The crack length and delaminated area increase with the increase in impact energy.
- In the CAEI tests, the residual compressive strength is sensitive to the on-edge impact damage. Roughly 1 J/mm of incident energy could reduce the residual compressive strength by 15.5%. The load–displacement curves of the damaged laminates under various levels of incident energy reveal that the stiffness values of the different damage laminates were similar to each other. There was little effect of on-edge impact on stiffness. The compression force value of each curve would fall sharply when a curve reached its peak. The complete loss of the residual strength of damaged laminates will produce this phenomenon. From the CAEI damage scenario of the laminates, the sub-laminates located on the outer layer in the impact area buckled and a specific broken noise was heard simultaneously, and the sub-laminates in the central portion of the laminates were squashed at the end of the time. The ultimate compressive load follows a downward trend with increasing impact energy.
- A finite element simulation method was introduced for predicting the on-edge impact and CAEI. The on-edge impact damage and post-impact compression failure were drawn from the whole process of the numerical model. The intra-laminate failure was modeled with a continuum shell element and judged by the Hashin failure criterion. The inter-laminate interface was modeled by the zero-thickness cohesive element. The impactor of the impact device was modeled using a rigid body. In a general sense, the numerical simulation results are in good agreement with the experimental results.
Author Contributions
Funding
Institutional Review Board Statement
Informed Consent Statement
Data Availability Statement
Acknowledgments
Conflicts of Interest
References
- Ghelli, D.; Minak, G. Low velocity impact and compression after impact tests on thin carbon/epoxy laminates. Compos. Part B Eng. 2011, 42, 2067–2079. [Google Scholar] [CrossRef]
- Shah, S.Z.H.; Karuppanan, S.; Megat-Yusoff, P.S.M.; Sajid, Z. Impact resistance and damage tolerance of fiber reinforced composites: A review. Compos. Struct. 2019, 217, 100–121. [Google Scholar] [CrossRef]
- Umair, M.; Hussain, M.; Abbas, Z.; Shaker, K.; Nawab, Y. Effect of weave architecture and glass microspheres percentage on the low velocity impact response of hemp/green epoxy composites. J. Compos. Mater. 2021, 55, 2179–2195. [Google Scholar] [CrossRef]
- Hussain, M.; Imad, A.; Nawab, Y.; Saouab, A.; Herbelot, C.; Kanit, T. Effect of matrix and hybrid reinforcement on fibre metal laminates under low–velocity impact loading. Compos. Struct. 2022, 288, 115371. [Google Scholar] [CrossRef]
- Zangana, S.; Epaarachchi, J.; Ferdous, W.; Leng, J.; Schubel, P. Behaviour of continuous fibre composite sandwich core under low-velocity impact. Thin-Walled Struct. 2021, 158, 107157. [Google Scholar] [CrossRef]
- Zangana, S.; Epaarachchi, J.; Ferdous, W.; Leng, J. A novel hybridised composite sandwich core with Glass, Kevlar and Zylon fibres—Investigation under low-velocity impact. Int. J. Impact Eng. 2020, 137, 103430. [Google Scholar] [CrossRef]
- Breen, C.; Guild, F.; Pavier, M. Impact damage to thick carbon fibre reinforced plastic composite laminates. J. Mater. Sci. 2006, 41, 6718–6724. [Google Scholar] [CrossRef]
- Malhotra, A.; Guild, F.J.; Pavier, M.J. Edge impact to composite laminates: Experiments and simulations. J. Mater. Sci. 2008, 43, 6661–6667. [Google Scholar] [CrossRef]
- Rhead, A.T.; Marchant, D.; Butler, R. Compressive strength of composite laminates following free edge impact. Compos. Part A Appl. Sci. Manuf. 2010, 41, 1056–1065. [Google Scholar] [CrossRef]
- Thorsson, S.I.; Sringeri, S.P.; Waas, A.M.; Justusson, B.P.; Rassaian, M. Experimental investigation of composite laminates subject to low-velocity edge-on impact and compression after impact. Compos. Struct. 2018, 186, 335–346. [Google Scholar] [CrossRef]
- Thorsson, S.I.; Waas, A.M.; Rassaian, M. Numerical investigation of composite laminates subject to low-velocity edge-on impact and compression after impact. Compos. Struct. 2018, 203, 648–658. [Google Scholar] [CrossRef]
- Li, N.; Chen, P.H. Experimental investigation on edge impact damage and Compression-After-Impact (CAI) behavior of stiffened composite panels. Compos. Struct. 2016, 138, 134–150. [Google Scholar] [CrossRef]
- Li, N.; Chen, P. Prediction of Compression-After-Edge-Impact (CAEI) behaviour in composite panel stiffened with I-shaped stiffeners. Compos. Part B Eng. 2017, 110, 402–419. [Google Scholar] [CrossRef] [Green Version]
- Li, N.; Chen, P. Failure prediction of T-stiffened composite panels subjected to compression after edge impact. Compos. Struct. 2017, 162, 210–226. [Google Scholar] [CrossRef] [Green Version]
- Ostré, B.; Bouvet, C.; Lachaud, F.; Minot, C.; Aboissière, J. Edge impact damage scenario on stiffened composite structure. J. Compos. Mater. 2015, 49, 1599–1612. [Google Scholar] [CrossRef] [Green Version]
- Ostré, B.; Bouvet, C.; Minot, C.; Aboissière, J. Experimental analysis of CFRP laminates subjected to compression after edge impact. Compos. Struct. 2016, 152, 767–778. [Google Scholar] [CrossRef] [Green Version]
- Ostré, B.; Bouvet, C.; Minot, C.; Aboissière, J. Finite element analysis of CFRP laminates subjected to compression after edge impact. Compos. Struct. 2016, 153, 478–489. [Google Scholar] [CrossRef] [Green Version]
- Arteiro, A.; Gray, P.J.; Camanho, P.P. Simulation of edge impact and compression after edge impact in CFRP laminates. Compos. Struct. 2020, 240, 112018. [Google Scholar] [CrossRef]
- Liu, J.; Xu, Y.; Yi, X.; Wei, T. Experimental and numerical simulation study on Near-edge/On-edge Low-Velocity impact and residual compressive strength of T300/69 laminates. Compos. Struct. 2022, 280, 114887. [Google Scholar] [CrossRef]
- ASTM Committee. ASTM D7136/D7136M; Standard Test Method for Measuring the Damage Resistance of a Fiber-Reinforced Polymer Matrix Composite to a Drop-Weight Impact Event. ASTM International Standards Organization: West Conshohocken, PA, USA, 2020. [CrossRef]
- ASTM Committee. ASTM D7137/D7137M; Standard Test Method for Compressive Residual Strength Properties of Damaged Polymer Matrix Composite Plates. ASTM International Standards Organization: West Conshohocken, PA, USA, 2017. [CrossRef]
- Hashin, Z. Failure criteria for unidirectional fiber composites. J. Appl. Mech. 1980, 47, 329–334. [Google Scholar] [CrossRef]
- Yang, Q.; Cox, B. Cohesive models for damage evolution in laminated composites. Int. J. Fract. 2005, 133, 107–137. [Google Scholar] [CrossRef]
- Wisnom, M.R. The role of delamination in failure of fibre-reinforced composites. Philos. Trans. R. Soc. A Math. Phys. Eng. Sci. 2012, 370, 1850–1870. [Google Scholar] [CrossRef]
- Cantwell, W.J.; Morton, J. The impact resistance of composite materials—A review. Composites 1991, 22, 347–362. [Google Scholar] [CrossRef]
- Rouchon, J. Fatigue and damage tolerance aspects for composite aircraft structures. In Proceedings of the ICAF Symposium, Delft, Atlantic City, NJ, USA, 27–28 June 1995. [Google Scholar]


| E1 (GPa) | E2 (GPa) | ν12 | G12 (GPa) | G13 (GPa) | G23 (GPa) |
|---|---|---|---|---|---|
| 164 | 9.8 | 0.33 | 4.4 | 4.4 | 3.1 |
| XT (MPa) | XC (MPa) | YT (MPa) | YC (MPa) | SXY (MPa) | SYZ (MPa) |
| 3086 | 1492 | 73 | 275 | 96 | 105 |
| Kn (kN/m3) | Ks (kN/m3) | σn (MPa) | σs (MPa) | GⅠC (J/m2) | GⅡC (J/m2) | GⅢC (J/m2) |
|---|---|---|---|---|---|---|
| 2.7 × 10⁶ | 1.1 × 10⁶ | 62 | 82 | 1.1 | 1.3 | 1.3 |
| Specimen Number i = 1,2,3 | Tup Diameter (mm) | Impact Energy (J) |
|---|---|---|
| 4 J-i | 16 | 4 |
| 6 J-i | 16 | 6 |
| 8 J-i | 16 | 8 |
| 10 J-i | 16 | 10 |
| Impact Energy (J) | Specimen Serial | Crack Lengths (mm) | Mean Crack Lengths (mm) | Delaminated Areas (mm2) | Mean Delaminated Areas (mm2) |
|---|---|---|---|---|---|
| 4 | 4 J-1 | 24.69 | 22.81 | 177.73 | 156.02 |
| 4 J-2 | 22.23 | 135.42 | |||
| 4 J-3 | 21.52 | 154.91 | |||
| 6 | 6 J-1 | 24.69 | 27.40 | 191.49 | 228.45 |
| 6 J-2 | 28.22 | 234.38 | |||
| 6 J-3 | 29.28 | 259.50 | |||
| 8 | 8 J-1 | 38.10 | 35.98 | 316.43 | 307.29 |
| 8 J-2 | 38.45 | 361.90 | |||
| 8 J-3 | 31.4 | 243.53 | |||
| 10 | 10 J-1 | 42.69 | 43.74 | 425.60 | 427.68 |
| 10 J-2 | 43.74 | 448.08 | |||
| 10 J-3 | 44.8 | 409.36 |
| Impact Energy (J) | Crack Length | Delaminated Area | ||||
|---|---|---|---|---|---|---|
| Test Results (mm) | Numerical Results (mm) | Error (%) | Test Results (mm2) | Numerical Results (mm2) | Error (%) | |
| 4 | 22.81 | 21.50 | −5.7 | 156.02 | 197.57 | 26.6 |
| 6 | 27.40 | 28.50 | 4.0 | 228.45 | 295.47 | 29.3 |
| 8 | 35.98 | 33.00 | −8.3 | 307.29 | 396.55 | 29.0 |
| 10 | 43.74 | 39.50 | −9.7 | 427.68 | 496.37 | 16.1 |
| Impact Energy (J) | Test Values (MPa) | Numerical Simulative Values (MPa) | Error (%) |
|---|---|---|---|
| 4 | 314.75 | 337.88 | 7.35 |
| 6 | 295.19 | 308.29 | 4.44 |
| 8 | 283.16 | 299.14 | 5.64 |
| 10 | 258.70 | 276.15 | 6.75 |
| Impact Energy (J) | Experimental Results (μ) | Numerical Results (μ) | Error (%) |
|---|---|---|---|
| 4 | 5846 | 6403 | 9.53 |
| 6 | 6102 | 5817 | −4.67 |
| 8 | 5510 | 5656 | −2.65 |
| 10 | 5153 | 5235 | 1.59 |
Publisher’s Note: MDPI stays neutral with regard to jurisdictional claims in published maps and institutional affiliations. |
© 2022 by the authors. Licensee MDPI, Basel, Switzerland. This article is an open access article distributed under the terms and conditions of the Creative Commons Attribution (CC BY) license (https://creativecommons.org/licenses/by/4.0/).
Share and Cite
Xu, W.; Liu, L.; Xu, W. Experiments and Finite Element Simulations of Composite Laminates Following Low Velocity On-Edge Impact Damage. Polymers 2022, 14, 1744. https://doi.org/10.3390/polym14091744
Xu W, Liu L, Xu W. Experiments and Finite Element Simulations of Composite Laminates Following Low Velocity On-Edge Impact Damage. Polymers. 2022; 14(9):1744. https://doi.org/10.3390/polym14091744
Chicago/Turabian StyleXu, Wenjun, Longquan Liu, and Wu Xu. 2022. "Experiments and Finite Element Simulations of Composite Laminates Following Low Velocity On-Edge Impact Damage" Polymers 14, no. 9: 1744. https://doi.org/10.3390/polym14091744
APA StyleXu, W., Liu, L., & Xu, W. (2022). Experiments and Finite Element Simulations of Composite Laminates Following Low Velocity On-Edge Impact Damage. Polymers, 14(9), 1744. https://doi.org/10.3390/polym14091744