Abstract
The detection of toxic insecticides is a major scientific and technological challenge. In this regard, imidacloprid is a neonicotinoid that is a systemic insecticide that can accumulate in agricultural products and affect human health. This work aims to study the properties of chitosan–TiO2 nanocomposites in which nanoparticles with high surface area serve as molecular recognition sites for electroanalytical imidacloprid detection. We show that the best sensitivity to imidacloprid was obtained using a modified electrode with a chitosan–TiO2 nanocomposite with a 40 wt.% of TiO2 nanoparticles. By using a three-phase effective permittivity model which includes chitosan, TiO2, an interface layer between nanoparticles and a matrix, we showed that nanocomposites with 40 wt.% of TiO2 the interface volume fraction reaches a maximum. At higher nanoparticle concentration, the sensitivity of the sensor decreases due to the decreasing of the interface volume fraction, agglomeration of nanoparticles and a decrease in their effective surface area. The methodology presented can be helpful in the design and optimization of polymer-based nanocomposites for a variety of applications.
1. Introduction
Chitosan (CS)–titanium dioxide nanoparticles (TiO2 NPs) composites are one of the most attractive materials which have interesting technological properties and applications. Nanocomposites based upon CS–TiO2 NPs are widely used for: the development of different antibacterial package materials [1], wound healing applications [2,3], photocatalytic applications [4], wastewater treatment [5], different sensors [6], etc.
The most important properties of CS are the presence of reactive amino and hydroxyl side groups which through hydrogen or covalent bond can interact with TiO2 NPs and form nanocomposites with high concentration without NPs agglomeration [6,7].
It is worth noting that most nanocomposite applications are based upon the high effective surface area of the NPs. However, it is difficult to obtain a uniform dispersion of nanoparticles owing to their strong tendency of agglomeration for their high surface energy. Agglomeration of NPs worsens the properties of nanocomposites due to the restriction of surface area [8,9]. In composites based on TiO2 NPs, agglomeration affected their photocatalytic activity [3,10], the conductivity of ion batteries [11], the biological activity of nanocomposites with TiO2 NPs [12], the antimicrobial capacity [1], the adsorption capacities [5], etc.
In recent years, it has become clear that the interface layer formed around nanoparticles in polymer nanocomposites is critical for controlling their dispersion (see, for example, [13,14,15,16,17]). This layer appears when strong molecular interactions between nanoparticles and polymer matrix are present; it occupies a significant volume fraction of the polymer matrix and it exhibits properties that differ from both polymer matrix and NPs [8,10,18]. As a result of these strong molecular interactions, most properties of the nanocomposite significantly depend upon the interphase layer (see, for example [8,9,18,19,20,21,22,23,24,25,26,27]). The experimental and theoretical investigations in the recent years provided a large amount of information about interphase and interfacial interactions in polymer nanocomposites; nevertheless, they focused on dynamic of polymer chains [22,23,24,25], glass transition temperature [26], mechanical properties [8,20,21], adsorption of polymer chains on the nanoparticle surface [27]. However, to the best of our knowledge, there are no publications in the literature that optimizes the concentration of NPs before they agglomerate (or nanocomposites with the largest NP surface area) by considering the effect of the interphase layer. Additionally, there are no reported investigations between of the interface layer in CS–TiO2 nanocomposites.
It is worth noting that chitosan is dielectric material and TiO2 is a high resistivity semiconductor (ca. 1015 Ohm cm) with dielectric constant ca. 100 which dependents upon the polymorphism of NPs [28]. Therefore, dielectric spectroscopy can be advantageously used to determine relevant parameters of the interface layer and the highest concentration of NPs before they agglomerate (decreasing the effective surface area).
Recently, some publications on the use of TiO2 NPs for the development of an electrochemical sensor for the detection of pesticides, including imidacloprid (IMD) are reported [29,30]. IMD is one of the most used neonicotinoids for the crop protection worldwide due to its low soil persistence and high insecticidal activity at a very low application rate [31]. IMD is absorbed by plants via either their roots or leaves and then is transported throughout the tissues of the plants [32]; it may be present in various foods that ultimately affect the human health [29].
Different methods or techniques have been used for the detection and quantification of this insecticide in wastewater. High performance liquid chromatography, gas chromatography–mass spectrometry, liquid chromatography mass spectrometry and optical technique are commonly used methods for the detection of IMD. These instrumental methods are accurate but expensive and time consuming, requiring lengthy sample extraction and cleanup procedures [29,33,34]. On the other hand, nitro-group of IMD can be reduced electrochemically at a negative potential. Therefore, due to electro-activity of IMD, several electrochemical methods were reported for the detection of IMD using different electrodes modified by polymer–NPs composites [30]. The electrochemical sensor and biosensor platforms have emerged as powerful analytical methods to detect pesticides due to ease of detection and appreciable sensitivity [35]. However, to the best of our knowledge, there are no reports about the electroanalytical determination of IMD using electrodes modified by CS–TiO2 NPs nanocomposites. Due to interaction of CS with TiO2 NPs and the formation of interface layer which prevents the agglomeration of NPs at relative high concentration, we propose that such modified electrode will offer high surface area and enhance the accessibility of IMD to the recognition NPs sites. Thus, we expect that the agglomeration will be affected on sensibility of CS–TiO2 sensor for detection of imidacloprid.
Based upon the above, this work aims to investigate the properties of CS–TiO2 films as a function of the concentration of NPs by considering an interface layer formation, and to shed light about the development of a sensor for electroanalytical detection of IMD.
2. Materials and Methods
Chitosan (CS), medium molecular weight (ca. 350 kDa), deacetylation ca. 72%, acetic acid (99.7%), and TiO2 NPs with dimension between 20–40 nm was purchased from Chemours Co. (Mexico City, Mexico), and used as received.
2.1. Preparation of Films
The films were cast by dissolving 1% w/w of chitosan in 1% w/w aqueous acetic acid solution with continuous magnetic stirring for 24 h. Different concentration of TiO2 nanoparticles were dispersed within the chitosan solution for 3 h. Then, each solution with different concentration of TiO2 nanoparticles was placed on the ultrasonic tip for 10 min with intervals of 3 min and pulses of 5 s to avoid heating the solution. This solution was poured into a Petri dish and allowed to evaporate at 60 °C for 18 h to obtain the chitosan acetate films. The neutralization of acetate film was done with aqueous ammonia solution 2 mol/dm3. The initial pH was ca. 3.7–4. For impedance measurements, CS–TiO2 films were gold-sputtered on both sides to serve as contacts.
2.2. Preparation of Working Electrode
The glassy carbon electrodes (GCE) were hand polished with 0.3 and 0.1 µm alumina slurries, washed under ultrasound for 5 min with ethanol, and dried in air oven for 2 h at 60 °C. An aliquot of 7 µL of each chitosan–TiO2 solution prepared for films was taken. This aliquot was deposited on the surface of each GCE. The electrodes were dried in air for 3 h and a uniform film was formed over each electrode surface. In total, 6 electrodes were modified with CS–TiO2 at each TiO2 concentration, 1 electrode modified with CS, and the GCE electrode used as a target.
2.3. Characterization
The crystalline structure of TiO2 NPs and CS–TiO2 films were tested by an X-ray diffractometer (Rigaku Dmax 2100, Austin, TX, USA) with Cu Kα radiation (λ = 0.154 nm).
The interaction between CS functional groups with TiO2 NPs was analyzed by FTIR measurements on a Perkin Elmer Spectrum GX spectrophotometer using ATR (MIRacle™, Madison, WI, USA) sampling technique, with a diamond tip, in the range from 4000 to 1000 cm−1 at room temperature.
The amount of free water was determined by thermogravimetric analysis (TGA) (TGA 4000—PerkinElmer; PerkinElmer, Inc., Waltham, MA, USA). Measurements were made in the dry air with a heating rate of 10 °C/min.
Impedance measurements were carried out using Agilent 4249 A in the frequency range 40 Hz–100 MHz with an amplitude of AC voltage 100 mV at room temperature. The dielectric constant of nanocomposites has been calculated from impedance spectra using ZView program from the following relationship: ε = (C·d)/(ε0·S), where C is capacitance measured at the frequency 100 Hz, d and S are the thickness and area of samples, respectively. Film thickness was measured in each sample using micrometer Mitutoyo with resolution 1 mkm.
Voltammetry cyclic measurements were performed using a potentiostat–galvanostat VoltaLab PGZ301 (Radiometer analytical), and a conventional three-electrode cell at room temperature. The CS/TiO2 modified GCE electrodes were used for electrochemical experiments as working electrode, Ag/AgCl electrode was used as reference electrode and platinum plaque was used as a counter electrode. The cell electrochemical was covered with black tape to avoid photocatalytic effect. Na2SO4 0.05 M was used as electrolyte and the imidacloprid concentrations were of 10, 50, 100, 250 and 500 ppm, this last concentration according with the imidacloprid solubility. The potential range was established between −1.8 and −0.1 V, scan rate of 150 mV/s and, prior to use, the working electrode was stabilized through 10 continuous repetitive cyclic voltammograms running, to obtain a stable and reproducible background current. All experiments were carried out with solutions previously deaerated with a stream of N2 gas bubbled in the solution for 10 min.
3. Results and Discussion
3.1. Morphology
According to SEM measurements the most of NPs have dimension between 18 and 38 nm. SEM images recorded from of CS–TiO2 nanocomposites films with 10 wt.% and 30 wt.% show homogeneous distribution of NPs (Figure 1a,b) in CS matrix. In contrast, the films with 50 wt.% agglomeration is observed (Figure 1c). This behavior plays an important role in the explaining structural properties of nanocomposites and their application.
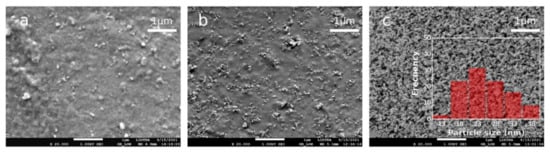
Figure 1.
SEM images of CS–TiO2 nanocomposites films with (a) 10 wt.% of TiO2 NPs, (b) 30 wt.% of TiO2 NPs and (c) 50 wt.% of TiO2 NPs. Insert on Figure 1c shows NPs distribution.
3.2. XRD
Figure 2 shows XRD patterns of TiO2 NPs and CS–TiO2 NPs composite film with 40 wt.% of NPs. The XRD pattern of pure TiO2 NPs showed diffraction peaks and confirm the presence of anatase (JCPDS PDF#21-1272) and rutile phases (JCPDS PDF#21-1276) which often observed in TiO2 powder (see, for example [36,37]). In the pattern of CS–TiO2 films, additionally to diffraction peaks of anatase and rutile observed broad peak related to amorphous CS (between 8–18 degree).
The quantification and refinement of the volume fraction of every crystalline phase was carried out by the Rietveld method implemented in the Fullprof software; this allows to calculate the volume fraction of every phase (68.5% of anatase and 31.5% of rutile). This estimation is important for the appropriate interpretation of dielectric measurements (see Section 3.5).
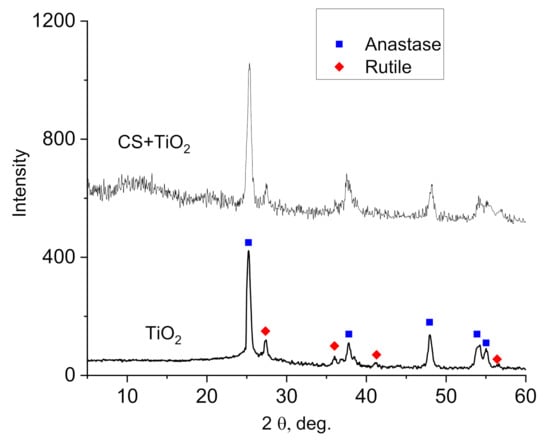
Figure 2.
XRD pattern of TiO2 NPs and CS–TiO2 film with 40 wt.% of NPs.
3.3. FTIR
FTIR spectroscopy was used to observe the interactions between the chitosan and TiO2 NPs. In the case of neat CS, the spectrum shows the characteristics bands reported by other authors [38,39]: the broadband characteristic peak centered at 3322 cm−1 correspondents to the overlap of stretching vibration of -NH and -OH groups of CS, and peak at 1562 cm−1 related to bending vibration of NH2 group. In CS–TiO2 films, these peaks shift from 3322 cm−1 and 1562 cm−1 to 3269 and 1547 cm−1 wavenumbers (Figure 3).
The shift of characteristic peaks in FTIR measurements are due to the interaction between CS reactive amino and hydroxyl groups with TiO2 NPs. Other studies have proposed a different mechanism of interaction including chelation [7,40,41]; the formation multiple coordination bonds between organic molecules and metals; interaction of CS side groups with Ti ions on TiO2 surface [42]; covalent interaction between CS and TiO2 [43]; electrostatic interaction between negative charge of CS carboxyl groups and TiO2 positive charge [44].
Another possible mechanism of the interaction between CS and NPs can be related to the dissociation of water on the surface sites or defects of TiO2 and the formation of two different OH functional groups at the surface of NPs [45,46]. These groups are responsible to interaction of TiO2 with lateral groups of CS. The most important thing for us is the presence of interaction between CS and TiO2 NPs, which is responsible for the formation of an interface layer surrounding NPs. The properties of this interphase layer will be discussed in the next section. In addition, a decrease in the intensity of the band centered at 3322–3269 cm−1 demonstrates a decrease in the water absorption capacity with an increase in the concentration of NPs in the films (decrease in intensity).
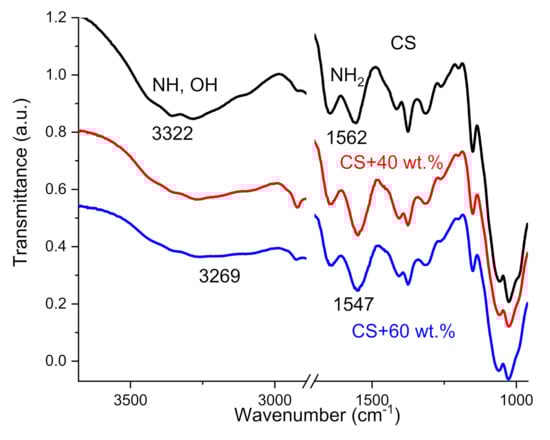
Figure 3.
FTIR spectra of neat CS film and CS–TiO2 films with 40 and 60 wt.% of NPs.
3.4. TGA
The interaction between CS side groups with TiO2 NPs precludes water absorption capacity and it is supported by TGA measurements (Figure 3). Water absorption in CS is closely linked to the availability of amino and hydroxyl groups of CS interact via hydrogen bond with water molecules [47,48]. It was shown that the water content depends upon TiO2 NPs concentration (Figure 4) and decreases with increasing weight % of NPs (10.9% in neat CS and 7.1% in CS–TiO2 film with 60 wt.% of NPs, at the temperature 150 °C). As it was shown by FTIR analysis, CS lateral groups can be bond with OH groups on the surface of NPs that is responsible for decreasing of water content in the nanocomposite films.
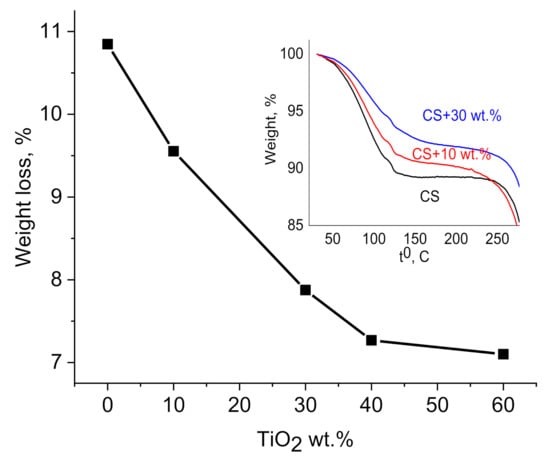
Figure 4.
Dependence of weight loss in CS–TiO2 films on NPs wt.% measured at the temperature 150 °C. Insert shows TGA measurements of pure CS and CS–TiO2 NPs films with 10 and 30 wt.% of NPs.
3.5. Dielectric Measurements
Due to the difference between dielectric constant of CS matrix and TiO2 NPs, the dielectric spectroscopy measurements can be used for the determination of parameters of the interface layer and the highest concentration of NPs before they agglomerate (decreasing effective surface area).
In the literature have been proposed a three-phase model to describe the dielectric properties of polymer–dielectric NPs composites [49,50]. Here, the effective dielectric constant of such composite materials depends upon the εm of the polymer matrix, the εNPs of NPs, and the εint of interface layer between filler and the dielectric matrix. To describe such three-phase system, Refs. [49,50] introduce a parameter K, termed the interface volume constant, which accounted for the matrix–filler interaction strength as:
where Φint, ΦNPs and Φm are the volume fractions of interface phase, dielectric particles and polymer matrix, respectively. K depends upon the degree of particle clustering. A value of zero for K indicates that there is no interracial phase region between the NPs and polymer matrix. Positive values for K are related to an interaction between the polymer and NPs.
This model has demonstrated that the dependence of the dielectric constant on NPs concentration is nonmonotonic and in dependence of interface volume fraction as function of NPs concentration can observed extremum due to an overlap of interface layers and NPs agglomeration.
Before fitting, experimental dependence of effective dielectric constant of nanocomposite is necessary to recalculate the weight fraction of TiO2 NPs (Wt) in their volume fraction ΦNPs using next equation [51]:
where, ρTiO2 and ρCS denote the TiO2 and CS density.
The density of CS films is ca. 1.5 g cm−3 [52,53]. TiO2 NPs, according to XRD measurements, have two phases (68.5% of anatase with density ρanat = 3.78 g/cm3 and 31.5% of rutile with density ρrut = 4.23 g/cm3) [54]. Using simple mixture rule, the density of TiO2 NPs can be calculated [51]:
Next important value for fitting experimental dependence is effective dielectric constant of TiO2 NPs (εNPs). This effective dielectric constant of TiO2 NPs can be estimated using Lichtenecher logarithmic model [55,56]:
where Φanat and Φrut represent the volume fraction of anatase and rutile, respectively.
Taking data εanat = 75 and εrut = 105 [56], the effective dielectric constant of TiO2 NPs is equal 82.5.
This value well correlates with dielectric constant (ca. 100) measures at the frequency 100 Hz on pellets consist of TiO2 NPs [57,58,59]. Therefore, dielectric constant of nanocomposites has been measured at the frequency 100 Hz.
In this work, we fit the model of effective dielectric constant
proposed in Refs. [35,36] to experimentally obtained values of effective dielectric constant of CS–TiO2 composite . The least squares fitting is performed using a standard function of genetic algorithm optimization in the Scilab [60]. The fitting error is specified as the sum of the squares of the differences between the dielectric constants predicted by the model and obtained in result of N measurements.
The dependence of the fitting error E(K, εint) on interphase volume constant K and interphase dielectric constant εint is shown in Figure 5.
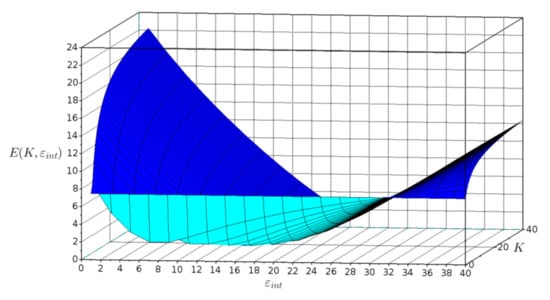
Figure 5.
Plot of fitting error E(K, εint) versus interphase volume constant K and interphase dielectric constant εint.
The graph shows that the function is not unimodal. This fact helped determine the selection of the genetic algorithm as an optimization method.
Dielectric constant of CS has been obtained from measurements on neat CS films. Dielectric constant of TiO2 was taken 82.5 (calculated using Equation (4)). Only the values of K and εint are the adjustable parameters. In the process of fitting the program found the optimum values of K and εint at the minimum value of fitting error. As a result of optimization, the fitted values are K = 15, εint = 19.7 and fitting error E(K, εint) = 1.25.
Figure 6 shows the dependencies of the dielectric constant obtained in CS–TiO2 films at the frequency 100 Hz with different NPs concentration (points). Results of the referred fittings are shown on Figure 5 as continuous line. One can observe that this three-phase model fits well with the experimental results. Positive values of K mean that there is significant interface in CS–TiO2 interactions. The value of interface dielectric constant is less than ε of neat CS. The low value of εint can be related to the interaction of CS lateral groups with OH groups on the surface of NPs that is responsible for the decreasing of water content in the interface layer.
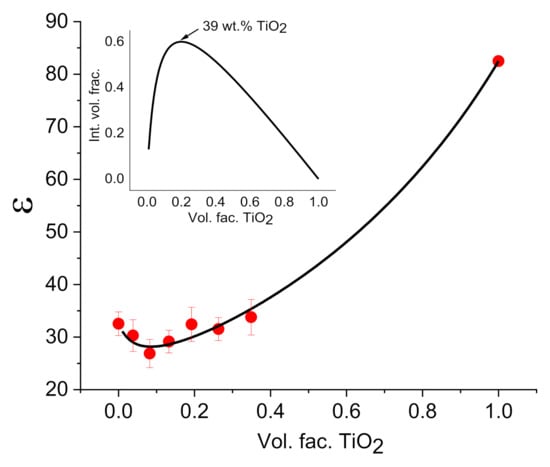
Figure 6.
Dependence of the dielectric constant obtained in CS–TiO2 films at the frequency 100 Hz with different NPs concentration (points). Continuous line shows the results of fitting. Bars represent the standard deviation calculated from measurements on 4 samples. Insert shows the dependence of interface volume fraction on TiO2 volume fraction calculated using models proposed in [49,50].
However, the most important result of fitting is shown on the insert of Figure 6: dependence of interface volume fraction of nanocomposite on TiO2 NPs volume fraction. This dependence demonstrates maximum at the concentration of TiO2 at ca. 39 wt.%. At higher concentration of NPs, interface volume fraction decreases due to agglomeration of NPs, which is well observed in SEM measurements (Figure 1c). Thus, it can be assumed that an electrode with CS–TiO2 films with 40 wt.% NPs will demonstrate better sensitivity to imidacloprid, since at a higher concentration, due to NPs agglomeration, the surface area of NPs will decrease.
3.6. Cyclic Voltammetry Measurements
Figure 7 shows the redox behavior voltamperograms of imidacloprid measured on the electrodes modified by CS–TiO2 nanocomposites films with different concentration of TiO2 NPs.
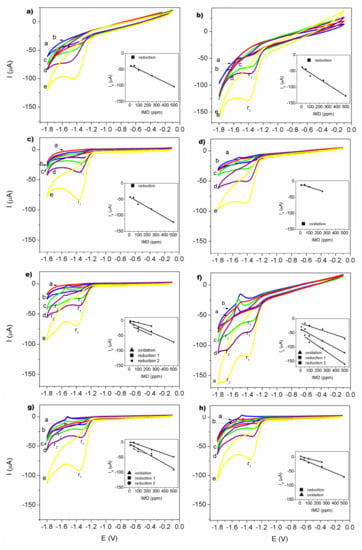
Figure 7.
Cyclic voltammograms obtained for IMD on electrodes: (a) GCE; (b) GCE modified by CS; (c) GCE modified by CS-TiO2 film with 10 wt.% of NPs; (d) GCE modified by CS-TiO2 film with 20 wt.% of NPs; (e) GCE modified by CS–TiO2 film with 30 wt.% of NPs; (f) GCE modified by CS-TiO2 film with 40 wt.% of NPs; (g) GCE modified by CS–TiO2 film with 50 wt.% of NPs; (h) GCE modified by CS-TiO2 film with 60 wt.% of NPs. Measurements were carried out at 150 mVs−1 in 0.05 M Na2SO4 as supporting electrolyte, pH = 7. Each cycle corresponding to the different concentrations: a-10, b-50, c-100, d-250, e-500 ppm. Inserts show relationship between peak current of reduction and/or oxidation vs IMD concentration.
For all redox behavior, the plot of peak current (Ip) versus the respective concentration of IMD was found to be linear in the range 10–500 ppm (3.9 × 10⁻⁵–2 × 10⁻³ mol/L) as shown in the insets in Figure 5. The cathodic peak can be observed at a value of −1.42 ± 0.048 V for GCE and −1.36 ± 0.03 V for the GCE/CS electrode. It can be observed that in the electrode of low concentration of TiO2 nanoparticles at 10 wt.%, it is evident that, during the cathodic scan, a single reduction peak was observed at a potential of −1.3 ± 0.025 V. The noted cathodic process is derived from the nitro-group irreversible reduction of imidacloprid [33,61,62,63]. In the case of the electrode GCE/CS–TiO2 20 wt.% only the reduction of the IMD to 500 ppm was observed in −1.42 V and its oxidation value was presented for the lowest concentrations in −1.52 V. For electrodes with CS–TiO2 with 30, 40, 50 and 60 wt.% the reduction and oxidation of the imidacloprid was observed, this indicates the reversibility of the electrode in the behavior redox measurement. However, for electrodes with CS–TiO2 30 wt.%, CS–TiO2 40% wt.% and CS–TiO2 50 wt.%, one can see the appearance of two peaks of reduction: one at −1.663 V and another at −1.351 V. This the second peak is clearly observed at concentrations of 50, 100 and 250 ppm of IMD. At the electrode with 40 wt.% of TiO2 nanoparticles, the second peak of reduction is more visible except for the low concentration of 10 ppm. This second reduction peak had already been reported by Navalon et al. [64] through of differential pulse polarographic method. Thus, it was able to propose an overall reduction mechanism for each of the two imidacloprid reduction peaks. For the first peak, the nitro group of the imidacloprid molecule takes four electrons to give the corresponding hydroxylamine derivative and then in the second reduction peak this compound takes two electrons to be transformed in the corresponding amine derivative.
The limit of detection (LOD) and the limit of quantitation (LOQ) (Table 1) were calculated from using the equations: LOD = 3 sd/m and LOQ = 10 sd/m, where sd is the standard deviation of the intercept and m is the slope of the calibration curve [65].

Table 1.
Analytical parameters for the determination of IMD on different electrodes.
The reported detection limit was in the same order for all electrodes and compared to other modified electrodes reported in the literature [33,65,66,67,68]. However, the electrode modified by CS–TiO2 film with 40 wt.% presents the best sensitivity to imidacloprid compare with another investigate (Table 2) modified electrodes because it detects two peaks of reduction, and its current values are higher above −150 µA.
Table 2.
Comparison of different electrodes in the detection of IMD.
Hg(Ag) FE, Silver-amalgam film electrode; BDD, Boron-Doped Diamond; CPE, carbon-paste electrode; GCE, glassy carbon electrode; nAgnf/nTiO2nf/GCE, nanosilver Nafion®/nanoTiO2 Nafion® modified glassy carbon electrode; PCz/CRGO/GCE, poly(carbazole)/chemically reduced graphene oxide modified glassy carbon electrode; BiFE, Bismuth-film electrode.
4. Conclusions
In this paper, for the first time, we propose the potential application of chitosan–TiO2 nanocomposites for the development of an electroanalytical sensor to detect imidacloprid with high sensitivity. Preliminary studies of imidacloprid detection show that the best results are obtained on a modified electrode with CS–TiO2 NPs with 40 wt.% of NPs. According to dielectric spectroscopy measurements on the nanocomposite, the dependence of the dielectric constant on NPs concentration is nonmonotonic. By using a three-phase model which includes: (1) CS matrix, (2) TiO2 NPs and (3) interface layer between NPs and CS matrix and by fitting dielectric spectroscopy measurements, the interface volume fraction was calculated. The highest calculated interface volume fraction is 39 wt.% of NPs which is practically the same value at which the best performance of the nanocomposite is observed. Our results strongly suggest that the interface layer is responsible for the good dispersion of NPs in chitosan matrix without agglomeration. At higher NPs concentration, the interface volume fraction decreases due to their overlap that leads to NPs agglomeration which ultimately decreases their effective surface area. TiO2 nanoparticles serve as molecular recognition sites for electroanalytical imidacloprid detection; therefore, their agglomeration decreases the sensitivity of imidacloprid detection.
The construction of such a sensor requires additional investigation. However, the methodology presented in this work, which allows to determine the optimum NPs concentration, may prove useful in the design and optimization of polymer-based nanocomposites for development nanocomposite for different applications.
Author Contributions
B.E.C.: investigation, writing—original draft preparation; E.P.: conceptualization, investigation, writing—original draft preparation, review and editing; G.L.-B.: writing—review and editing; Y.K.: software, simulation. All authors have read and agreed to the published version of the manuscript.
Funding
This research was funded and supported by CONACYT, Mexico (grant A1-S-9557).
Institutional Review Board Statement
Not applicable.
Informed Consent Statement
Not applicable.
Data Availability Statement
Not applicable.
Acknowledgments
The authors are grateful to J.A. Muñoz Salas for technical assistance in electrical measurements, R.A. Mauricio-Sánchez for assistance in FTIR measurements, M.A. Hernandez Landaverde for assistance in XRD measurements, E. Urbina Alvarez for assistance in SEM measurements and Ma. Carmen Delgado Cruz for assistance in TGA measurements.
Conflicts of Interest
The authors declare no conflict of interest.
References
- Babaei-Ghazvini, A.; Acharya, B.; Korber, D.R. Antimicrobial Biodegradable Food Packaging Based on Chitosan and Metal/Metal-Oxide Bio-Nanocomposites: A Review. Polymers 2021, 13, 2790. [Google Scholar] [CrossRef] [PubMed]
- Bui, V.K.H.; Park, D.; Lee, Y.C. Chitosan Combined with ZnO, TiO2 and Ag Nanoparticles for Antimicrobial Wound Healing Applications: A Mini Review of the Research Trends. Polymers 2017, 9, 21. [Google Scholar] [CrossRef] [PubMed] [Green Version]
- Gobi, R.; Ravichandiran, P.; Babu, R.S.; Yoo, D.J. Biopolymer and Synthetic Polymer-Based Nanocomposites in Wound Dressing Applications: A Review. Polymers 2021, 13, 1962. [Google Scholar] [CrossRef] [PubMed]
- Razzaz, A.; Ghorban, S.; Hosayni, L.; Irani, M.; Aliabadi, M. Chitosan nanofibers functionalized by TiO2 nanoparticles for the removal of heavy metal ions. J. Taiwan Inst. Chem. Eng. 2016, 58, 333–343. [Google Scholar] [CrossRef]
- Wang, X.; Li, Z.; Wu, Y.; Guo, H.; Zhang, X.; Yang, Y.; Mu, H.; Duan, J. Construction of a Three-Dimensional Interpenetrating Network Sponge for High-Efficiency and Cavity-Enhanced Solar-Driven Wastewater Treatment. ACS Appl. Mater. Interfaces 2021, 13, 10902–10915. [Google Scholar] [CrossRef] [PubMed]
- Khan, R.; Dhayal, M. Nanocrystalline bioactive TiO2–chitosan impedimetric immunosensor for ochratoxin-A. Electrochem. Commun. 2008, 10, 492–495. [Google Scholar] [CrossRef]
- Ananpattarachai, J.; Kumket, P.; Tung, T.V.; Kajitvichyanukul, P. Chromium (VI) removal using nano-TiO2/chitosan film in photocatalytic system. Int. J. Environ. Waste Manag. 2015, 16, 55–70. [Google Scholar] [CrossRef]
- Ashraf, M.A.; Peng, W.; Zare, Y.; Rhee, K.Y. Effects of Size and Aggregation/Agglomeration of Nanoparticles on the Interfacial/Interphase Properties and Tensile Strength of Polymer Nanocomposites. Nanoscale Res. Lett. 2018, 13, 214. [Google Scholar] [CrossRef] [PubMed]
- Zare, Y.; Rhee, K.Y.; Hui, D. Influences of nanoparticles aggregation/agglomeration on the interfacial/interphase and tensile properties of nanocomposites. Compos. B 2017, 122, 41–46. [Google Scholar] [CrossRef]
- Wongaree, M.; Chiarakorn, S.; Chuangchote, S. Photocatalytic Improvement under Visible Light in TiO2 Nanoparticles by Carbon Nanotube Incorporation. J. Nanomater. 2015, 2015, 689306. [Google Scholar] [CrossRef] [Green Version]
- Qin, G.; Zhang, H.; Wang, C. Ultrasmall TiO2 nanoparticles embedded in nitrogen doped porousgraphene for high rate and long life lithium ion batteries. J. Power Sour. 2014, 272, 491–500. [Google Scholar] [CrossRef]
- Jastrzębska, A.; Kurtycz, P.; Olszyna, A.; Karwowska, E.; Miaśkiewicz-Pęska, E.; Załęska-Radziwiłł, M.; Doskocz, N.; Basiak, D. The Impact of Zeta Potential and Physicochemical Properties of TiO2-Based Nanocomposites on Their Biological Activity. Int. J. Appl. Ceram. Technol. 2015, 12, 1157–1173. [Google Scholar] [CrossRef]
- Pandey, J.C.; Singh, M. Dielectric polymer nanocomposites: Past advances and future prospects in electrical insulation perspective. SPE Polym. 2021, 2, 236–256. [Google Scholar] [CrossRef]
- Sattar, M.A. Interface Structure and Dynamics in Polymer-Nanoparticle Hybrids: A Review on Molecular Mechanisms Underlying the Improved Interfaces. ChemistrySelect 2021, 6, 5068–5096. [Google Scholar] [CrossRef]
- Pitsa, D.; Danicas, D. Interfaces features in polymer nanocomposites: A review of proposed models. Nano 2011, 6, 497–508. [Google Scholar] [CrossRef]
- Sun, W.; Mao, J.; Wang, S.; Zhang, L.; Cheng, Y. Review of recent advances of polymer based dielectrics for high-energy storage in electronic power devices from the perspective of target applications. Front. Chem. Sci. Eng. 2021, 15, 18–34. [Google Scholar] [CrossRef]
- Nioua, Y.; Aribou, N.; Boukheir, S.; Achour, M.E.; Costa, L.C. Interphase approach for modeling the DC conductivity of diverse allotropic types of carbon-reinforced polymer composites. J. Reinf. Plast. Comp. 2020, 1. [Google Scholar] [CrossRef]
- Peng, W.; Rhim, S.; Zare, Y.; Rhee, K.Y. Effect of “Z” Factor for Strength of Interphase Layers on the Tensile Strength of Polymer Nanocomposites. Polym. Compos. 2019, 40, 1117–1122. [Google Scholar] [CrossRef]
- Zare, Y.; Rhee, K.Y. Dependence of Z Parameter for Tensile Strength of Multi-Layered Interphase in Polymer Nanocomposites to Material and Interphase Properties. Nanoscale Res. Lett. 2017, 12, 42. [Google Scholar] [CrossRef] [Green Version]
- Zare, Y.; Rhee, K.Y. Simulation of Young’s modulus for clay-reinforced nanocomposites assuming mechanical percolation, clay-interphase networks and interfacial linkage. J. Mater. Res. Technnol. 2020, 9, 12473–12483. [Google Scholar] [CrossRef]
- Zare, Y.; Rhee, K.Y. Simulation of tensile modulus of polymer carbon nanotubes nanocomposites in the case of incomplete interfacial bonding between polymer matrix and carbon nanotubes by critical interfacial parameters. Polymer 2020, 191, 122260. [Google Scholar] [CrossRef]
- Ginzburg, V.V.; Hall, L.M. Theory and Modeling of Polymer Nanocomposites; Springer: New York, NY, USA, 2021. [Google Scholar]
- Kashfipour, M.A.; Mehra, N.; Zhu, J. A review on the role of interface in mechanical, thermal, and electrical properties of polymer composites. Adv. Comp. Hybrid Mat. 2018, 1, 415–439. [Google Scholar] [CrossRef]
- Popov, I.; Carroll, B.; Bocharova, V.; Genix, A.C.; Cheng, S.; Khamzin, A.; Kisliuk, A.; Sokolov, A.P. Strong Reduction in Amplitude of the Interfacial Segmental Dynamics in Polymer Nanocomposites. Macromolecules 2020, 53, 4126–4135. [Google Scholar] [CrossRef]
- Bailey, E.J.; Winey, K.I. Dynamics of polymer segments, polymer chains, and nanoparticles in polymer nanocomposite melts: A review. Prog. Polym. Sci. 2020, 105, 101242. [Google Scholar] [CrossRef]
- Cheng, S.; Carroll, B.; Bocharova, V.; Carrillo, J.M.Y.; Sumpter, B.G.; Sokolov, A.P. Focus: Structure and dynamics of the interfacial layer in polymer nanocomposites with attractive interactions. J. Chem. Phys. 2017, 146, 203201. [Google Scholar] [CrossRef]
- Nikfar, N.; Esfandiar, M.; Shahnazari, M.R.; Mojtahedi, N.; Zare, Y. The reinforcing and characteristics of interphase as the polymer chains adsorbed on the nanoparticles in polymer nanocomposites. Colloid Polym. Sci. 2017, 295, 2001–2010. [Google Scholar] [CrossRef]
- Ali, I.; Suhail, M.; Alothmanc, Z.A.; Alwarthanc, A. Recent advances in syntheses, properties and applications of TiO2 nanostructures. RSC Adv. 2018, 8, 30125–30147. [Google Scholar] [CrossRef] [Green Version]
- Ghodsi, J.; Rafati, A.A. A novel molecularly imprinted sensor for imidacloprid pesticide based on poly(levodopa) electro-polymerized/TiO2 nanoparticles composite. Anal. Bioanal. Chem. 2018, 410, 7621–7633. [Google Scholar] [CrossRef]
- Mahmoudpour, M.; Torbati, M.; Mousavi, M.M.; de la Guardia, M.; Dolatabadi, J.E.N. Nanomaterial-based molecularly imprinted polymers for pesticides detection: Recent trends and future prospects. TrAC Trends Anal. Chem. 2020, 129, 115943. [Google Scholar] [CrossRef]
- Chao, S.L.; Casida, J.E. Interaction of Imidacloprid Metabolites and Analogs with the Nicotinic Acetylcholine Receptor of Mouse Brain in Relation to Toxicity. Pestic. Biochem. Physiol. 1997, 58, 77–88. [Google Scholar] [CrossRef]
- Sumon, K.A.; Ritika, A.K.; Peeters, E.T.; Rashid, H.; Bosma, R.H.; Rahman, M.S.; Fatema, M.K.; Van den Brink, P.J. Effects of imidacloprid on the ecology of sub-tropical freshwater microcosms. Environ. Pollut. 2018, 236, 432–441. [Google Scholar] [CrossRef] [PubMed]
- Brahim, B. Determination of ultra-trace amounts of neonicotinoid insecticide imidacloprid by cyclic and square wave voltammetric methods using pretreated glassy carbon electrode. Glob. Nest J. 2018, 20, 628–636. [Google Scholar] [CrossRef] [Green Version]
- Umapathi, R.; Sonwal, S.; Lee, M.J.; Rani, G.M.; Lee, E.-S.; Jeon, T.-J.; Kang, S.-M.; Oh, M.-H.; Huh, Y.S. Colorimetric based on-site sensing strategies for the rapid detection of pesticides in agricultural foods: New horizons, perspectives, and challenges. Coord. Chem. Rev. 2021, 446, 214061. [Google Scholar] [CrossRef]
- Umapathi, R.; Ghoreishian, S.M.; Sonwal, S.; Rani, G.M.; Huh, Y.S. Portable electrochemical sensing methodologies for on-site detection of pesticide residues in fruits and vegetables. Coord. Chem. Rev. 2022, 453, 214305. [Google Scholar] [CrossRef]
- Anjali, K.K.; Maheswari, A.U.; Sivakumar, M. Size Dependent Dielectric Properties of TiO2 Nanoparticles. Key Eng. Mat. 2020, 833, 147–151. [Google Scholar] [CrossRef]
- Mallakpour, S.; Madania, M. Effect of Functionalized TiO2 on Mechanical, Thermal and Swelling Properties of Chitosan-Based Nanocomposite Films. Polym. Plast. Technol. Eng. 2015, 54, 1035–1042. [Google Scholar] [CrossRef]
- Mauricio-Sánchez, R.A.; Salazar, R.; Luna-Bárcenas, G.; Mendoza-Galván, A. FTIR spectroscopy studies on the spontaneous neutralization of chitosan acetate films by moisture conditioning. Vib. Spectrosc. 2018, 94, 1–6. [Google Scholar] [CrossRef]
- Lu, S.; Song, X.; Cao, D.; Chen, Y.; Yao, K. Preparation of Water-Soluble Chitosan. J. Appl. Polym. Sci. 2004, 91, 3497–3503. [Google Scholar] [CrossRef]
- Karthikeyana, K.T.; Nithya, A.; Jothivenkatachalam, K. Photocatalytic and antimicrobial activities of chitosan-TiO2nanocomposite. Int. J. Biol. Macromol. 2017, 104, 1762–1773. [Google Scholar] [CrossRef]
- Palacio-Marquez, A.; Ramírez-Estrada, C.A.; Gutierrez-Ruelas, N.J.; Sanchez, E.; Ojeda-Barrios, D.L.; Chavez-Mendoza, C.; Sida-Arreola, J.P. Efficiency of foliar application of zinc oxide nanoparticles versus zinc nitrate complexed with chitosan on nitrogen assimilation, photosynthetic activity, and production of green beans (Phaseolus vulgaris L.). Sci. Hortic. 2021, 288, 110297. [Google Scholar] [CrossRef]
- Ramasamy, S. Organic photosensitizers containing fused indoleimidazole ancillary acceptor with triphenylamine donor moieties for efficient dye-sensitized solar cells. Int. J. Hydrog. Energy 2021, 46, 3475–3483. [Google Scholar] [CrossRef]
- Cheng, L.; Hao, Y.; Song, X.; Chang, Q. Effects of Chitosan and Nano Titanium Dioxide on the Mechanical, Physicochemical and Antibacterial Properties of Corn Starch Films. J. Macromol. Sci. Part B 2021, 60, 616–630. [Google Scholar] [CrossRef]
- Hussein, E.M.; Desoky, W.M.; Hanafy, M.F.; Guirguis, O.W. Effect of TiO2 nanoparticles on the structural configurations and thermal, mechanical, and optical properties of chitosan/TiO2 nanoparticle composites. J. Phys. Chem. Solids 2021, 152, 109983. [Google Scholar] [CrossRef]
- Orlando, F.; Artiglia, L.; Yang, H.; Kong, X.; Roy, K.; Waldner, A.; Chen, S.; Bartels-Rausch, T.; Ammann, M. Disordered Adsorbed Water Layers on TiO2 Nanoparticles under Subsaturated Humidity Conditions at 235 K. J. Phys. Chem. Lett. 2019, 10, 7433–7438. [Google Scholar] [CrossRef] [PubMed] [Green Version]
- Soria, F.A.; Di Valentin, C. Reactive molecular dynamics simulations of hydration shells surrounding spherical TiO2 nanoparticles: Implications for proton-transferreactions. Nanoscale 2021, 13, 4151–4166. [Google Scholar] [CrossRef] [PubMed]
- Gonzalez-Campos, B.; Prokhorov, E.; Luna-Barcenas, G.; Sanchez, I.C.; Lara-Romeo, J.; Mendoza-Durante, M.E.; Villaseñor, F.; Guevara-Olvera, L. Chitosan/Silver Nanoparticles Composite: Molecular Relaxations Investigation by Dynamic Mechanical Analysis and Impedance Spectroscopy. J. Polym. Sci. B 2010, 48, 739–748. [Google Scholar] [CrossRef]
- Corazzari, I.; Nistico, R.; Turci, F.; Faga, M.G.; Franzoso, F.; Tabasso, S.; Magnacca, G. Advanced physico-chemical characterization of chitosan means of TGA coupled on-line with FTIR and GCMS: Thermal degradation and water adsorption capacity. Polym. Degrad. Stab. 2015, 112, 1121–1129. [Google Scholar] [CrossRef]
- Vo, H.T.; Shi, F.G. Towards model-based engineering of optoelectronic package materials: Dielectric constant modeling. Microelectron. J. 2002, 33, 409–415. [Google Scholar] [CrossRef]
- Todd, M.G.; Shi, F.G. Characterizing the interphase dielectric constant of polymer composite materials: Effect of chemical coupling agents. J. Appl. Phys. 2003, 94, 4551–4557. [Google Scholar] [CrossRef]
- Rafiee, M.A.; Rafiee, J.; Wang, Z.; Song, H.; Yu, Z.Z.; Koratkar, N. Enhanced Mechanical Properties of Nanocomposites at Low Graphene Content. ACS Nano 2009, 3, 3884–3890. [Google Scholar] [CrossRef]
- Nunthanid, J.; Laungtana-anan, M.; Sriamornsak, P.; Limmatvapirat, S.; Puttipipatkhachorn, S.; Lim, L.Y.; Khor, E. Characterization of chitosan acetate as a binder for sustained release tablets. J. Control. Release 2004, 99, 15–26. [Google Scholar] [CrossRef] [PubMed]
- Mezina, E.A.; Lipatova, I.M.; Losev, N.V. Effect of mechanical activation on rheological and film-forming properties of suspensions of barium sulfate in chitosan solutions. Russ. J. Appl. Chem. 2011, 84, 486–490. [Google Scholar] [CrossRef]
- Haynes, W.M. CRC Handbook of Chemistry and Physics, 96th ed.; CRC Press: Boca Raton, FL, USA, 2015. [Google Scholar]
- Kim, K.S.; Shim, S.H.; Kim, S.; Yoon, S.O. Low temperature and microwave dielectric properties of TiO2/ZBS glass composites. Ceram. Int. 2010, 36, 1571–1575. [Google Scholar] [CrossRef]
- Houng, B.; Wu, S.-J.J.; Lu, S.H.; Chien, W.C. Microstructure and properties evaluation of TiO2 ceramics with multi-oxides glass additions. Ceram. Int. 2014, 40, 3731–3736. [Google Scholar] [CrossRef]
- Wypych, A.; Bobowska, I.; Tracz, M.; Opasinska, A.; Kadlubowski, S.; Krzywania-Kaliszewska, A.; Grobelny, J.; Wojciechowski, P. Dielectric Properties and Characterisation of Titanium Dioxide Obtained by Different Chemistry Methods. J. Nanomater. 2014, 2014, 124814. [Google Scholar] [CrossRef]
- Sagadevan, S. Synthesis and electrical properties of TiO2 nanoparticles using a wet chemical technique. Am. J. Nanosci. Nanotechnol. 2013, 1, 27–30. [Google Scholar] [CrossRef] [Green Version]
- Kumar, N.S.; Naveen Kumar, S.K.; Yesappa, L. Structural, optical and conductivity study of hydrothermally synthesized TiO2 nanorods. Mater. Res. Express 2020, 7, 015071. [Google Scholar] [CrossRef]
- Campbell, S.L.V.; Chancelier, J.P.; Nikoukhah, R. Modeling and Simulation in Scilab/Scicos; Springer Science and Business Media: New York, NY, USA, 2006. [Google Scholar]
- Ben Brahim, M.; Ammar, H.B.; Abdelhédi, R.; Samet, Y. Electrochemical behavior and analytical detection of Imidacloprid insecticide on a BDD electrode using square-wave voltammetric method. Chin. Chem. Lett. 2016, 27, 666–672. [Google Scholar] [CrossRef]
- Guzsvány, V.; Gaál, F.; Bjelica, L.; Ökrész, S. Voltammetric determination of imidacloprid and thiamethoxam. J. Serb. Chem. Soc. 2005, 70, 735–743. [Google Scholar] [CrossRef]
- Paiva, W.D.A.; Oliveira, T.M.B.F.; Sousa, C.P.; Neto, P.D.L.; Correia, A.N.; Morais, S.; Silva, D.R.; Castro, S.S.L. Electroanalysis of Imidacloprid Insecticide in River Waters Using Functionalized Multi-Walled Carbon Nanotubes Modified Glassy Carbon Electrode. J. Electrochem. Soc. 2018, 165, B431–B435. [Google Scholar] [CrossRef]
- Navalón, A.; El-Khattabi, R.; González-Casado, A.; Vilchez, J.L. Differential-pulse polarographic determination of the insecticide imidacloprid in commercial formulations. Microchim. Acta 1999, 130, 261–265. Available online: https://link.springer.com/article/10.1007%2FBF01242914 (accessed on 28 January 2022). [CrossRef]
- Ahuja, S.; Scypinski, S. Validation of analytical test methods. In Separation Science and Technology; Academic Press: Cambridge, MA, USA, 2011; Volume 10, pp. 429–457. [Google Scholar] [CrossRef]
- Kumaravel, A.; Chandrasekaran, M. Electrochemical determination of imidacloprid using nanosilver Nafion®/nanoTiO2 Nafion® composite modified glassy carbon electrode. Sens. Actuators B Chem. 2011, 158, 319–326. [Google Scholar] [CrossRef]
- Li, X.; Kan, X. A ratiometric strategy -based electrochemical sensing interface for the sensitive and reliable detection of imidacloprid. Analyst 2018, 143, 2150–2156. [Google Scholar] [CrossRef] [PubMed]
- Ajermoun, N.; Aghris, S.; Farahi, A.; Lahrich, S.; Saqrane, S.; Bakasse, M.; El Mhammedi, M.A. Electrochemical reduction of neonicotinoids insecticides catalysed by metallic silver: Case of the detection of imidacloprid in tomato and orange juices. Int. J. Environ. Anal. Chem. 2019, 101, 585–597. [Google Scholar] [CrossRef]
- Guzsvany, V.; Petrovic, J.; Krstic, J.; Papp, Z.; Putek, M.; Bjelica, L.; Bobrowski, A.; Abramović, B. Renewable silver-amalgam film electrode for voltammetric monitoring of solar photodegradation of imidacloprid in the presence of Fe/TiO2 and TiO2 catalysts. J. Electroanal. Chem. 2013, 699, 33–39. [Google Scholar] [CrossRef]
- Papp, Z.; Švancara, I.; Guzsvány, V.; Vytřas, K.; Gaál, F. Voltammetric determination of Imidacloprid insecticide in selected samples using a carbon paste electrode. Microchim. Acta 2009, 166, 169–175. [Google Scholar] [CrossRef]
- Lei, W.; Wu, Q.J.; Si, W.M. Electrochemical determination of imidacloprid using poly(carbazole)/chemically reduced graphene oxide modified glassy carbon electrode. Sens. Actuators B Chem. 2013, 183, 102–109. [Google Scholar] [CrossRef]
- Guzsvány, V.; Kádár, M.; Papp, Z.; Bjelica, L.; Gaál, F.; Tóth, K. Monitoring of photo-catalytic degradation of selected neonicotinoid insecticides by cathodic voltam-metry with a bismuth film electrode. Electroanalysis 2008, 20, 291–300. [Google Scholar] [CrossRef]
Publisher’s Note: MDPI stays neutral with regard to jurisdictional claims in published maps and institutional affiliations. |
© 2022 by the authors. Licensee MDPI, Basel, Switzerland. This article is an open access article distributed under the terms and conditions of the Creative Commons Attribution (CC BY) license (https://creativecommons.org/licenses/by/4.0/).