
One-Pot Green Preparation of Fluorescent Cellulose Nanofibers


Abstract
1. Introduction
2. Experimental
2.1. Materials
2.2. Preparation of Fluorescent Cellulose Nanofibers
2.3. Transmission Electron Microscopy (TEM)
2.4. Surface Chemical Structure
2.5. X-ray Diffraction (XRD)
2.6. Thermogravimetric Analyzer (TG)
2.7. Fluorescent Properties Test
2.8. Ionic Sensitivity Tests
3. Results and Discussion
3.1. Fluorescence Properties
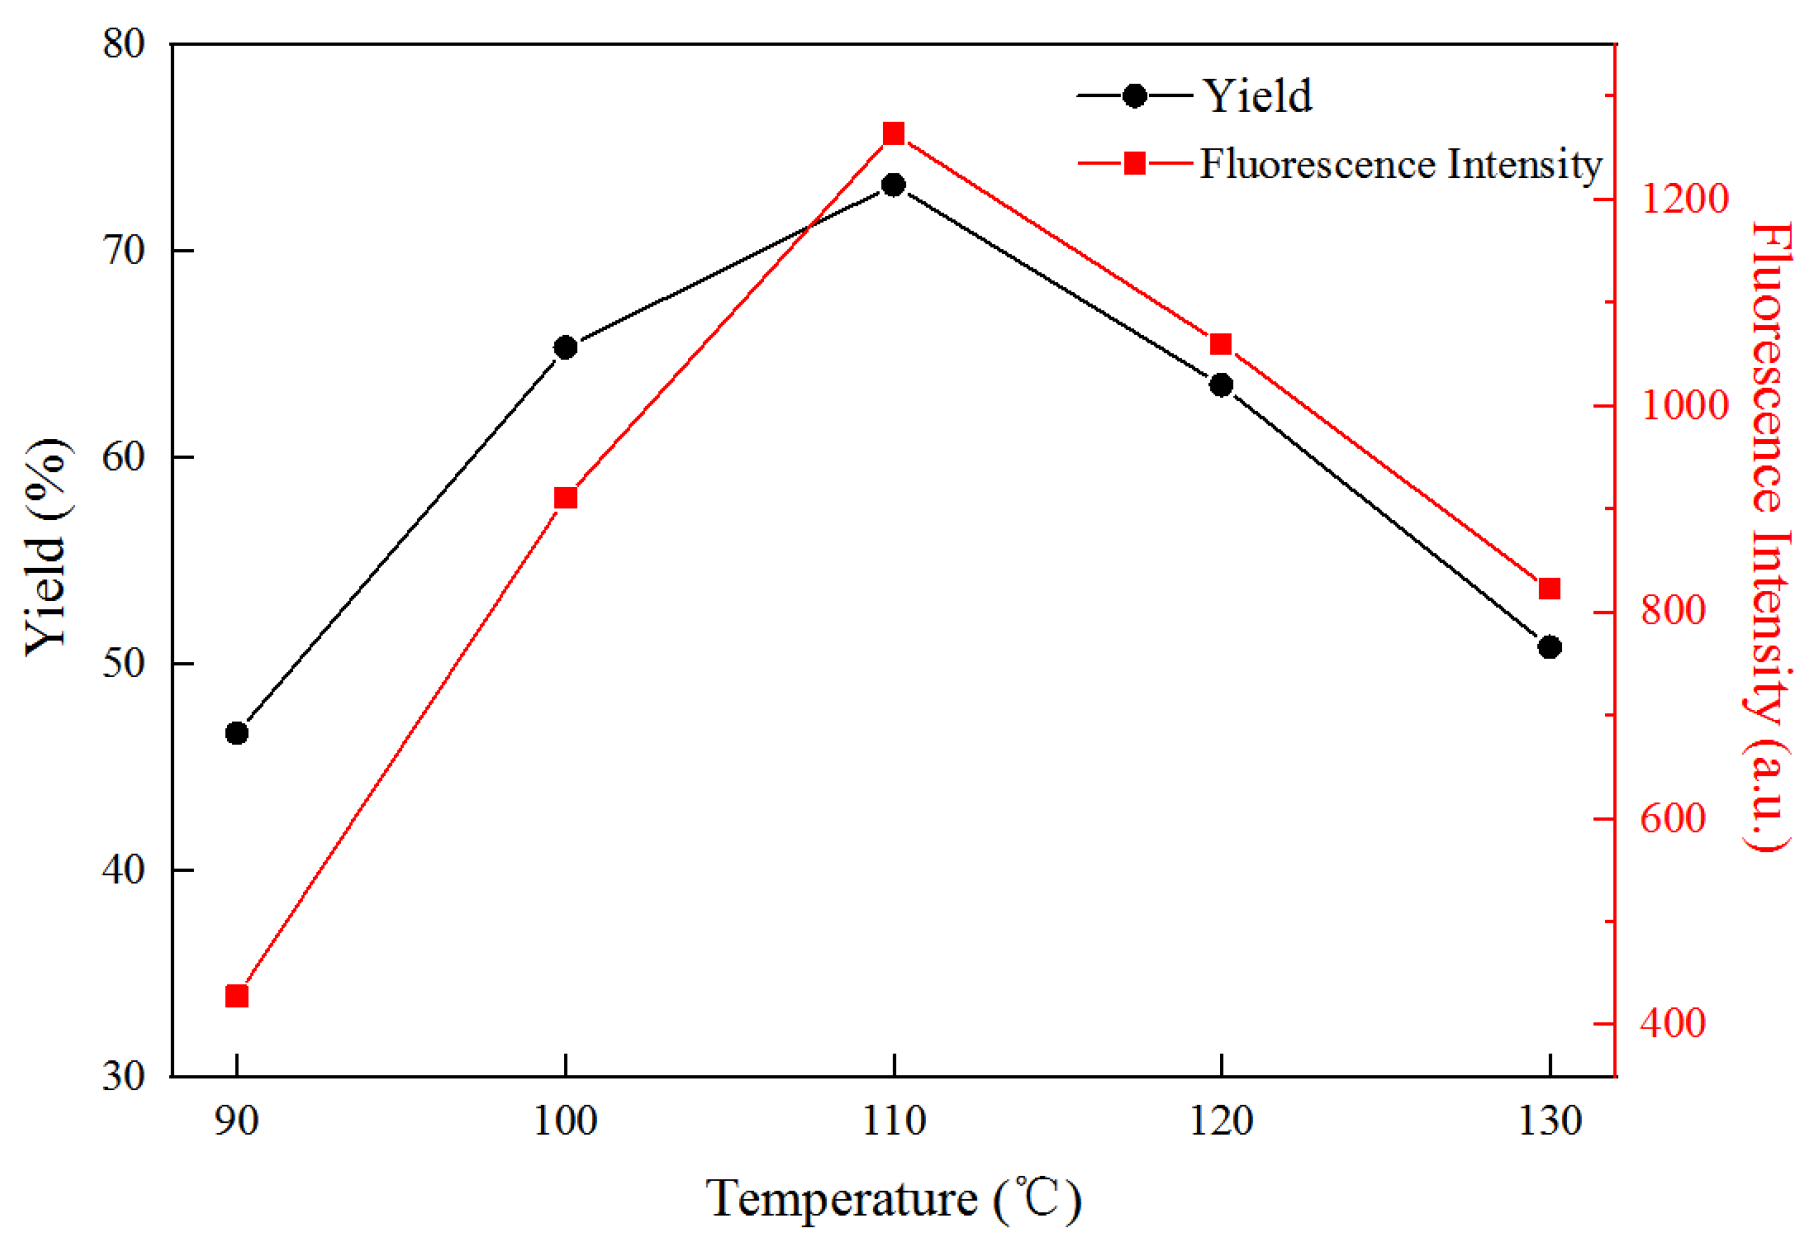
3.2. Effect of Reaction Temperature on Yield and Fluorescence Properties of FCNF
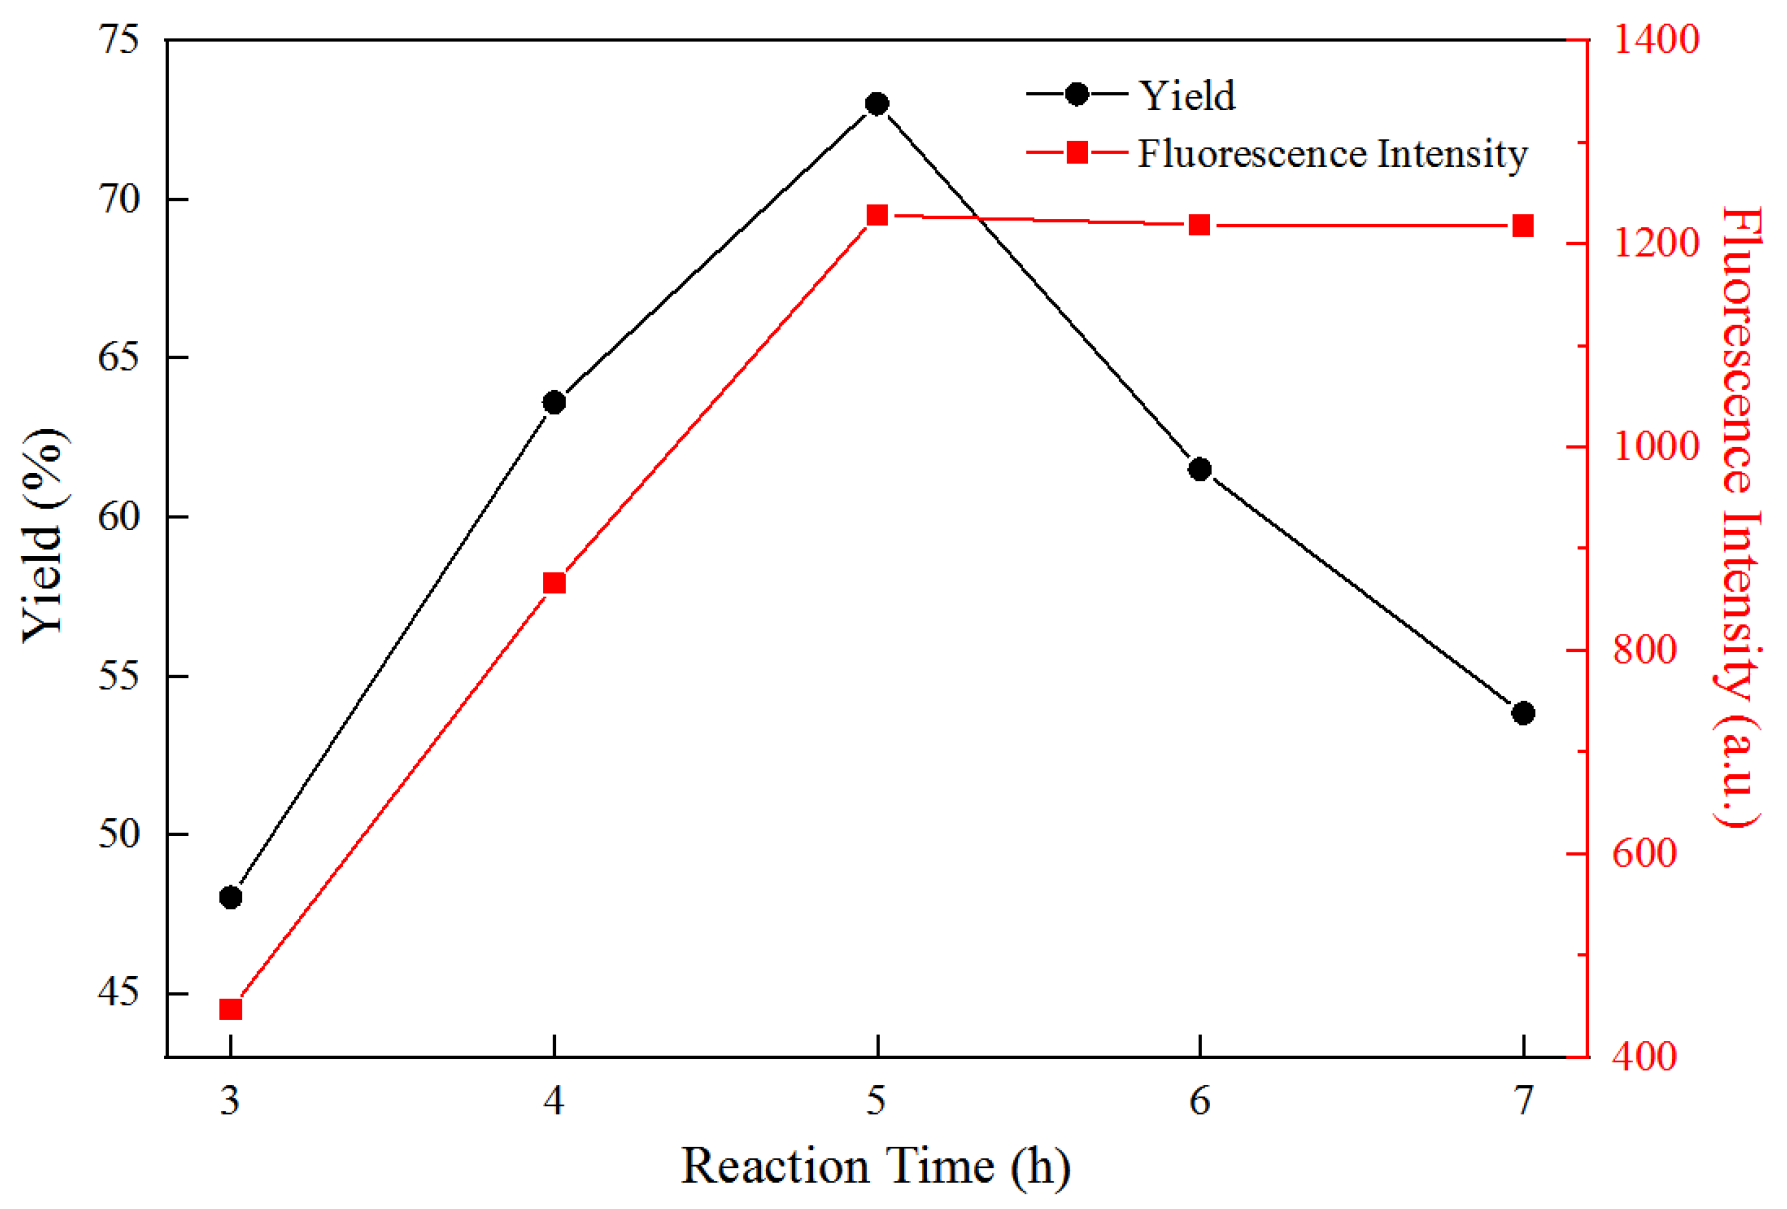
3.3. Effect of Reaction Time on Yield and Fluorescence Properties of FCNF
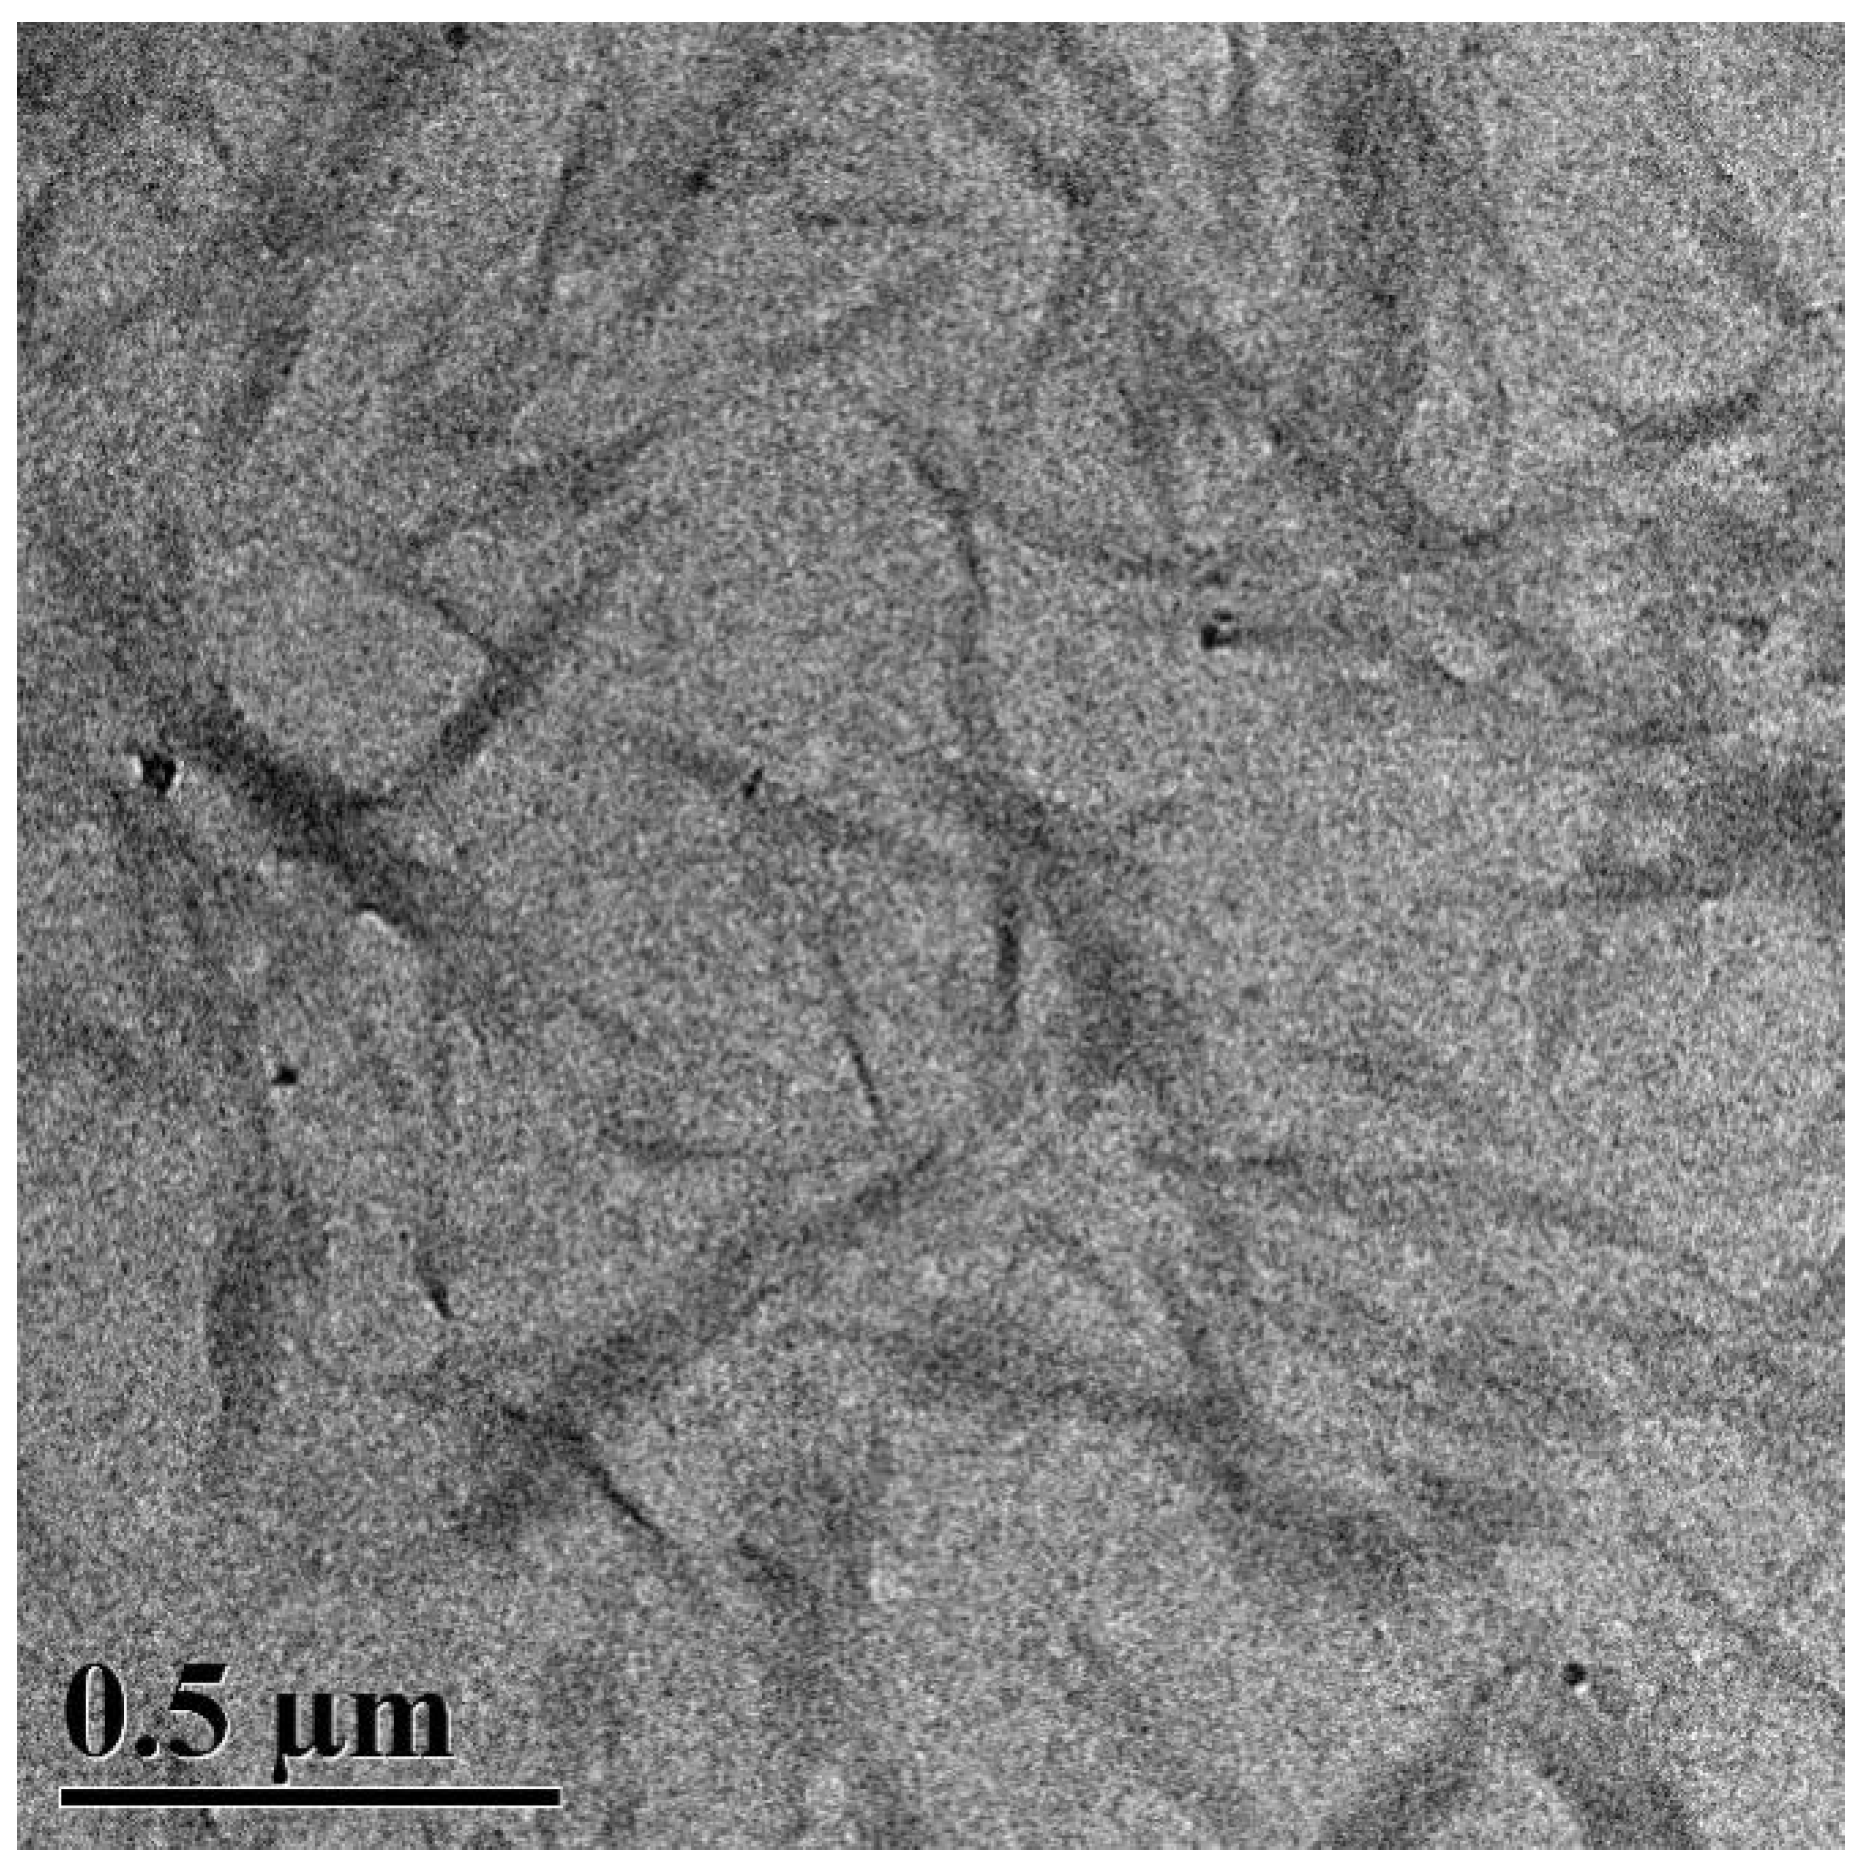
3.4. Morphology
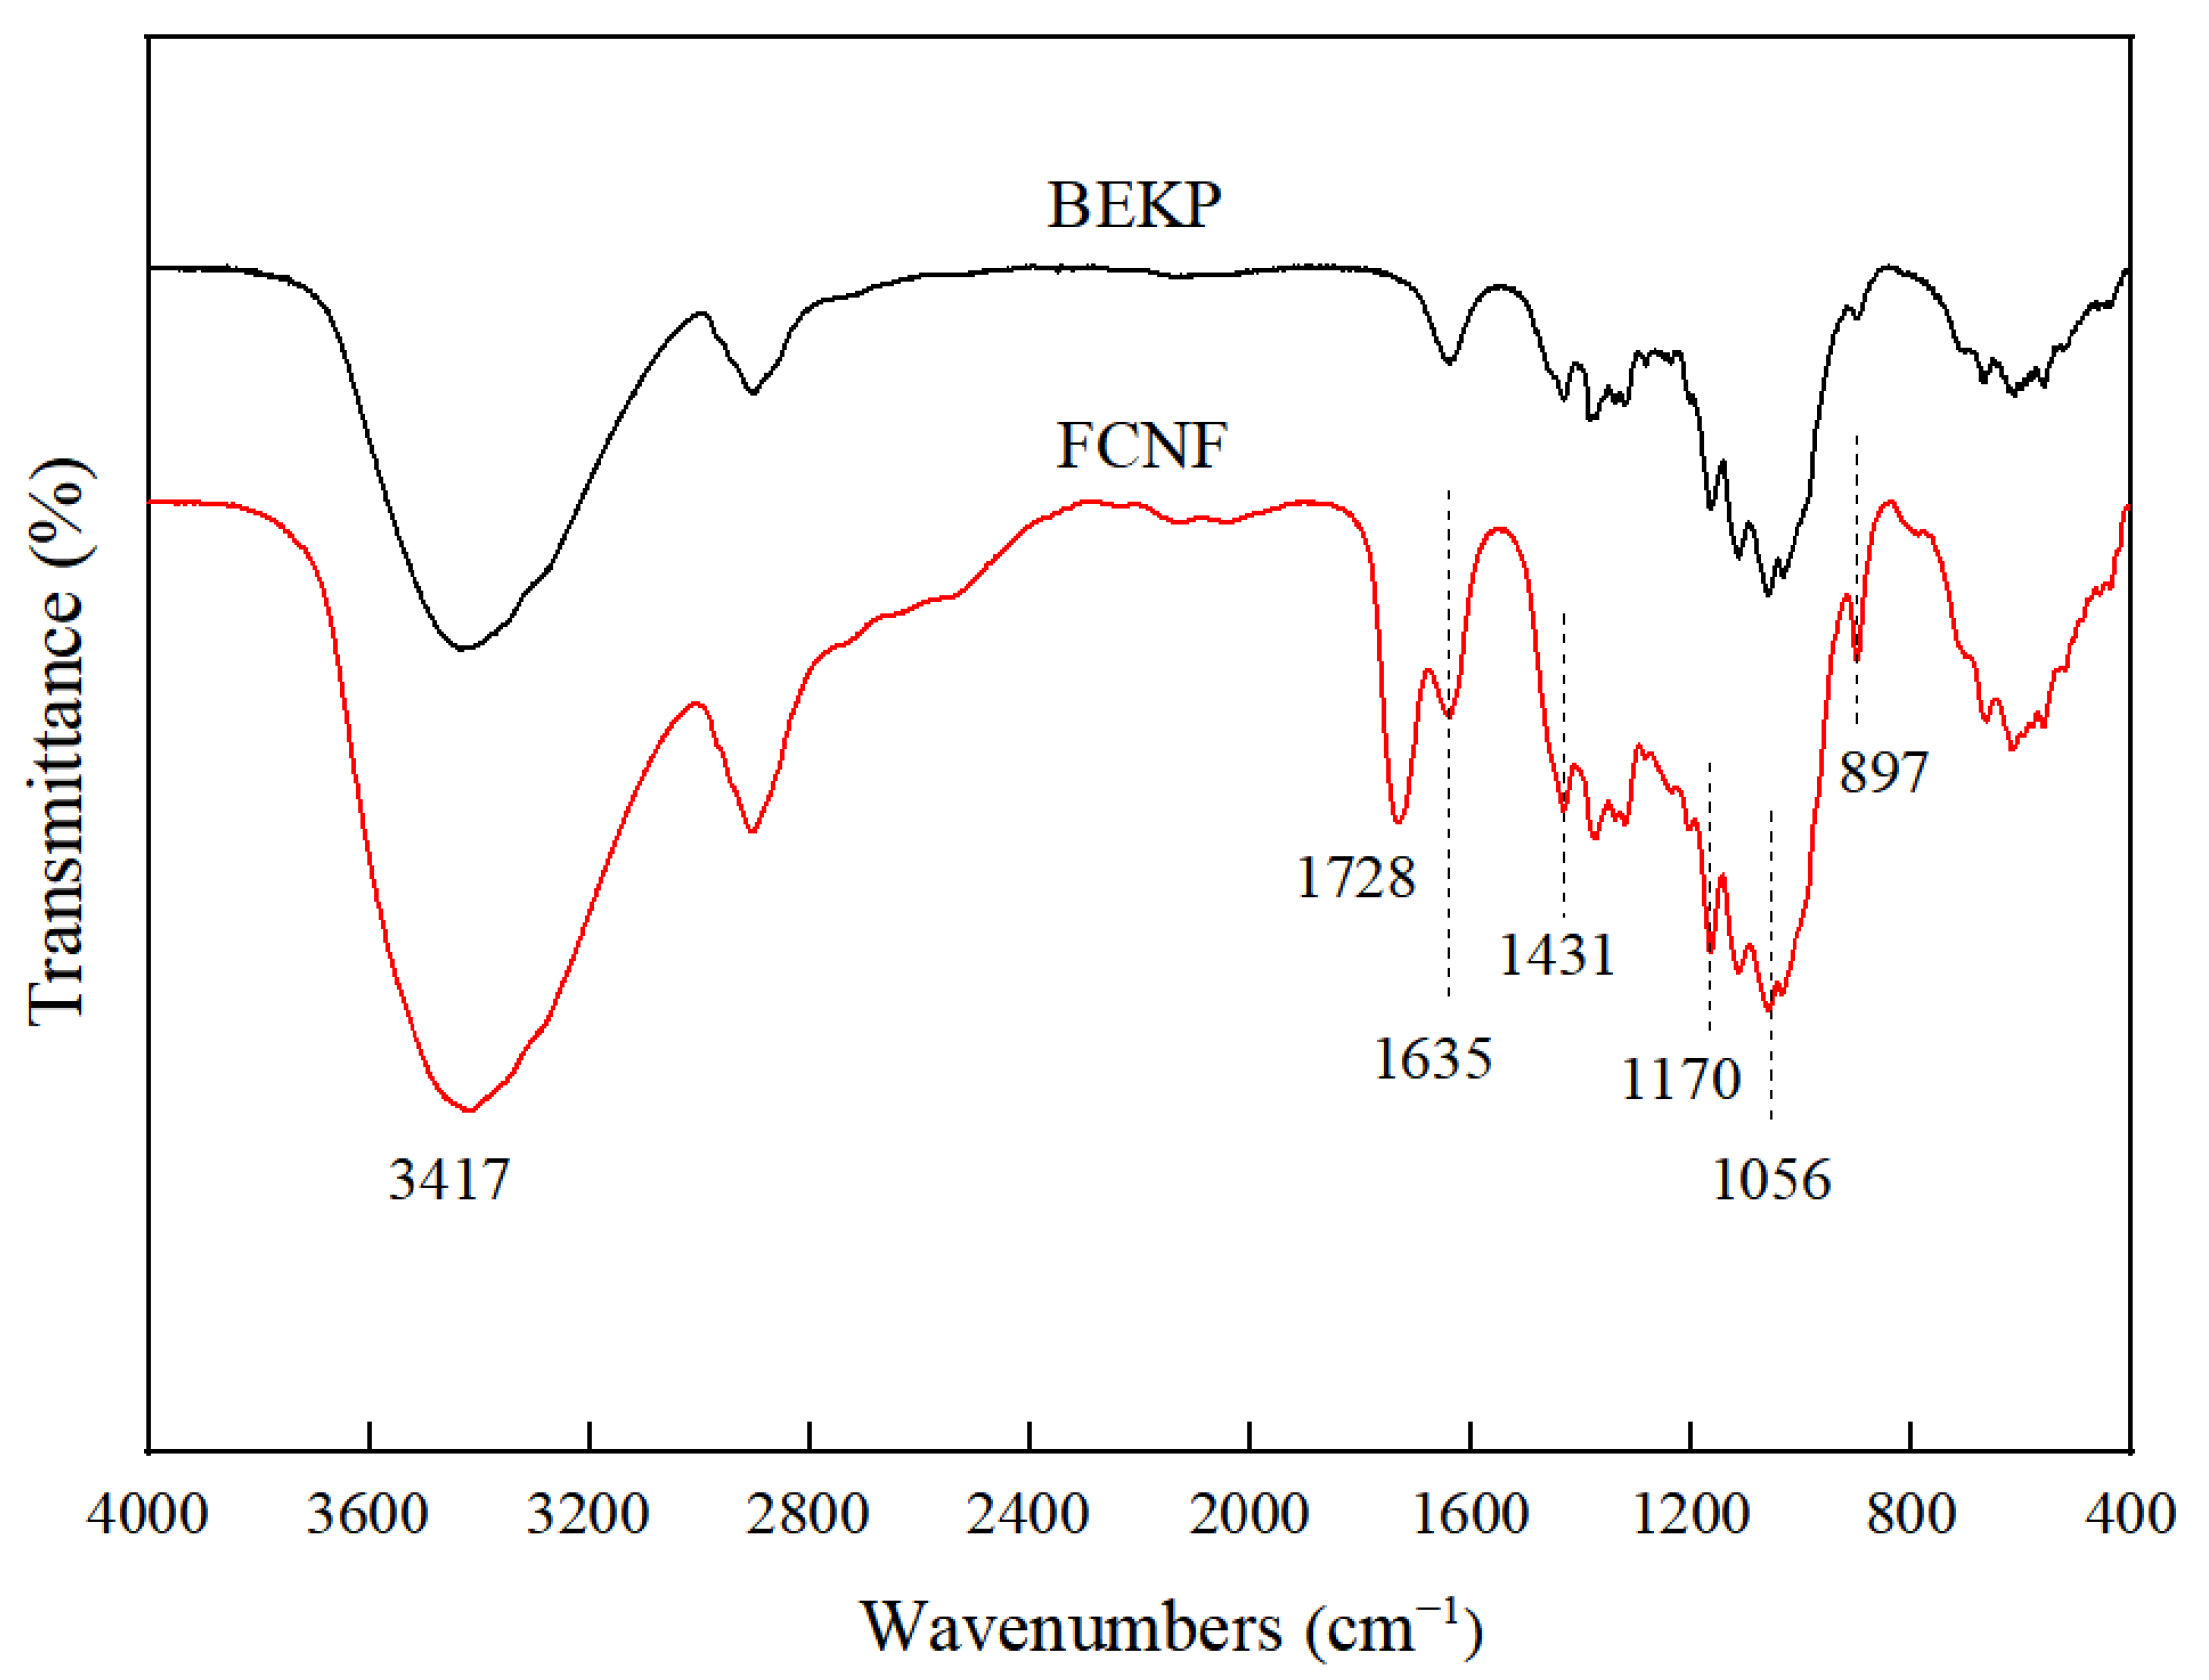
3.5. FTIR
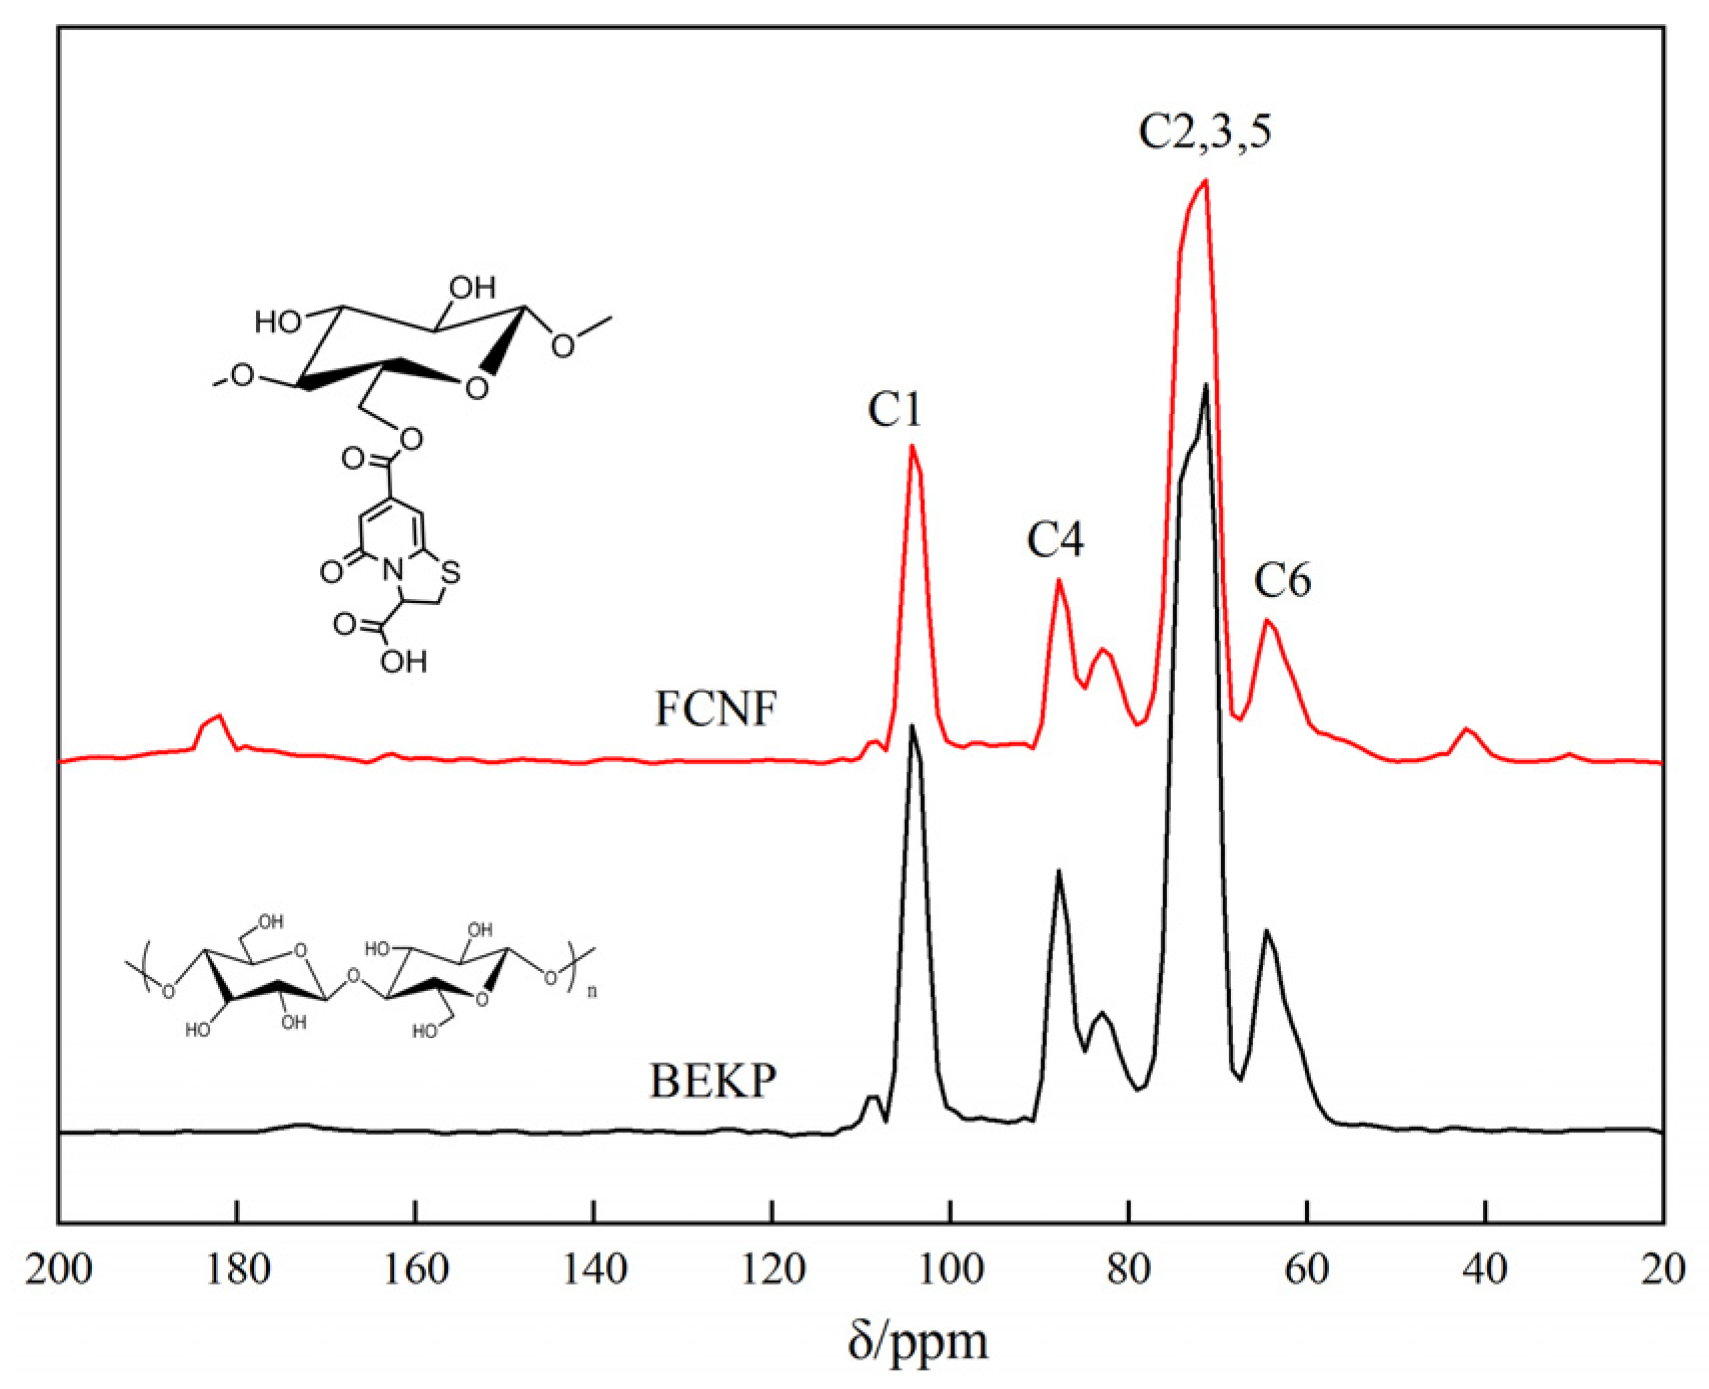
3.6. 13C NMR Analysis
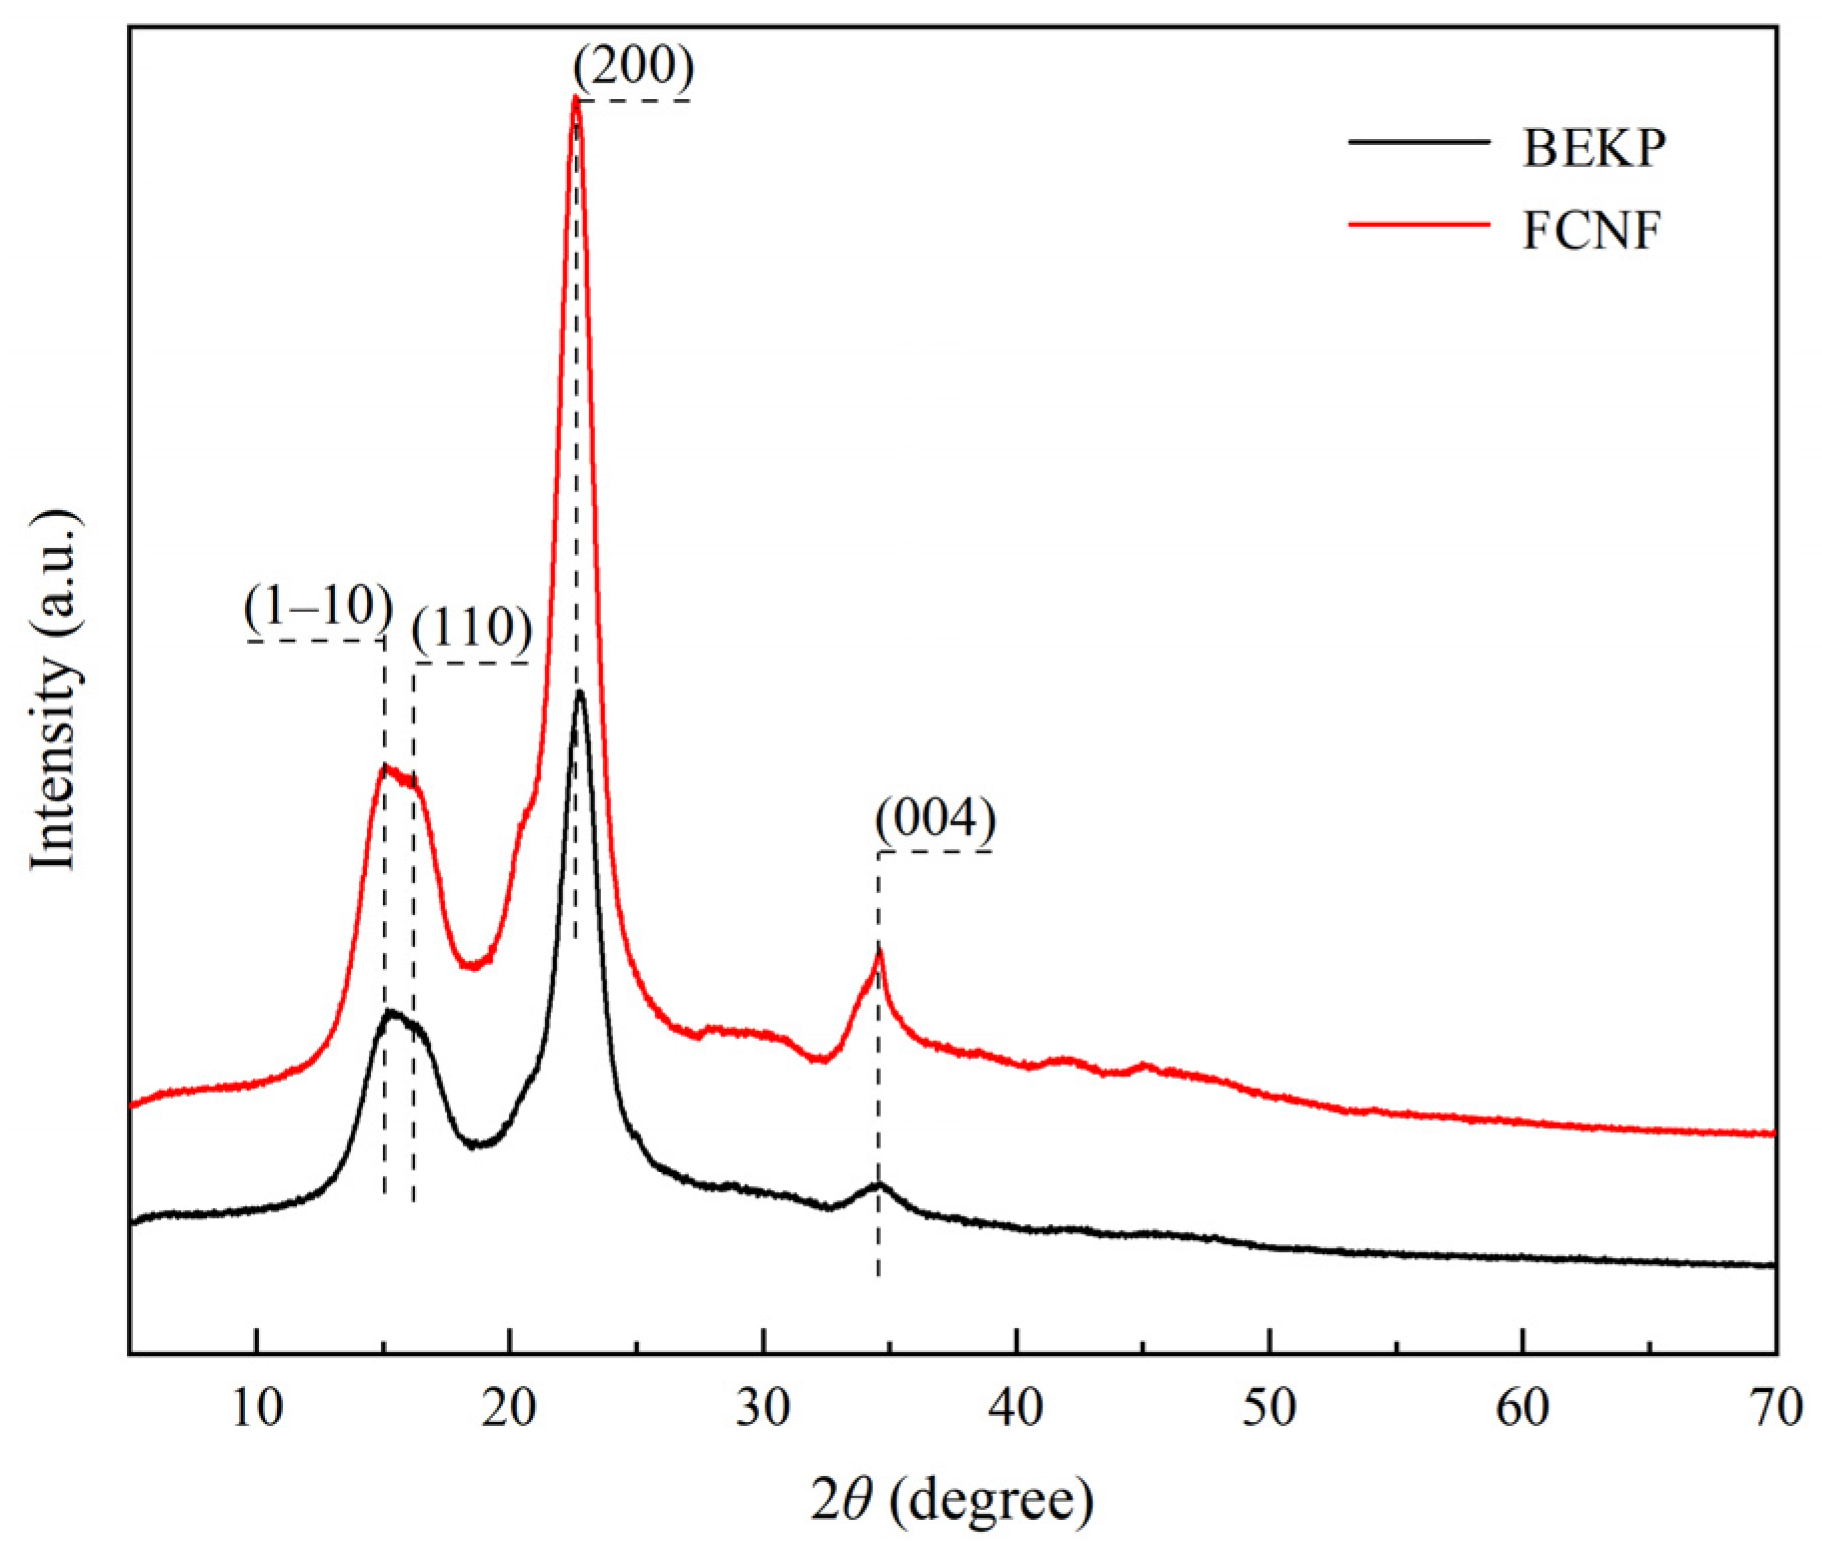
3.7. XRD
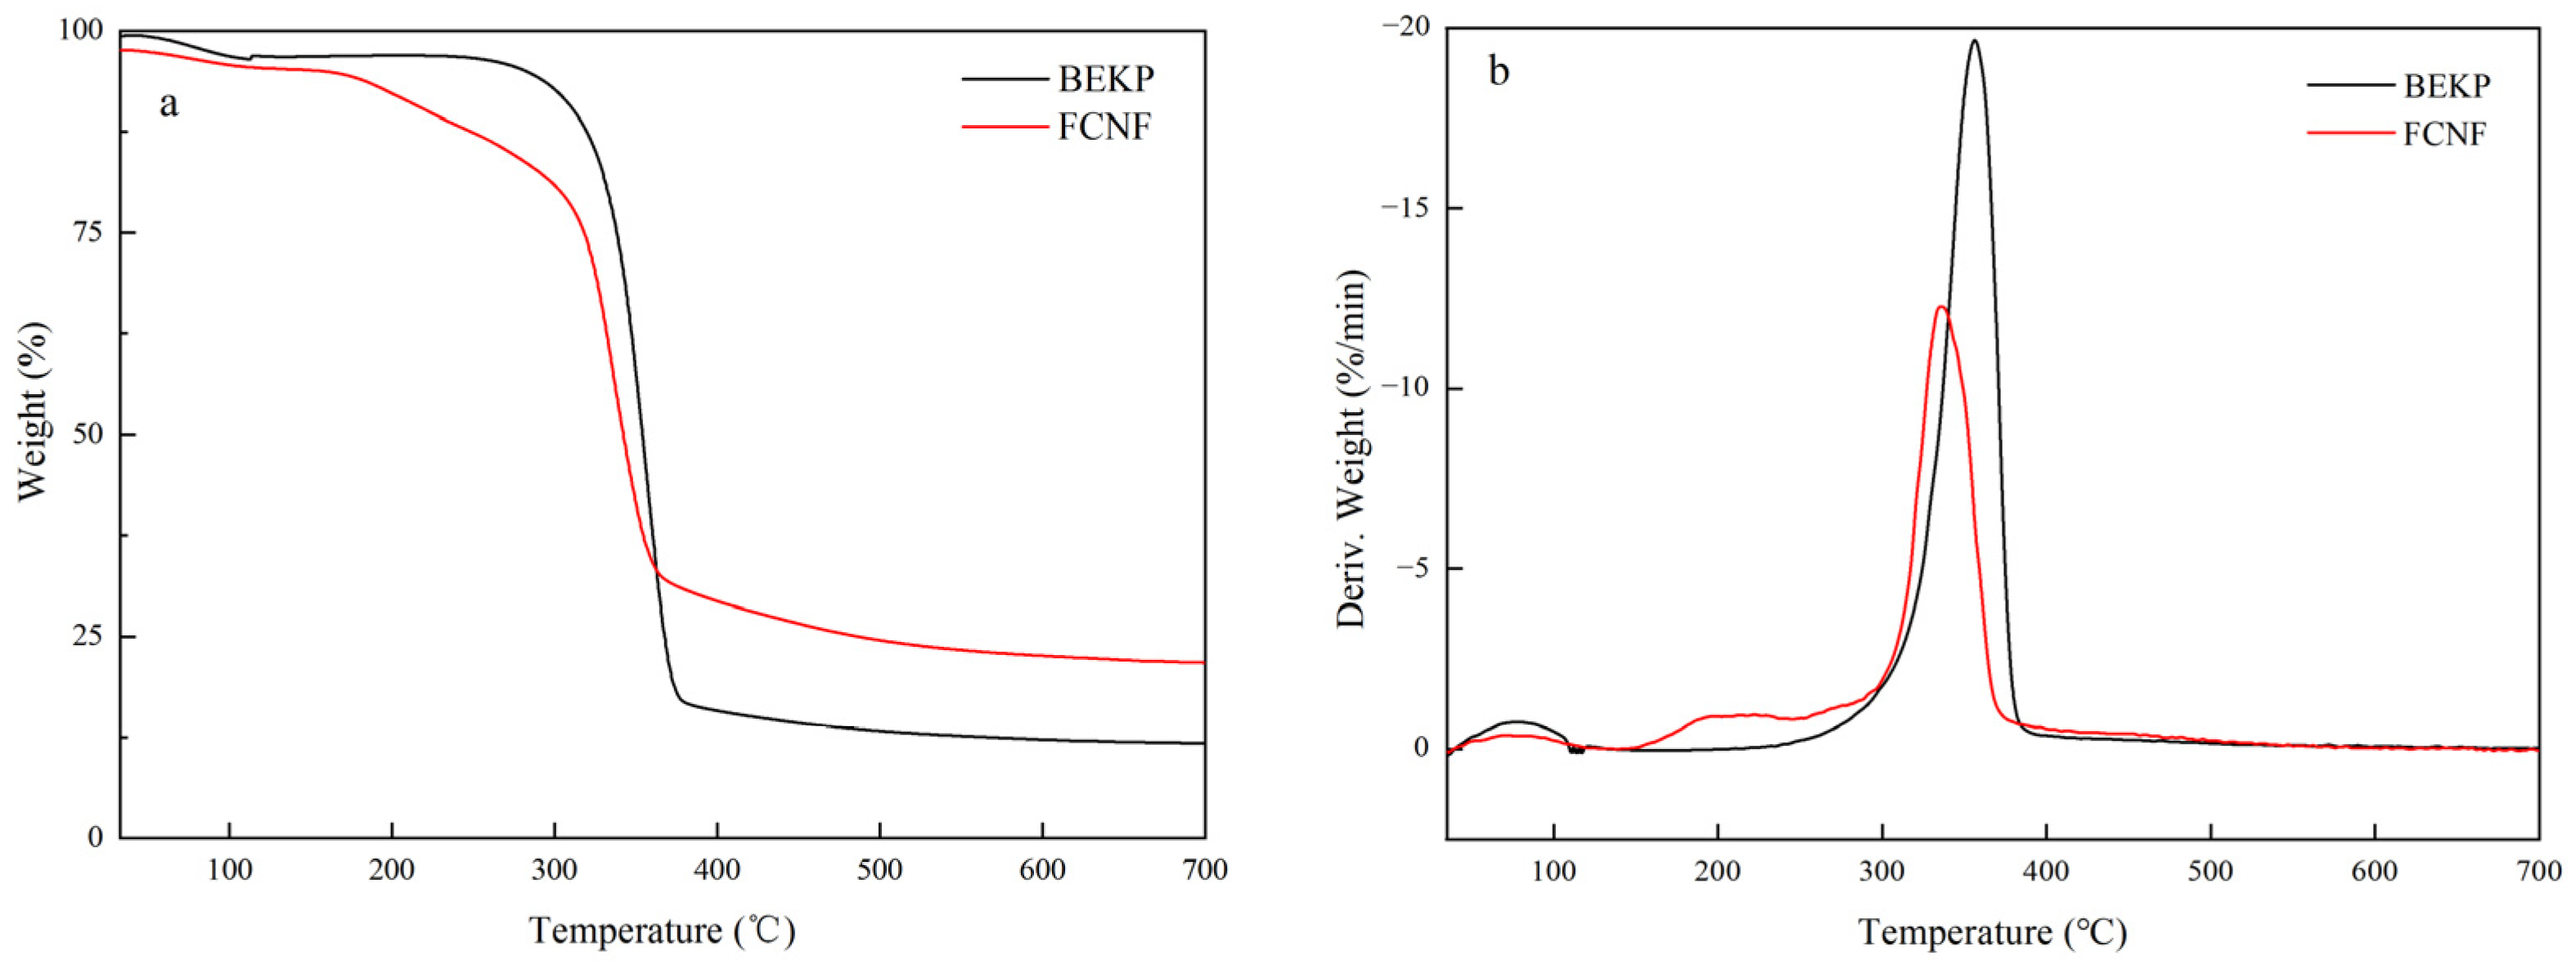
3.8. TG
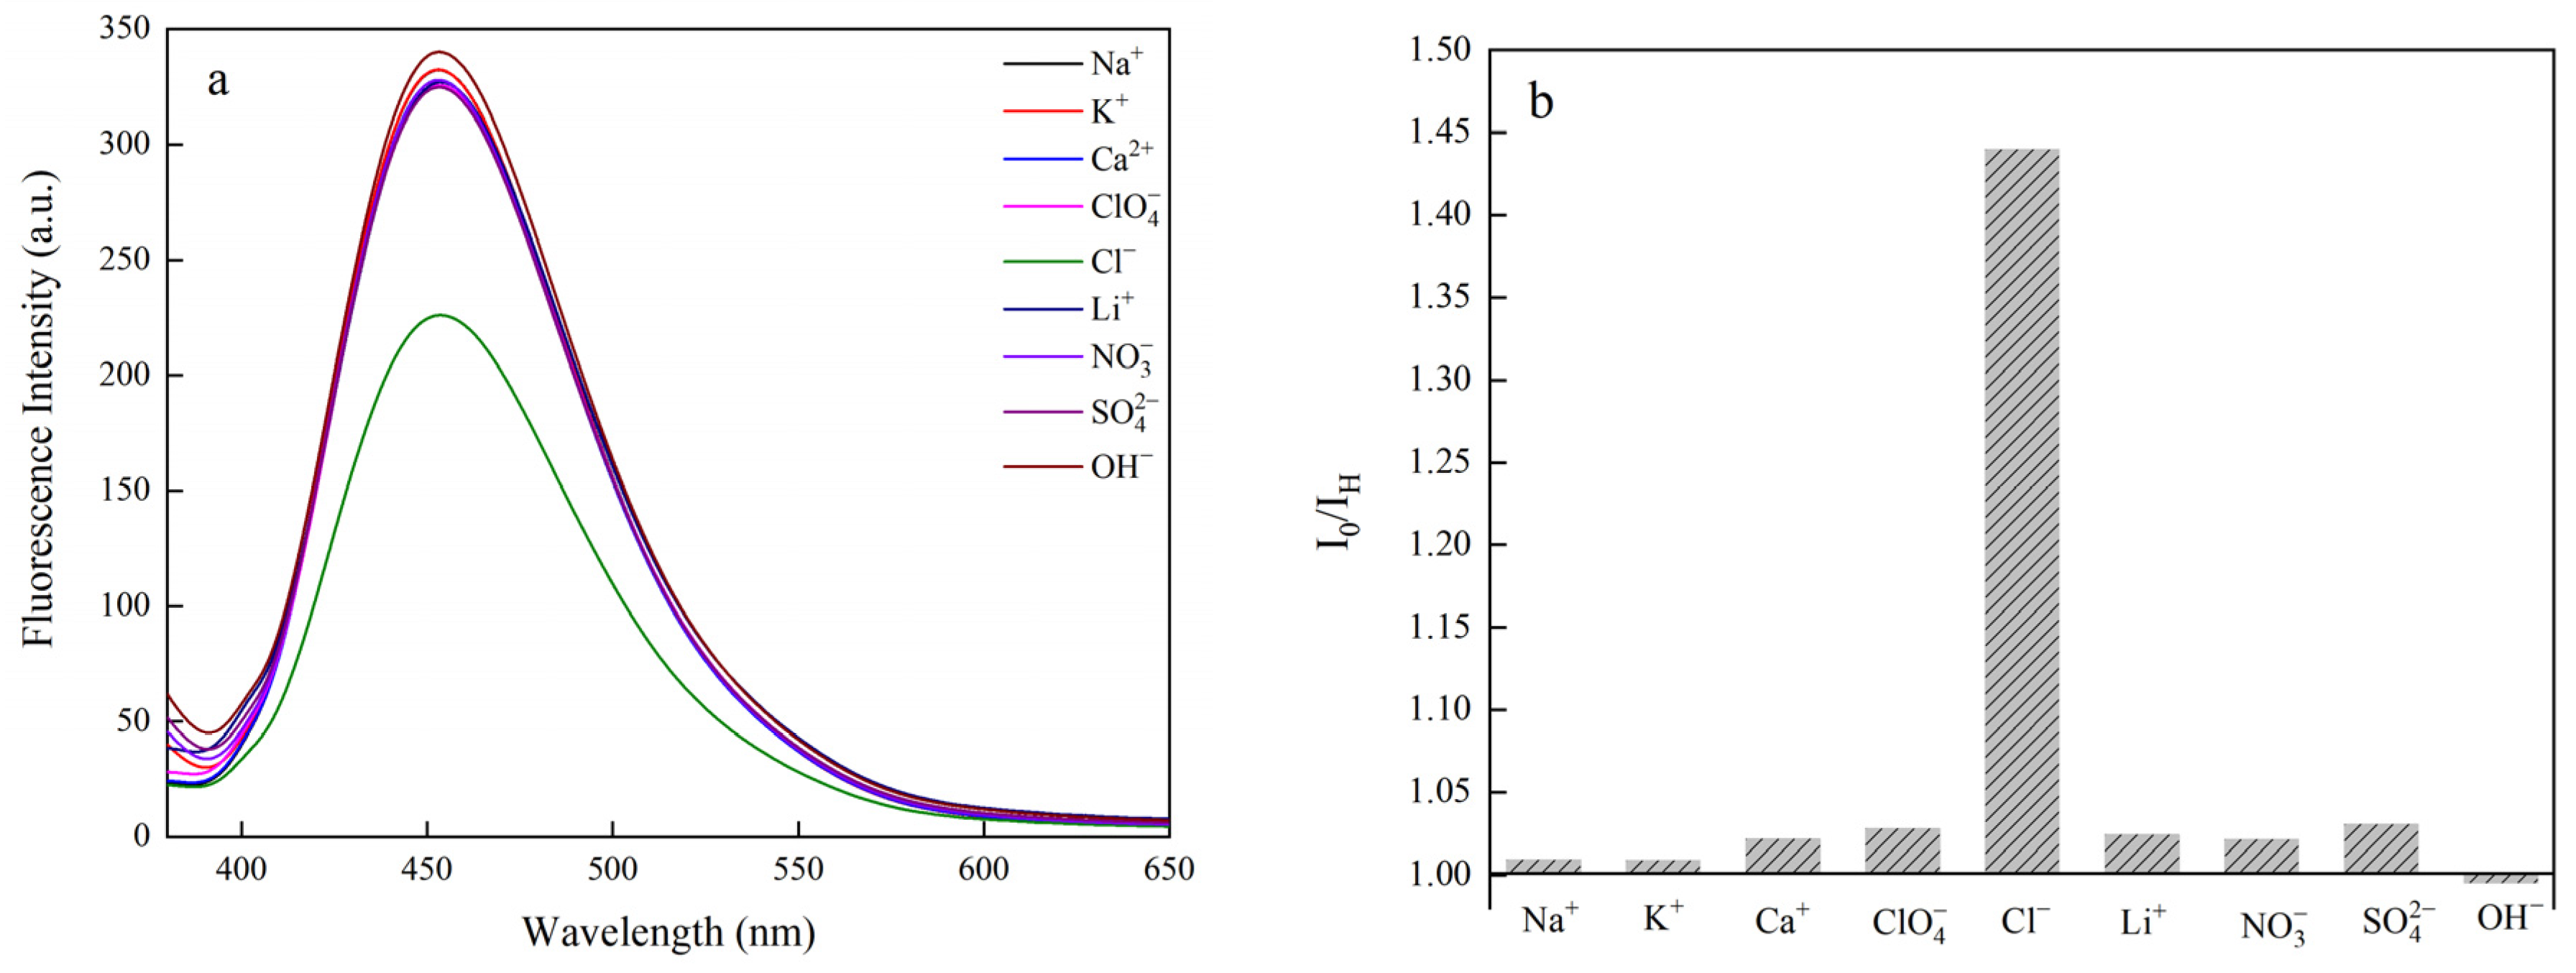
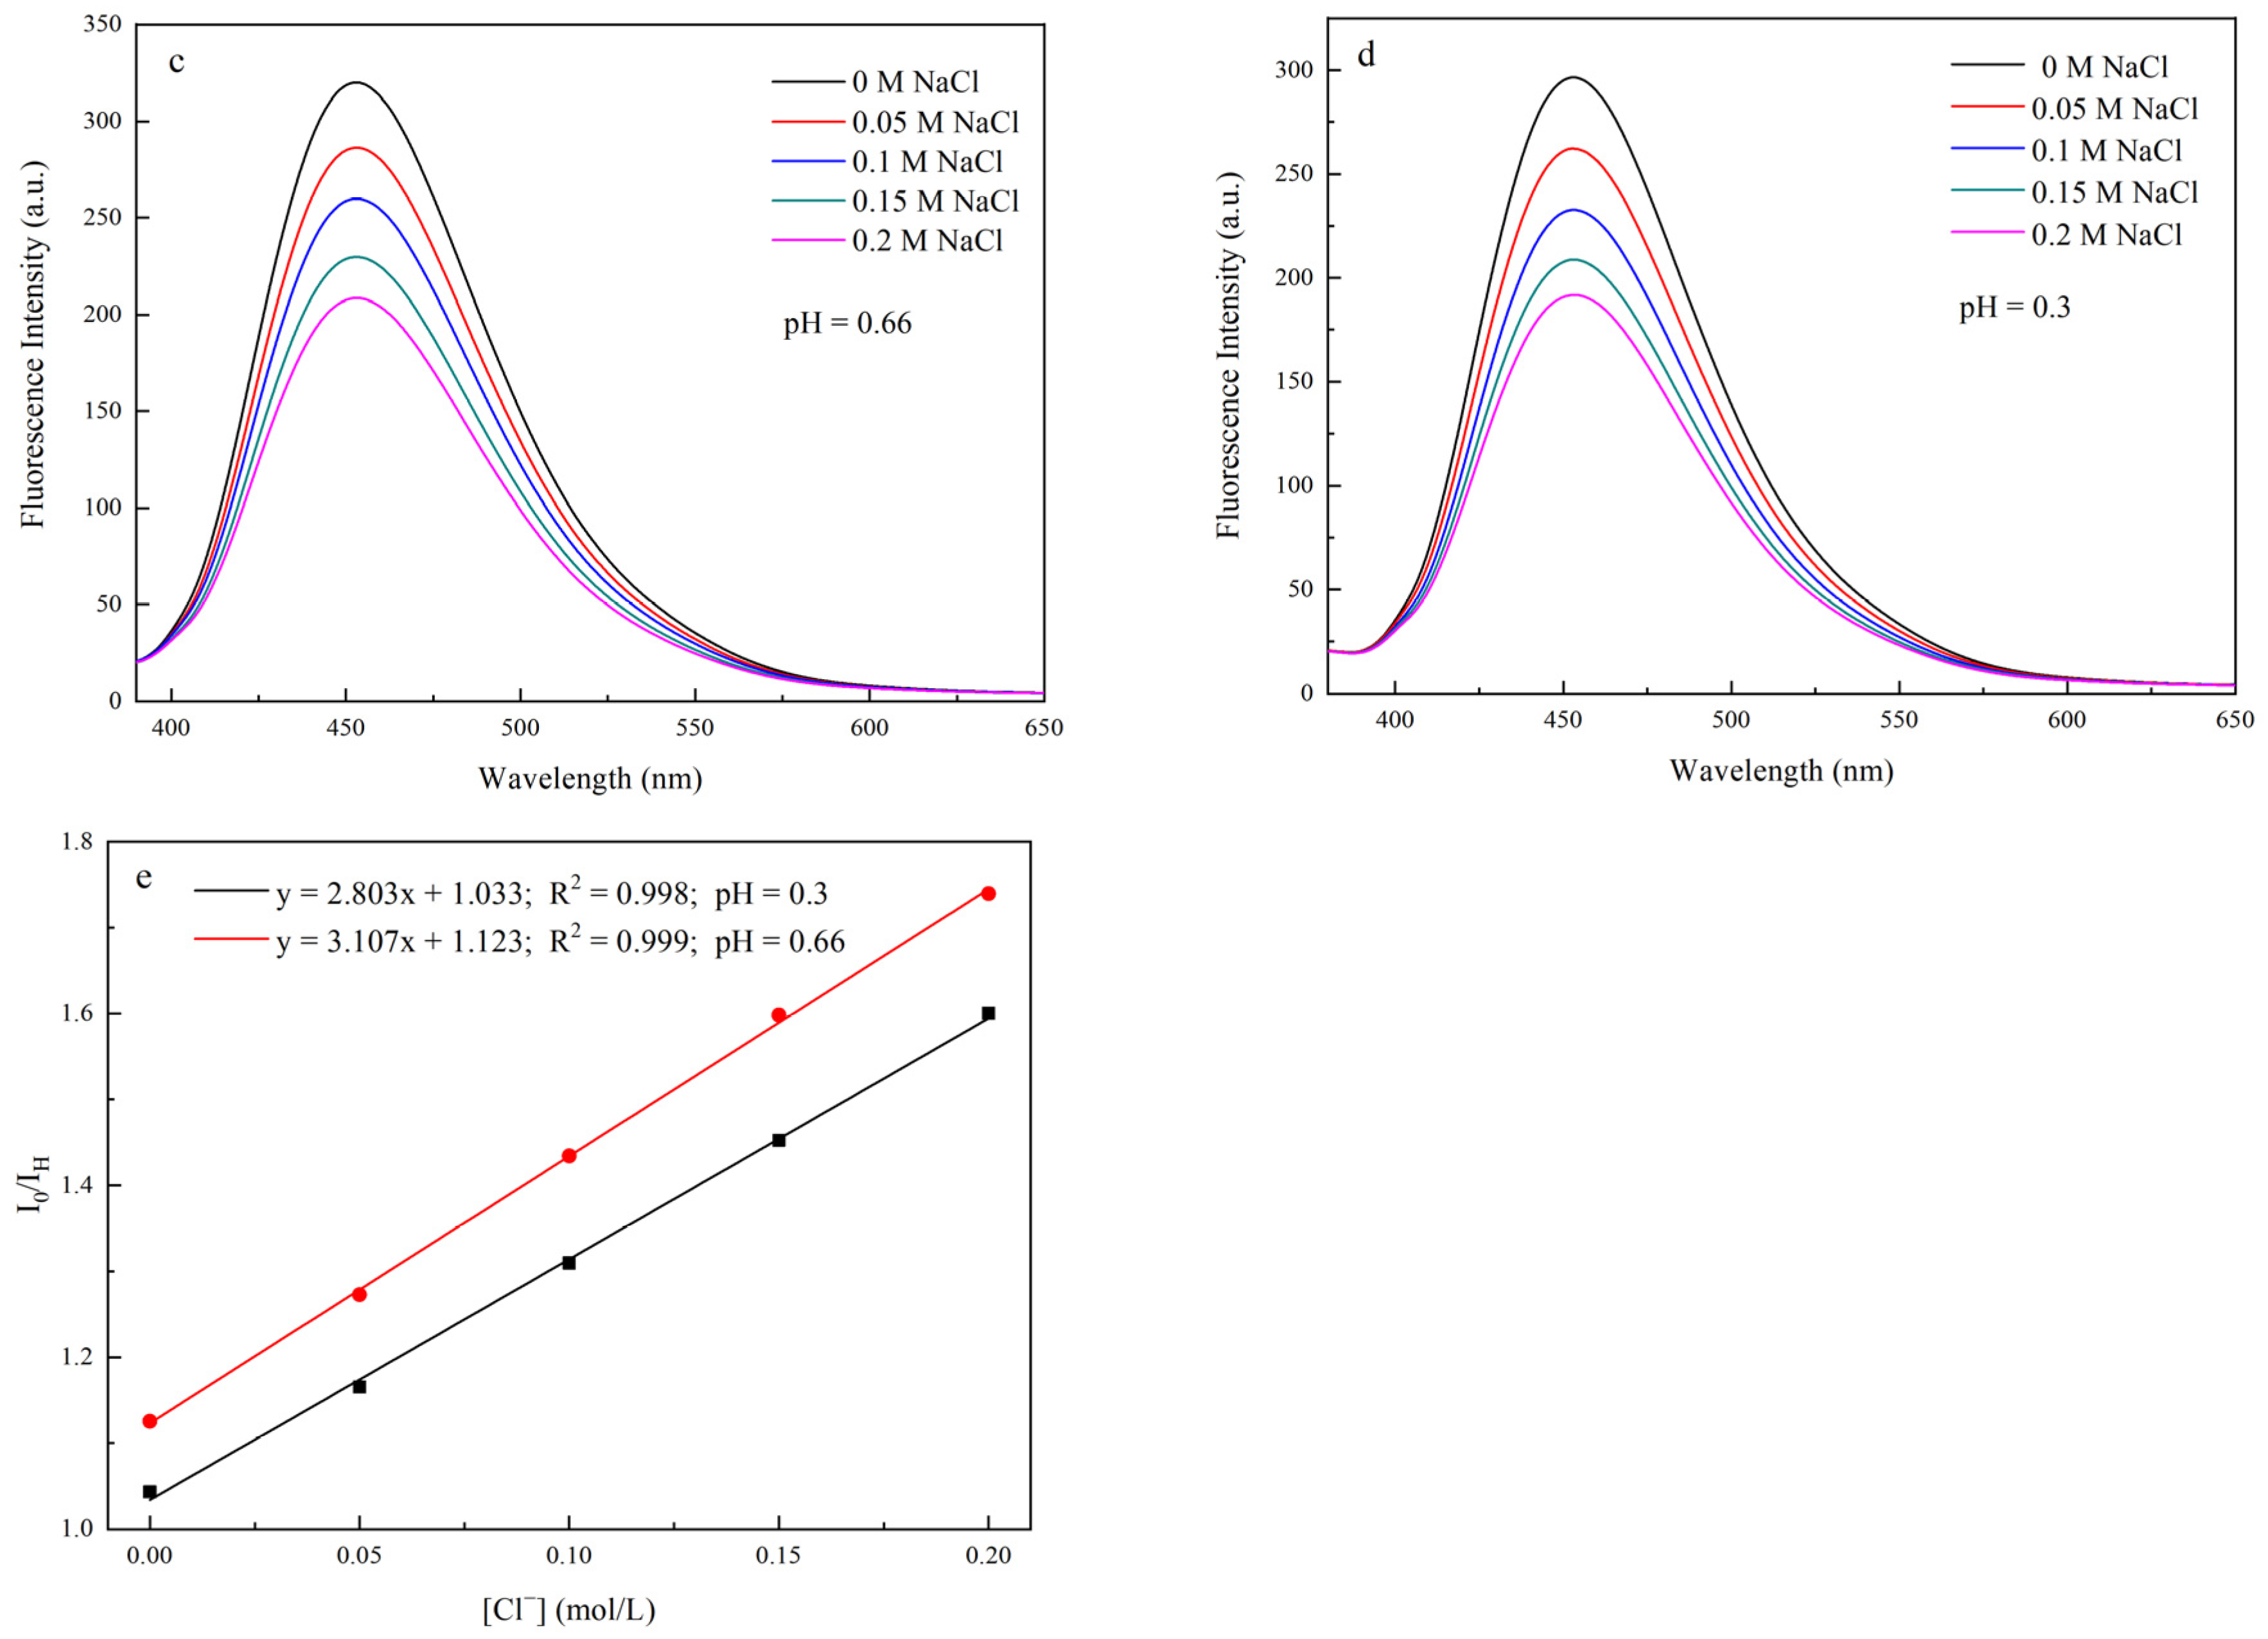
3.9. Responsiveness of Chloride Ions
4. Conclusions
Author Contributions
Funding
Institutional Review Board Statement
Informed Consent Statement
Data Availability Statement
Conflicts of Interest
References
- Habibi, Y.; Lucia, L.A.; Rojas, O.J. Cellulose Nanocrystals: Chemistry, Self-Assembly, and Applications. Chem. Rev. 2010, 110, 3479–3500. [Google Scholar] [CrossRef] [PubMed]
- Chen, W.; Yu, H.; Lee, S.Y.; Wei, T.; Li, J.; Fan, Z. Nanocellulose: A promising nanomaterial for advanced electrochemical energy storage. Chem. Soc. Rev. 2018, 47, 2837–2872. [Google Scholar] [CrossRef] [PubMed]
- Lu, Q.; Tang, L.; Lin, F.; Wang, S.; Chen, Y.; Chen, X.; Huang, B. Preparation and characterization of cellulose nanocrystals via ultrasonication-assisted FeCl3-catalyzed hydrolysis. Cellulose 2014, 21, 3497–3506. [Google Scholar] [CrossRef]
- Rajinipriya, M.; Nagalakshmaiah, M.; Robert, M.; Elkoun, S. Importance of Agricultural and Industrial Waste in the Field of Nanocellulose and Recent Industrial Developments of Wood Based Nanocellulose: A Review. ACS Sustain. Chem. Eng. 2018, 6, 2807–2828. [Google Scholar] [CrossRef]
- Zhang, Y.; Zhang, L.; Cui, K.; Ge, S.; Cheng, X.; Yan, M.; Yu, J.; Liu, H. Flexible Electronics Based on Micro/Nanostructured Paper. Adv. Mater. 2018, 30, 1801588. [Google Scholar] [CrossRef]
- Du, H.; Liu, W.; Zhang, M.; Si, C.; Zhang, X.; Li, B. Cellulose nanocrystals and cellulose nanofibrils based hydrogels for biomedical applications. Carbohydr. Polym. 2019, 209, 130–144. [Google Scholar] [CrossRef]
- Dai, S.; Prempeh, N.; Liu, D.; Fan, Y.; Gu, M.; Chang, Y. Cholesteric film of Cu(II)-doped cellulose nanocrystals for colorimetric sensing of ammonia gas. Carbohydr. Polym. 2017, 174, 531–539. [Google Scholar] [CrossRef]
- Liu, Y. Strong and Flexible Nanocomposites of Carboxylated Cellulose Nanofibril Dispersed by Industrial Lignin. ACS Sustain. Chem. Eng. 2018, 6, 5524–5532. [Google Scholar] [CrossRef]
- Kang, X.; Kuga, S.; Wang, C.; Zhao, Y.; Wu, M.; Huang, Y. Green preparation of cellulose nanocrystal and its application. ACS Sustain. Chem. Eng. 2018, 6, 2954–2960. [Google Scholar] [CrossRef]
- Mendez, J.D.; Weder, C. Synthesis, electrical properties, and nanocomposites of poly(3,4-ethylenedioxythiophene) nanorods. Polym. Chem. 2010, 1, 1237–1244. [Google Scholar] [CrossRef][Green Version]
- Zhou, C.J.; Wu, Q.L.; Yue, Y.Y.; Zhang, Q.G. Application of rod-shaped cellulose nanocrystals in polyacrylamide hydrogels. J. Colloid Interface Sci. 2011, 353, 116–123. [Google Scholar] [CrossRef] [PubMed]
- Leung, A.C.W.; Hrapovic, S.; Lam, E.; Liu, Y.L.; Male, K.B.; Mahmoud, K.A.; Luong, J.H.T. Characteristics and Properties of Carboxylated Cellulose Nanocrystals Prepared from a Novel One-Step Procedure. Small 2011, 7, 302–305. [Google Scholar] [CrossRef] [PubMed]
- Xiong, R.; Yu, S.; Smith, M.J.; Zhou, J.; Krecher, M.; Zhang, L.J.; Nepal, D.; Bunning, T.J.; Tsukruk, V.V. Self-Assembly of Emissive Nanocellulose/Quantum Dot Nanostructures for Chiral Fluorescent Materials. ACS Nano 2019, 13, 9074–9081. [Google Scholar] [CrossRef] [PubMed]
- Xu, L.; Li, Y.; Gao, S.; Niu, Y.; Liu, H.; Mei, C.; Cai, J.; Xu, C. Preparation and Properties of Cyanobacteria-Based Carbon Quantum Dots/Polyvinyl Alcohol/Nanocellulose Composite. Polymers 2020, 12, 1143. [Google Scholar] [CrossRef]
- Aloui, H.; Khwaldia, K.; Hamdi, M.; Fortunati, E.; Kenny, J.M.; Buonocore, G.G.; Lavorgna, M. Synergistic Effect of Halloysite and Cellulose Nanocrystals on the Functional Properties of PVA Based Nanocomposites. ACS Sustain. Chem. Eng. 2016, 4, 794–800. [Google Scholar] [CrossRef]
- Enayati, M.S.; Behzad, T.; Sajkiewicz, P.; Rafienia, M.; Bagheri, R.; Ghasemi-Mobarakeh, L.; Kolbuk, D.; Pahlevanneshan, Z.; Bonakdar, S.H. Development of electrospun poly (vinyl alcohol)-based bionanocomposite scaffolds for bone tissue engineering. J. Biomed. Mater. Res. Part A 2018, 106, 1111–1120. [Google Scholar] [CrossRef]
- Nawaz, H.; Zhang, X.; Chen, S.; You, T.; Xu, F. Recent studies on cellulose-based fluorescent smart materials and their applications: A comprehensive review. Carbohydr. Polym. 2021, 267, 118135. [Google Scholar] [CrossRef]
- Chen, J.; Zhou, Z.; Chen, Z.; Yuan, W.; Li, M. A fluorescent nanoprobe based on cellulose nanocrystals with porphyrin pendants for selective quantitative trace detection of Hg2+. New J. Chem. 2017, 41, 10272–10280. [Google Scholar] [CrossRef]
- Li, R.; Liu, Y.; Seidi, F.; Deng, C.; Liang, F.; Xiao, H. Design and Construction of Fluorescent Cellulose Nanocrystals for Biomedical Applications. Adv. Mater. Interfaces 2022, 2101293. [Google Scholar] [CrossRef]
- Zhou, J.; Butchosa, N.; Jayawardena, H.S.N.; Park, J.; Zhou, Q.; Yan, M.; Ramström, O. Synthesis of Multifunctional Cellulose Nanocrystals for Lectin Recognition and Bacterial Imaging. Biomacromolecules 2015, 16, 1426–1432. [Google Scholar] [CrossRef]
- Chen, H.; Huang, J.; Hao, B.; Yang, B.; Chen, S.; Yang, G.; Xu, J. Citrate-based fluorophore-modified cellulose nanocrystals as a biocompatible fluorescent probe for detecting ferric ions and intracellular imaging. Carbohydr. Polym. 2019, 224, 115198. [Google Scholar] [CrossRef] [PubMed]
- Chen, J.; Mao, L.; Qi, H.; Xu, D.; Huang, H.; Liu, M.; Wen, Y.; Deng, F.; Zhang, X.; Wei, Y. Preparation of fluorescent cellulose nanocrystal polymer composites with thermo-responsiveness through light-induced ATRP. Cellulose 2020, 27, 743–753. [Google Scholar] [CrossRef]
- Kim, J.P.; Xie, Z.W.; Creer, M.; Liu, Z.W.; Yang, J. Citrate-based fluorescent materials for low-cost chloride sensing in the diagnosis of Cystic Fibrosis. Chem. Sci. 2016, 8, 550–558. [Google Scholar] [CrossRef] [PubMed]
- Zhang, C.; Kim, J.P.; Creer, M.; Yang, J.; Liu, Z. A smartphone-based chloridometer for point-of-care diagnostics of cystic fibrosis. Biosens. Bioelectron. 2017, 97, 164–168. [Google Scholar] [CrossRef] [PubMed]
- Liu, M.; Lu, X.; Hu, L.; Liu, C.; Li, Y.; Zhang, W.; Ding, C.; Gu, J.; Cao, F. Hydrothermal synthesis of a highly photoluminescent molecule from citric acid and cysteamine for the efficient detection of Au3+ in aqueous solution. Opt. Mater. 2019, 96, 109359. [Google Scholar] [CrossRef]
- Jayaraman, S.; Verkman, A.S. Quenching mechanism of quinolinium-type chloride-sensitive fluorescent indicators. Biophys. Chem. 2000, 85, 49–57. [Google Scholar] [CrossRef]
- Zhang, J.; Yang, L.; Yuan, Y.; Jiang, J.; Yu, S.H. One-Pot Gram-Scale Synthesis of Nitrogen and Sulfur Embedded Organic Dots with Distinctive Fluorescence Behaviors in Free and Aggregated States. Chem. Mater. 2016, 28, 4367–4374. [Google Scholar] [CrossRef]
- Kasprzyk, W.; Świergosz, T.; Bednarz, S.; Walas, K.; Bashmakova, N.V.; Bogdał, D. Luminescence phenomena of carbon dots derived from citric acid and urea–a molecular insight. Nanoscale 2018, 10, 13889–13894. [Google Scholar] [CrossRef]
- Zhu, S.; Zhao, X.; Song, Y.; Lu, S.; Yang, B. Beyond bottom-up carbon nanodots: Citric-acid derived organic molecules. Nano Today 2016, 11, 128–132. [Google Scholar] [CrossRef]
- Khan, S.; Sharma, A.; Ghoshal, S.; Jain, S.; Hazra, M.K.; Nandi, C.K. Small molecular organic nanocrystals resemble carbon nanodots in terms of their properties. Chem. Sci. 2018, 9, 175–180. [Google Scholar] [CrossRef]
- Reckmeier, C.J.; Schneider, J.; Xiong, Y.; Häusler, J.; Kasák, P.; Schnick, W.; Rogach, A.L. Aggregated Molecular Fluorophores in the Ammonothermal Synthesis of Carbon Dots. Chem. Mater. 2017, 29, 10352–10361. [Google Scholar] [CrossRef]
- Kim, S.; Seo, J.; Park, S.Y. Torsion-induced fluorescence quenching in excited-state intramolecular proton transfer (ESIPT) dyes. J. Photochem. Photobiol. A 2007, 191, 19–24. [Google Scholar] [CrossRef]
- Yang, J.; Zhang, Y.; Gautam, S.; Liu, L.; Dey, J.; Chen, W.; Mason, R.P.; Serrano, C.A.; Schug, K.A.; Tang, L. Development of aliphatic biodegradable photoluminescent polymers. Proc. Natl. Acad. Sci. USA 2009, 106, 10086–10091. [Google Scholar] [CrossRef] [PubMed]
- Gao, W.; Song, H.; Wang, X.; Liu, X.; Pang, X.; Zhou, Y.; Gao, B.; Peng, X. Carbon Dots with Red Emission for Sensing of Pt2+, Au3+, and Pd2+ and Their Bioapplications in Vitro and in Vivo. ACS Appl. Mater. Interfaces 2018, 10, 1147–1154. [Google Scholar] [CrossRef]
- Meng, X.; Wang, Y.; Liu, X.; Wang, M.; Zhan, Y.; Liu, Y.; Zhu, W.; Zhang, W.; Shi, L.; Fang, X. Supramolecular nanodots derived from citric acid and beta-amines with high quantum yield and sensitive photoluminescence. Opt. Mater. 2018, 77, 48–54. [Google Scholar] [CrossRef]
- Shuang, E.; Mao, Q.X.; Yuan, X.L.; Kong, X.L.; Chen, X.W.; Wang, J.H. Targeted imaging of the lysosome and endoplasmic reticulum and their pH monitoring with surface regulated carbon dots. Nanoscale 2018, 10, 12788–12796. [Google Scholar]
- Segal, L.; Creely, J.J.; Martin, A.E.; Conrad, C.M. An Empirical Method for Estimating the Degree of Crystallinity of Native Cellulose Using the X-ray Diffractometer. Text. Res. J. 1959, 29, 786–794. [Google Scholar] [CrossRef]
- Wang, J.; Song, Y.; Sun, J.; Wu, X.; Sun, Y.; Pan, X.; Li, D. Miniature fluorescent sensor for chloride ion concentration determination based on modified Stern–Volmer Equation. Measurement 2013, 46, 3982–3987. [Google Scholar] [CrossRef]
- Zhang, F.; Ma, C.; Wang, Y.; Liu, W.; Liu, X.; Zhang, H. Fluorescent probes for chloride ions in biological samples. Spectrochim. Acta A Mol. Biomol. Spectrosc. 2018, 205, 428–434. [Google Scholar] [CrossRef]
- Wang, H.X.; Yang, Z.; Liu, Z.G.; Wan, J.Y.; Xiao, J.; Zhang, H.L. Facile Preparation of Bright-Fluorescent Soft Materials from Small Organic Molecules. Chem. Eur. J. 2016, 22, 8096–8104. [Google Scholar] [CrossRef]
- Shi, L.; Yang, J.H.; Zeng, H.B.; Chen, Y.M.; Yang, S.C.; Wu, C.; Zeng, H.; Yoshihito, O.; Zhang, Q. Carbon dots with high fluorescence quantum yield: The fluorescence originates from organic fluorophores. Nanoscale 2016, 8, 14374–14378. [Google Scholar] [PubMed]
- French, A.D.; Cintrón, M.S. Cellulose polymorphy, crystallite size, and the Segal Crystallinity Index. Cellulose 2013, 20, 583–588. [Google Scholar] [CrossRef]
- Tan, X.Y.; Hamid, S.B.A.; Lai, C.W. Preparation of high crystallinity cellulose nanocrystals (CNCs) by ionic liquid solvolysis. Biomass Bioenergy 2015, 81, 584–591. [Google Scholar]
- Chen, L.; Zhu, J.Y.; Baez, C.; Kitin, P.; Elder, T. Highly Thermal-stable and Functional Cellulose Nanocrystals and Nanofibrils Produced Using Fully Recyclable Organic Acids. Green Chem. 2016, 18, 3835–3843. [Google Scholar]
- Kono, H.; Yunoki, S.; Shikano, T.; Fujiwara, M.; Erata, T.; Takai, M. CP/MAS 13C NMR Study of Cellulose and Cellulose Derivatives. 1. Complete Assignment of the Cp/Mas 13C NMR Spectrum of the Native Cellulose. J. Am. Chem. Soc. 2002, 124, 7506–7511. [Google Scholar] [CrossRef]
- Li, Y.; Liu, Y.; Chen, W.; Wang, Q.; Liu, Y.; Li, J.; Yu, H. Facile extraction of cellulose nanocrystals from wood using ethanol and peroxide solvothermal pretreatment followed by ultrasonic nanofibrillation. Green Chem. 2016, 18, 1010–1018. [Google Scholar]
- Deepa, B.; Abraham, E.; Cordeiro, N.; Mozetic, M.; Mathew, A.P.; Oksman, K.; Faria, M.; Thomas, S.; Pothan, L.A. Utilization of various lignocellulosic biomass for the production of nanocellulose: A comparative study. Cellulose 2015, 22, 1075–1090. [Google Scholar] [CrossRef]
- Ramirez, J.A.A.; Fortunati, E.; Kenny, J.M.; Torre, L.; Foresti, M.L. Simple citric acid-catalyzed surface esterification of cellulose nanocrystals. Carbohydr. Polym. 2017, 157, 1358–1364. [Google Scholar] [CrossRef]
- Pääkkö, M.; Ankerfors, M.; Kosonen, H.; Nykänen, A.; Ahola, S.; Österberg, M.; Ruokolainen, J.; Laine, J.; Larsson, P.T.; Ikkala, O.; et al. Enzymatic Hydrolysis Combined with Mechanical Shearing and High-Pressure Homogenization for Nanoscale Cellulose Fibrils and Strong Gels. Biomacromolecules 2007, 8, 1934–1941. [Google Scholar]
- Li, Y.; Yu, S.; Chen, P.; Rojas, R.; Hajian, A.; Berglund, L. Cellulose nanofibers enable paraffin encapsulation and the formation of stable thermal regulation nanocomposites. Nano Energy 2017, 34, 541–548. [Google Scholar]
- Li, B.; Xu, W.; Kronlund, D.; Määttänen, A.; Liu, J.; Smått, J.H.; Peltonen, J.; Willför, S.; Mu, X.; Xu, C. Cellulose nanocrystals prepared via formic acid hydrolysis followed by TEMPO-mediated oxidation. Carbohydr. Polym. 2015, 133, 605–612. [Google Scholar] [CrossRef] [PubMed]
- Lu, Q.; Lu, L.; Li, Y.; Huang, B. Facile manufacture of cellulose nanoparticles in high yields by efficient cleavage of hydrogen bonds via mechanochemical synergy. Cellulose 2019, 26, 7741–7751. [Google Scholar] [CrossRef]
- Du, H.; Liu, C.; Mu, X.; Gong, W.; Lv, D.; Hong, Y.; Si, C.; Li, B. Preparation and characterization of thermally stable cellulose nanocrystals via a sustainable approach of FeCl3-catalyzed formic acid hydrolysis. Cellulose 2016, 23, 2389–2407. [Google Scholar] [CrossRef]
- Karolin, J.; Geddes, C.D.; Wynne, K.; Birch, D.J.S. Nanoparticle metrology in sol-gels using multiphoton excited fluorescence. Meas. Sci. Technol. 2001, 13, 21–27. [Google Scholar] [CrossRef]
- Hai, J.; Li, T.; Su, J.; Liu, W.; Ju, Y.; Wang, B.; Hou, Y. Anions Reversibly Responsive Luminescent Tb(III) Nanocellulose Complex Hydrogels for Latent Fingerprint Detection and Encryption. Angew. Chem. Int. Ed. 2018, 57, 6786–6790. [Google Scholar] [CrossRef] [PubMed]


Publisher’s Note: MDPI stays neutral with regard to jurisdictional claims in published maps and institutional affiliations. |
© 2022 by the authors. Licensee MDPI, Basel, Switzerland. This article is an open access article distributed under the terms and conditions of the Creative Commons Attribution (CC BY) license (https://creativecommons.org/licenses/by/4.0/).
Share and Cite
Lu, Q.; Wu, J.; Wang, H.; Huang, B. One-Pot Green Preparation of Fluorescent Cellulose Nanofibers. Polymers 2022, 14, 1313. https://doi.org/10.3390/polym14071313
Lu Q, Wu J, Wang H, Huang B. One-Pot Green Preparation of Fluorescent Cellulose Nanofibers. Polymers. 2022; 14(7):1313. https://doi.org/10.3390/polym14071313
Chicago/Turabian StyleLu, Qilin, Jiayin Wu, Hanchen Wang, and Biao Huang. 2022. "One-Pot Green Preparation of Fluorescent Cellulose Nanofibers" Polymers 14, no. 7: 1313. https://doi.org/10.3390/polym14071313
APA StyleLu, Q., Wu, J., Wang, H., & Huang, B. (2022). One-Pot Green Preparation of Fluorescent Cellulose Nanofibers. Polymers, 14(7), 1313. https://doi.org/10.3390/polym14071313