
Expandable Graphite, Aluminum Diethylphospinate and Melamine Polyphosphate as Flame Retarding System in Glass Fiber-Reinforced PA6


Abstract
:
1. Introduction
2. Materials and Methods
2.1. Materials and Preparation
2.2. Microscopy and Particle Distribution
2.3. Thermal and Gas Analytics
2.4. Fire Testing
2.5. Char Residue Analysis
3. Results
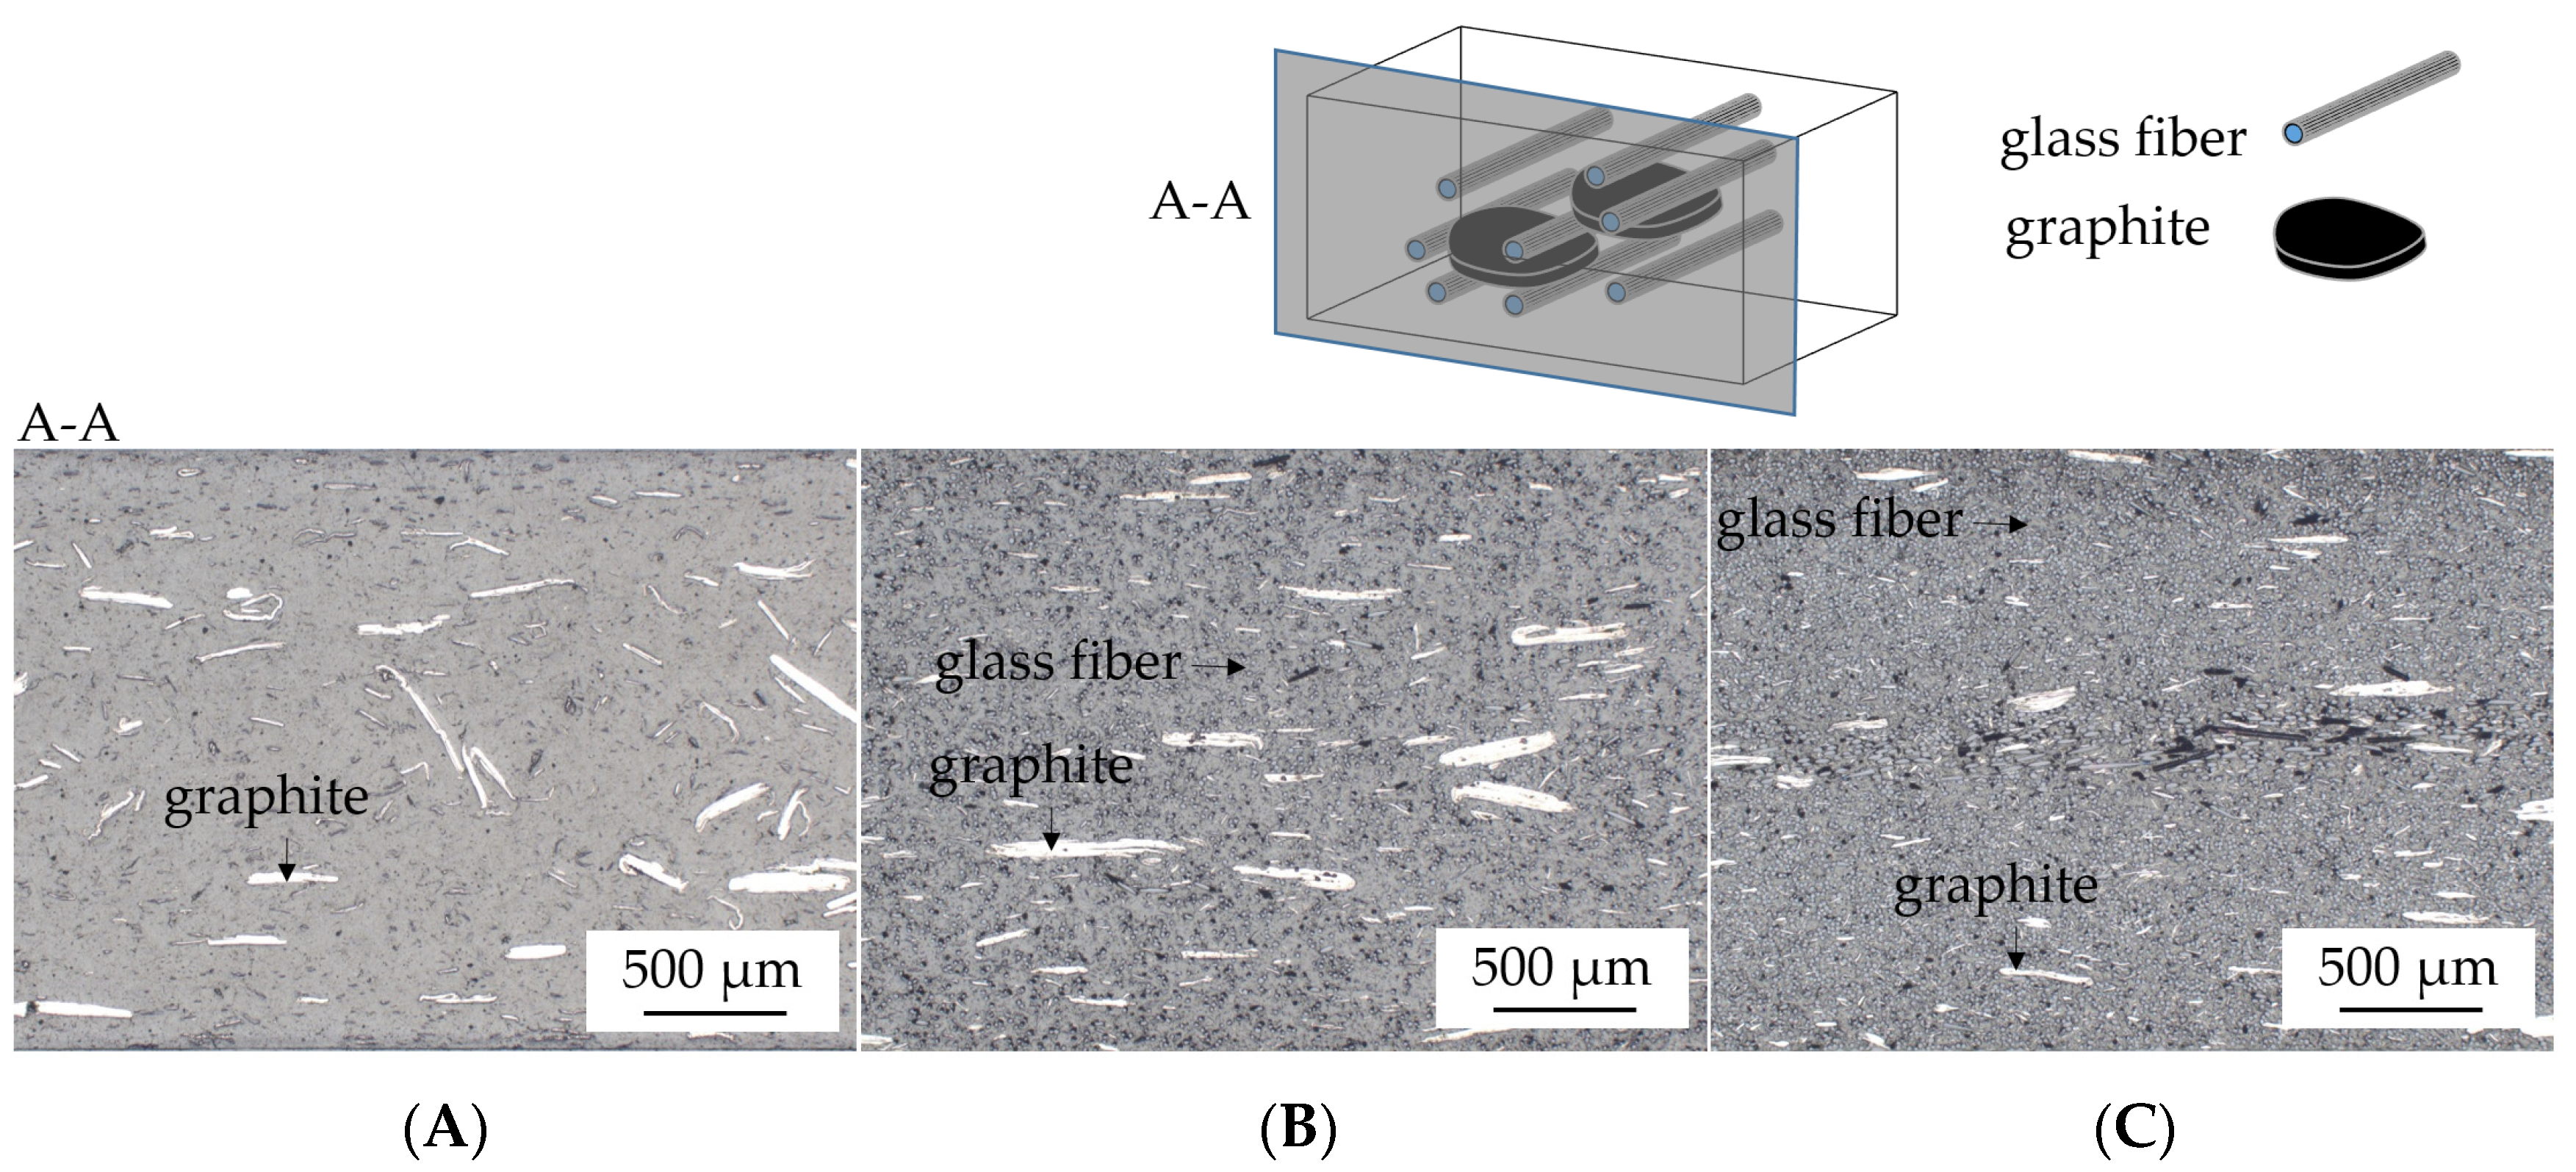
3.1. Microscopy
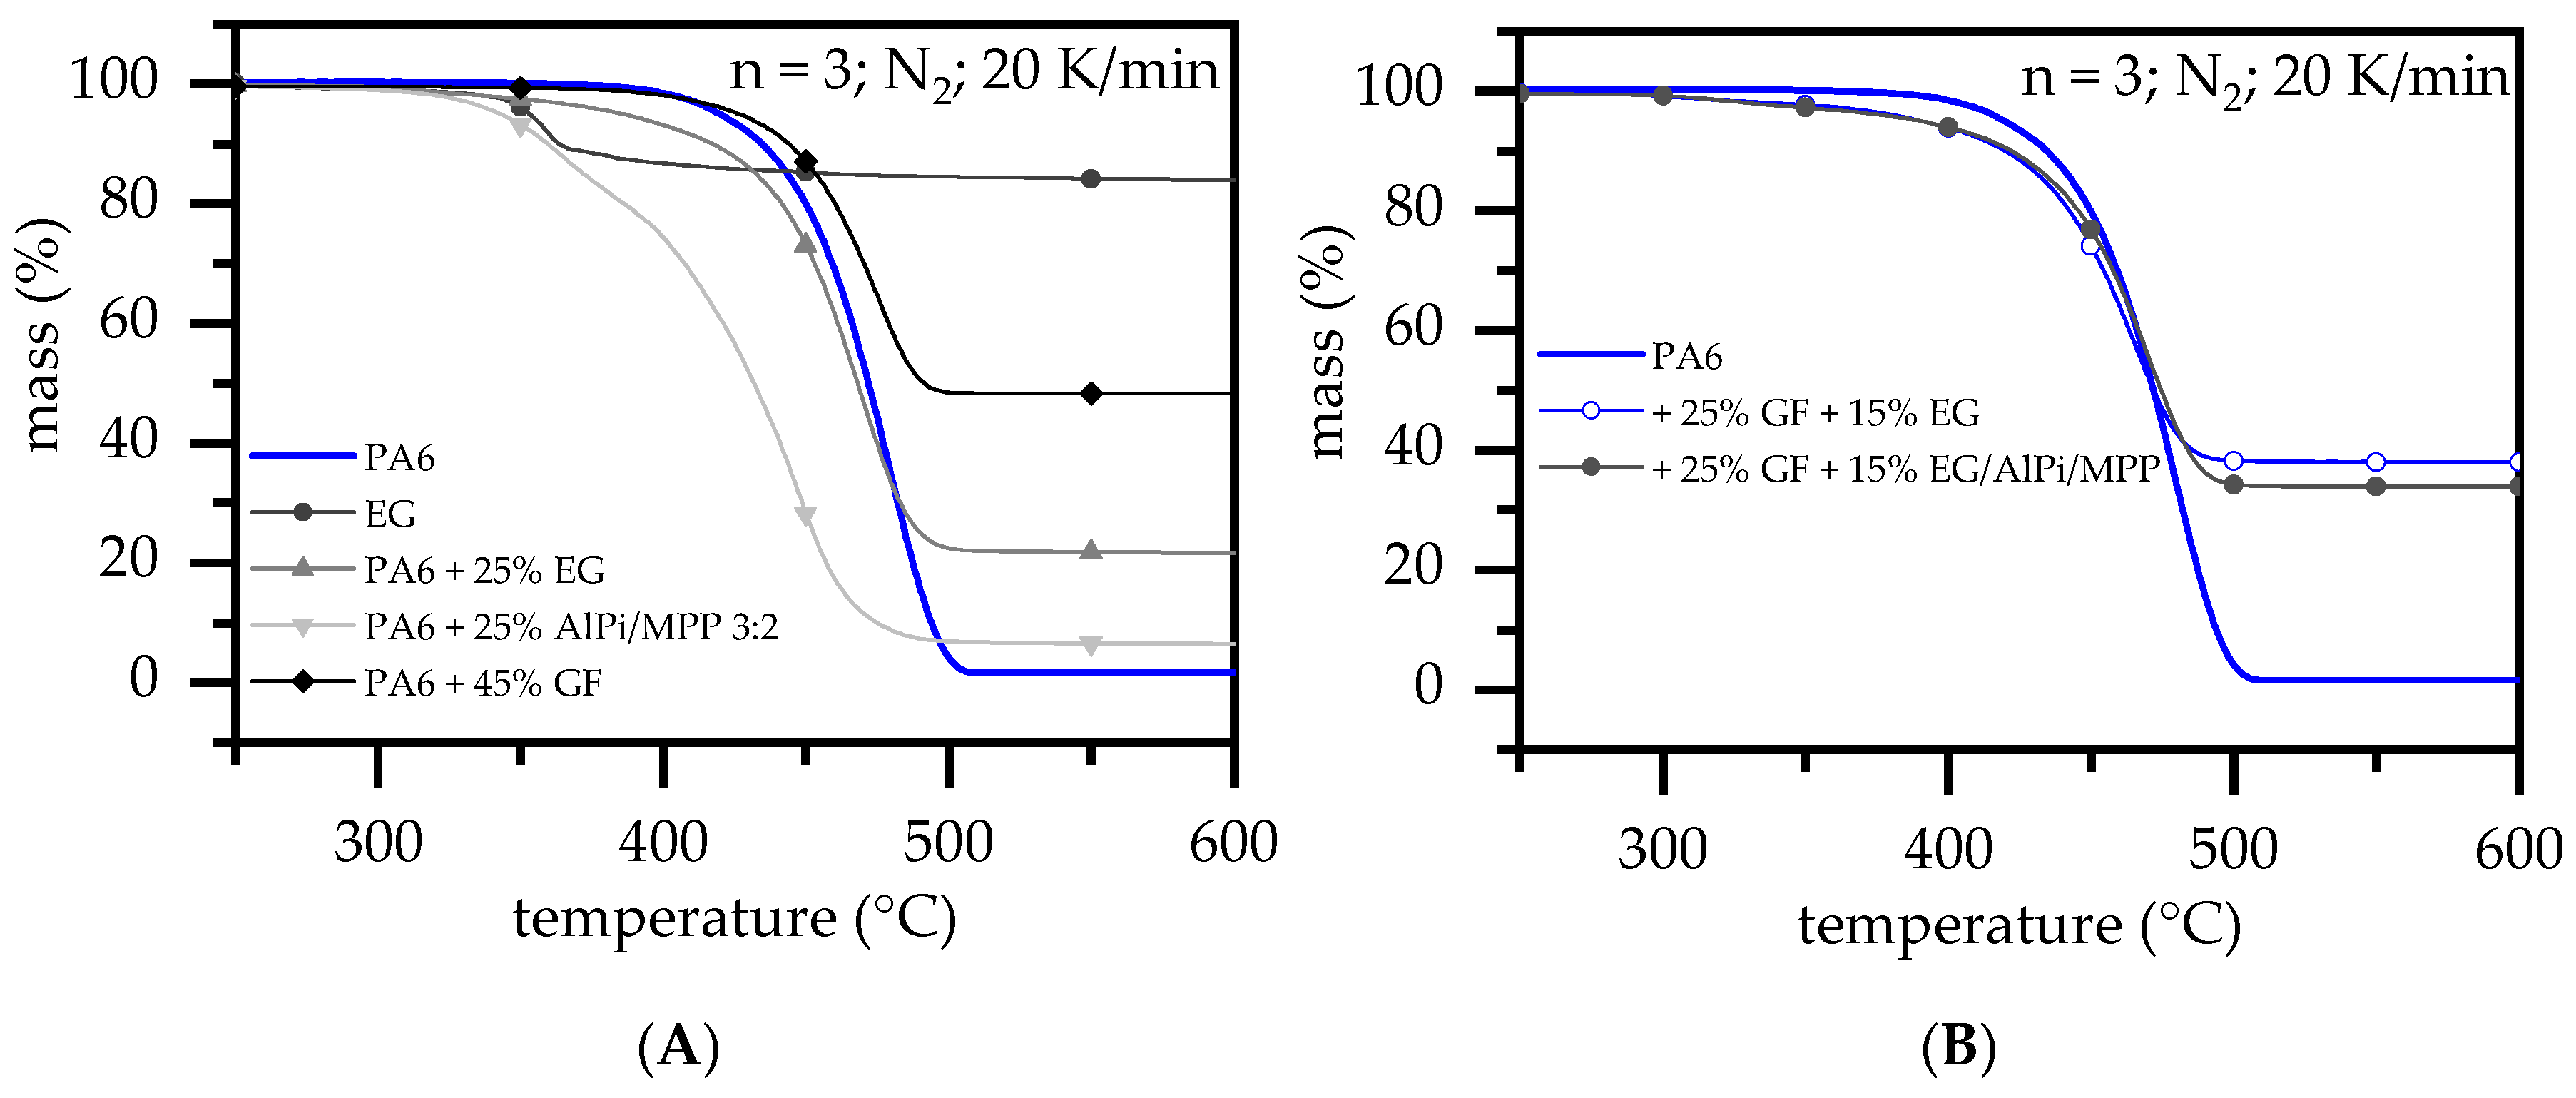
3.2. Thermal Analysis: TGA and DSC
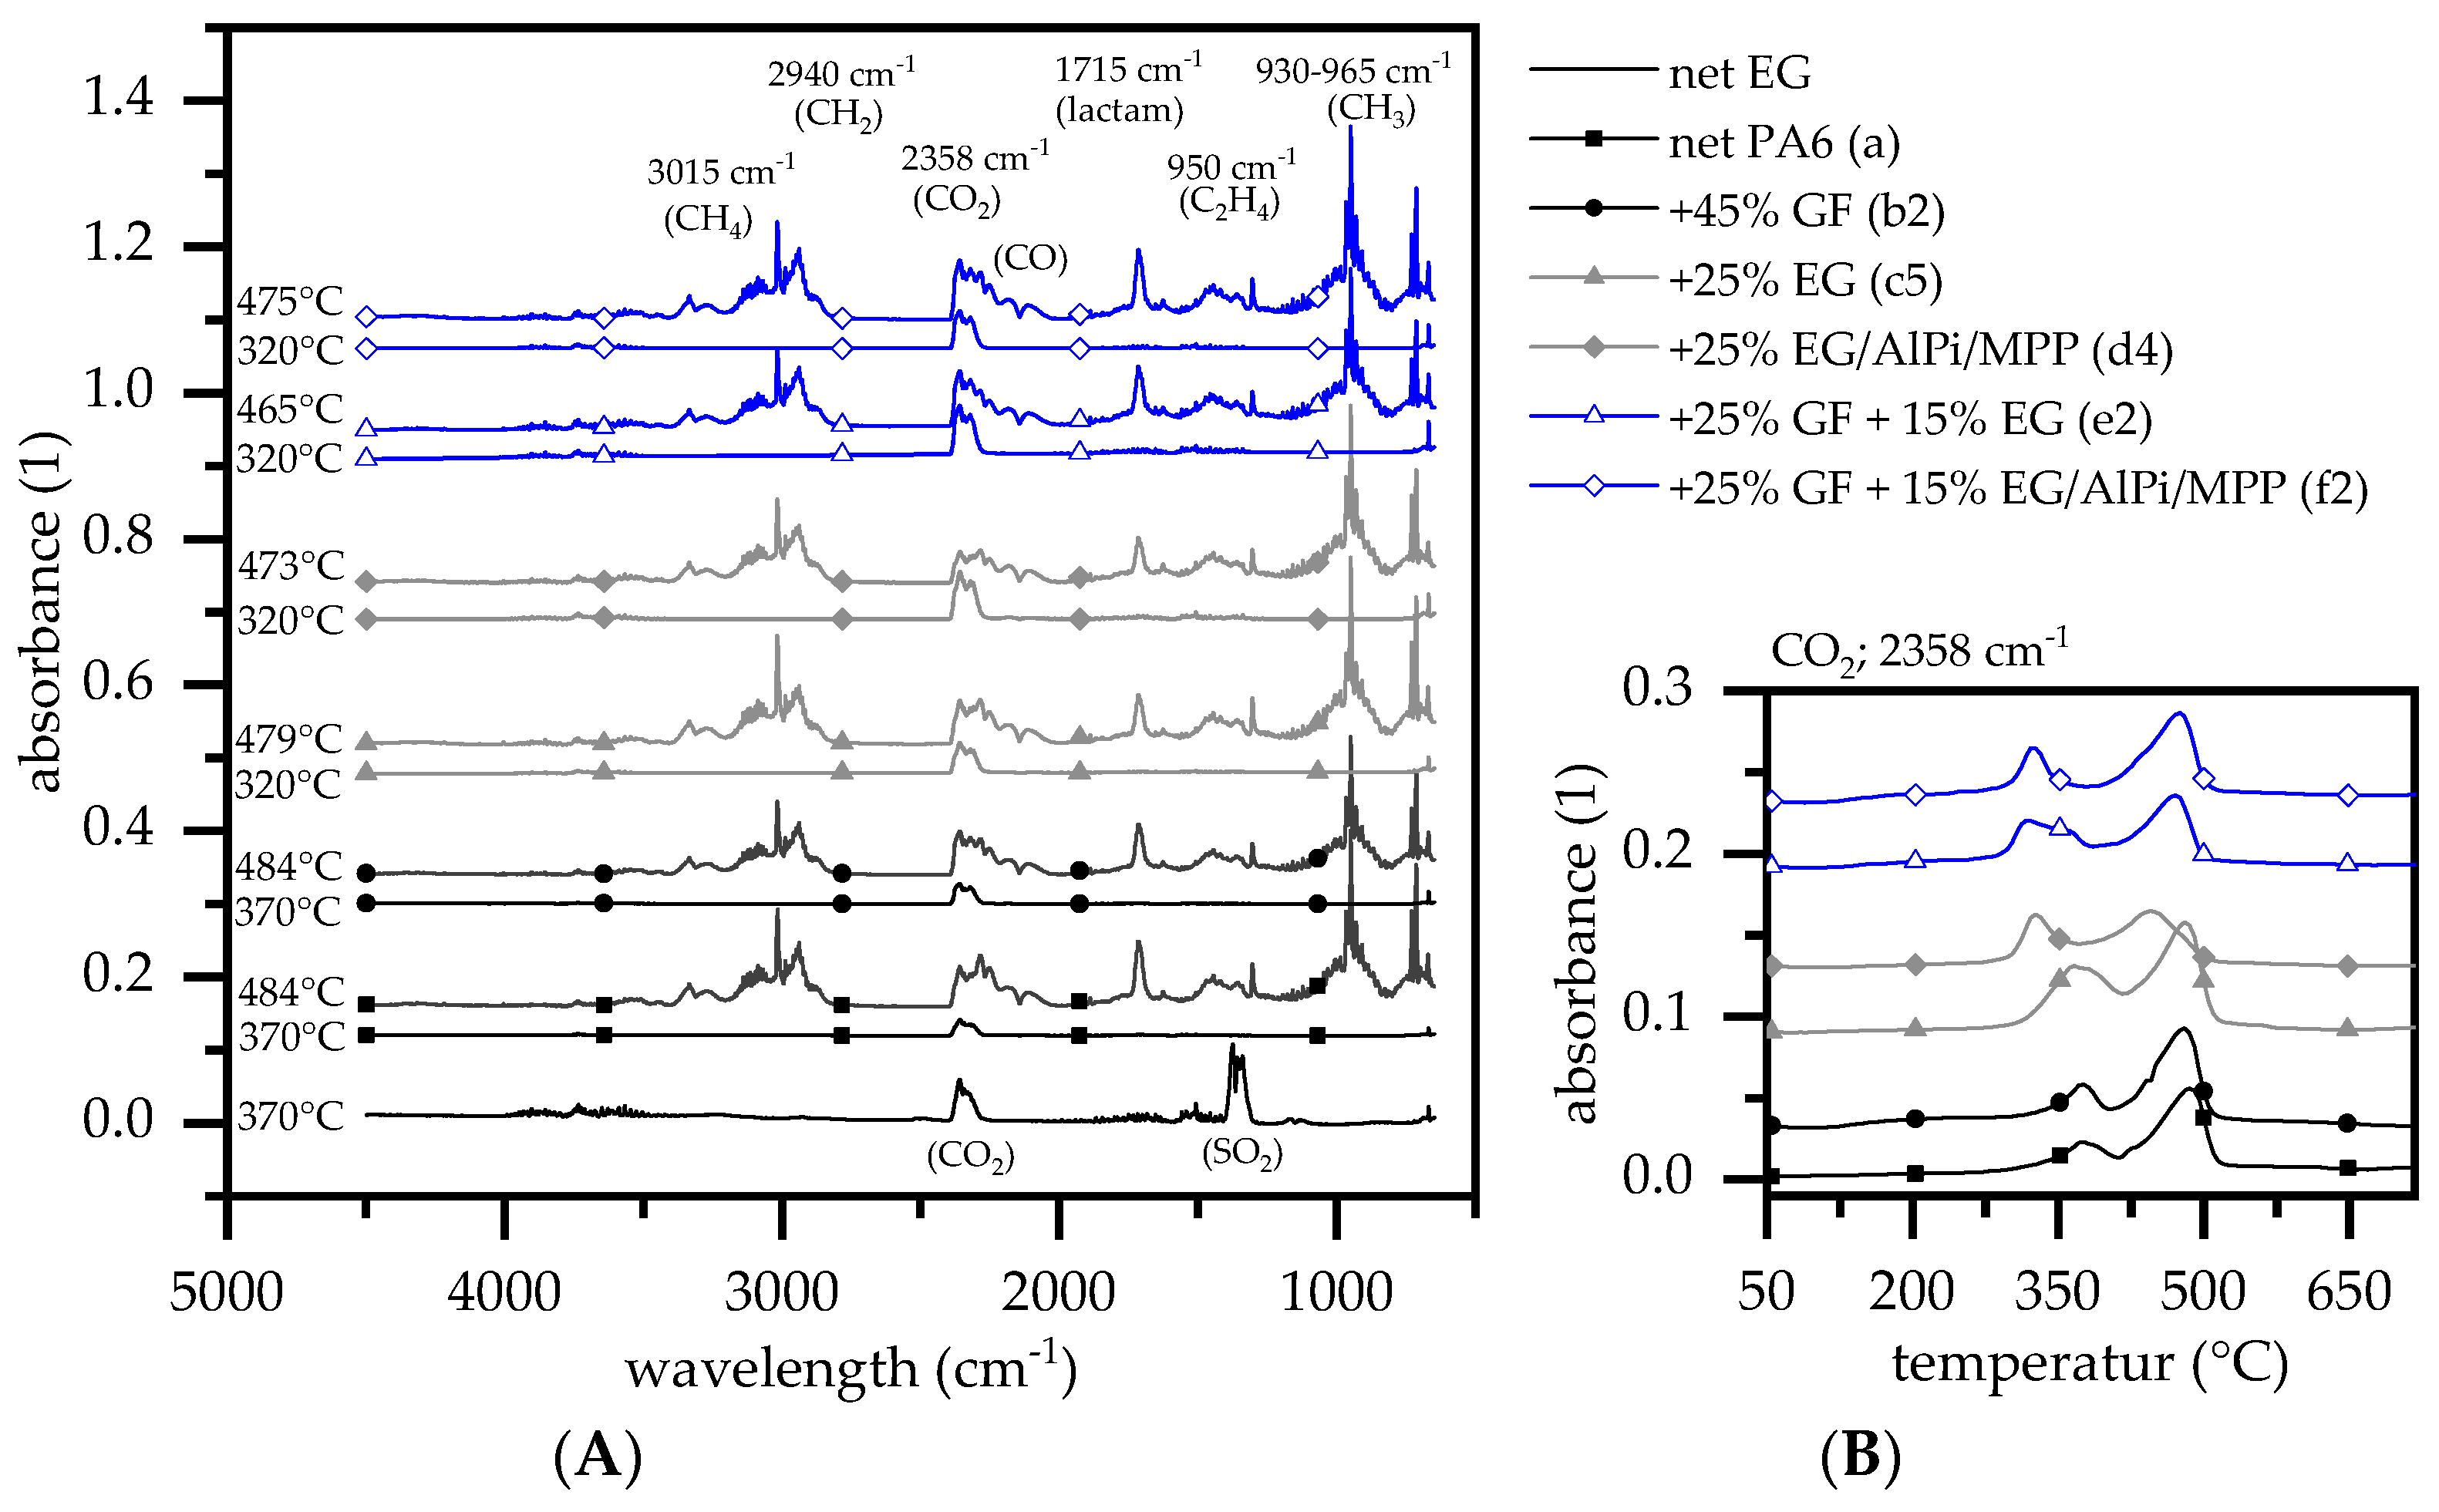
3.3. Evolved Gas Analysis: TGA-FTIR
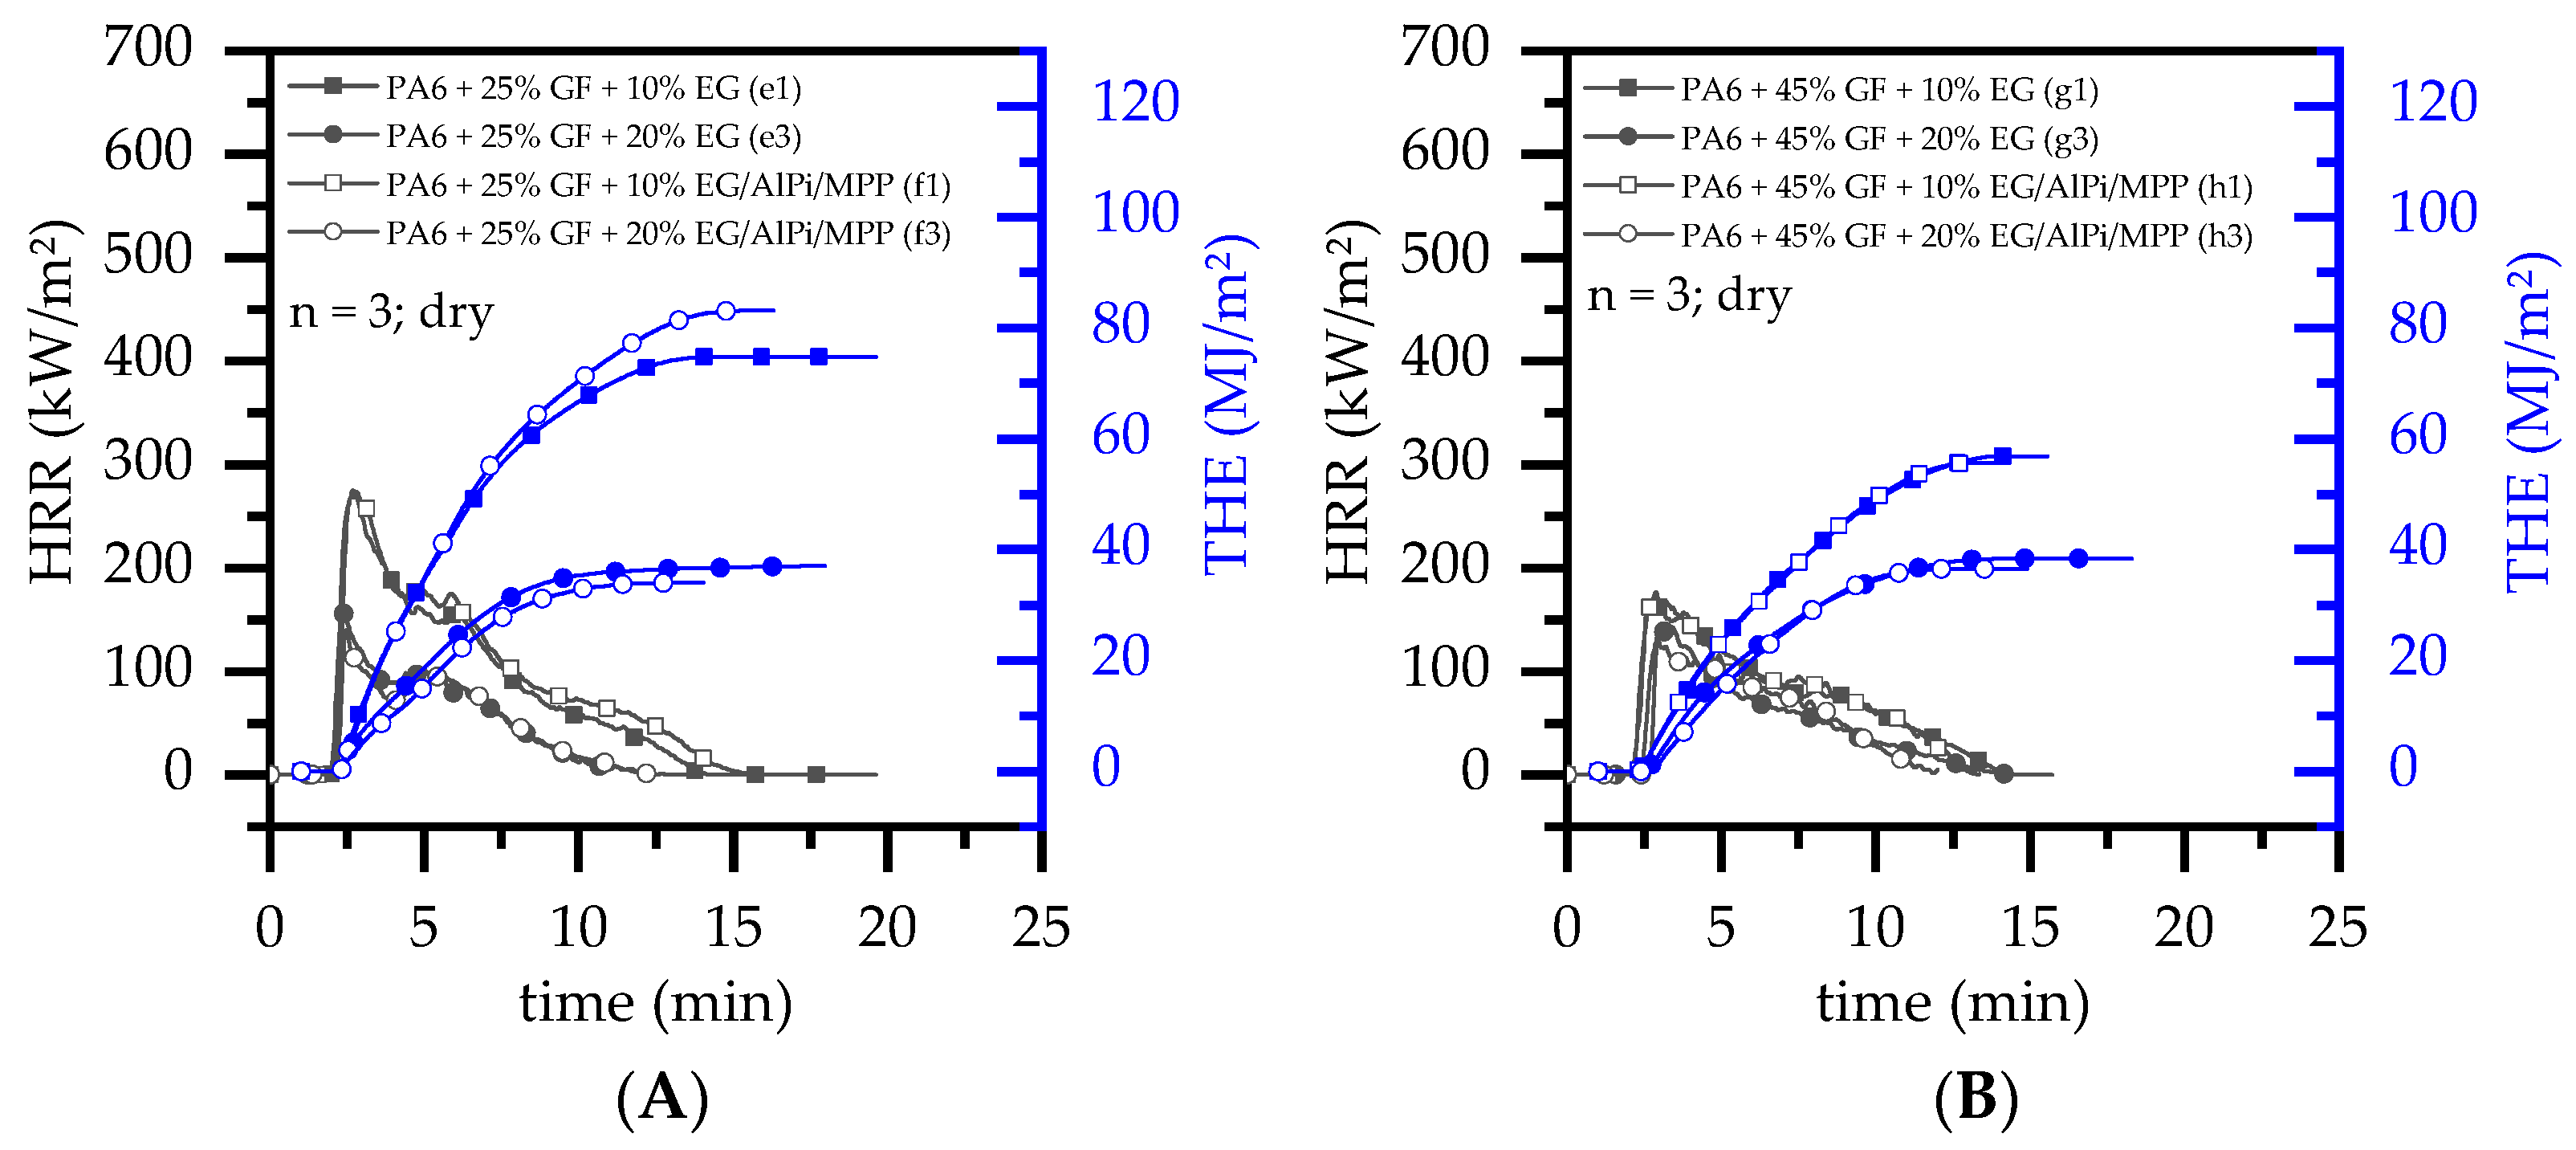
3.4. Burning Behavior: Cone Calorimeter Test
- (1)
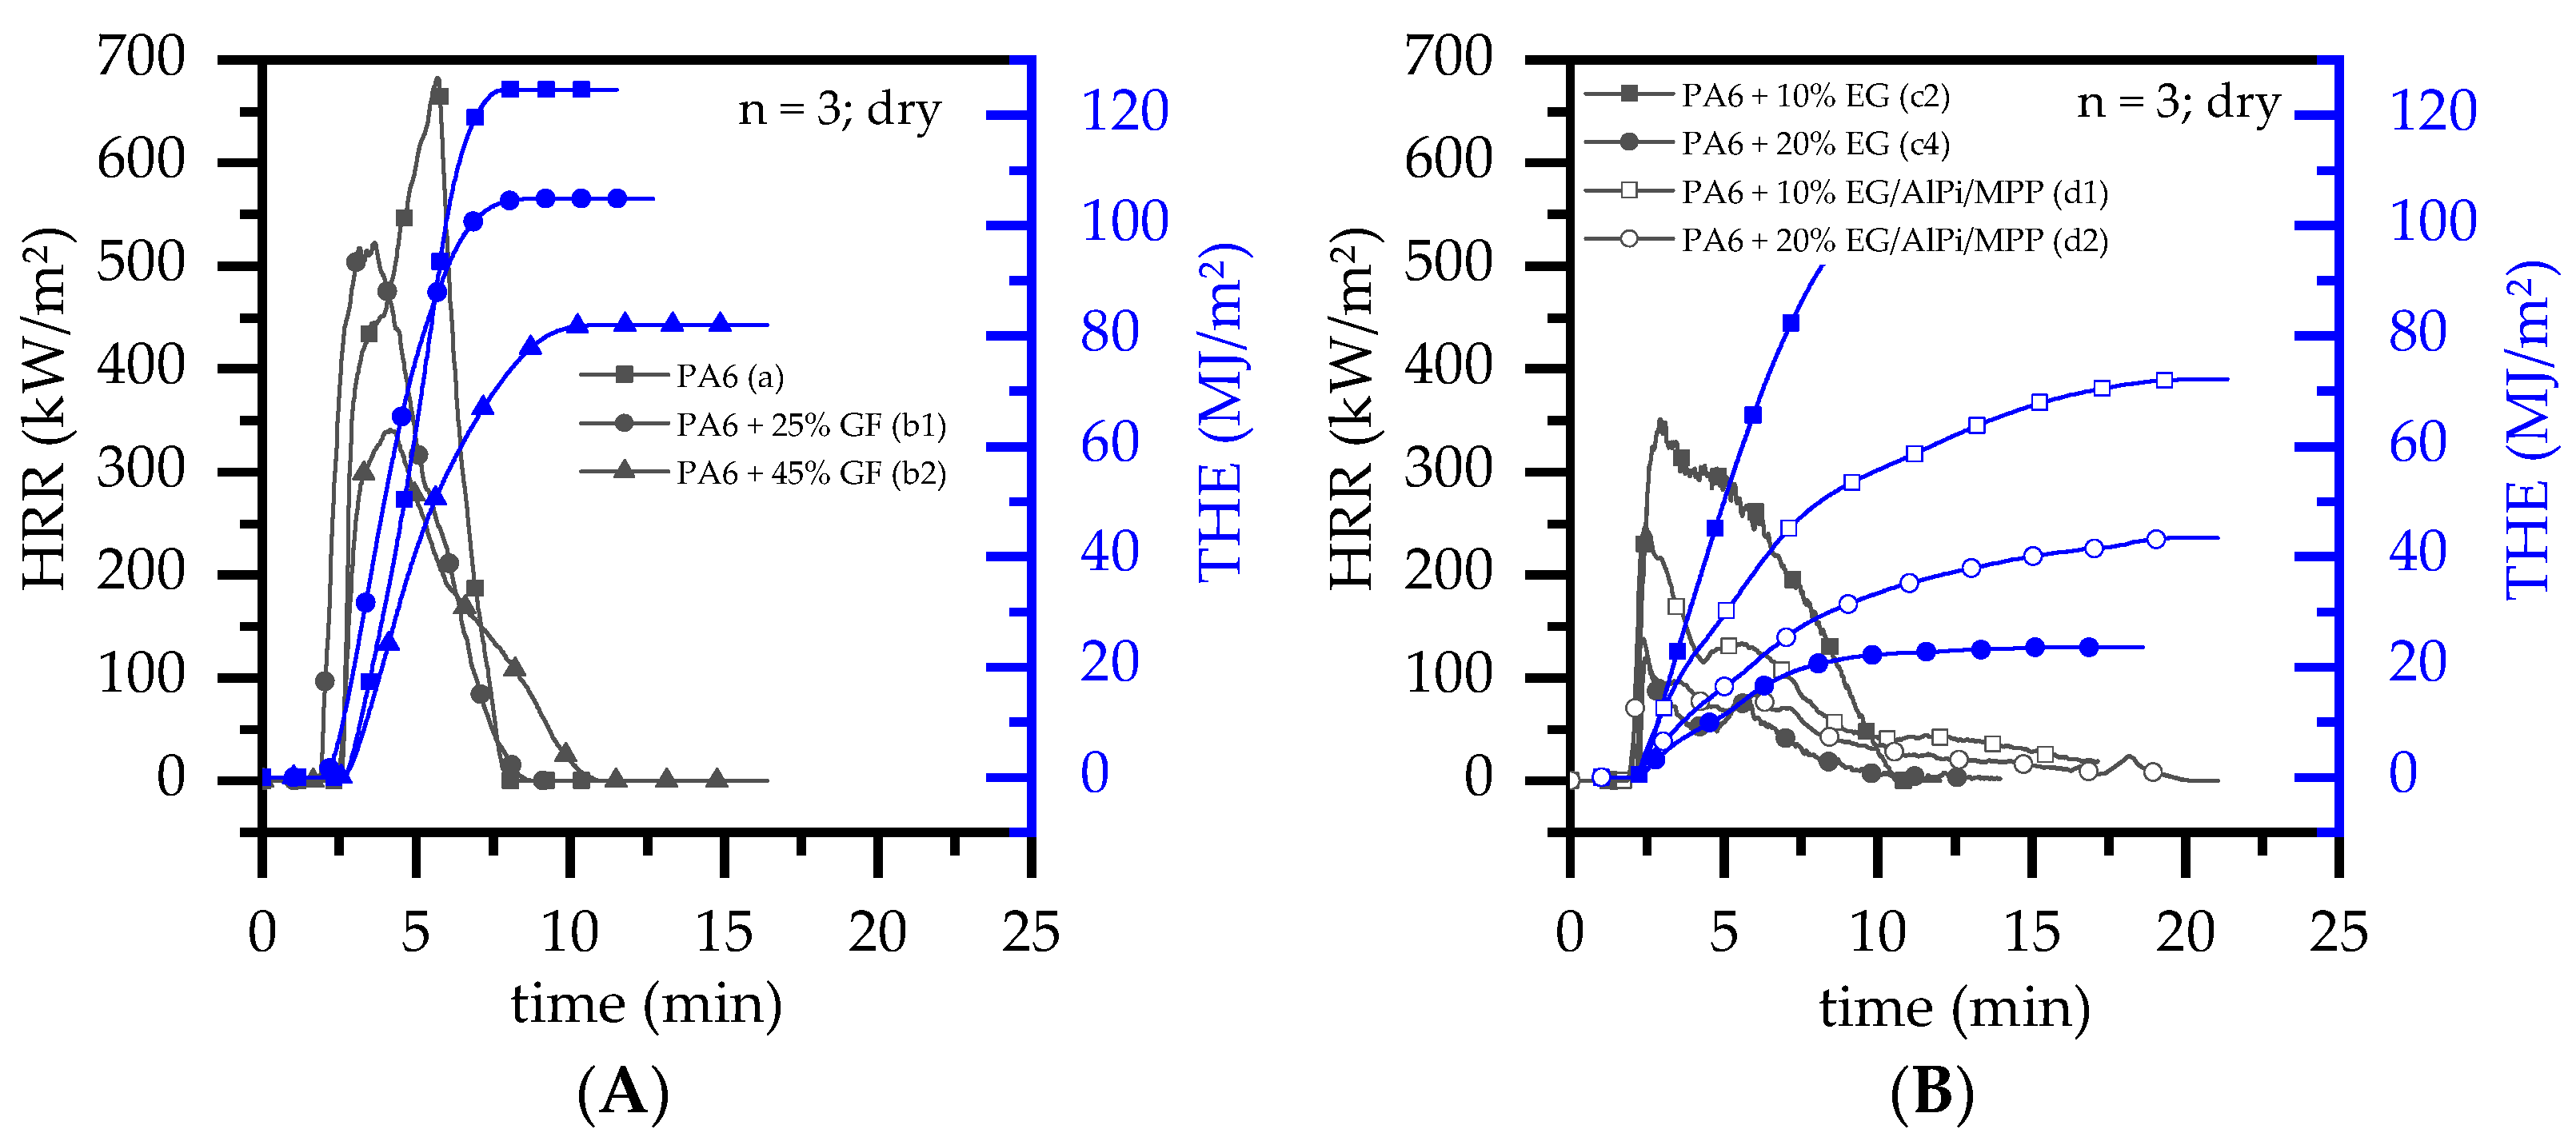
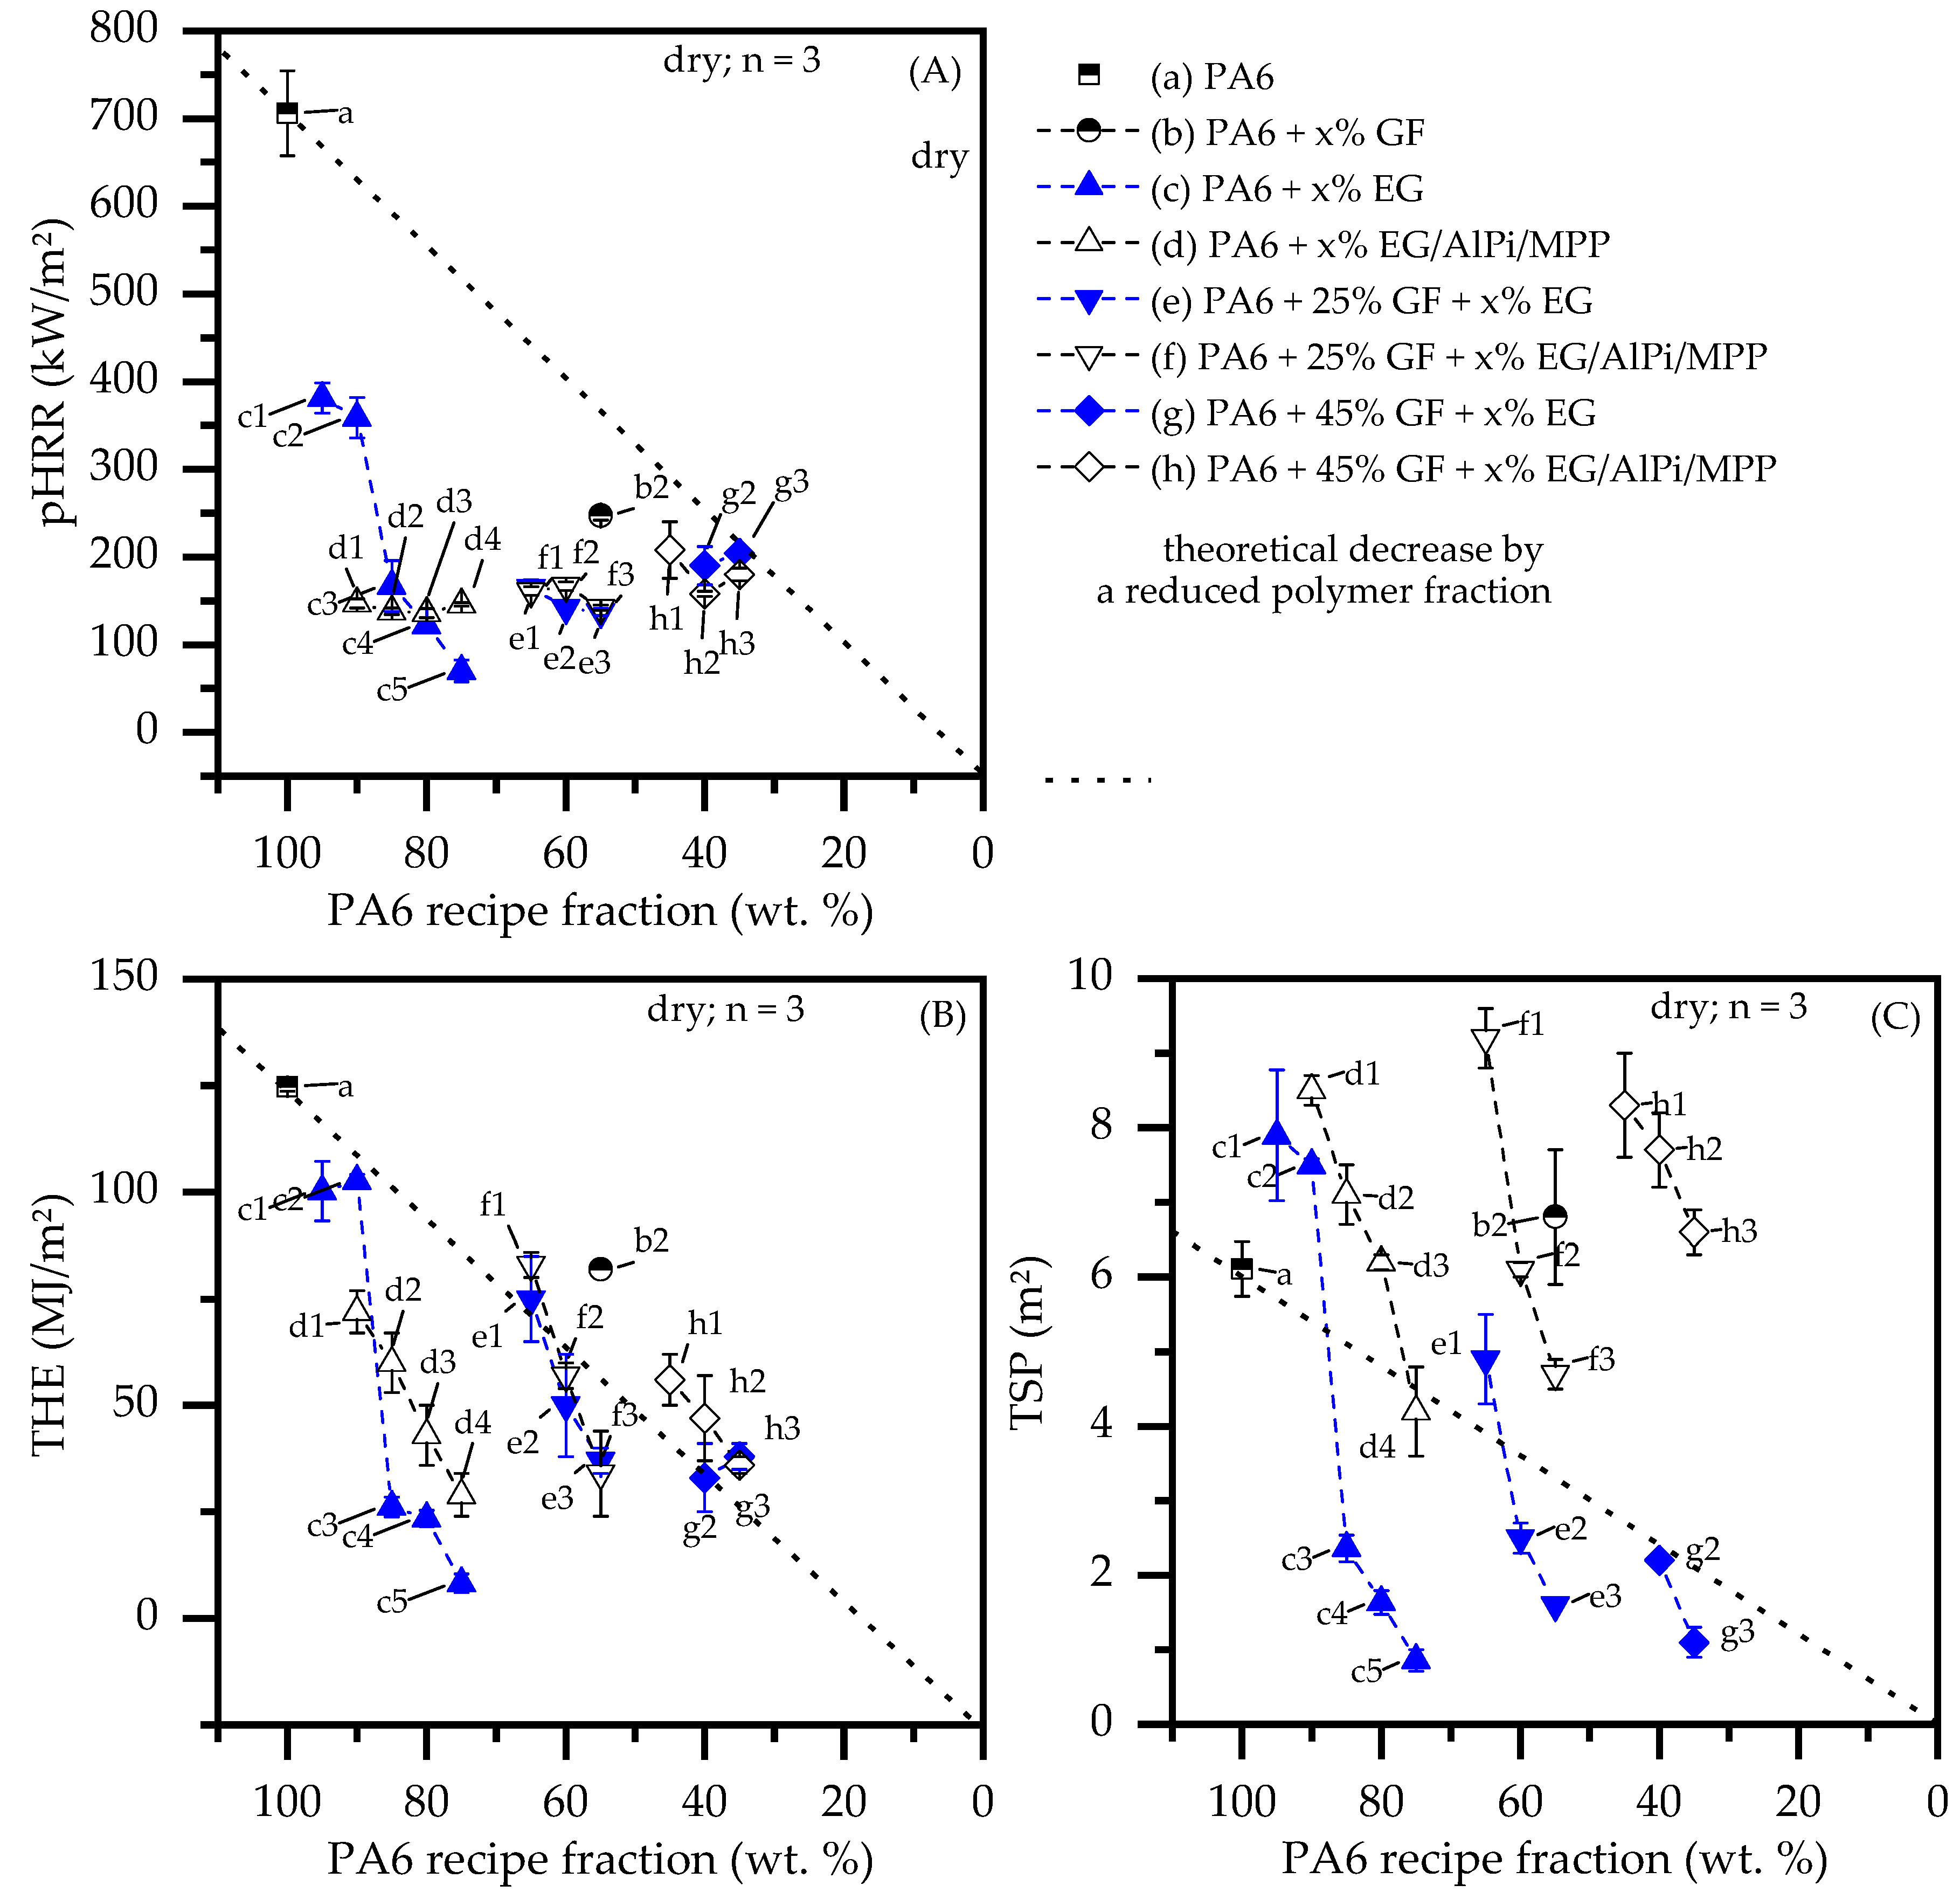
- With ongoing fuel evaporation, an increasingly larger proportion of the glass fiber residue was exposed. The fiberglass network had a porous and easily gas-permeable characteristic, which offered little thermal protection, particularly during early burning stages. Instead, the residue promoted the mass transport of combustion gases from deeper material layers provided by the “wicking effect” and an enlarged surface area. Speaking of the characteristics recorded in the cone calorimeter testing environment, the pHRR relative to the ignition time was reached earlier than for net PA6. This development was also reflected in the mass loss rate (MLR). Whereas the MLR within the first 30 s after ignition for net PA6 was 2.9 ± 0.5 g/min, PA6 containing 25 wt.% (15 vol.%) and 45 wt.% (30 vol.%) glass fiber showed significantly higher rates at 3.8 ± 0.6 g/min (+30%) and 4.4 ± 0.4 g/min (+50%), respectively. (Please note: the given mass loss rates can be used only for comparative reasons. The calculated time range was chosen as the “best suitable range” for dry samples in order to representatively express early mass loss stages consolidated in one key figure.) With larger proportions of incorporated glass fibers, the relative amount of matrix polymer reduced, so that less burning material was available and a lower overall pHRR was achieved.
- (2)
- The second effect that could be observed for solely glass fiber reinforced PA6 was an increasing amount of residue, acting to some extend as a physical barrier. Simultaneously, the quantity of potential fuels reduced, mutually supporting a lower pHRR as well as a lower average heat release rate (AHRE). This effect became more evident for PA6 containing higher glass fiber fractions, resulting in a more or less linear decline in important key figures.
- (1)
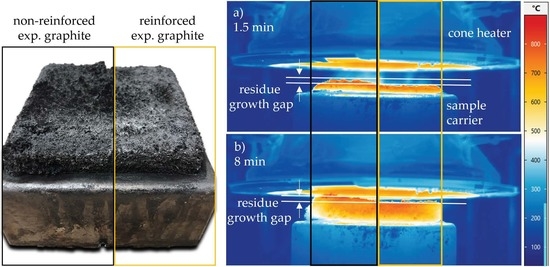
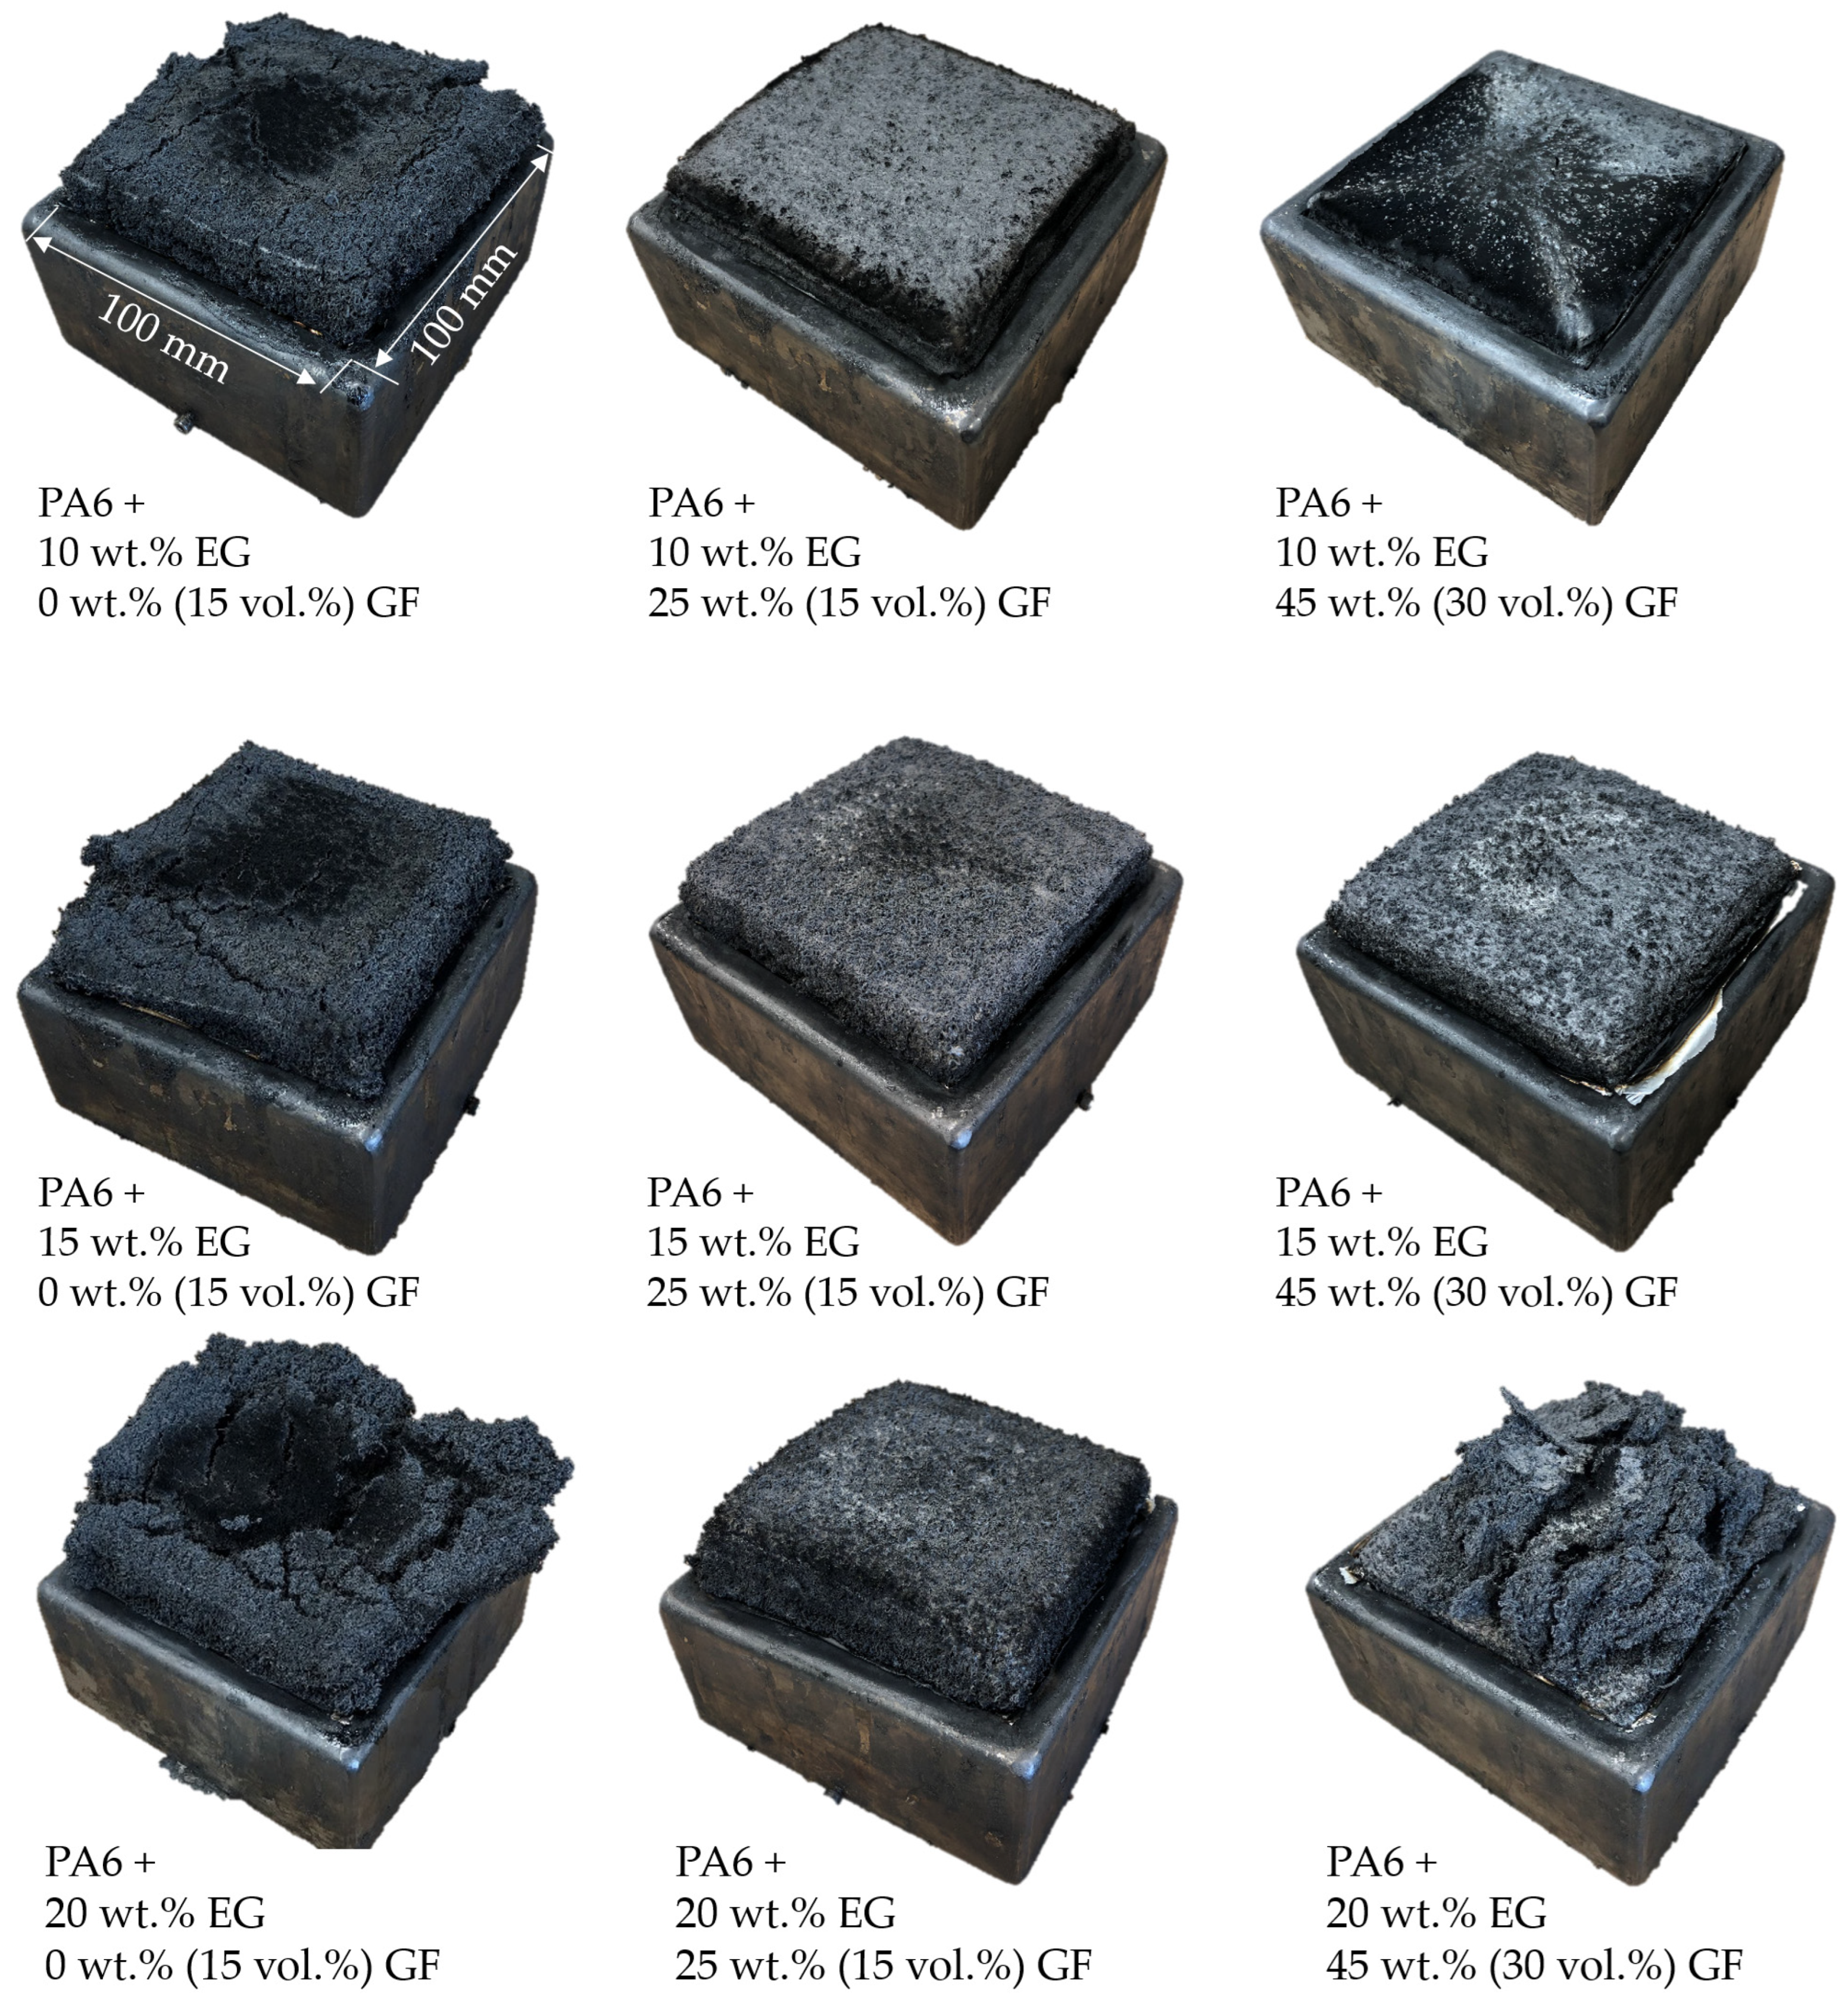
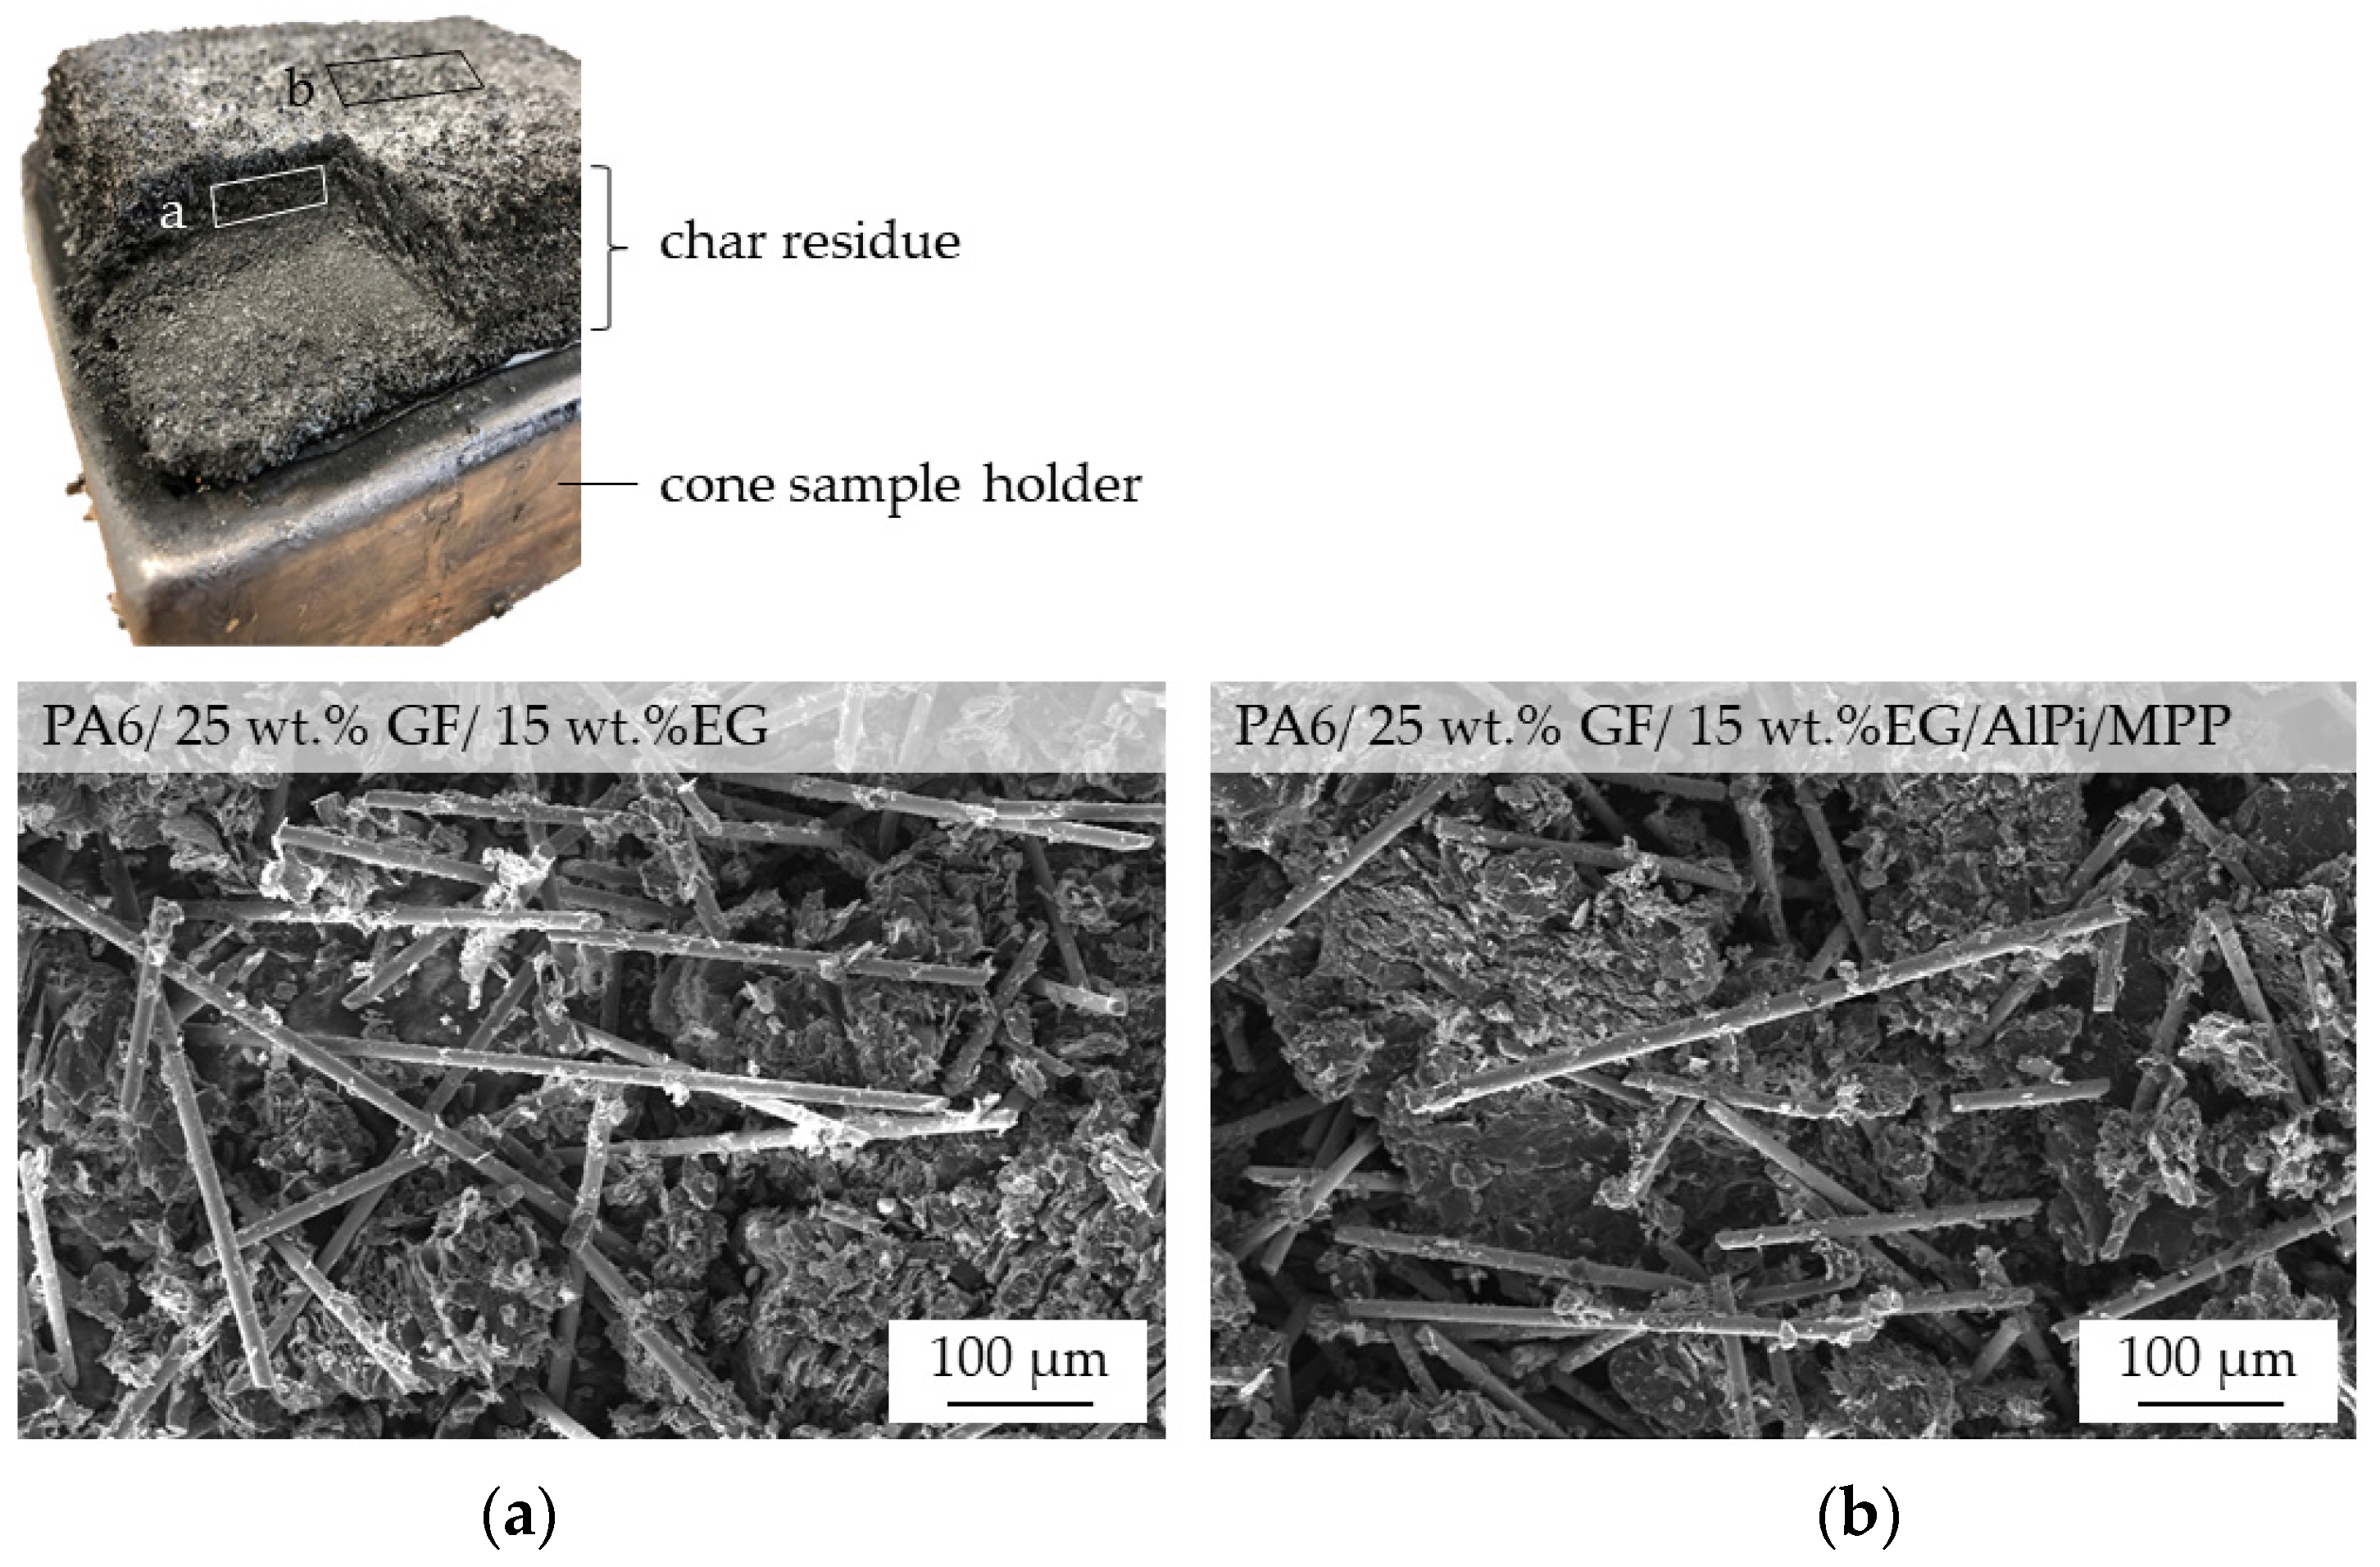
- Results generated by cone calorimeter tests are particularly sensitive to effective residue formation. Compared to non-reinforced PA6 systems containing EG, high GF fractions seemed to reduce the resulting expansion volume as well as the built up speed. We assume two complementary effects to be responsible: (a) a spatially restricted freedom arising from the GF network blocking EG expansion and (b) process-induced sheering, which caused a reduction the size of EG particles, as seen in Figure 1, and thus a decrease in the potential blowing volume.
- (2)
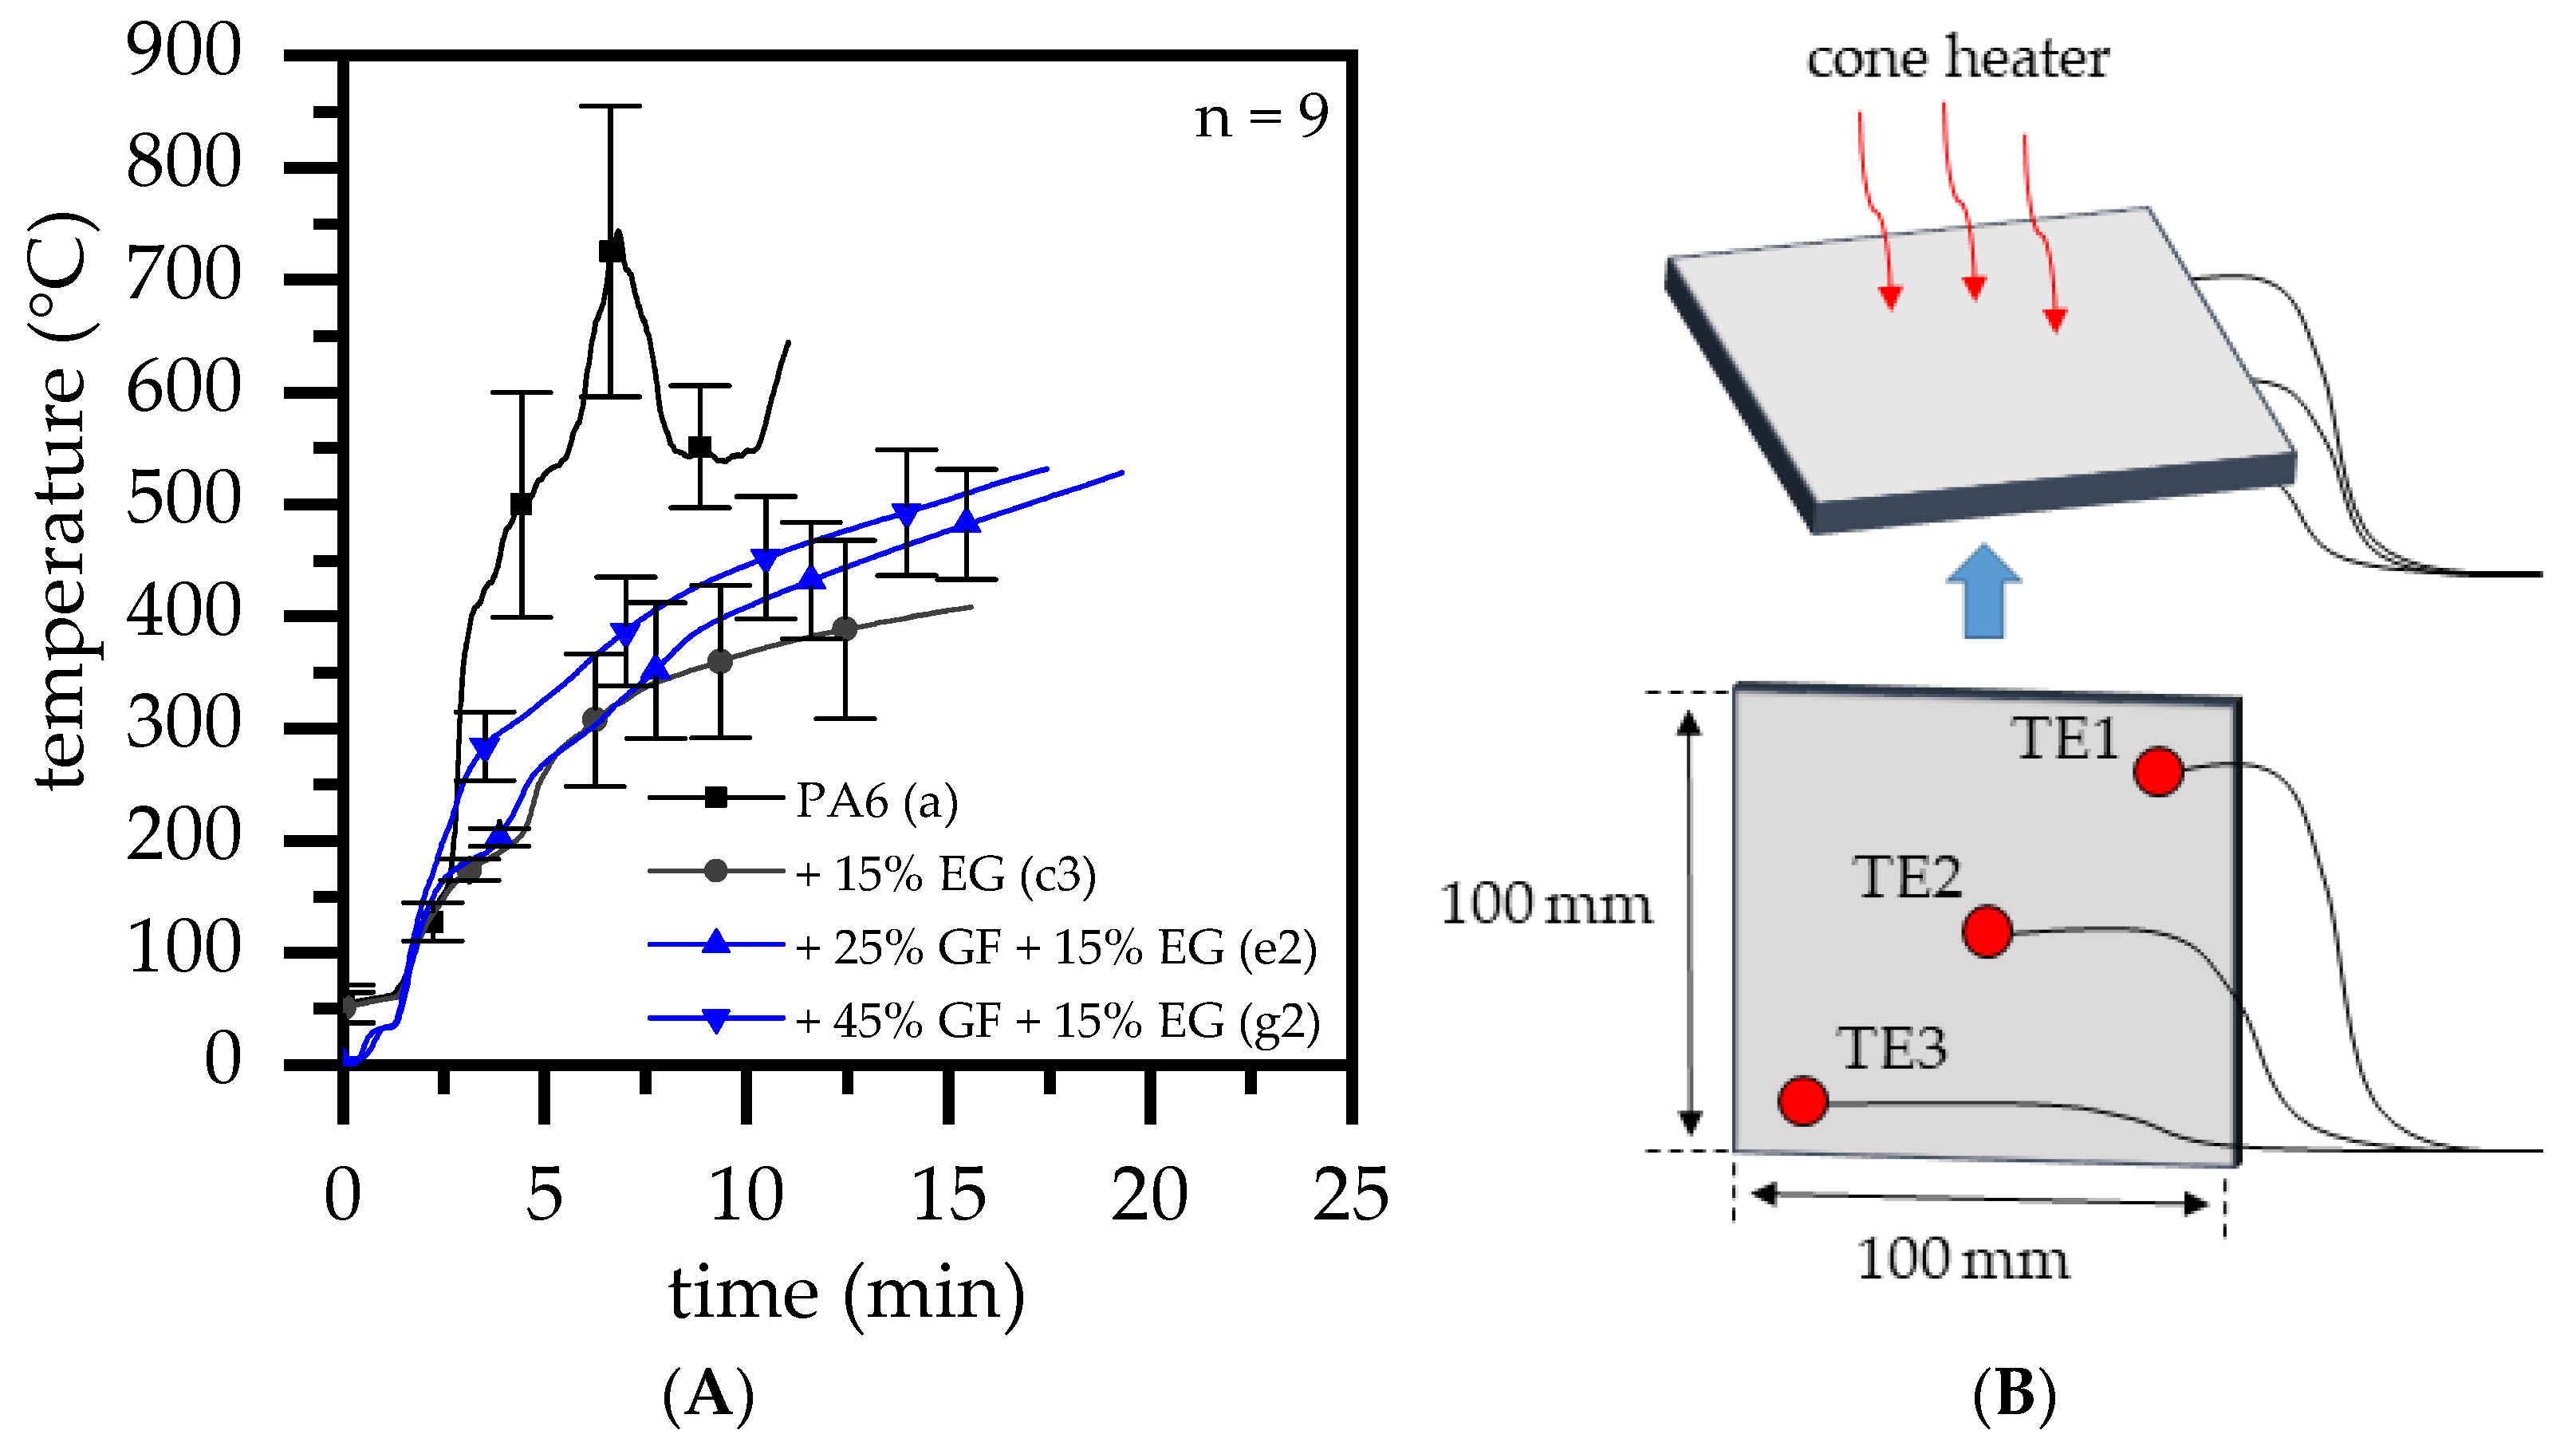
- As reported for net PA6/GF formulations, GF residue networks provide an accelerated combustion process, via wicking, as well as a gas permeable residual system. Pyrolysis gases can thus be provided from lower layers, leading to an improved fuel feed flow towards the flame. As a result, higher burning rates accelerate the development of heat and thus result in higher measured temperatures.
3.5. Burning Behavior: UL-94 and LOI
3.6. Char Residue Analysis: SEM and EDX Analysis
4. Discussion
5. Conclusions
- Glass fiber reinforcement changes the expansion behavior of EG particles and thus reduces any flame retarding effects provided. Substantially higher filling degrees tend to substantially decrease resulting blowing volumes. We assumed two reasons for this: (1) glass fibers provide a mechanically stable network in burning residues, limiting the space for and the expansion possibilities of EG.; (2) increased sheer stress via particle–particle or particle –fiber interactions reduces the size of EG particle, thus reducing the blowing potential.
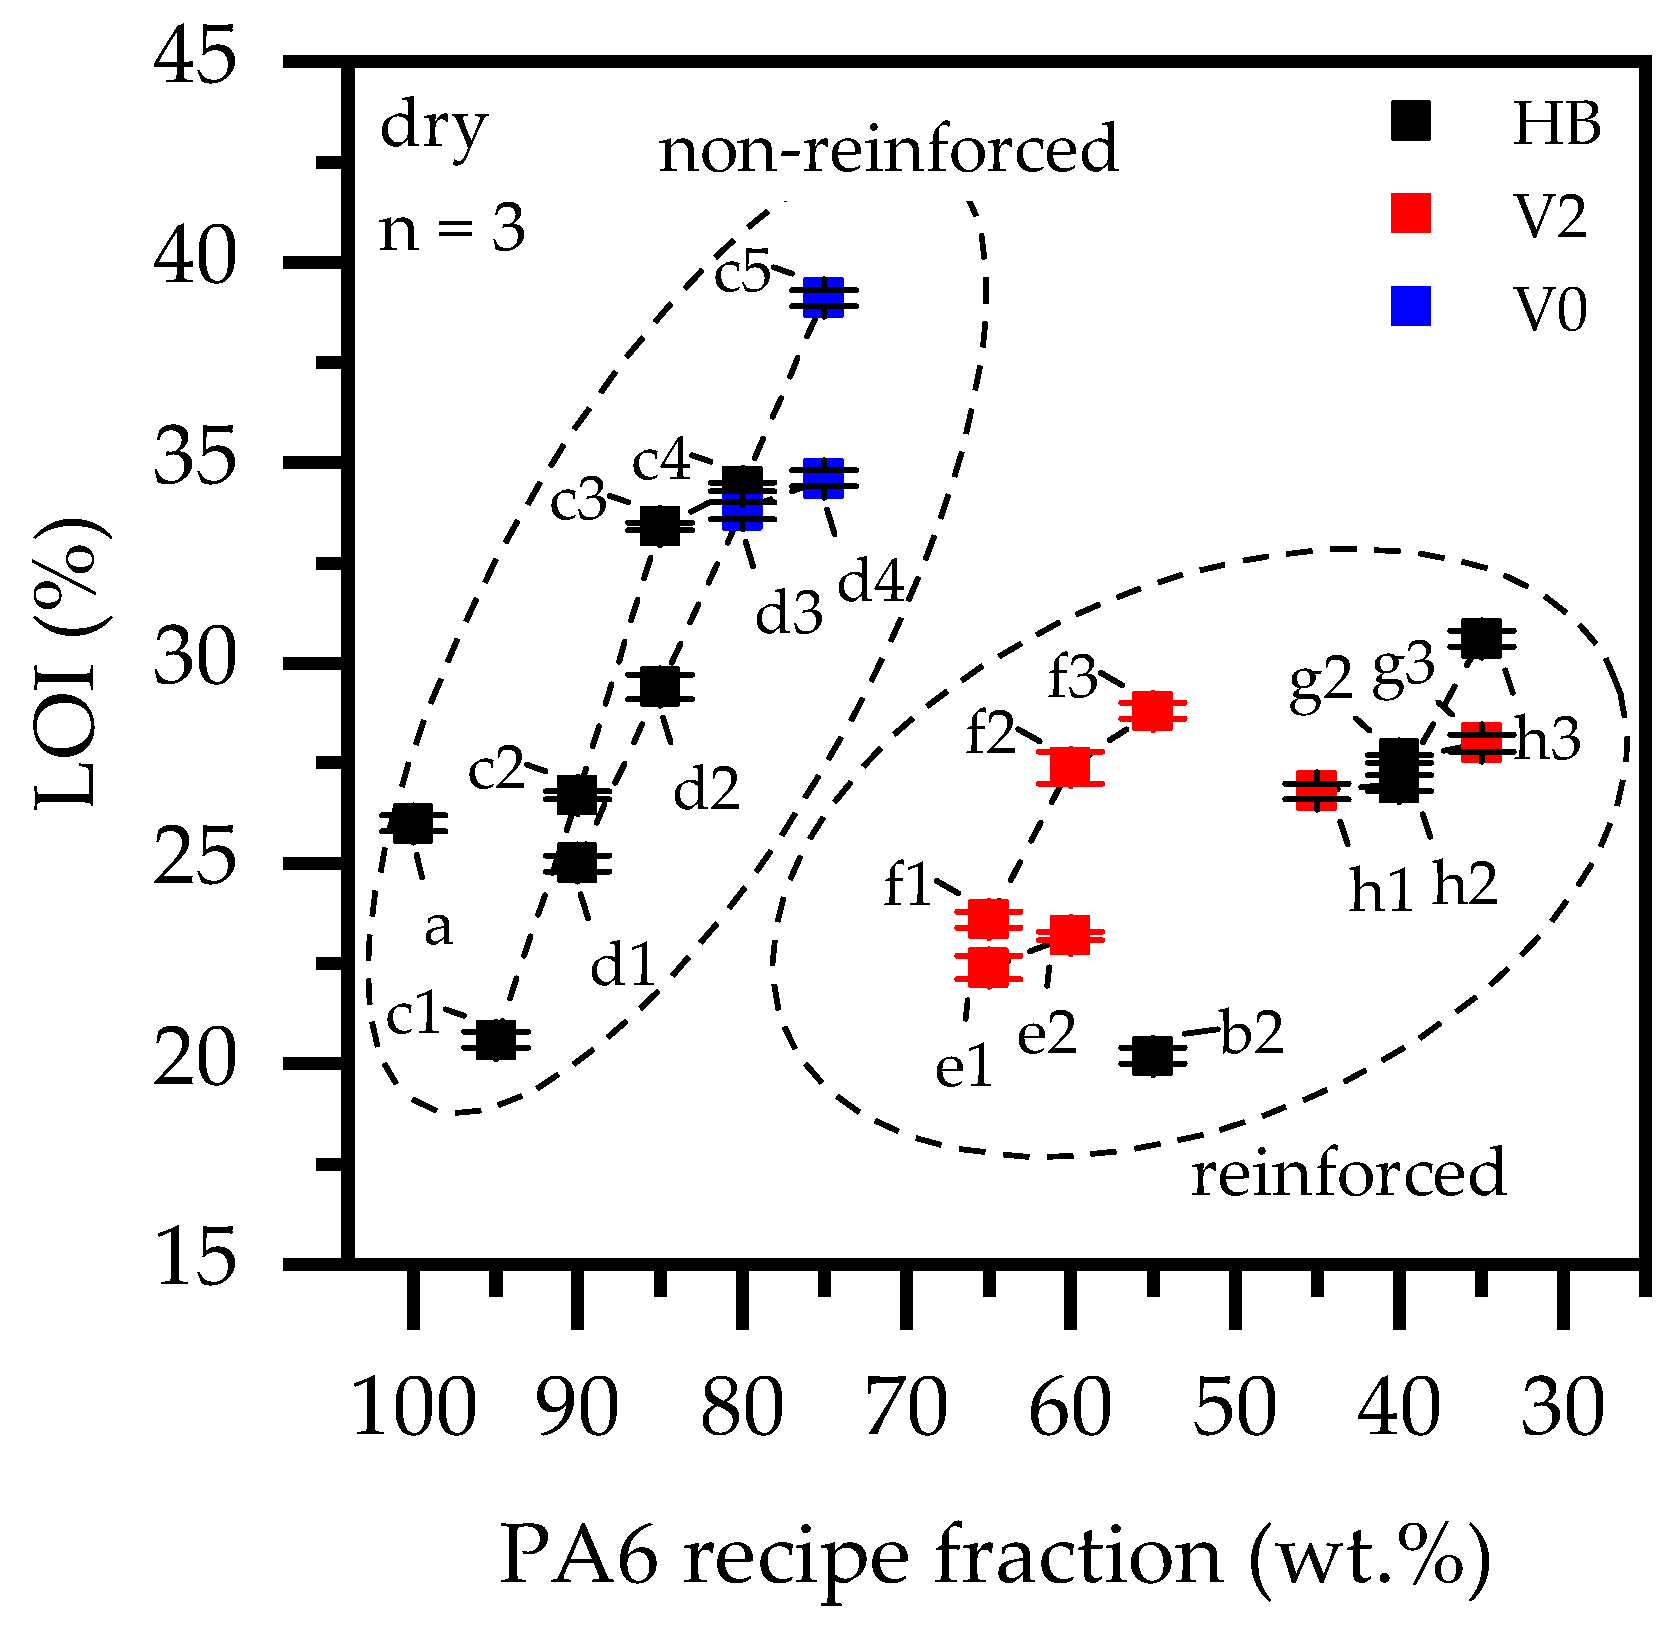
- A synergistic flame retarding effect for EG/AlPi/MPP recipes, as reported for non-reinforced PA6 [11], was found to be not sufficient. The highest UL-94 classification achieved for reinforced PA6 formulations was V2. All formulations achieved a V2 classification for filling degrees as low as 10 wt.% EG or EG/AlPi/MPP.
- The char residue characteristics for GF-reinforced systems containing EG particles were superior in matters of stability, withstanding impressive manual impact forces. This might be of particular importance for some applications that require long term residue stability even under certain physical stress while providing good long term properties, inhibiting the spread of flames.
- As found for non-reinforced systems, EG-modified PA6 formulations showed very low smoke production. Due to an additional gas phase action, EG/AlPi/MPP resulted in slightly higher smoke production.
Author Contributions
Funding
Institutional Review Board Statement
Informed Consent Statement
Acknowledgments
Conflicts of Interest
References
- Rothon, R. (Ed.) Fillers for Polymer Applications. In Polymers and Polymeric Composites; Springer International Publishing: Cham, Switzerland, 2017. [Google Scholar]
- Wypych, G. (Ed.) Handbook of Fillers; Elsevier: Toronto, ON, Canada, 2016. [Google Scholar]
- Horrocks, A.R.; Price, D. Advances in fire retardant materials. In Woodhead Publishing in Materials; Woodhead Pub: Cambridge, UK, 2008. [Google Scholar]
- Lewin, M.; Atlas, S.M.; Pearce, E.M. (Eds.) Flame—Retardant Polymeric Materials; Springer: Boston, MA, USA, 1978; Volume 2. [Google Scholar]
- Braun, U.; Bahr, H.; Schartel, B. Fire retardancy effect of aluminium phosphinate and melamine polyphosphate in glass fibre reinforced polyamide 6. e-Polymers 2010, 10, 41. [Google Scholar] [CrossRef]
- Seefeldt, H.; Duemichen, E.; Braun, U. Flame retardancy of glass fiber reinforced high temperature polyamide by use of aluminum diethylphosphinate: Thermal and thermo-oxidative effects. Polym. Int. 2013, 62, 1608–1616. [Google Scholar] [CrossRef]
- Braun, U.; Schartel, B.; Fichera, M.A.; Jäger, C. Flame retardancy mechanisms of aluminium phosphinate in combination with melamine polyphosphate and zinc borate in glass-fibre reinforced polyamide 6,6. Polym. Degrad. Stab. 2007, 92, 1528–1545. [Google Scholar] [CrossRef]
- Levchik, S.V.; Camino, G.; Costa, L.; Levchik, G.F. Mechanism of action of phosphorus-based flame retardants in nylon 6. I. Ammonium polyphosphate. Fire Mater. 1995, 19, 1–10. [Google Scholar] [CrossRef]
- Levchik, S.V.; Levchik, G.F.; Camino, G.; Costa, L.; Lesnikovich, A.I. Mechanism of Action of Phosphorus-based Flame Retardants in Nylon 6. III. Ammonium Polyphosphate/Manganese Dioxide. Fire Mater. 1996, 20, 183–190. [Google Scholar] [CrossRef]
- Tomiak, F.; Rathberger, K.; Schöffel, A.; Drummer, D. Expandable Graphite for Flame Retardant PA6 Applications. Polymers 2021, 13, 2733. [Google Scholar] [CrossRef]
- Tomiak, F.; Schoeffel, A.; Rathberger, K.; Drummer, D. A Synergistic Flame Retardant System Based on Expandable Graphite, Aluminum (Diethyl-)Polyphospinate and Melamine Polyphosphate for Polyamide 6. Polymers 2021, 13, 2712. [Google Scholar] [CrossRef]
- Schartel, B.; Pötschke, P.; Knoll, U.; Abdel-Goad, M. Fire behaviour of polyamide 6/multiwall carbon nanotube nanocomposites. Eur. Polym. J. 2005, 41, 1061–1070. [Google Scholar] [CrossRef]
- Weil, E.D.; Levchik, S. Current Practice and Recent Commercial Developments in Flame Retardancy of Polyamides. J. Fire Sci. 2004, 22, 251–264. [Google Scholar] [CrossRef]
- Tai, Q.; Yuen, R.K.; Yang, W.; Qiao, Z.; Song, L.; Hu, Y. Iron-montmorillonite and zinc borate as synergistic agents in flame-retardant glass fiber reinforced polyamide 6 composites in combination with melamine polyphosphate. Compos. Part A Appl. Sci. Manuf. 2012, 43, 415–422. [Google Scholar] [CrossRef]
- Focke, W.W.; Kruger, H.J.; Mhike, W.; Taute, A.; Roberson, A.; Ofosu, O. Polyethylene flame retarded with expandable graphite and a novel intumescent additive. J. Appl. Polym. Sci. 2014, 131, 13. [Google Scholar] [CrossRef] [Green Version]
- Liu, J.; Pang, X.; Shi, X.; Xu, J. Expandable Graphite in Polyethylene: The Effect of Modification, Particle Size and the Synergistic Effect with Ammonium Polyphosphate on Flame Retardancy, Thermal Stability and Mechanical Properties. Combust. Sci. Technol. 2019, 192, 575–591. [Google Scholar] [CrossRef]
- Wang, H.; Cao, J.; Luo, F.; Cao, C.; Qian, Q.; Huang, B.; Xiao, L.; Chen, Q. Hugely enhanced flame retardancy and smoke suppression properties of UHMWPE composites with silicone-coated expandable graphite. Polym. Adv. Technol. 2019, 30, 1673–1683. [Google Scholar] [CrossRef]
- XXie, R.; Qu, B. Synergistic effects of expandable graphite with some halogen-free flame retardants in polyolefin blends. Polym. Degrad. Stab. 2001, 71, 375–380. [Google Scholar] [CrossRef]
- Dittrich, B.; Wartig, K.-A.; Hofmann, D.; Mülhaupt, R.; Schartel, B. The influence of layered, spherical, and tubular carbon nanomaterials’ concentration on the flame retardancy of polypropylene. Polym. Compos. 2015, 36, 1230–1241. [Google Scholar] [CrossRef]
- Sun, Z.; Ma, Y.; Xu, Y.; Chen, X.; Chen, M.; Yu, J.; Hu, S.; Zhang, Z. Effect of the particle size of expandable graphite on the thermal stability, flammability, and mechanical properties of high-density polyethylene/ethylene vinyl-acetate/expandable graphite composites. Polym. Eng. Sci. 2014, 54, 1162–1169. [Google Scholar] [CrossRef]
- Wang, G.; Bai, S. Synergistic effect of expandable graphite and melamine phosphate on flame-retardant polystyrene. J. Appl. Polym. Sci. 2017, 134, 45474. [Google Scholar] [CrossRef]
- Focke, W.W.; Muiambo, H.; Mhike, W.; Kruger, H.J.; Ofosu, O. Flexible PVC flame retarded with expandable graphite. Polym. Degrad. Stab. 2014, 100, 63–69. [Google Scholar] [CrossRef] [Green Version]
- Ge, L.-L.; Duan, H.-J.; Zhang, X.-G.; Chen, C.; Tang, J.-H.; Li, Z.-M. Synergistic effect of ammonium polyphosphate and expandable graphite on flame-retardant properties of acrylonitrile-butadiene-styrene. J. Appl. Polym. Sci. 2012, 126, 1337–1343. [Google Scholar] [CrossRef]
- Jia, Y.; He, H.; Yu, P.; Chen, J.; Tian, S. Preparation and characterization of synergistically improved thermally conductive polyamide 6 with low melting point metal and low-temperature expandable graphite. Polym. Compos. 2018, 39, 1818–1826. [Google Scholar] [CrossRef]
- Camino, G.; Duquesne, S.; Delobel, R.; Eling, B.; Lindsay, C.; Roels, T. Mechanism of Expandable Graphite Fire Retardant Action in Polyurethanes. In Fire and Polymers Materials and Solutions for Hazard Prevention, Proceedings of the 220th National Meeting of the American Chemical Society, Washington, DC, USA, 20–24 August 2000; ACS Symposium Series 797; Nelson, G.L., Ed.; American Chemical Society: Washington, DC, USA, 2001; pp. 90–109. [Google Scholar] [CrossRef]
- Shi, L.; Li, Z.-M.; Xie, B.-H.; Wang, J.-H.; Tian, C.-R.; Yang, M.-B. Flame retardancy of different-sized expandable graphite particles for high-density rigid polyurethane foams. Polym. Int. 2006, 55, 862–871. [Google Scholar] [CrossRef]
- Li, Y.; Zou, J.; Zhou, S.; Chen, Y.; Zou, H.; Liang, M.; Luo, W. Effect of expandable graphite particle size on the flame retardant, mechanical, and thermal properties of water-blown semi-rigid polyurethane foam. J. Appl. Polym. Sci. 2013, 131, 3. [Google Scholar] [CrossRef]
- Schartel, B.; Wilkie, C.A.; Camino, G. Recommendations on the scientific approach to polymer flame retardancy: Part 1—Scientific terms and methods. J. Fire Sci. 2016, 34, 447–467. [Google Scholar] [CrossRef]
- Schartel, B.; Wilkie, C.A.; Camino, G. Recommendations on the scientific approach to polymer flame retardancy: Part 2—Concepts. J. Fire Sci. 2017, 35, 3–20. [Google Scholar] [CrossRef]
- Fang, K.; Chen, Y.F.; Zhang, S.C.; Sun, H.R.; Wang, G.H.; Sun, X.K. The Effect of Particle Size of Expandable Graphite on the Properties of an Expandable Thermal Insulation Material. Key Eng. Mater. 2016, 697, 441–444. [Google Scholar]
- Grigg, M.N. Thermo-Oxidative Degradation of Polyamide 6. Ph.D. Thesis, Queensland University of Technology, Brisbane, Australia, 2006. [Google Scholar]
- Herrera, M.; Matuschek, G.; Kettrup, A. Main products and kinetics of the thermal degradation of polyamides. Chemosphere 2001, 42, 601–607. [Google Scholar] [CrossRef]
- Herrera, M.; Matuschek, G.; Kettrup, A. Thermal Degradation Studies of Some Aliphatic Polyamides Using Hyphenated Techniques (TG-MS, TG-FTIR). J. Therm. Anal. 2000, 59, 385–394. [Google Scholar] [CrossRef]
- Lehrle, R.S.; Parsons, I.W.; Rollinson, M. Thermal degradation mechanisms of nylon 6 deduced from kinetic studies by pyrolysis-g.c. Polym. Degrad. Stab. 2000, 67, 21–33. [Google Scholar] [CrossRef]
- Michal, J.; Mitera, J.; Kubát, J. Major pyrolysis and thermoxidative products from certain polyamides. Fire Mater. 1981, 5, 1–5. [Google Scholar] [CrossRef]
- Nagase, Y.; Komatsu, T.; Sumiya, Y.; Ikeda, K.; Sekine, Y. Thermal Degradation of Polyamides. Nippon. Kagaku Kaishi 1979, 11, 1560–1568. [Google Scholar] [CrossRef]
- Zhang, Y.; Zhang, Y.; Liu, S.; Huang, A.; Chi, Z.; Xu, J.; Economy, J. Phase stability and melting behavior of the α and γ phases of nylon 6. J. Appl. Polym. Sci. 2011, 120, 1885–1891. [Google Scholar] [CrossRef]
- Fornes, T.; Paul, D. Crystallization behavior of nylon 6 nanocomposites. Polymers 2003, 44, 3945–3961. [Google Scholar] [CrossRef]
- Holland, B.J.; Hay, J.N. Thermal degradation of nylon polymers. Polym. Int. 2000, 49, 943–948. [Google Scholar] [CrossRef]
- Price, D.; Horrocks, A.R. Polymer Degradation and the Matching of FR Chemistry to Degradation. In Fire Retardancy of Polymeric Materials; Wilkie, C.A., Morgan, A.B., Eds.; CRC Press: Boca Raton, FL, USA, 2010; pp. 15–43. [Google Scholar]
- Levchik, S.V.; Weil, E.D.; Lewin, M. Thermal decomposition of aliphatic nylons. Polym. Int. 1999, 48, 532–557. [Google Scholar] [CrossRef]
- Bhuiyan, A. Some aspects of the thermal stability action of the structure in aliphatic polyamides and polyacrylamides. Polymers 1984, 25, 1699–1710. [Google Scholar] [CrossRef]
- Herrera, M.; Matuschek, G.; Kettrup, A. Comparative studies of polymers using TA–MS, macro TA–MS and TA–FTIR. Thermochim. Acta 2000, 361, 69–76. [Google Scholar] [CrossRef]
- Herrera, M.; Wilhelm, M.; Matuschek, G.; Kettrup, A. Thermoanalytical and pyrolysis studies of nitrogen containing polymers. J. Anal. Appl. Pyrolysis 2001, 58, 173–188. [Google Scholar] [CrossRef]
- Herrera, M. Untersuchung Flüchtiger Verbindungen bei der Thermischen Zersetzung von Stickstoffhaltigen Polymerwerkstoffen. Ph.D. Thesis, Technischen Universität München, München, Germany, 2001. [Google Scholar]
- Lyon, E.R. Chapter 3—Plastics and Rubbers. In Handbook of Building Materials for Fire Protection; McGraw-Hill Handbooks; Harper, C.A., Ed.; McGraw-Hill: New York, NY, USA, 2004; pp. 121–171. [Google Scholar]


| DSC | TGA | |||||||
|---|---|---|---|---|---|---|---|---|
| PA6 wt.% | GF wt.% | EG wt.% | AlPi/MPP (3:2) wt.% | Tm Onset/Peak | T99% Onset °C | DTG-Peak °C/min | Residue% | |
| a | 100 | 218 ± 1/232 ± 0 | 394 ± 1 | 479 ± 2 | 1.6 ± 0 | |||
| 100 | - | 307 ± 1 | 357 ± 2 | 84.0 ± 0 | ||||
| b2 | 65 | 45 | 211 ± 1/225 ± 1 | 381 ± 2 | 474 ± 2 | 48.3 ± 2 | ||
| 75 | 25 | 307 ± 5 | 362; 451 ± 2 | 6.3 ± 1 | ||||
| c3 | 85 | 15 | 220 ± 1/232 ± 0 | 332 ± 2 | 476 ± 2 | 13.1 ± 1 | ||
| c5 | 75 | 25 | 220 ± 1/232 ± 0 | 316 ± 2 | 468 ± 2 | 21.7 ± 1 | ||
| d2 | 85 | 12 | 3 | 219 ± 1/ | 314 ± 3 | 467 ± 2 | 14.2 ± 1 | |
| 75 | 20 | 5 | 219 ± 1/ | 306 ± 2 | 464 ± 2 | 19.3 ± 1 | ||
| e2 | 60 | 25 | 15 | 211 ± 2/225 ± 1 | 306 ± 3 | 465 ± 2 | 38.0 ± 2 | |
| f2 | 60 | 25 | 12 | 3 | 211 ± 1/225 ± 1 | 310 ± 3 | 470 ± 2 | 33.9 ± 2 |
| g2 | 40 | 45 | 15 | 206 ± 1/221 ± 1 | 302 ± 3 | 463 ± 2 | 59.0 ± 2 | |
| h2 | 40 | 45 | 12 | 3 | 206 ± 2/222 ± 1 | 295 ± 4 | 466 ± 2 | 57.5 ± 2 |
| PA6 wt.% | GF wt.% | EG wt.% | AlPi/MPP (3:2) wt.% | tign s | pHRR kW/m2 | THE MJ/m2 | MAHRE kW/m2 | TSP m2 | |
|---|---|---|---|---|---|---|---|---|---|
| humid | |||||||||
| a | 100 | 0 | 54 ± 2 | 569 ± 21 | 100 ± 0 | 257 ± 21 | 5.6 ± 0.7 | ||
| b1 | 75 | 25 | 47 ± 2 | 561 ± 13 | 110 ± 4 | 264 ± 8 | 6.0 ± 0.1 | ||
| b2 | 65 | 45 | 55 ± 2 | 369 ± 4 | 77 ± 4 | 149 ± 10 | 4.5 ± 0.5 | ||
| c1 | 95 | 5 | 42 ± 3 | 353 ± 5 | 88 ± 0 | 163 ± 2 | 7.0 ± 0.1 | ||
| c2 | 90 | 10 | 45 ± 5 | 373 ± 10 | 97 ± 2 | 184 ± 8 | 6.6 ± 0.6 | ||
| c3 | 85 | 15 | 51 ± 4 | 133 ± 5 | 23 ± 2 | 58 ± 2 | 1.7 ± 0.4 | ||
| c4 | 80 | 20 | 51 ± 2 | 88 ± 5 | 15 ± 1 | 40 ± 4 | 0.9 ± 0.1 | ||
| c5 | 75 | 25 | 55 ± 4 | 62 ± 10 | 8 ± 2 | 20 ± 5 | 0.4 ± 0.1 | ||
| d1 | 90 | 8 | 2 | 41 ± 8 | 220 ± 9 | 62 ± 2 | 89 ± 9 | 6.2 ± 0.6 | |
| d2 | 85 | 12 | 3 | 48 ± 2 | 189 ± 29 | 46 ± 6 | 66 ± 2 | 5.6 ± 0.4 | |
| d3 | 80 | 16 | 4 | 49 ± 3 | 140 ± 15 | 32 ± 4 | 52 ± 2 | 4.1 ± 0.4 | |
| d4 | 75 | 20 | 5 | 52 ± 3 | 75 ± 5 | 14 ± 2 | 31 ± 4 | 2.4 ± 0.2 | |
| e1 | 65 | 25 | 10 | 47 ± 2 | 249 ± 7 | 74 ± 8 | 128 ± 2 | 3.4 ± 0.2 | |
| e2 | 60 | 25 | 15 | 49 ± 1 | 172 ± 2 | 45 ± 5 | 84 ± 6 | 2.0 ± 0.2 | |
| e3 | 55 | 25 | 20 | 60 ± 1 | 134 ± 7 | 31 ± 5 | 66 ± 6 | 1.2 ± 0.2 | |
| f1 | 65 | 25 | 8 | 2 | 54 ± 2 | 270 ± 10 | 73 ± 5 | 116 ± 3 | 6.7 ± 0.6 |
| f2 | 60 | 25 | 12 | 3 | 56 ± 2 | 191 ± 15 | 46 ± 3 | 84 ± 3 | 5.1 ± 0.4 |
| f3 | 55 | 25 | 16 | 4 | 56 ± 4 | 155 ± 6 | 35 ± 5 | 64 ± 3 | 4.3 ± 0.2 |
| g2 | 40 | 45 | 15 | 68 ± 3 | 145 ± 11 | 45 ±1 | 76 ± 5 | 1.9 ± 0.1 | |
| g3 | 35 | 45 | 20 | 91 ± 4 | 150 ± 35 | 23 ± 4 | 49 ± 11 | 0.6 ± 0.2 | |
| h1 | 45 | 45 | 8 | 2 | 61 ± 7 | 172 ± 6 | 56 ± 11 | 80 ±6 | 5.4 ± 0.4 |
| h2 | 40 | 45 | 12 | 3 | 71 ± 6 | 158 ± 5 | 54 ± 0 | 78 ± 3 | 6.5 ± 0.2 |
| h3 | 35 | 45 | 16 | 4 | 80 ± 7 | 109 ± 12 | 33 ± 2 | 56 ± 4 | 4.1 ± 0.2 |
| dry | |||||||||
| a | 100 | 0 | 74 ± 4 | 708 ± 45 | 134 ± 3 | 328 ± 12 | 7.4 ± 0.2 | ||
| b1 | 75 | 25 | 40 ± 1 | 550 ± 4 | 105 ± 4 | 258 ± 5 | 6.9 ± 0.1 | ||
| b2 | 65 | 45 | 71 ± 4 | 362 ± 22 | 82 ± 0 | 156 ± 8 | 6.8 ± 0.9 | ||
| c1 | 95 | 5 | 52 ± 4 | 381 ± 17 | 100 ± 7 | 181 ± 23 | 7.9 ± 0.9 | ||
| c2 | 90 | 10 | 54 ± 1 | 359 ± 23 | 102 ± 2 | 191 ± 3 | 7.5 ± 0.1 | ||
| c3 | 85 | 15 | 55 ± 3 | 167 ± 29 | 26 ± 2 | 49 ± 1 | 2.4 ± 0.2 | ||
| c4 | 80 | 20 | 60 ± 1 | 122 ± 3 | 23 ± 2 | 44 ± 4 | 1.6 ± 0.2 | ||
| c5 | 75 | 25 | 64 ± 2 | 70 ± 12 | 8 ± 2 | 21 ± 6 | 0.9 ± 0.1 | ||
| d1 | 90 | 8 | 2 | 49 ± 2 | 204 ± 118 | 72 ± 5 | 106 ± 11 | 8.5 ± 0.2 | |
| d2 | 85 | 12 | 3 | 51 ± 3 | 160 ± 94 | 60 ± 7 | 78 ± 11 | 7.1 ± 0.4 | |
| d3 | 80 | 16 | 4 | 50 ± 5 | 126 ± 73 | 43 ± 7 | 61 ± 11 | 6.2 ± 0.1 | |
| d4 | 75 | 20 | 5 | 59 ± 2 | 137 ± 8 | 29 ± 5 | 49 ± 7 | 4.2 ± 0.6 | |
| e1 | 65 | 25 | 10 | 53 ± 2 | 304 ± 13 | 75 ± 10 | 125 ± 16 | 4.9 ± 0.6 | |
| e2 | 60 | 25 | 15 | 51 ± 3 | 179 ± 105 | 50 ± 12 | 66 ± 39 | 2.5 ± 0.2 | |
| e3 | 55 | 25 | 20 | 50 ± 4 | 179 ± 8 | 37 ± 3 | 68 ± 2 | 1.6 ± 0.0 | |
| f1 | 65 | 25 | 8 | 2 | 59 ± 5 | 223 ± 129 | 83 ± 3 | 129 ± 6 | 9.2 ± 0.4 |
| f2 | 60 | 25 | 12 | 3 | 57 ± 3 | 201 ± 3 | 57 ± 3 | 94 ± 6 | 6.1 ± 0.1 |
| f3 | 55 | 25 | 16 | 4 | 59 ± 2 | 152 ± 35 | 34 ± 10 | 62 ± 14 | 4.7 ± 0.2 |
| g1 | 45 | 45 | 10 | 66 ± 7 | 183 ± 10 | 57 ± 2 | 85 ± 2 | 2.8 ± 0.1 | |
| g2 | 40 | 45 | 15 | 66 ± 2 | 89 ± 53 | 33 ± 8 | 43 ± 26 | 2.2 ± 0.1 | |
| g3 | 35 | 45 | 20 | 73 ± 1 | 157 ± 14 | 38 ± 3 | 62 ± 3 | 1.1 ± 0.2 | |
| h1 | 45 | 45 | 8 | 2 | 63 ± 6 | 197 ± 10 | 56 ± 6 | 84 ± 10 | 8.3 ± 0.7 |
| h2 | 40 | 45 | 12 | 3 | 72 ± 4 | 180 ± 23 | 47 ± 10 | 76 ± 15 | 7.7 ± 0.5 |
| h3 | 35 | 45 | 16 | 4 | 90 ± 2 | 145 ± 8 | 36 ± 1.9 | 61 ± 2 | 6.6 ± 0.3 |
| PA6 wt.% | GF wt.% | EG wt.% | AlPi/MPP (3:2) wt.% | UL-94 (2 mm) | t1 s | t2 s | Cign * | LOI (2 mm)% | |
|---|---|---|---|---|---|---|---|---|---|
| dry | |||||||||
| a | 100 | 0 | V2 | 3 ± 2 | 4 ± 2 | yes | 26.0 ± 0.2 | ||
| b1 | 75 | 25 | HB | 55 ± 6 | - | yes | - | ||
| b2 | 65 | 45 | HB | 47 ± 3 | - | yes | 20.2 ± 0.2 | ||
| c1 | 95 | 5 | V2 | 2 ± 1 | 7 ± 2 | yes | 20.6 ± 0.2 | ||
| c2 | 90 | 10 | HB | 4 ± 1 | 8 ± 3 | yes | 26.7 ± 0.1 | ||
| c3 | 85 | 15 | HB | 7 ± 1 | 7 ± 2 | yes | 33.4 ± 0.1 | ||
| c4 | 80 | 20 | V2 | 5 ± 2 | 6 ± 2 | yes | 34.4 ± 0.1 | ||
| c5 | 75 | 25 | V0 | 2 ± 1 | 2 ± 1 | no | 39.1 ± 0.2 | ||
| d1 | 90 | 8 | 2 | HB | 31 ± 10 | 12 ± 12 | yes | 25.0 ± 0.2 | |
| d2 | 85 | 12 | 3 | HB | 9 ± 4 | 12 ± 7 | yes | 29.4 ± 0.3 | |
| d3 | 80 | 16 | 4 | V0 | 0 ± 0 | 0 ± 0 | no | 33.8 ± 0.2 | |
| d4 | 75 | 20 | 5 | V0 | 0 ± 0 | 0 ± 0 | no | 34.6 ± 0.2 | |
| e1 | 65 | 25 | 10 | V2 | 16 ± 1 | 11 ± 10 | yes | 22.4 ± 0.3 | |
| e2 | 60 | 25 | 15 | V2 | 14 ± 2 | 7 ± 5 | yes | 23.2 ± 0.1 | |
| e3 | 55 | 25 | 20 | V2 | 10 ± 2 | 8 ± 3 | yes | - | |
| f1 | 65 | 25 | 8 | 2 | V2 | 17 ± 2 | 4 ± 2 | yes | 23.6 ± 0.2 |
| f2 | 60 | 25 | 12 | 3 | V2 | 15 ± 6 | 9 ± 4 | yes | 27.4 ± 0.4 |
| f3 | 55 | 25 | 16 | 4 | V2 | 6 ± 7 | 7 ± 3 | yes | 28.8 ± 0.2 |
| g1 | 45 | 45 | 10 | - | - | - | - | - | |
| g2 | 40 | 45 | 15 | HB | 23.04 | 13 ± 10 | yes | 27.6 ± 0.1 | |
| g3 | 35 | 45 | 20 | V2 | 19 ± 3 | 4 ± 2 | yes | - | |
| h1 | 45 | 45 | 8 | 2 | V2 | 13 ± 8 | 12 ± 8 | yes | 26.8 ± 0.2 |
| h2 | 40 | 45 | 12 | 3 | HB | 22 ± 15 | 17 ± 13 | yes | 27.0 ± 0.2 |
| h3 | 35 | 45 | 16 | 4 | HB | 17 ± 20 | 6 ± 6 | yes | 30.6 ± 0.2 |
Publisher’s Note: MDPI stays neutral with regard to jurisdictional claims in published maps and institutional affiliations. |
© 2022 by the authors. Licensee MDPI, Basel, Switzerland. This article is an open access article distributed under the terms and conditions of the Creative Commons Attribution (CC BY) license (https://creativecommons.org/licenses/by/4.0/).
Share and Cite
Tomiak, F.; Schoeffel, A.; Rathberger, K.; Drummer, D. Expandable Graphite, Aluminum Diethylphospinate and Melamine Polyphosphate as Flame Retarding System in Glass Fiber-Reinforced PA6. Polymers 2022, 14, 1263. https://doi.org/10.3390/polym14061263
Tomiak F, Schoeffel A, Rathberger K, Drummer D. Expandable Graphite, Aluminum Diethylphospinate and Melamine Polyphosphate as Flame Retarding System in Glass Fiber-Reinforced PA6. Polymers. 2022; 14(6):1263. https://doi.org/10.3390/polym14061263
Chicago/Turabian StyleTomiak, Florian, Angelina Schoeffel, Klaus Rathberger, and Dietmar Drummer. 2022. "Expandable Graphite, Aluminum Diethylphospinate and Melamine Polyphosphate as Flame Retarding System in Glass Fiber-Reinforced PA6" Polymers 14, no. 6: 1263. https://doi.org/10.3390/polym14061263
APA StyleTomiak, F., Schoeffel, A., Rathberger, K., & Drummer, D. (2022). Expandable Graphite, Aluminum Diethylphospinate and Melamine Polyphosphate as Flame Retarding System in Glass Fiber-Reinforced PA6. Polymers, 14(6), 1263. https://doi.org/10.3390/polym14061263