
Bacterial Alginate-Based Hydrogel Reduces Hydro-Mechanical Soil-Related Problems in Agriculture Facing Climate Change

 ,
,  , and
, and 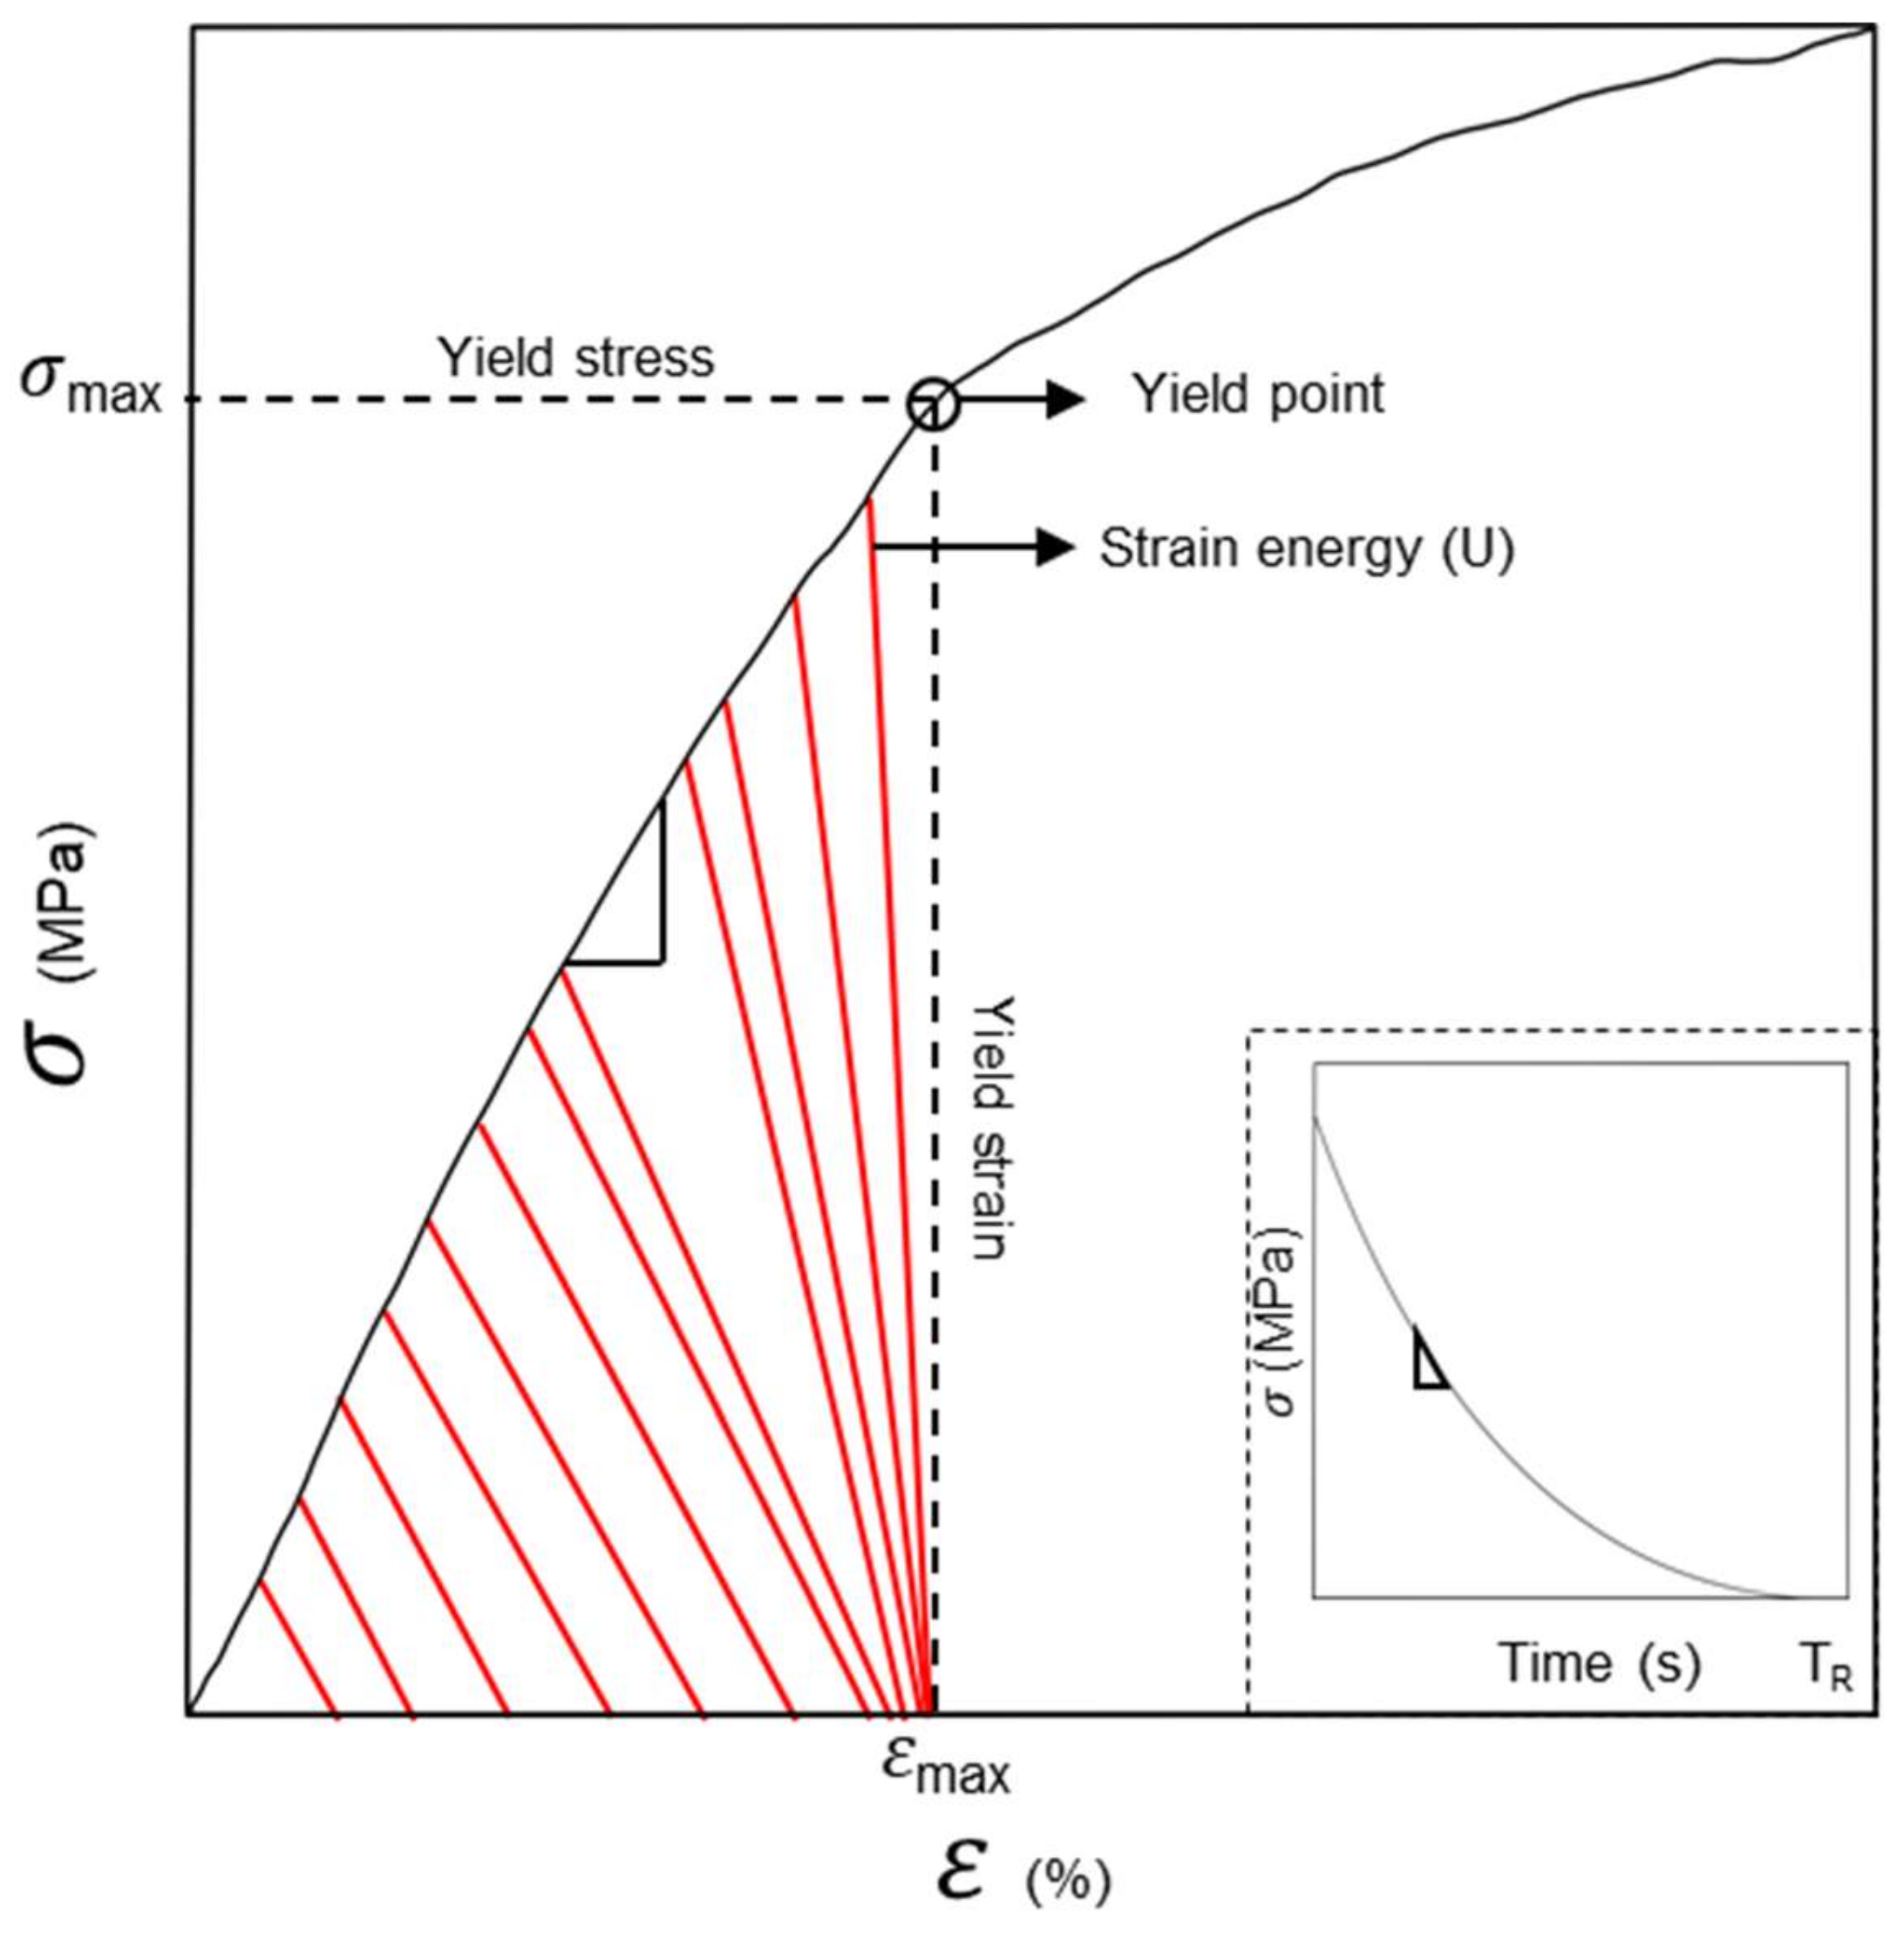
Abstract
1. Introduction
2. Materials and Methods
2.1. Soil Media
2.2. Cultivation and Bioprocessing of Bacterial Alginate from Azotobacter vinelandii
2.3. FTIR Spectroscopy Methodology to Quantify the Mannuronic and Guluronic Acid Contents in the Bacterial Alginate
2.4. Sample Preparation
2.5. Water-Soluble Solutions of Ca-Bacterial Alginate Hydrogel and Soil Mixture Conditioning
2.6. Unconfined Uniaxial Compressive Testing
2.7. Aggregate Stability Measurement
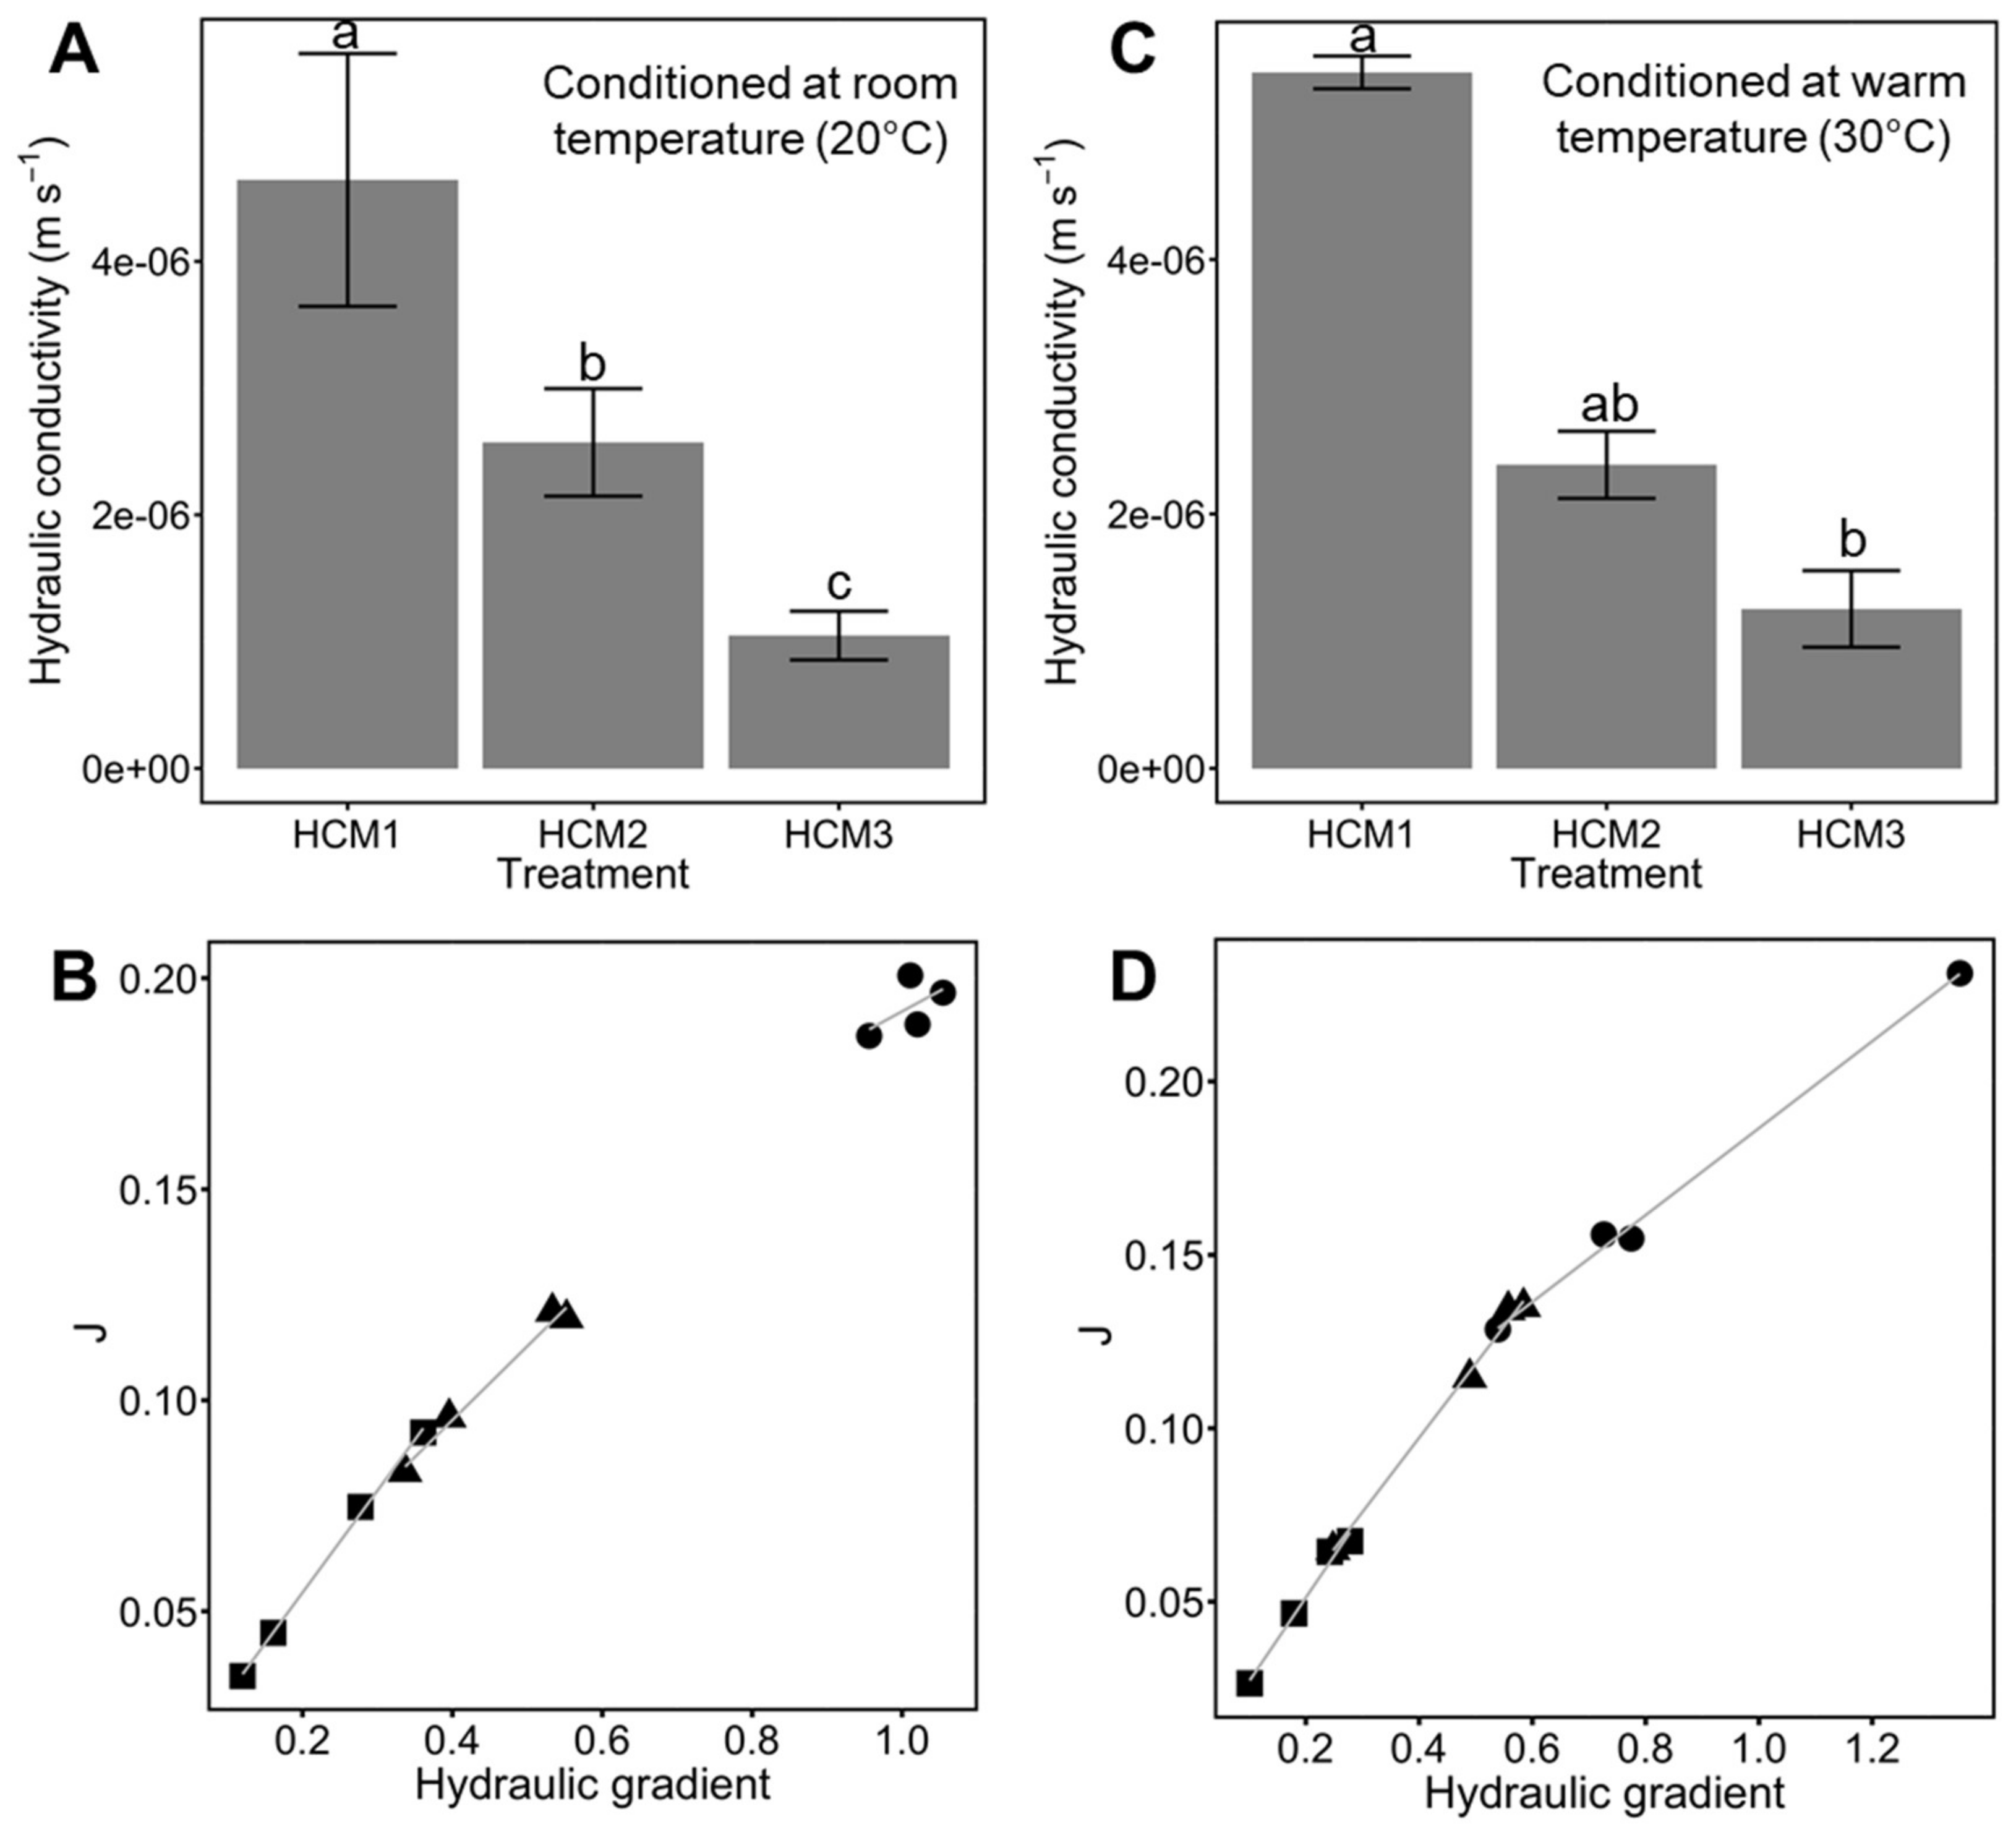
2.8. Hydraulic Conductivity Test
2.9. Bright Field Light Microscopy Imaging
2.10. Statistical Analysis
3. Results
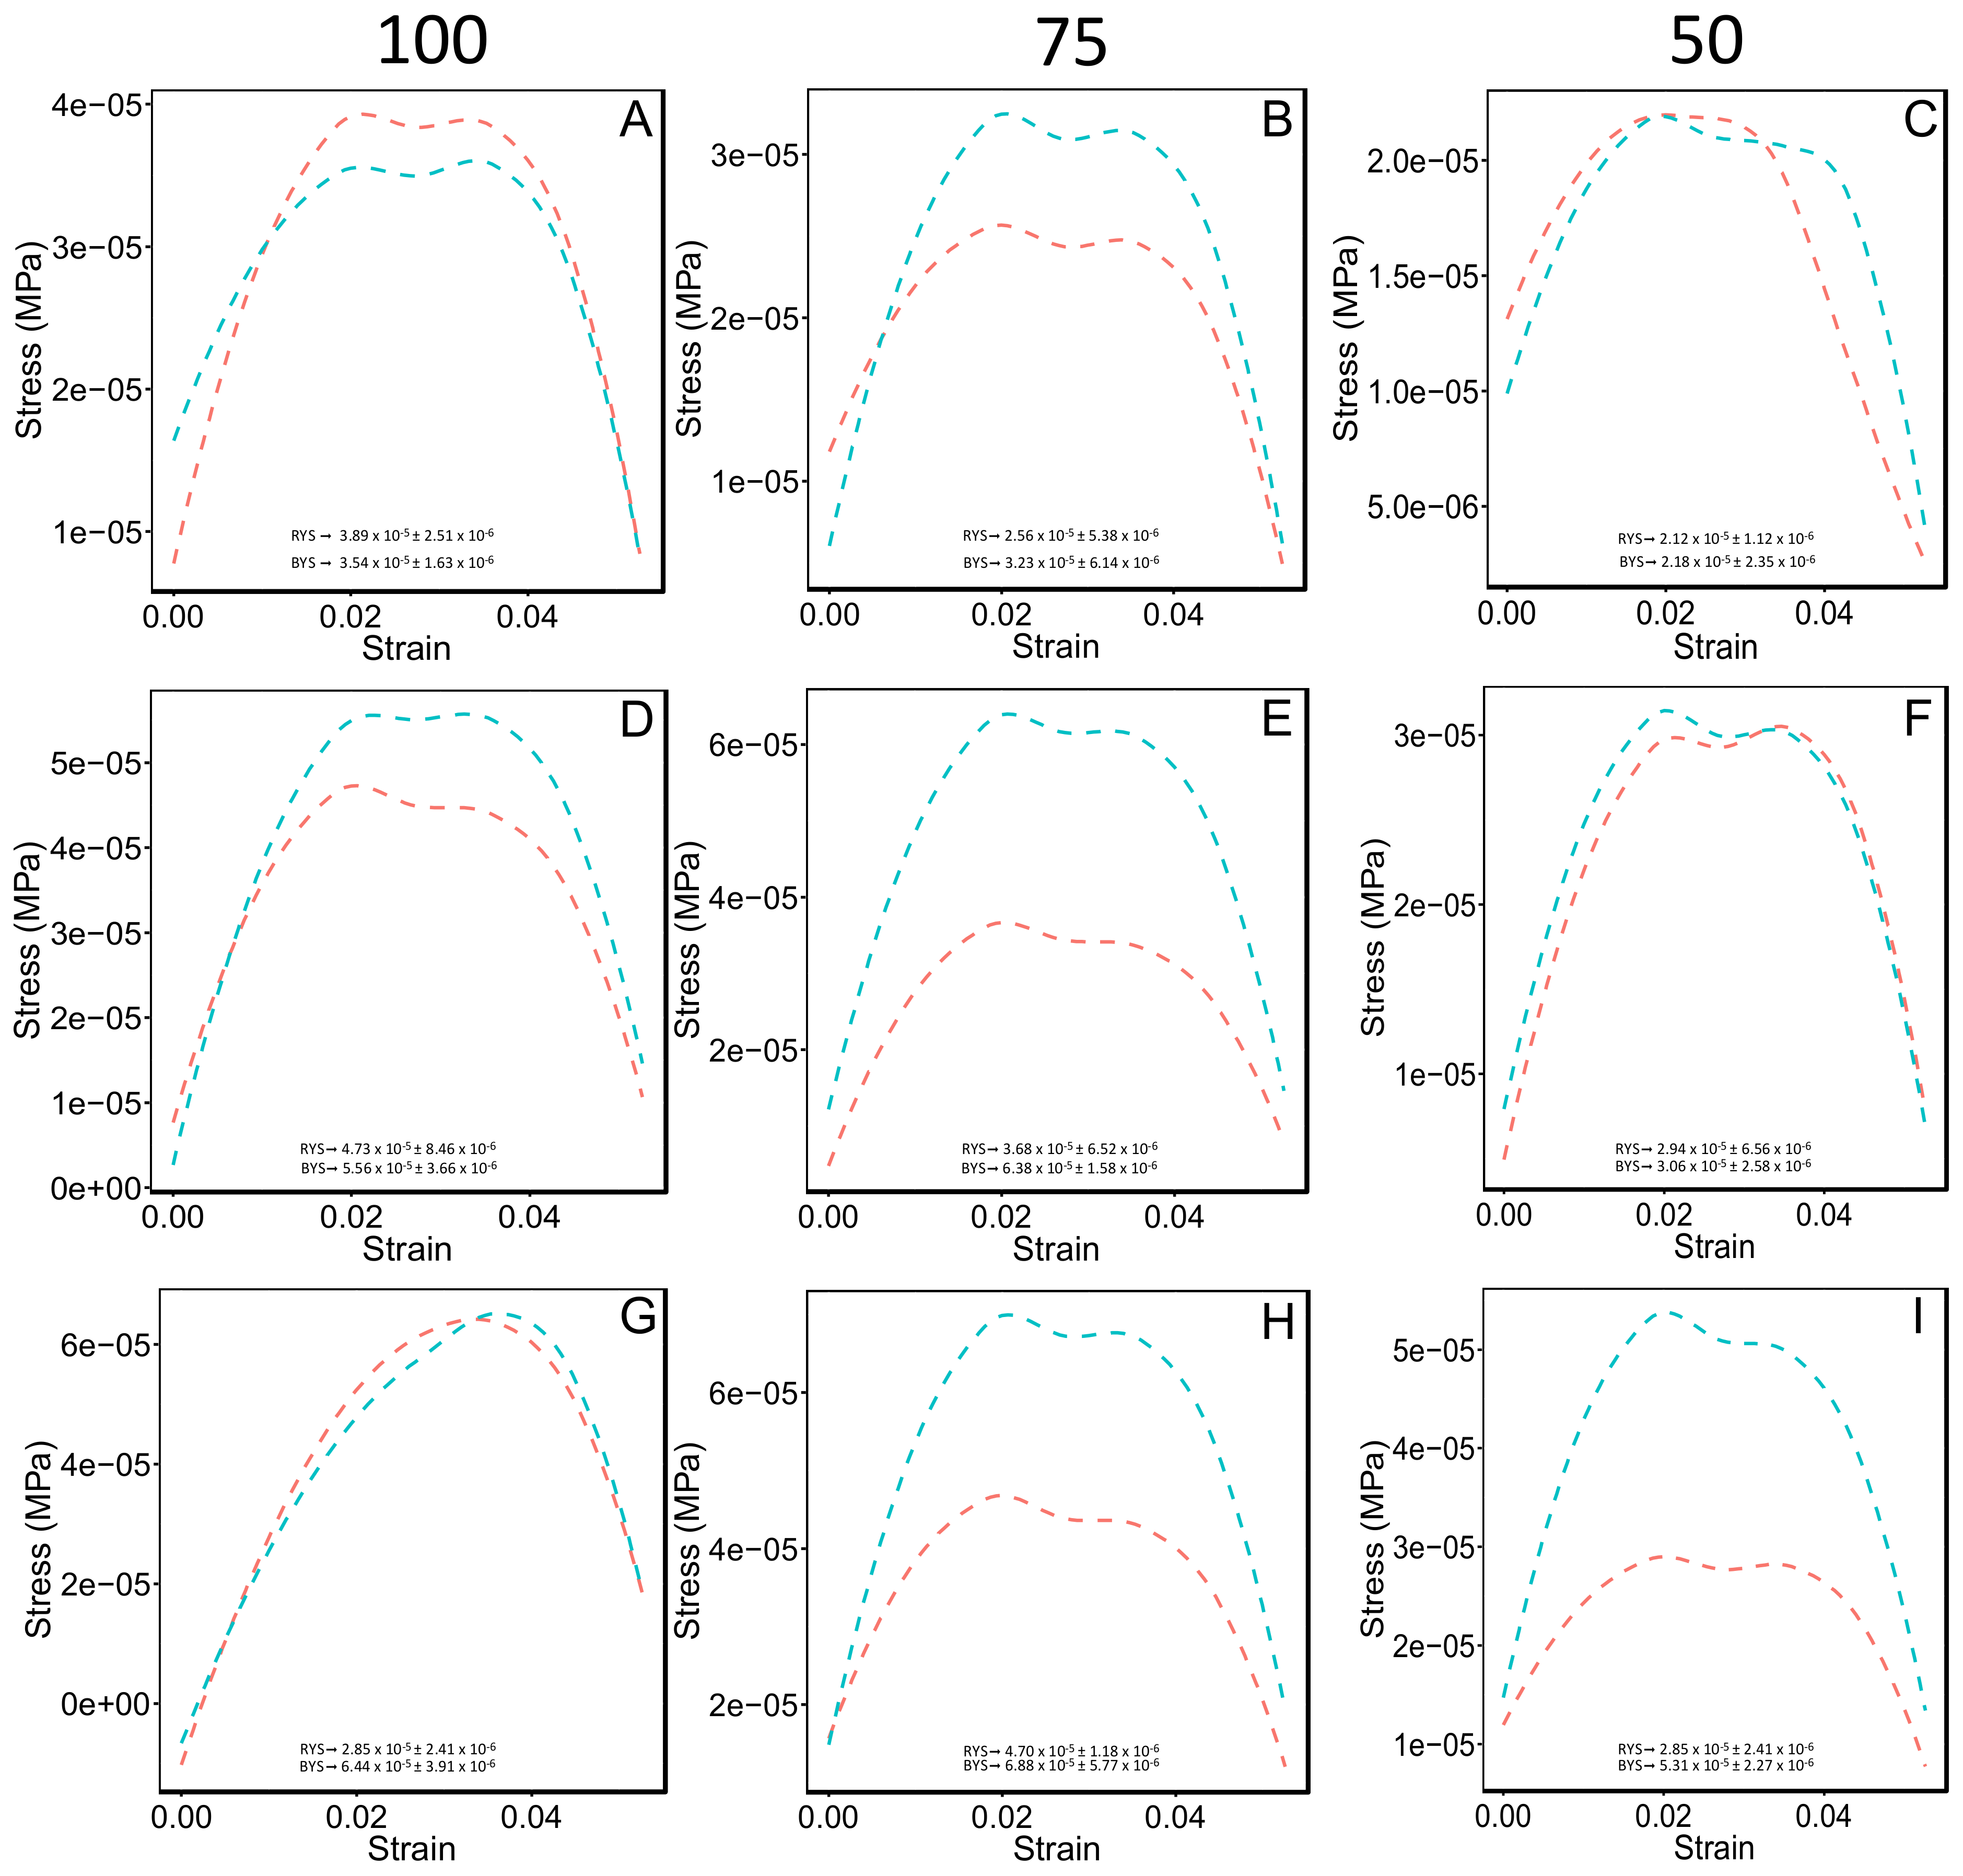
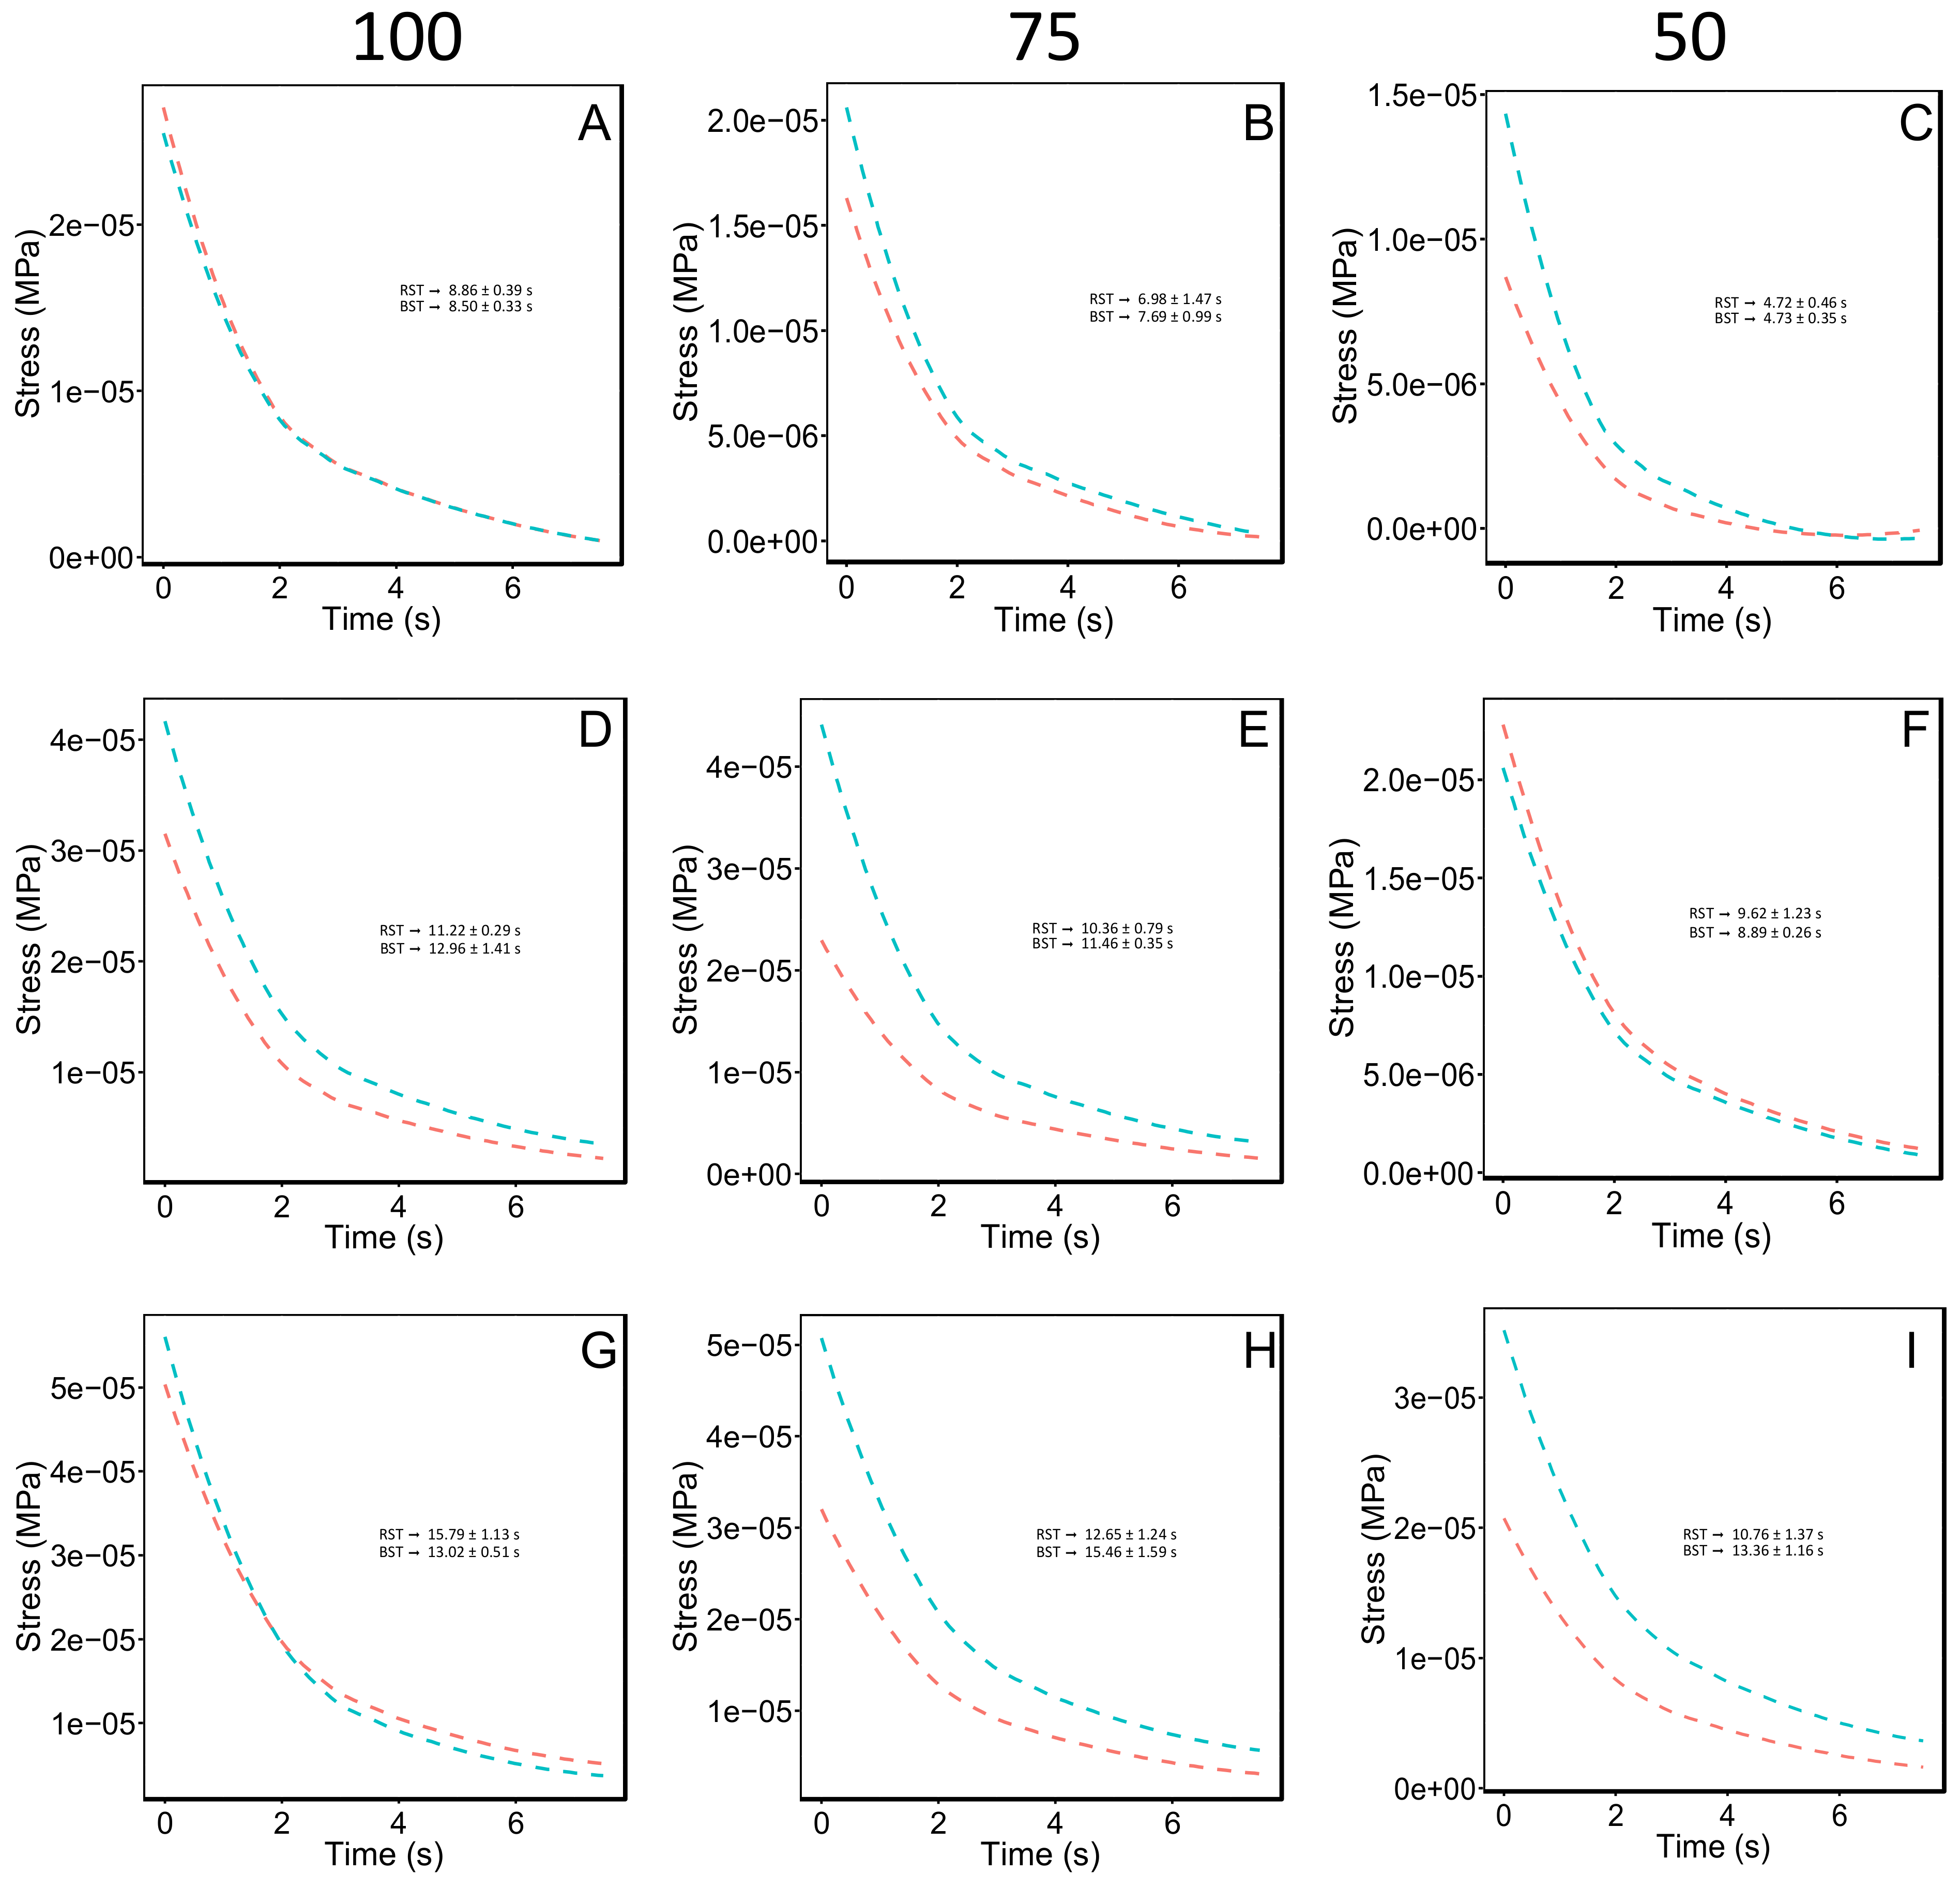
3.1. Compression Test
3.2. Aggregate Stability Test
3.3. Hydraulic Conductivity Test
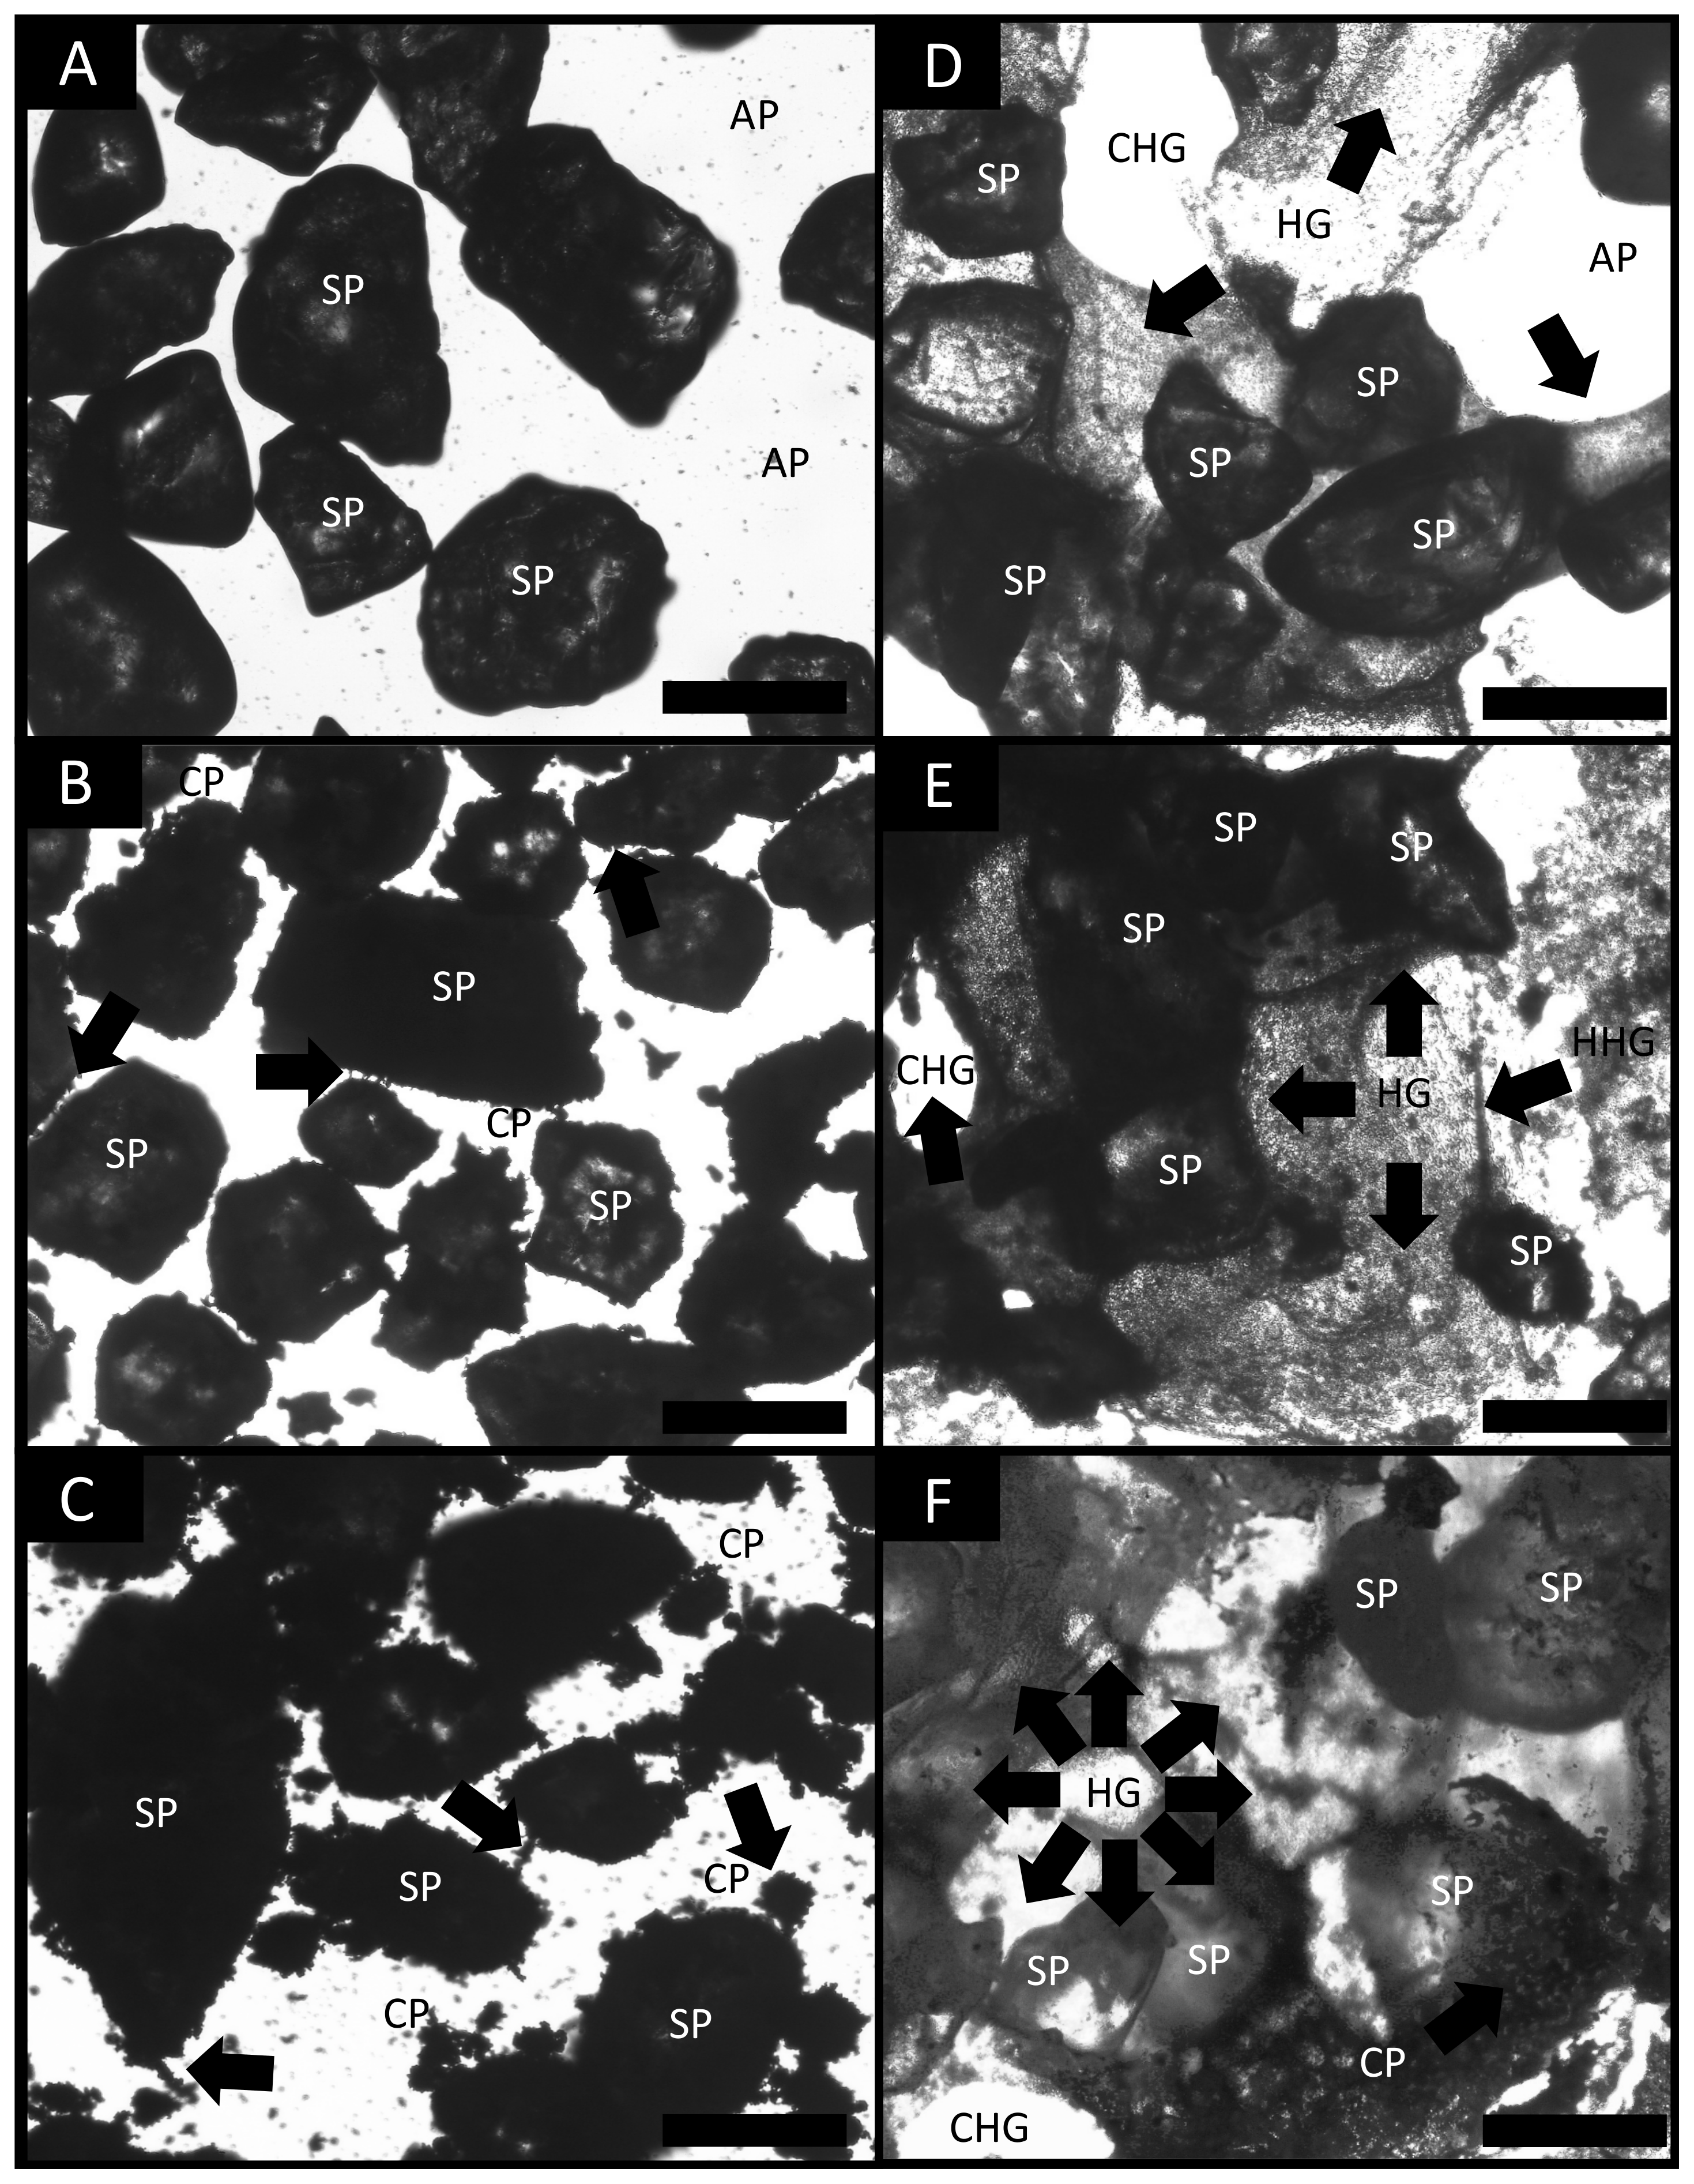
3.4. Bright Field Light Microscopy Imaging
4. Discussion
5. Conclusions
Supplementary Materials
Author Contributions
Funding
Institutional Review Board Statement
Informed Consent Statement
Data Availability Statement
Conflicts of Interest
References
- Lal, R. Assesment Methods for Soil Carbon. Advances in Soil Science; CRC Press: Boca Raton, FL, USA, 2001; pp. 403–416. [Google Scholar]
- Borrelli, P.; Robinson, D.A.; Fleischer, L.R.; Lugato, E.; Ballabio, C.; Alewell, C.; Meusburger, K.; Modugno, S.; Schütt, B.; Ferro, V.; et al. An assessment of the global impact of 21st century land use change on soil erosion. Nat. Commun. 2017, 8, 2013. [Google Scholar] [CrossRef] [PubMed]
- Galloway, A.F.; Pedersen, M.J.; Merry, B.; Marcus, S.E.; Blacker, J.; Benning, L.G.; Field, K.J.; Knox, J.P. Xyloglucan is released by plants and promotes soil particle aggregation. New Phytol. 2017, 217, 1128–1136. [Google Scholar] [CrossRef] [PubMed]
- Chan, K.Y. Climate Change on Soil Structure and Soil Health: Impacts and Adaptation. Soil Health Clim. Change 2011, 29, 49–67. [Google Scholar] [CrossRef]
- Le Bissonnais, Y. Aggregate stability and assessment of soil crustability and erodibility: I. Theory and methodology. Eur. J. Soil Sci. 2016, 67, 11–21. [Google Scholar] [CrossRef]
- Hillel, D. Introduction to Environmental Soil Physics; Academic Press: San Diego, CA, USA, 2003. [Google Scholar]
- Barrientos-Sanhueza, C.; Mondaca, P.; Tamayo, M.; Álvaro, J.E.; Díaz-Barrera, A.; Cuneo, I.F. Enhancing the mechanical and hydraulic properties of coarse quartz sand using a water-soluble hydrogel based on bacterial alginate for novel application in agricultural contexts. Soil Sci. Soc. Am. J. 2021, 85, 1880–1893. [Google Scholar] [CrossRef]
- Emerson, W. Structural decline of soils, assessment and prevention. Soil Res. 1991, 29, 905–921. [Google Scholar] [CrossRef]
- Lu, S.; Wang, Z.; Hu, Y.; Liu, B.; Liu, J. Effectiveness and Durability of Polyacrylamide (PAM) and Polysaccharide (Jag C 162) in Reducing Soil Erosion under Simulated Rainfalls. Water 2018, 10, 257. [Google Scholar] [CrossRef]
- Hataf, N.; Ghadir, P.; Ranjbar, N. Investigation of soil stabilization using chitosan biopolymer. J. Clean. Prod. 2018, 170, 1493–1500. [Google Scholar] [CrossRef]
- Chang, I.; Im, J.; Cho, G.-C. Geotechnical engineering behaviors of gellan gum biopolymer treated sand. Can. Geotech. J. 2016, 53, 1658–1670. [Google Scholar] [CrossRef]
- Machalik, R.; Wandzik, I. A Mini-Review on Chitosan-based Hydrogels with Potential for Sustainable Agriculture Applications. Polymers 2020, 12, 2425. [Google Scholar] [CrossRef]
- Wen, K.; Li, Y.; Huang, W.; Armwood, C.; Amini, F.; Li, L. Mechanical behaviors of hydrogel-impregnated sand. Constr. Build. Mater. 2019, 207, 174–180. [Google Scholar] [CrossRef]
- Chang, I.; Prasidhi, A.K.; Im, J.; Shin, H.-D.; Cho, G.-C. Soil treatment using microbial biopolymers for anti-desertification purposes. Geoderma 2016, 253–254, 39–47. [Google Scholar] [CrossRef]
- Benard, P.; Zarebanadkouki, M.; Brax, M.; Kaltenbach, R.; Jerjen, I.; Marone, F.; Couradeau, E.; Felde, V.J.; Kaestner, A.; Carminati, A. Microhydrological Niches in Soils: How Mucilage and EPS Alter the Biophysical Properties of the Rhizosphere and Other Biological Hotspots. Vadose Zone J. 2019, 18, 1–10. [Google Scholar] [CrossRef]
- Gasek, N.; Weiss, D.J. Effect of temperature on gelation and cross-linking of gelatin methacryloyl for biomedical applications. Phys. Fluids 2020, 32, 033102. [Google Scholar] [CrossRef]
- Abasalizadeh, F.; Moghaddam, S.V.; Alizadeh, E.; Akbari, E.; Kashani, E.; Fazljou, S.M.B.; Torbati, M.; Akbarzadeh, A. Alginate-based hydrogels as drug delivery vehicles in cancer treatment and their applications in wound dressing and 3D bioprinting. J. Biol. Eng. 2020, 14, 8, Erratum in: J. Biol. Eng. 2020, 14, 17. [Google Scholar] [CrossRef]
- Guilherme, M.R.; Aouada, F.A.; Fajardo, A.R.; Martins, A.F.; Paulino, A.T.; Davi, M.F.; Rubira, A.F.; Muniz, E.C. Superabsorbent hydrogels based on polysaccharides for application in agriculture as soil conditioner and nutrient carrier: A review. Eur. Polym. J. 2015, 72, 365–385. [Google Scholar] [CrossRef]
- Díaz-Barrera, A.; Soto, E. Biotechnological uses of Azotobacter vinelandii: Current state, limits and prospects. Afr. J. Biotechnol. 2010, 9, 5240–5250. [Google Scholar]
- Urtuvia, V.; Maturana, N.; Acevedo, F.; Peña, C.; Díaz-Barrera, A. Bacterial alginate production: An overview of its biosynthesis and potential industrial production. World J. Microbiol. Biotechnol. 2017, 33, 198. [Google Scholar] [CrossRef]
- Pawar, S.N.; Edgar, K.J. Alginate derivatization: A review of chemistry, properties and applications. Biomaterials 2012, 33, 3279–3305. [Google Scholar] [CrossRef]
- Draget, K.I.; Smidsrød, O.; Skjåk-Bræk, G. Alginates from algae. In Polysaccharides and Polyamides in the Food Industry: Properties, Production, and Patents; Steinbüchel, A., Rhee, S.K., Eds.; Wiley-VCH: Weinheim, Germany, 2005; pp. 1–30. [Google Scholar]
- Ghezzehei, T. Soil Structure. In Handbook of Soil Sciences: Properties and Processes; CRC Press Taylor and Francis Group: Boca Raton, FL, USA, 2012; pp. 39–55. [Google Scholar]
- ASTM C136/C136M-14; Standard Test Method for Sieve Analysis of Fine and Coarse Aggregates. ASTM International: West Conshohocken, PA, USA, 2014.
- Padilla-Córdova, C.; Mongili, B.; Contreras, P.; Fino, D.; Tommasi, T.; Díaz-Barrera, A. Productivity and scale-up of poly(3-hydroxybutyrate) production under different oxygen transfer conditions in cultures of Azotobacter vinelandii. J. Chem. Technol. Biotechnol. 2020, 95, 3034–3040. [Google Scholar] [CrossRef]
- Díaz-Barrera, A.; Maturana, N.; Pacheco-Leyva, I.; Martínez, I.; Altamirano, C. Different responses in the expression of alginases, alginate polymerase and acetylation genes during alginate production by Azotobacter vinelandii under oxygen-controlled conditions. J. Ind. Microbiol. Biotechnol. 2017, 44, 1041–1051. [Google Scholar] [CrossRef]
- Leal, D.; Matsuhiro, B.; Rossib, M.; Carusoc, F. FT-IR spectra of alginic acid block fractions in three species of brown seaweeds. Carbohydr. Res. 2008, 343, 308–316. [Google Scholar] [CrossRef] [PubMed]
- Sartori, C.; Finch, D.S.; Ralph, B. Determination of the cation content of alginate thin films by FTIR spectroscopy. Polymer 1997, 38, 43–51. [Google Scholar] [CrossRef]
- Stephen, H.; Stephen, T. Binary Systems: Solubilities of Inorganic and Organic Compounds, Volume 1 P1; Elsevier Science: Amsterdam, The Netherlands, 1962. [Google Scholar]
- Niklas, K. Plant Biomechanics: An Engineering Approach to Plant Form and Function, 1st ed.; University of Chicago Press: Chicago, IL, USA; London, UK, 1992; ISBN 0226586316. [Google Scholar]
- Verruijt, A. An introduction to Soil Mechanics: Theory and Applications of Transport in Porous Media; Springer Nature: Gewerbestrasse, Switzerland, 2018. [Google Scholar]
- Greaves, G.N.; Greer, A.L.; Lakes, R.S.; Rouxel, T. Poisson’s ratio and modern materials. Nat. Mater. 2011, 10, 823–837. [Google Scholar] [CrossRef] [PubMed]
- ASTM-D5084-16a; Standard Test Method for Measurement of Hydraulic Conductivity of Saturated Porous Materials using a Flexible Wall Permeameter. ASTM International: West Conshohoken, PA, USA, 2016.
- Barnes, R.T.; Gallagher, M.; Masiello, C.; Liu, Z.; Dugan, B. Biochar-Induced Changes in Soil Hydraulic Conductivity and Dissolved Nutrient Fluxes Constrained by Laboratory Experiments. PLoS ONE 2014, 9, e108340. [Google Scholar] [CrossRef]
- Ohnesorge, W.V. Die bildung von tropfen an düsen und die auflösung flüssiger strahlen. ZAMM-J. Appl. Math. Mech. Z. Angew. Math. Mech. 1936, 16, 355–358. [Google Scholar] [CrossRef]
- Benard, P.; Schepers, J.R.; Crosta, M.; Zarebanadkouki, M.; Carminati, A. Physics of Viscous Bridges in Soil Biological Hotspots. Water Resour. Res. 2021, 57, e2021WR030052. [Google Scholar] [CrossRef]
- Benard, P.; Zarebanadkouki, M.; Hedwig, C.; Holz, M.; Ahmed, M.; Carminati, A. Pore-Scale Distribution of Mucilage Affecting Water Repellency in the Rhizosphere. Vadose Zone J. 2017, 17, 170013. [Google Scholar] [CrossRef]
- Fox, J.; Weisberg, S. An R Companion to Applied Regression, 2nd ed.; Thousand Oaks CA: Sage, CA, USA, 2011; Available online: http://socserv.socsci.mcmaster.ca/jfox/Books/Companion (accessed on 20 January 2020).
- Augst, A.D.; Kong, H.J.; Mooney, D.J. Alginate Hydrogels as Biomaterials. Macromol. Biosci. 2006, 6, 623–633. [Google Scholar] [CrossRef]
- Dastjerdi, M.T.; Habibagahi, G.; Nikooee, E. Effect of Confining Stress on Soil Water Retention Curve and its Impact on the Shear Strength of Unsaturated Soils. Vadose Zone J. 2014, 13, 1–11. [Google Scholar] [CrossRef]
- Stirk, G.B. Some aspects of soil shrinkage and the effect of cracking upon air entry into the soil. Aust. J. Soil Res. 1954, 5, 279–290. [Google Scholar] [CrossRef]
- Boivin, P. Shrinkage and Swelling Phenomena in Soils. Encycl. Earth Sci. Ser. 2011, 1, 733–735. [Google Scholar]
- Boivin, P.; Garnier, P.; Vauclin, M. Modeling the Soil Shrinkage and Water Retention Curves with the Same Equations. Soil Sci. Soc. Am. J. 2006, 70, 1082–1093. [Google Scholar] [CrossRef]
- Whitmore, A.P.; Whalley, W.R. Physical effects of soil drying on roots and crop growth. J. Exp. Bot. 2009, 60, 2845–2857. [Google Scholar] [CrossRef] [PubMed]
- Macht, F.; Eusterhues, K.; Pronk, G.J.; Totsche, K.U. Specific surface area of clay minerals: Comparison between atomic force microscopy measurements and bulk-gas (N2) and -liquid (EGME) adsorption methods. Appl. Clay Sci. 2011, 53, 20–26. [Google Scholar] [CrossRef]
- Hatch, C.D.; Wiese, J.S.; Crane, C.C.; Harris, K.J.; Kloss, H.G.; Baltrusaitis, J. Water Adsorption on Clay Minerals as a Function of Relative Humidity: Application of BET and Freundlich Adsorption Models. Langmuir 2012, 28, 1790–1803. [Google Scholar] [CrossRef] [PubMed]
- Carminati, A.; Zarebanadkouki, M.; Kroener, E.; Ahmed, M.A.; Holz, M. Biophysical rhizosphere processes affecting root water uptake. Ann. Bot. 2016, 118, 561–571. [Google Scholar] [CrossRef] [PubMed]
- Ahmed, M.A.; Zarebanadkouki, M.; Ahmadi, K.; Kroener, E.; Kostka, S.; Kaestner, A.; Carminati, A. Engineering Rhizosphere Hydraulics: Pathways to Improve Plant Adaptation to Drought. Vadose Zone J. 2017, 17, 160090. [Google Scholar] [CrossRef]
- Mitchel, J.; Soga, K. Fundamentals of Soil Behavior; John Wiley & Sons: Hoboken, NJ, USA, 2005. [Google Scholar]
- Van der Drift, J.W.M. The effect of temperature change on soil structure stability. Climate Change Research—Evaluation and Policy Implications. In Proceedings of the International Climate Change Research Conference, Berlin, Germany, 28 March 1995; pp. 923–930. [Google Scholar] [CrossRef]
- Tate, R., III. Soil Organic Matter. Biological and Ecological Effects; John Wiley & Sons: Hoboken, NJ, USA, 1987. [Google Scholar]
- Houle, D.; Marty, C.; Augustin, F.; Dermont, G.; Gagnon, C. Impact of Climate Change on Soil Hydro-Climatic Conditions and Base Cations Weathering Rates in Forested Watersheds in Eastern Canada. Front. For. Glob. Chang. 2020, 3, 535397. [Google Scholar] [CrossRef]
- Bradford, J.B.; Schlaepfer, D.R.; Lauenroth, W.K.; Palmquist, K.A.; Chambers, J.C.; Maestas, J.D.; Campbell, S.B. Climate-Driven Shifts in Soil Temperature and Moisture Regimes Suggest Opportunities to Enhance Assessments of Dryland Resilience and Resistance. Front. Ecol. Evol. 2019, 7, 358. [Google Scholar] [CrossRef]
- Carminati, A.; Kaestner, A.; Lehmann, P.; Flühler, H. Unsaturated water flow across soil aggregate contacts. Adv. Water Resour. 2008, 31, 1221–1232. [Google Scholar] [CrossRef]
- Kramer, P.J.; Boyer, J.S. Water Relations of Plant and Soil; Academic Press: San Diego, CA, USA, 1995. [Google Scholar]
- Qi, C.; Bai, Y.; Liu, J.; Bu, F.; Kanungo, D.P.; Song, Z.; He, X. Desiccation Cracking Behavior of Polyurethane and Polyacrylamide Admixed Clayey Soils. Polymers 2020, 12, 2398. [Google Scholar] [CrossRef] [PubMed]
- Gao, W.; Wu, Z.; Wu, Z. Study of mechanism of the W-OH sand fixation. J. Environ. Prot. Ecol. 2012, 3, 1025–1033. [Google Scholar] [CrossRef]


Publisher’s Note: MDPI stays neutral with regard to jurisdictional claims in published maps and institutional affiliations. |
© 2022 by the authors. Licensee MDPI, Basel, Switzerland. This article is an open access article distributed under the terms and conditions of the Creative Commons Attribution (CC BY) license (https://creativecommons.org/licenses/by/4.0/).
Share and Cite
Barrientos-Sanhueza, C.; Cargnino-Cisternas, D.; Díaz-Barrera, A.; Cuneo, I.F. Bacterial Alginate-Based Hydrogel Reduces Hydro-Mechanical Soil-Related Problems in Agriculture Facing Climate Change. Polymers 2022, 14, 922. https://doi.org/10.3390/polym14050922
Barrientos-Sanhueza C, Cargnino-Cisternas D, Díaz-Barrera A, Cuneo IF. Bacterial Alginate-Based Hydrogel Reduces Hydro-Mechanical Soil-Related Problems in Agriculture Facing Climate Change. Polymers. 2022; 14(5):922. https://doi.org/10.3390/polym14050922
Chicago/Turabian StyleBarrientos-Sanhueza, Cesar, Danny Cargnino-Cisternas, Alvaro Díaz-Barrera, and Italo F. Cuneo. 2022. "Bacterial Alginate-Based Hydrogel Reduces Hydro-Mechanical Soil-Related Problems in Agriculture Facing Climate Change" Polymers 14, no. 5: 922. https://doi.org/10.3390/polym14050922
APA StyleBarrientos-Sanhueza, C., Cargnino-Cisternas, D., Díaz-Barrera, A., & Cuneo, I. F. (2022). Bacterial Alginate-Based Hydrogel Reduces Hydro-Mechanical Soil-Related Problems in Agriculture Facing Climate Change. Polymers, 14(5), 922. https://doi.org/10.3390/polym14050922