Article

Classification and Characterization of Tire-Road Wear Particles in Road Dust by Density

Department of Chemistry, Sejong University, 209 Neungdong-ro, Gwangjin-gu, Seoul 05006, Korea
*
Author to whom correspondence should be addressed.
Polymers 2022, 14(5), 1005; https://doi.org/10.3390/polym14051005
Submission received: 29 January 2022 / Revised: 19 February 2022 / Accepted: 25 February 2022 / Published: 2 March 2022

Abstract

:
Tire treads are abraded by friction with the road surface, producing tire tread wear particles (TWPs). TWPs combined with other particles on the road such as road wear particles (RWPs) and mineral particles (MPs), forming tire-road wear particles (TRWPs). Dust on an asphalt pavement road is composed of various components such as TRWPs, asphalt pavement wear particles (APWPs), MPs, plant-related particles (PRPs), and so on. TRWPs have been considered as one of major contaminants produced by driving and their properties are important for study on real abrasion behaviors of tire treads during driving as well as environmental contamination. Densities of the TRWPs are totally dependent on the amount of the other components deposited in the TWPs. In this study, a classification method of TRWPs in the road dust was developed using density separation and the classified TRWPs were characterized using image analysis and pyrolytic technique. Chloroform was used to remove APWPs from mixture of TRWPs and APWPs. TRWPs were found in the density range of 1.20–1.70 g/cm3. By decreasing the particle size of the road dust, the TRWP content in the road dust increased and its density slightly tended to increase. Aspect ratios of the TRWPs varied and there were many TRWPs with low aspect ratio below 2.0. The aspect ratio range was 1.2–5.2. Rubber compositions of the TRWPs were found to be mainly NR/SBR biblend or NR/BR/SBR triblend.

Graphical Abstract

1. Introduction

Tire treads are abraded by friction between the road surface and the tire tread, resulting in the formation of tire-road wear particles (TRWPs) [1,2]. TRWPs are usually black particles with a stick or round shape, and, to some extent, they are encrusted by mineral and other tiny particles [3,4]. Since rubber has a slightly sticky surface [5], such particles can easily adhere to the rubber particle (tire tread wear particle, TWP) surface. When contaminants attach to the TWP surface, they can release to environment. Especially, the particles of small size float in the air to cause air pollution as fine dust or they enter the aquatic environment to cause water pollution [6]. Therefore, TRWPs have been considered a kind of microplastics and a pollutant [7,8].
In general, densities of the TWPs are about 1.2 g/cm3, while the TRWP densities should be higher than the TWPs due to the encrusted mineral particles [9,10]. Granite and marble are some of representative rock components and their densities are about 2.7 g/cm3 [11,12]. TRWPs with high density have many mineral particles or environmental contaminants attached to the surface. Since TRWPs have various densities, it is necessary to subdivide TRWPs by density and analyze their properties. Tire tread wear is also directly related to the lifespan of a tire, so careful and detailed researches on the abrasion behaviors are required. Real road dust is composed of various components including TRWPs, asphalt pavement wear particles (APWPs), mineral particles (MPs), glass particles (GPs), glass beads (GBs), plant-related particles (PRPs), road paint wear particles (RPWPs), plastic particles (PPs), and others [4]. Hence, TRWPs should be separated from the road dust at first to examine properties of TRWPs.
A density separation method has been employed for separation of TRWPs from the environmental samples, and it uses the density differences of the components. It was reported that a very high-density medium of sodium polytungstate solution (density: 2.2 g/cm3) was used for the density separation [1]. Using this method, the TRWPs were found in the floated fraction but lots of other particles also existed in the same fraction. Klockner et al. used an instrument consisting of a 50 mL volumetric flask equipped with PVC tube and sodium polytungstate solution of 1.9 g/cm3, and they could fractionate the sample 1 day after the solution treatment [2]. This method may be semi-automated using the instrument but it is somewhat complex and takes a long time. To effectively separate TRWPs from the environmental samples and determine their detailed densities, it is required to develop a new method. In this study, a separation method of TRWPs from the environmental sample of road dust was developed using salt solutions with different densities and chloroform. Chloroform was used to eliminate APWPs from the sample mixed with TRWPs. The TRWPs were classified by 0.10 g/cm3 density unit and their structural characteristics and rubber compositions were analyzed. We believe that this analytical method could be also applied to various environmental samples containing TRWPs such as sediments of river and sea.

2. Materials and Methods

2.1. Materials

Sodium bromide (purity: 99.0%) and sodium iodide (purity: 99.0%) were purchased from Ducksan Co. (Ansan, Korea). Chloroform (purity: 99.5%) was purchased from Samchun Chemical Co. (Seoul, Korea). Deionized water was used to prepare the salt solutions.

2.2. Matrix Solution Preparation for Density Separation

For density separation, salt solutions and chloroform were used. Sodium bromide and sodium iodide were used for the preparation of the salt solutions in deionized water. Density of the saturated sodium bromide solution was 1.52 g/cm3 at 22 °C. Sodium bromide solutions with densities of 1.20, 1.30, 1.40 and 1.50 g/cm3 were prepared. For the preparation of higher density solutions, sodium iodide was used. Density of the saturated solution of sodium iodide was 1.83 g/cm3 at 24 °C. Sodium iodide solutions with densities of 1.60 and 1.70 g/cm3 were prepared. Density of chloroform is 1.49 g/cm3.

2.3. Preparation of Road Dust Sample

Road dust was collected in January 2021 near a bus stop by sweeping with a broom. The road dust was separated by size (212–500, 106–212, and 63–106 μm) using a sieve shaker of Octagon 200 (Endecotts Co., London, UK). Morphology of the particles was analyzed using an image analyzer (EGVM 35B, EG Tech., Anyang, Korea).
In order to examine components of the road dust, all of the particles in 10 mg road dust of 212–500 μm (sample code: RD1) were classified into the kinds with the naked eye under a microscope. Rough density of each particle was also measured using the salt solutions of 1.2 and 1.6 g/cm3. The road dust samples of 212–500 μm (20 mg, sample code: RD2), 106–212 μm (10 mg, sample code: RD3), and 63–106 μm (5 mg, sample code: RD4) were used.

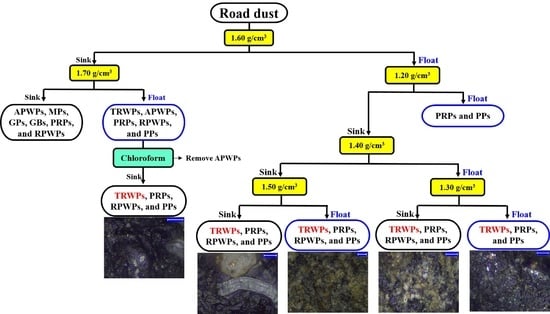
2.4. Density Separation Method

Approximately 50 mL of salt solution or chloroform was put into a glass container (diameter 70 mm, height 40 mm), and the road dust sample was put into the container. In the case of using chloroform, the sonication (ultrasonic cleaner, Jeiotech Co., Daejeon, Korea) process was performed for an additional 10 min. In order to sufficiently wet the particles, the solution was dropped several times with a micro pipette and left for 30 min. After this process was repeated twice, the particles sunk and floated were separated using a micro pipette. The separated particles were transferred to a petri dish, washed 3 times with deionized water and finally washed once more with ethanol, and then dried at room temperature.

2.5. Characterization of TRWPs

Morphology analysis of the classified TRWPs was performed using a digital microscope (Leica DM4 M, Leica Microsystems, Wetzlar, Germany). Lengths of the major and minor axes were measured using the 2D analysis module, and the aspect ratio was obtained. Other tiny particles deposited on the TRWP surface were also observed.
Rubber composition of the TRWPs was analyzed using pyrolysis-gas chromatography (Py-GC). YL6500GC (Younglin Co., Seoul, Korea) equipped with CDS 2000 Pyroprobe (CDS Analytical Inc., Oxford, PA, USA) was used. The interface temperature of the pyrolyzer was 250 °C. The sample was put in a quartz tube and both sides were covered with glass wool and then pyrolyzed at 520 °C for 10 s. Temperature of the GC injector was 250 °C. An HP-5 column (30 m × 0.25 mm, 0.25 μm thickness) was used. The split ratio was 1:15 and N2 was used as the carrier gas. The GC oven temperature program was as follows: 30 °C (held for 3 min) to 180 °C (held for 1 min) at 10 °C/min, then to 250 °C (held for 3 min) at 10 °C/min.

3. Results and Discussion

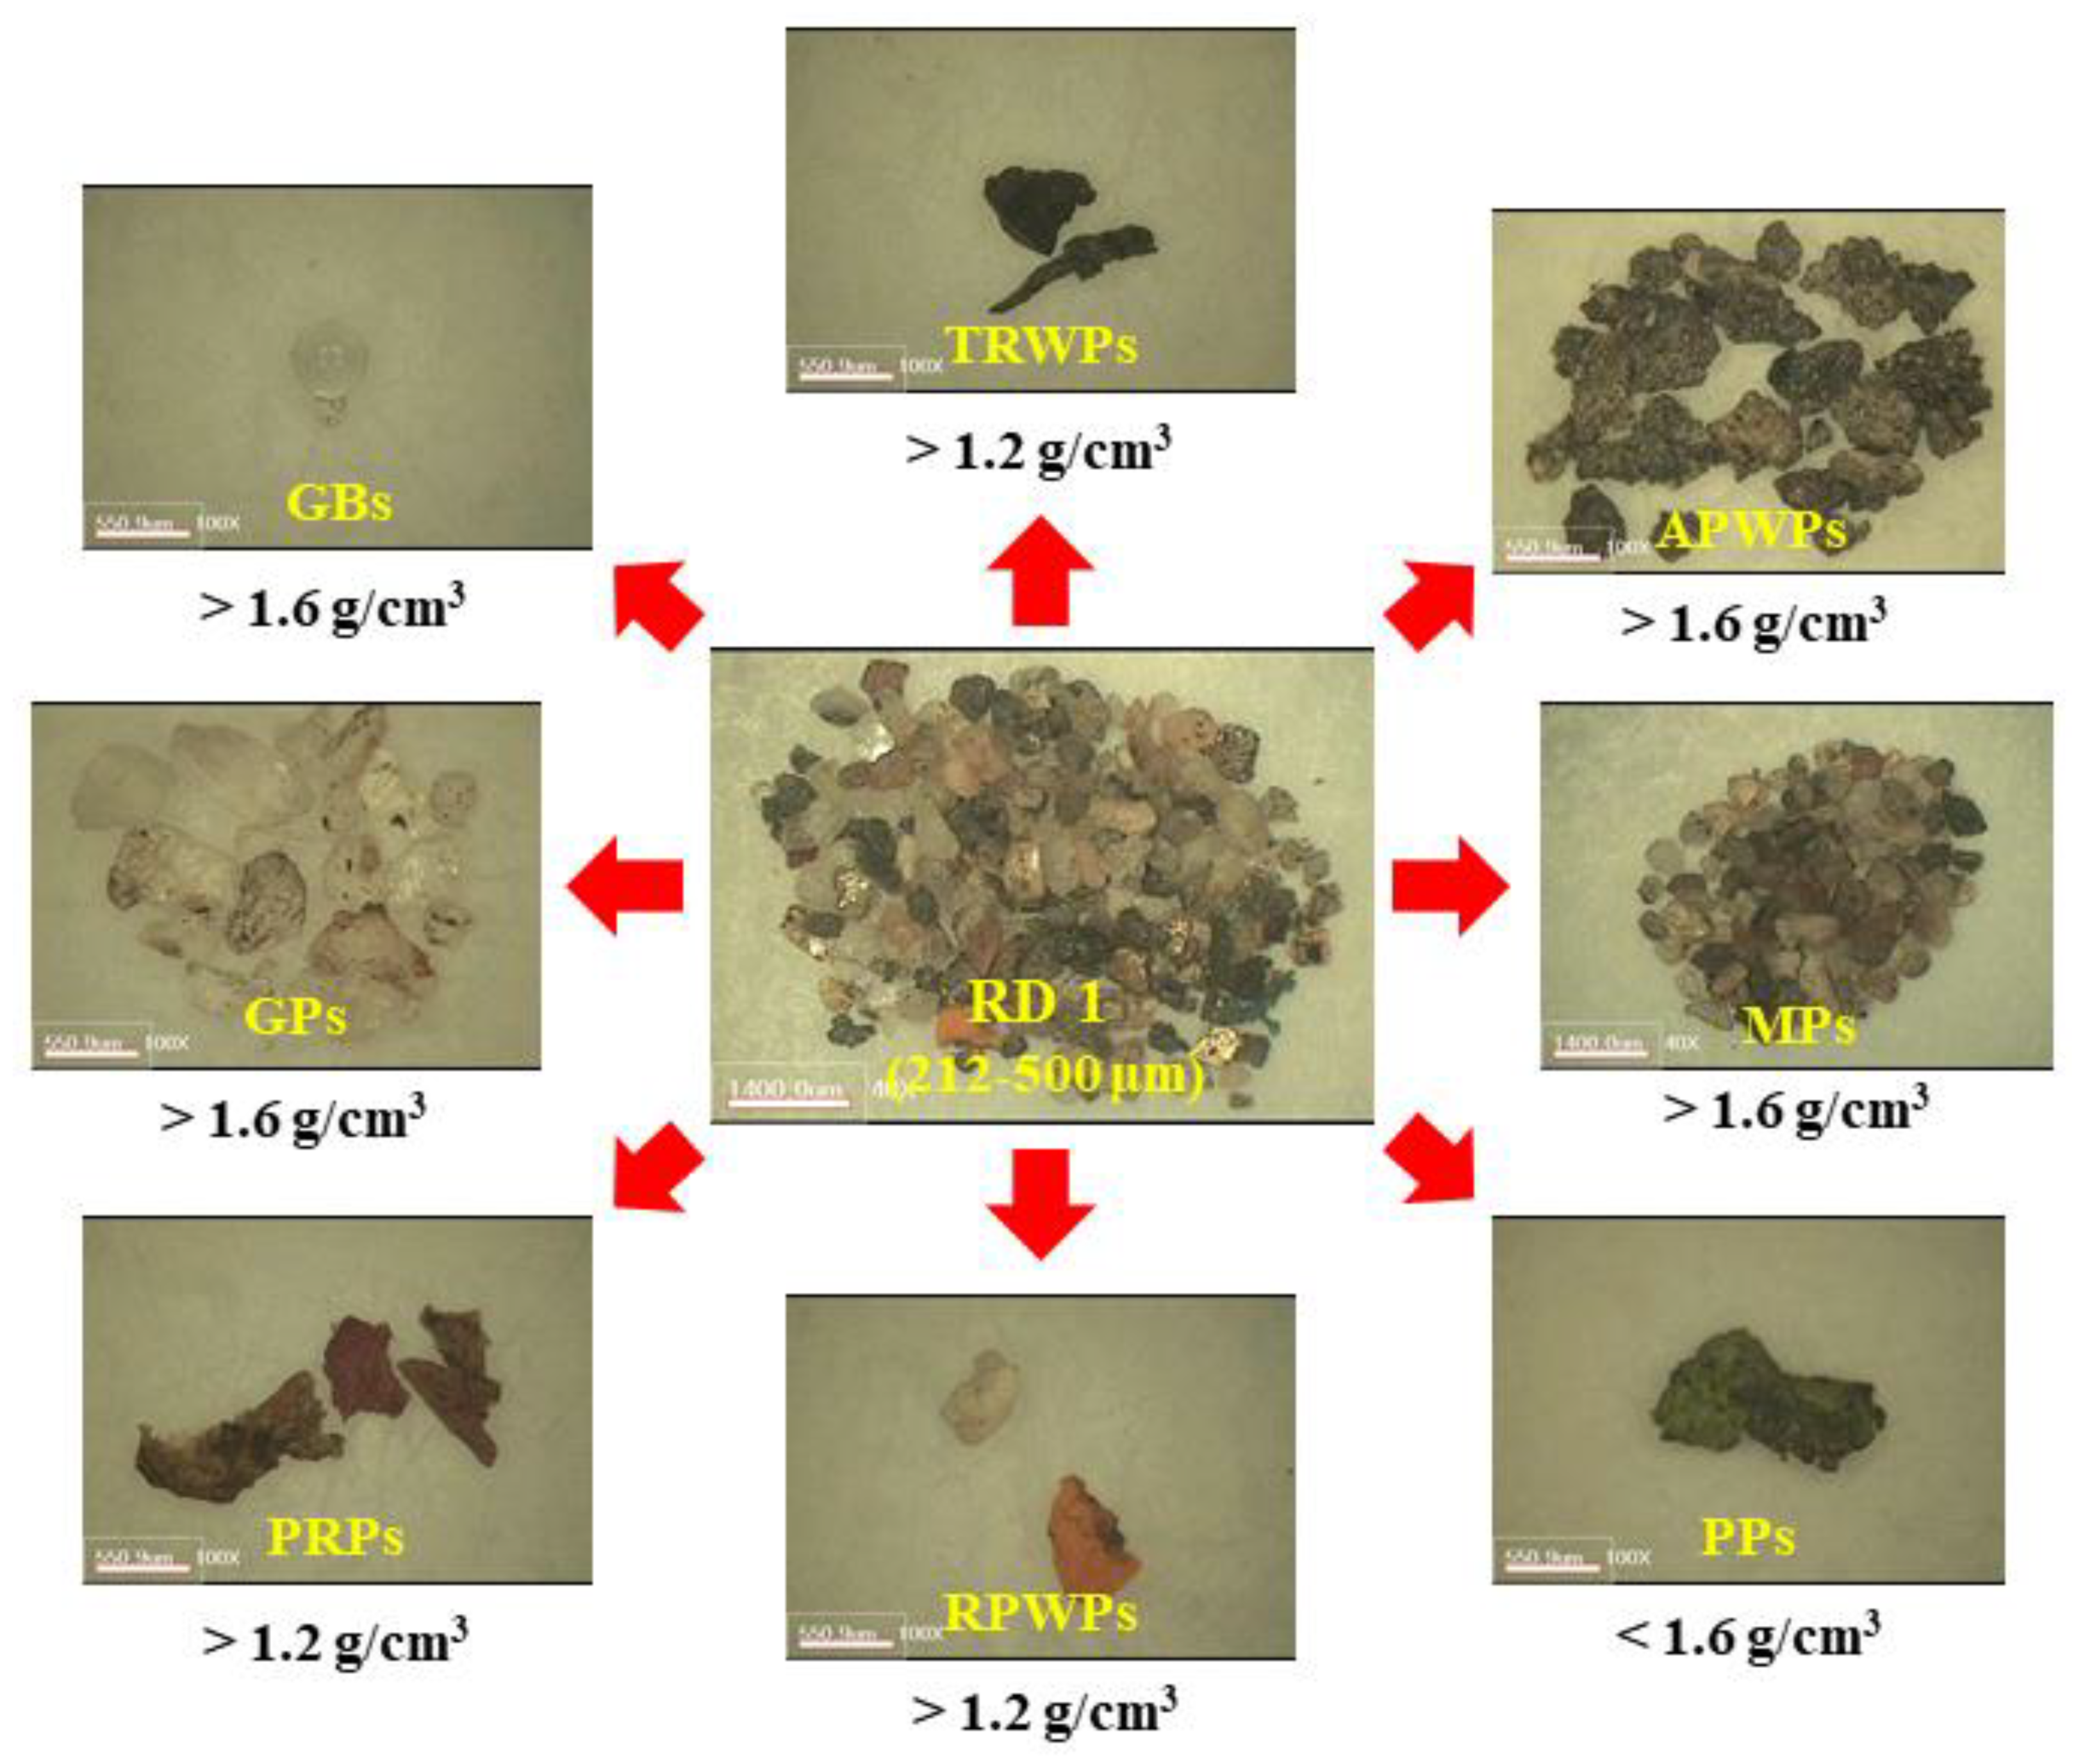
3.1. Composition and Density Properties of the Road Dust

In order to examine the kinds of components in the road dust, each particle in 10 mg road dust of 212–500 μm was classified and their densities were measured. Among the black particles, elastic particles with elongated or round shapes were classified into TRWPs. On the other hand, APWPs were selected based on the feature of being inelastic and breaking when pressed.
Besides TRWPs and APWPs, there were various kinds of particles in the road dust samples such as MPs, GPs, GBs, RPWPs, PRPs, and PPs as listed in Table 1. MPs were most abundant in the road dust, and they had a rigid and angular shape. PPs were thin and slightly hard. RPWPs were particles produced by wearing road marking paint, and they were white or yellow color and crumbled when pressed. PRPs were generated from plants around the bus stop, and they could be crushed into smaller pieces. GPs were transparent and angular shape, whereas GBs were spherical.
Rough densities of the classified particles of the RD1 sample are summarized in Figure 1. Densities of TRWPs, RPWPs, and PRPs were widely spread over 1.2 g/cm3, while those of APWPs, MPs, GPs, and GBs were over 1.6 g/cm3. Density of PPs was lower than 1.6 g/cm3. Based on these results, the reference density was set to 1.6 g/cm3. When the road dust sample is put in the matrix solution with density of 1.6 g/cm3, PPs will be floated while MPs, APWPs, GPs, and GBs sink. For TRWPs, RPWPs, and RPPs, some of them can float and the others may sink.
In order to examine the density distribution of the TRWPs by 0.10 g/cm3 unit, 10 TRWPs were randomly selected from the road dust of 106–212 μm because there were rare TRWPs in the road dust of 212–500 μm. The TRWPs had densities of 1.20–1.60 g/cm3, and those with low density of 1.20–1.30 g/cm3 were much greater than the others, as shown in Figure 2. Based on the density ranges of TRWPs, the density separation was carried out using the salt solutions with densities of 1.20, 1.30, 1.40, 1.50, 1.60, and 1.70 g/cm3.

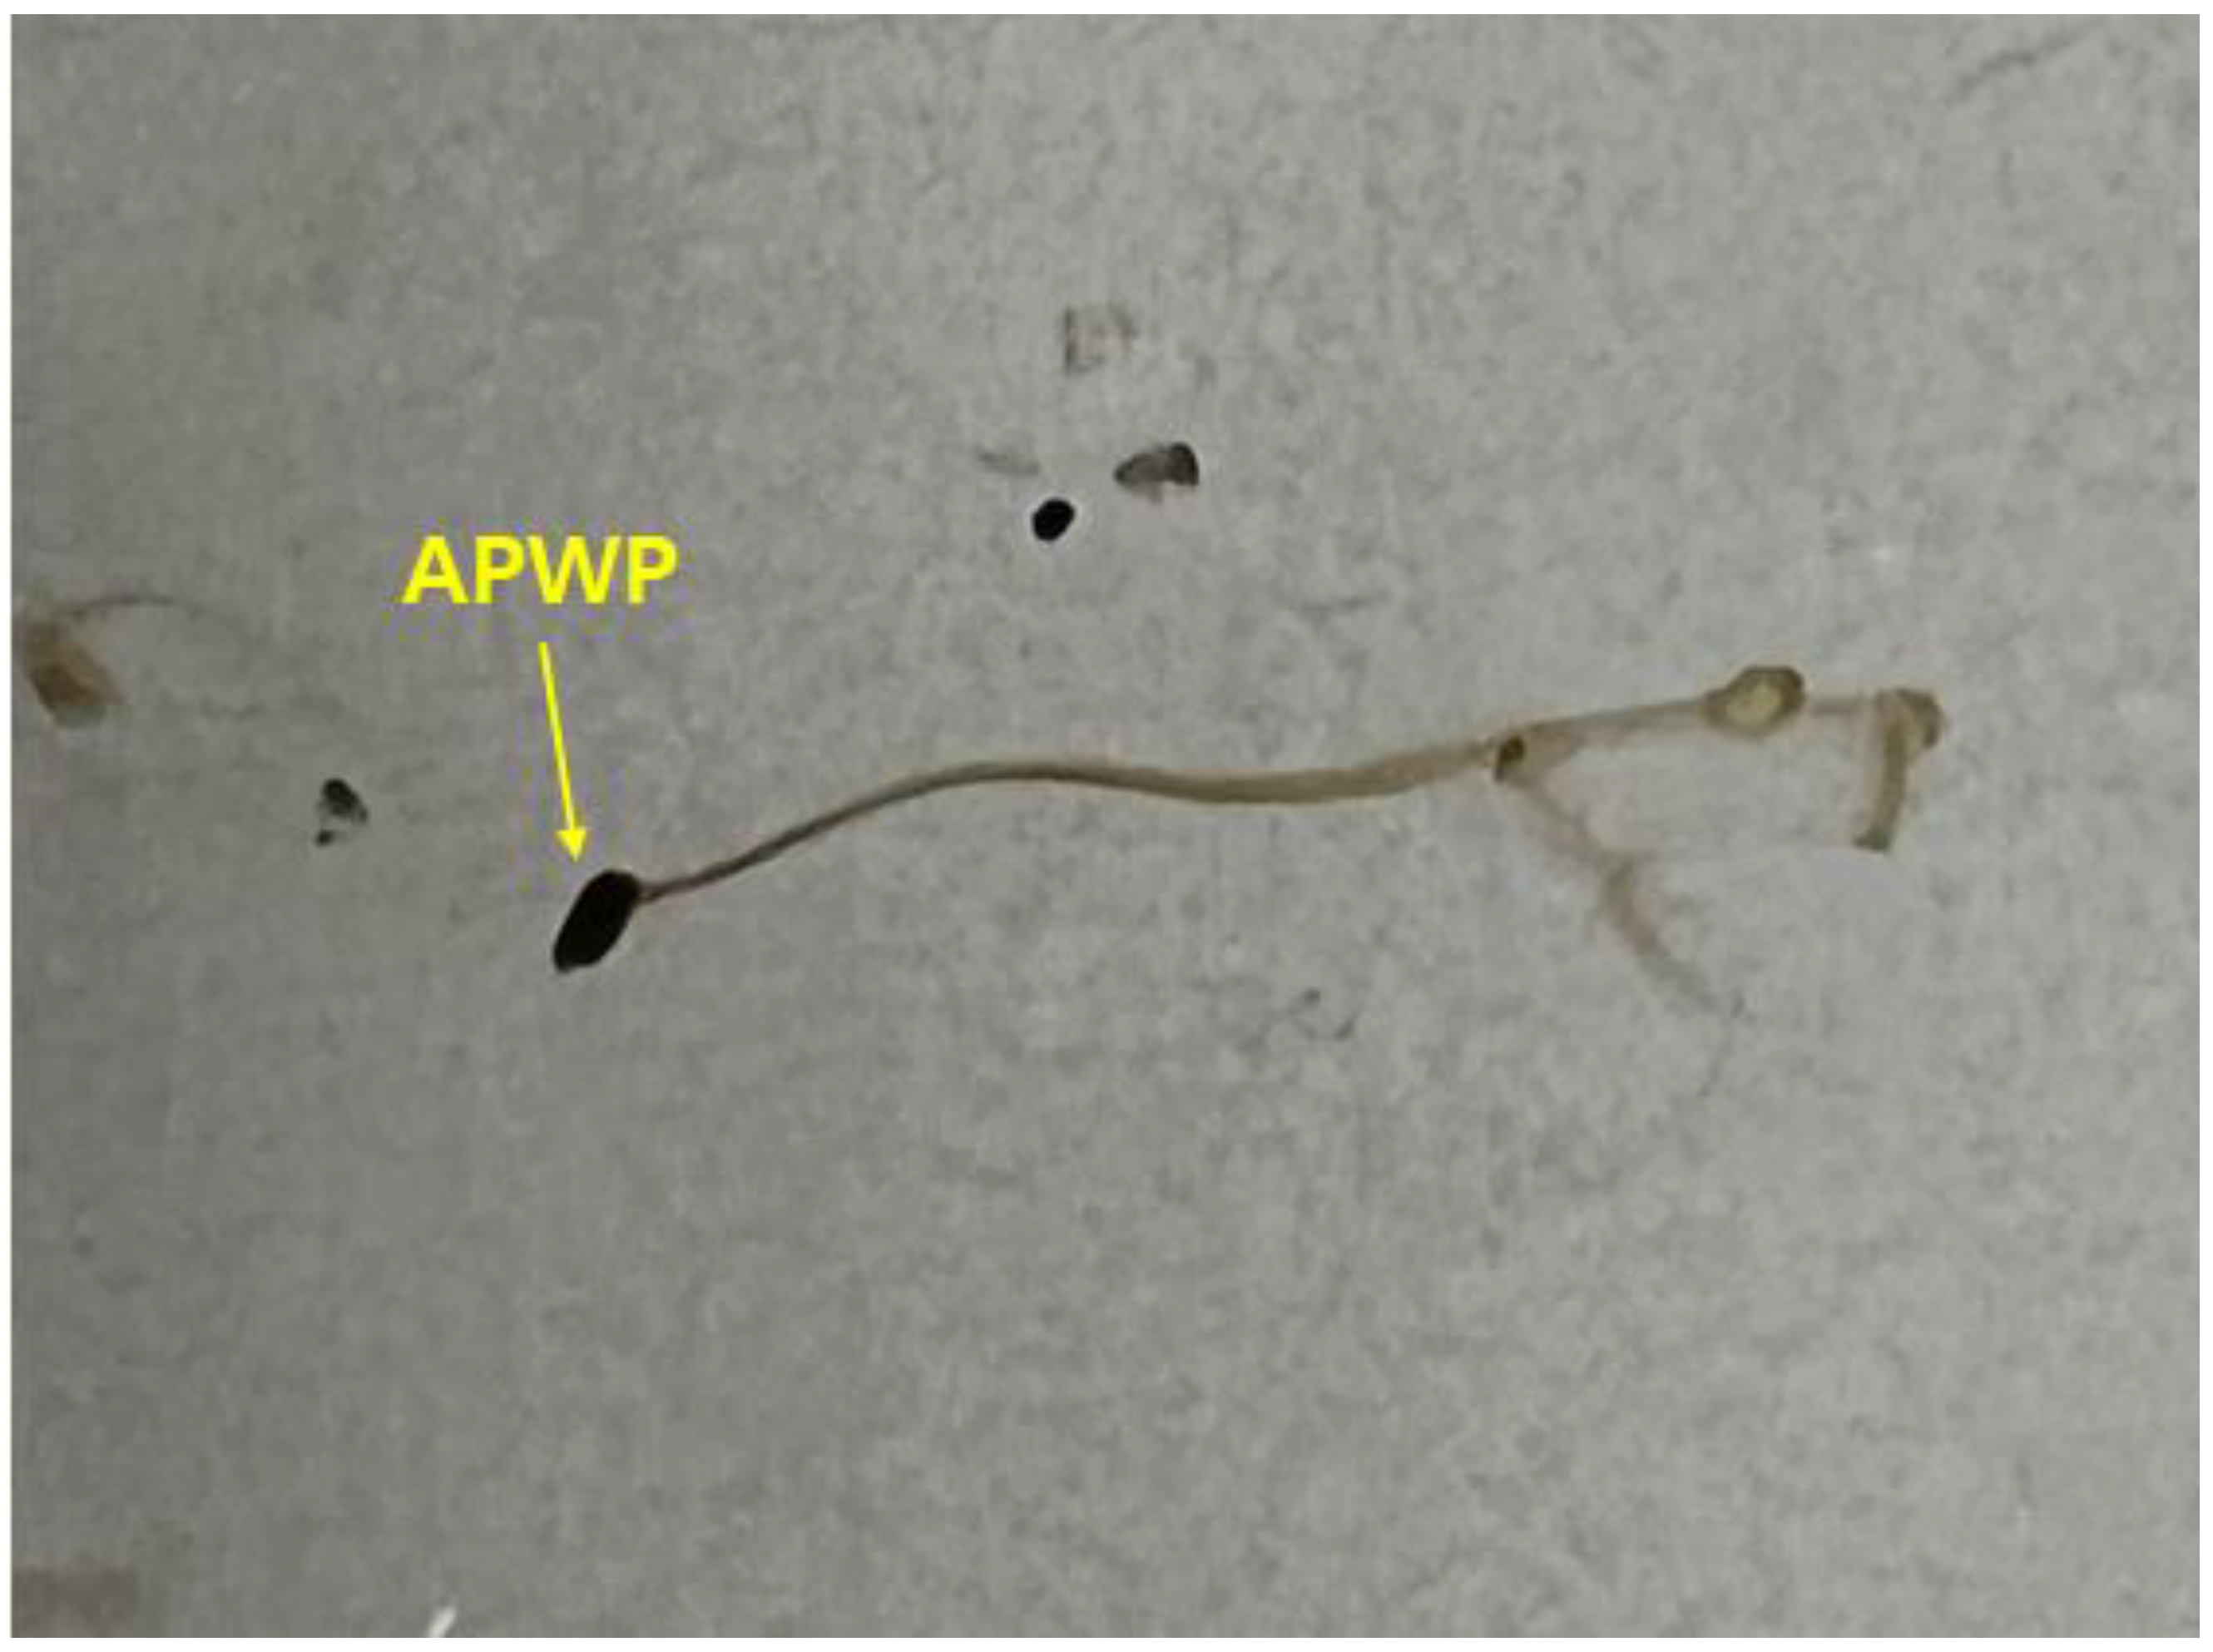
3.2. Differentiation of TRWPs and APWPs

Shapes and colors of TRWP and APWP in road dust are very similar, and some TRWPs with high density are the same density region of APWPs. For this reason, it is hard to differentiate TRWPs from APWPs in the same density range. Fortunately, bitumen used as a binder of asphalt pavement is easily dissolved with some solvents such as chloroform, but crosslinked rubber does not dissolved with any solvents. In this study, TRWPs were differentiated from APWPs in the same density range using chloroform treatment. When an APWP is put into chloroform, bitumen part of the APWP is dissolved, as shown in Figure 3.
A TRWP and an APWP with similar size and shape were selected, and chloroform was dropped on them (Figure 4). After the chloroform treatment, the TRWP still maintained its initial shape but the APWP split into pieces and the degree was more severe by increasing the chloroform drop. When the whole bitumen part of an APWP was totally dissolved in chloroform, the APWP shape disappeared and aggregate (broken stone) in the APWP was appeared. Hence, we can conclude that APWPs mixed with TRWPs are removed by chloroform treatment. By the chloroform treatment, binder components such as bitumen in APWPs dissolve and the stone components with high density settle down.

3.3. Density Separation of the Road Dust Samples

An experimental procedure for TRWP separation from road dust and classification of the TRWPs by density is described in Figure 5. First, the road dust sample was put into the salt solution of 1.60 g/cm3 and divided into high- and low-density particles corresponding to the sunk and floating parts, respectively. Second, the high-density moiety was put into the salt solution of 1.70 g/cm3, the floated 1 was treated with chloroform to remove APWPs, and TRWPs were selected from the mixture. The TRWPs selected from the second step have density of 1.60–1.70 g/cm3. Third, the moiety floated in the salt solution of 1.60 g/cm3 was put into the salt solution of 1.20 g/cm3 to remove light particles such as some of PRPs and PPs. Fourth, the moiety sunk in the salt solution of 1.20 g/cm3 was put into the salt solution of 1.40 g/cm3 and the sunk and floated parts were put into the salt solutions of 1.50 and 1.30 g/cm3, respectively. Fifth, the moieties sunk and floated in the salt solution of 1.50 g/cm3 were divided into 2 groups of 1.50–1.60 and 1.40–1.50 g/cm3, respectively. The TRWPs selected from the fifth step have densities of 1.50–1.60 and 1.40–1.50 g/cm3, respectively. Finally, the moieties sunk and floated in the salt solution of 1.30 g/cm3 were divided into 2 groups of 1.30–1.40 and 1.20–1.30 g/cm3, respectively. The TRWPs selected from the final step have densities of 1.30–1.40 and 1.20–1.30 g/cm3, respectively.
The numbers of TRWPs after the density separation were counted and the results have been summarized in Figure 6. There was no TRWP below 1.20 g/cm3 or above 1.70 g/cm3. For the RD2 sample of 212–500 μm, TRWPs were rarely found and another road dust sample of 212–500 μm did not have any TRWP. There were only TRWPs with relatively low densities below 1.50 g/cm3 in the RD2 sample. For the RD3 sample of 106–212 μm, TRWPs with all density ranges of 1.20–1.70 g/cm3 were found. There were relatively even TRWPs with density ranges of 1.30–1.70 g/cm3 in the RD4 sample of 63–106 μm. By decreasing the road dust size, the TRWP size tended to smaller.
The contents of the TRWPs in the road dust samples are summarized in Figure 7. The TRWP content clearly increased as the road dust sample size decreased. This means that size distribution of TWPs produced by abrasion of tire treads shifted to smaller one or initial TRWPs were broken into smaller pieces by friction between the road and the tire. For the RD2 sample of 212–500 μm, content of the TRWP with 1.20–1.30 g/cm3 was much greater than that with 1.40–1.50 g/cm3. For the RD3 sample of 106–212 μm, content of the TRWP with 1.40–1.50 g/cm3 was larger than those of the other sizes. Compared to the TRWPs with the same density range, the TRWP content tended to increase with decrease in the particle size.

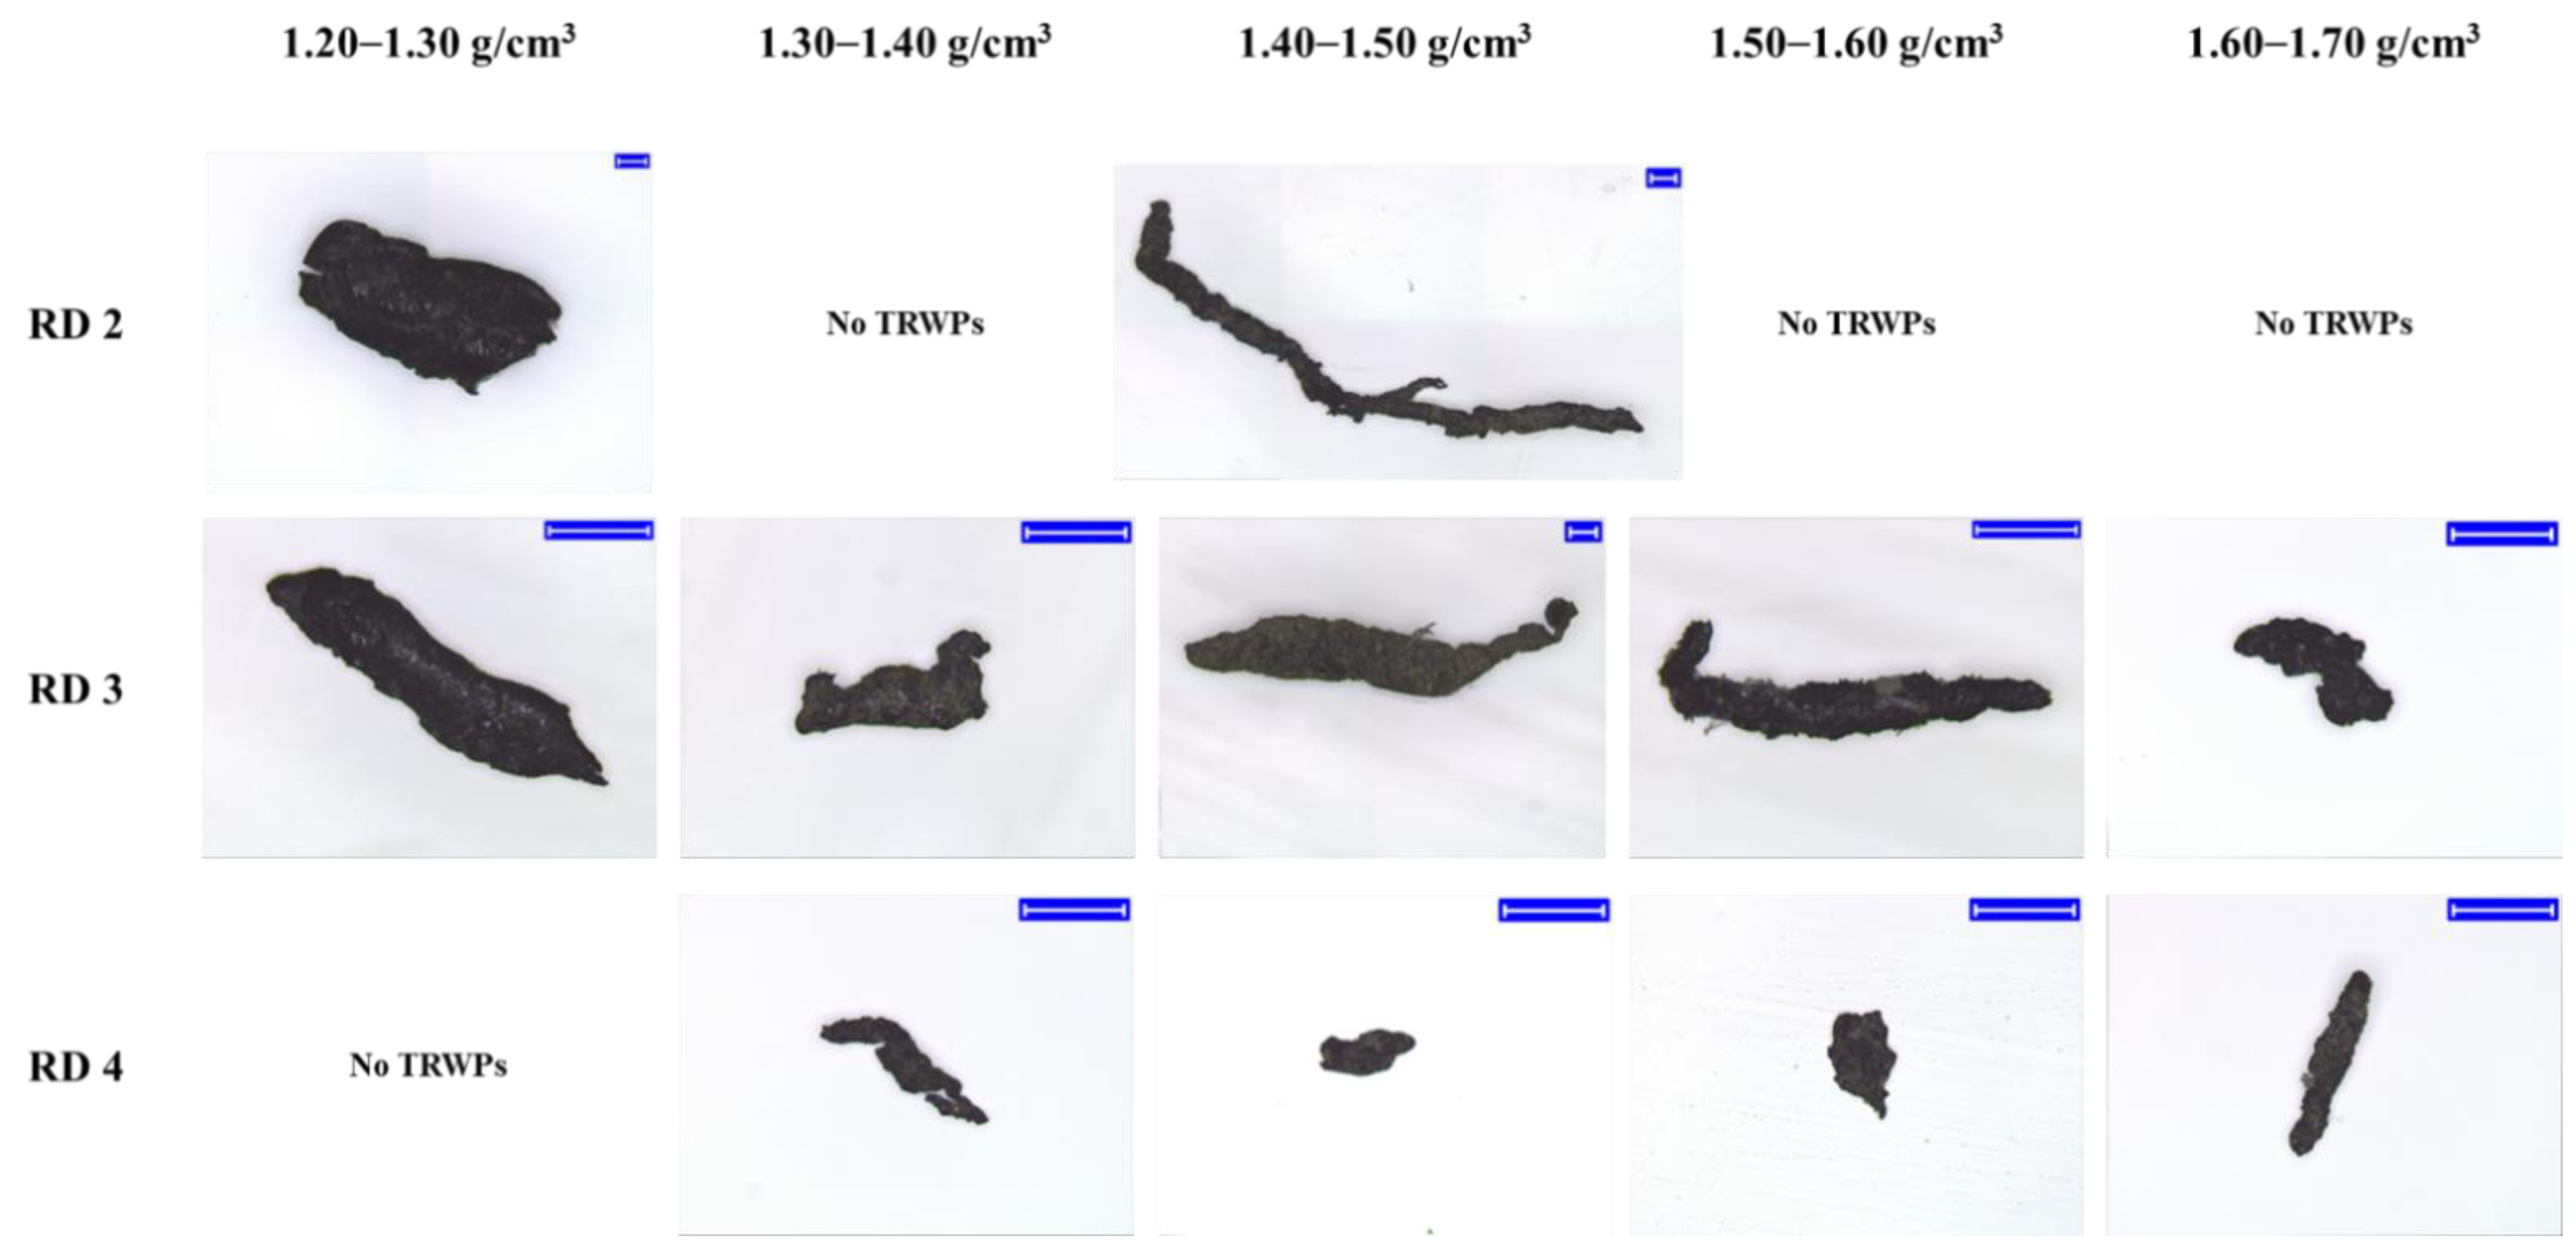
3.4. Characterization of TRWPs Classified by the Density Separation

Shapes of the classified TRWPs were analyzed and the aspect ratios were measured. Magnified images of the representative TRWPs are shown in Figure 8. The TRWP surface was magnified to examine the tiny particles attached to the surface as shown in Figure 9. Particle sizes on the TRWP surface varied and the number of particles on the TRWP surface tended to increase as the TRWP density increased.
There were rare TRWPs in the RD2 sample (212–500 μm), but their aspect ratios were very different from each other, as listed in Table 2. Only 3 TRWPs were found in the RD2 sample. The L3 TRWP had very long shape and its aspect ratio was over 30. A total of 21 TRWPs were found in the RD3 sample (106–212 μm) and the TRWPs were given a number according to the aspect ratio as well as the density (Table 3). There was no specific trend for the aspect ratios with the density. The lowest aspect ratio was 1.22, while the highest one was 5.21. There were many TRWPs with very low aspect ratios below 2.00 g/cm3 in the TRWPs of 1.60–1.70 g/cm3. 65 TRWPs were found in the RD4 sample (63–106 μm) and they were given a number according to the aspect ratio as well as the density (Table 4). The lowest aspect ratio was 1.21, while the highest one was 4.31. Aspect ratios of the TRWPs in the RD4 sample were relatively lower than those in the RD3 sample. There were many TRWPs with very low aspect ratios below 2.00 for all of the density ranges. Ratios of the TRWPs with very low aspect ratios below 2.00 tended to increase by increasing the density. The ratios were 31, 42, 35, and 50% for the TRWPs with the densities of 1.30–1.40, 1.40–1.50, 1.50–1.60, and 1.60–1.70 g/cm3, respectively.
Py-GC chromatograms of the TRWPs separated from the RD2, RD3, and RD4 samples showed similar pyrolysis products, as shown in Figure 10. The major pyrolysis products were isoprene and dipentene which are the key pyrolysis products of natural rubber (NR) [13,14,15,16]. Since bus tire treads are mainly made of NR [17,18,19,20], the TRWPs should come from abrasion of bus tire treads. Styrene was one of main pyrolysis products of the TRWPs and this could originate from abrasion of tire tread made of styrene-butadiene rubber (SBR) or APWPs attatched to the TRWPs. Styrene and 4-vinylcyclohexene (VCH) are the key pyrolysis products of SBR [21,22,23]. VCH is also the key pyrolysis products of butadiene rubber (BR) [24]. Hence, the TRWPs should be composed of NR/SBR biblend or NR/BR/SBR triblend compound. The TRWP of the RD2 sample showed very intensive styrene peak but the VCH peak was relatively small. This implies that some styrene might come from the other source such as APWP not SBR. For the TRWP of the RD3 sample, the peak intensities of styrene and VCH were nearly the same, which means that BR content in the TRWPs was not lower than SBR sample. 13 TRWPs of the RD3 sample were analyzed together so their rubber compositions might be different each other.

4. Conclusions

Based on the density ranges of TRWPs, the density separation was carried out using the salt solutions with different densities of 1.20, 1.30, 1.40, 1.50, 1.60, and 1.70 g/cm3. TRWPs were differentiated from APWPs in the same density range using chloroform treatment. TRWPs were classified into 5 groups according to the density ranges of 1.20–1.30, 1.30–1.40, 1.40–1.50, 1.50–1.60, and 1.60–1.70 g/cm3. There was no TRWP below 1.20 g/cm3 or above 1.70 g/cm3. For the RD2 sample (212–500 μm), TRWPs were rarely found. For the RD3 sample (106–212 μm), TRWPs with all density ranges of 1.20–1.70 g/cm3 were found. There were relatively even TRWPs with density ranges of 1.30–1.70 g/cm3 in the RD4 sample (63–106 μm). For the TRWPs with the same density range, the TRWP content tended to increase with decrease in the particle size. Sizes of the tiny particles adsorbed on the TRWP surface varied and the number of the tiny particles tended to increase as the TRWP density increased. There was no specific trend for the aspect ratios with the TRWP density. Almost TRWPs were in the aspect ratio range of 1.2–5.2. Percentage of the TRWPs with very low aspect ratios below 2.00 tended to increase by increasing the TRWP density. Major pyrolysis products of the TRWPs were isoprene and dipentene which means that the TRWPs were mainly made of NR and they came from the abrasion of bus tire treads. Styrene and VCH were also observed as the main pyrolysis products, meaning that the TRWP might be composed of NR/SBR biblend or NR/BR/SBR triblend compound.

Author Contributions

U.J.: road dust collection & separation, density separation, formal analysis, data curation, visualization, writing—first draft. S.-S.C.: resources, supervision, writing—original draft & editing. All authors have read and agreed to the published version of the manuscript.

Funding

This work was supported by the Technology Innovation Program funded by the Ministry of Trade, Industry and Energy, Korea (Project Number 20010851).

Institutional Review Board Statement

Not applicable.

Informed Consent Statement

Not applicable.

Data Availability Statement

The data presented in this study are available on request from the corresponding author.

Conflicts of Interest

The authors declare no conflict of interest.

References

  1. Kovochich, M.; Parker, J.A.; Oh, S.C.; Lee, J.P.; Wagner, S.; Reemtsma, T.; Unice, K.M. Characterization of individual tire and road wear particles in environmental road dust, tunnel dust, and sediment. Environ. Sci. Technol. Lett. 2021, 8, 1057–1064. [Google Scholar] [CrossRef]
  2. Klockner, P.; Reemtsma, T.; Eisentraut, P.; Braun, U.; Ruhl, A.S.; Wagner, S. Tire and road wear particles in road environment—Quantification and assessment of particle dynamics by Zn determination after density separation. Chemosphere 2019, 222, 714–721. [Google Scholar] [CrossRef] [PubMed]
  3. Kreider, M.L.; Panko, J.M.; McAtee, B.L.; Sweet, L.I.; Finley, B.L. Physical and chemical characterization of tire-related particles: Comparison of particles generated using different methodologies. Sci. Total Environ. 2010, 408, 652–659. [Google Scholar] [CrossRef]
  4. Jung, U.Y.; Choi, S.S. A variety of particles including tire wear particles produced on the road. Elast. Compos. 2021, 56, 85–91. [Google Scholar]
  5. Sakai, H. Friction and wear of tire tread rubber. Tire Sci. Technol. 1996, 24, 252–275. [Google Scholar] [CrossRef]
  6. Kole, P.J.; Löhr, A.J.; Van Belleghem, F.G.A.J.; Ragas, A.M.J. Wear and tear of tyres: A stealthy source of microplastics in the environment. Int. J. Environ. Res. Public Health 2017, 14, 1265. [Google Scholar] [CrossRef]
  7. Järlskog, I.; Strömvall, A.-M.; Magnusson, K.; Gustafsson, M.; Polukarova, M.; Galfi, H.; Aronsson, M.; Andersson-Sköld, Y. Occurrence of tire and bitumen wear microplastics on urban streets and in sweepsand and washwater. Sci. Total Environ. 2020, 729, 138950. [Google Scholar] [CrossRef]
  8. Järlskog, I.; Strömvall, A.-M.; Magnusson, K.; Galfi, H.; Björklund, K.; Polukarova, M.; Garção, R.; Markiewicz, A.; Aronsson, M.; Gustafsson, M.; et al. Traffic-related microplastic particles, metals, and organic pollutants in an urban area under reconstruction. Sci. Total Environ. 2021, 774, 145503. [Google Scholar] [CrossRef]
  9. Degaffe, F.S.; Turner, A. Leaching of zinc from tire wear particles under simulated estuarine conditions. Chemosphere 2011, 85, 738–743. [Google Scholar] [CrossRef]
  10. Unice, K.M.; Weeber, M.P.; Abramson, M.M.; Reid, R.C.D.; Gils, J.A.G.V.; Markus, A.A.; Vethaak, A.D.; Panko, J.M. Characterizing export of land-based microplastics to the estuary—Part I: Application of integrated geospatial microplastic transport models to assess tire and road wear particles in the Seine watershed. Sci. Total Environ. 2019, 646, 1639–1649. [Google Scholar] [CrossRef]
  11. Lan, H.; Martin, C.D.; Hu, B. Effect of heterogeneity of brittle rock on micromechanical extensile behavior during compression loading. J. Geophys. Res. Solid Earth 2010, 115, B01202. [Google Scholar] [CrossRef]
  12. Sarpün, İ.H.; Kılıçkaya, M.S.; Tuncel, S. Mean grain size determination in marbles by ultrasonic velocity techniques. NDT Int. 2005, 38, 21–25. [Google Scholar] [CrossRef]
  13. Januszewicz, K.; Kazimierski, P.; Suchocki, T.; Kardas, D.; Lewandowski, W.; Klugmann-Radziemska, E.; Luczak, J. Waste rubber pyrolysis: Product yields and limonene concentration. Materials 2020, 13, 4435. [Google Scholar] [CrossRef] [PubMed]
  14. Danon, B.; van der Gryp, P.; Schwarz, C.E.; Görgens, J.F. A review of dipentene (DL-limonene) production from waste tire pyrolysis. J. Anal. Appl. Pyrolysis 2015, 112, 1–13. [Google Scholar] [CrossRef]
  15. Choi, S.-S.; Ko, J.-E. Influence of thermal aging on pyrolysis pattern of carbon black-filled NR composite. Macromol. Res. 2007, 15, 482–485. [Google Scholar] [CrossRef]
  16. Pakdel, H.; Pantea, D.M.; Roy, C. Production of dl-limonene by vacuum pyrolysis of used tires. J. Anal. Appl. Pyrolysis 2001, 57, 91–107. [Google Scholar] [CrossRef]
  17. Chae, E.; Jung, U.; Choi, S.-S. Quantification of tire tread wear particles in microparticles produced on the road using oleamide as a novel marker. Environ. Pollut. 2021, 288, 117811. [Google Scholar] [CrossRef] [PubMed]
  18. Choi, S.-S.; Yang, S.R.; Chae, E.; Son, C.E. Influence of carbon black contents and rubber compositions on formation of wear debris of rubber vulcanizates. Elast. Compos. 2020, 55, 108–113. [Google Scholar]
  19. Miyazaki, T. Rubber Composition. European Patent EP3459996, 21 April 2017. [Google Scholar]
  20. Ghoreishy, M.H.R.; Alimardani, M.; Mehrabian, R.Z.; Gangali, S.T. Modeling the hyperviscoelastic behavior of a tire tread compound reinforced by silica and carbon black. J. Appl. Polym. Sci. 2013, 128, 1725–1731. [Google Scholar]
  21. Unice, K.M.; Kreider, M.L.; Panko, J.M. Use of a deuterated internal standard with pyrolysis-GC/MS dimeric marker analysis to quantify tire tread particles in the environment. Int. J. Environ. Res. Public Health 2012, 9, 4033–4055. [Google Scholar] [CrossRef]
  22. Seidelt, S.; Müller-Hagedorn, M.; Bockhorn, H. Description of tire pyrolysis by thermal degradation behaviour of main components. J. Anal. Appl. Pyrolysis 2006, 75, 11–18. [Google Scholar] [CrossRef]
  23. Choi, S.-S. Characteristics of pyrolysis pattern of styrene-butadiene rubbers with differing microstructures. J. Anal. Appl. Pyrolysis 2002, 62, 319–330. [Google Scholar] [CrossRef]
  24. Choi, S.-S.; Han, D.-H. Pyrolysis paths of polybutadiene depending on pyrolysis temperature. Macromol. Res. 2006, 14, 354–358. [Google Scholar] [CrossRef]
Figure 1. Density ranges of various particles in the RD1 sample. The scale bar of the center image is 1400 μm, and those of the others are 551 µm.
Polymers 14 01005 g001
Figure 2. Magnified images of TRWPs selected from the road dust of 106–212 μm. (a) 1.20–1.30 g/cm3, (b) 1.30–1.40 g/cm3, (c) 1.40–1.50 g/cm3, and (d) 1.50–1.60 g/cm3. The scale bars are 171 μm.
Polymers 14 01005 g002
Figure 3. Dissolution of bitumen in APWP by chloroform.
Polymers 14 01005 g003
Figure 4. Difference in the shape changes of TRWP and APWP selected from the road dust of 212–500 µm after the chloroform treatment.
Polymers 14 01005 g004
Figure 5. Separation procedure of TRWPs from road dust by the density difference.
Polymers 14 01005 g005
Figure 6. Variations in the numbers of TRWPs in the road dust samples with the TRWP density.
Polymers 14 01005 g006
Figure 7. Variations in the TRWP contents in the road dust samples with the TRWP density.
Polymers 14 01005 g007
Figure 8. Magnified images of the TRWPs classified from the road samples. The blue scale bar is 100 µm.
Polymers 14 01005 g008
Figure 9. Magnified surface images of the TRWPs classified from the road samples. The blue scale bar is 10 µm.
Polymers 14 01005 g009
Figure 10. Py-GC chromatograms of the TRWPs classified from the road dust samples. (a) the RD2 sample (single TRWP, 1.20–1.30 g/cm3), (b) the RD3 sample (single TRWP, 1.40–1.50 g/cm3), and (c) the RD4 sample (13 TRWPs, 1.30–1.40 g/cm3).
Polymers 14 01005 g010
Table 1. Particle components of the RD1 sample (212–500 μm).
ParticleRatio (wt%)
Tire-road wear particles (TRWPs)0.5
Asphalt pavement wear particles (APWPs)7.0
Mineral particles (MPs)77.2
Glass particles (GPs)11.7
Glass beads (GBs)1.5
Road paint wear particles (RPWPs)1.1
Plant-related particles (PRPs)0.9
Plastic particles (PPs)0.1
Table 2. Aspect ratios of TRWPs separated from the RD2 sample (212–500 μm).
Density (g/cm3)TRWP No.Length (µm)Width (µm)Aspect Ratio
1.20–1.30L1906.818443.2432.046
L2819.610328.8682.492
1.40–1.50L32210.56070.73031.253
Table 3. Aspect ratios of TRWPs separated from the RD3 sample (106–212 μm).
Density (g/cm3)TRWP No.Length (µm)Width (µm)Aspect Ratio
1.20–1.30M1213.525102.6102.081
M2216.65879.1772.736
M3288.630101.2992.849
M4212.62964.3373.305
M5388.050100.5243.860
1.30–1.40M681.06949.2171.647
M797.36745.2082.154
M8207.63891.4212.271
M9354.82968.0655.213
1.40–1.50M10142.07857.0642.490
M11744.581189.5473.928
1.50–1.60M12176.20797.5061.807
M13387.485104.6743.702
1.60–1.70M1484.34169.1231.220
M15119.10868.8801.729
M16135.34876.4991.769
M17155.19186.7311.789
M18173.17186.7881.995
M19167.61969.8442.400
M20152.79748.4973.151
M21166.91943.1923.865
Table 4. Aspect ratios of TRWPs separated from the RD4 sample (63–106 μm).
Density (g/cm3)TRWP No.Length (µm)Width (µm)Aspect Ratio
1.30–1.40S175.98762.7741.210
S284.48269.2761.219
S3104.76966.0941.585
S4102.46658.3501.756
S585.68140.4132.120
S689.42341.8582.136
S7143.21764.2882.228
S8106.02242.7682.479
S9175.50067.4182.603
S10132.85547.8262.778
S11122.07942.0962.900
S12181.29751.1823.542
S13185.18844.5044.161
1.40–1.50S1468.38051.2671.334
S1551.30036.6741.399
S1674.49450.0481.488
S1770.84446.0101.540
S1879.48950.9761.559
S1971.34745.4761.569
S2070.81344.3201.598
S2174.04037.7981.959
S2296.02046.0712.084
S2387.54441.5312.108
S2475.28534.6742.171
S2595.99843.1132.227
S2688.71938.0182.334
S2769.13126.7462.585
S2892.23230.6913.005
S2987.77227.0163.249
S30160.38441.4523.869
S31244.55662.5893.907
S3275.93917.6314.307
1.50–1.60S3378.59353.7371.463
S34104.53770.3701.486
S3558.25737.3401.560
S36110.74365.7471.684
S3771.82439.6021.814
S3880.91741.0931.969
S3976.90131.8602.414
S4093.17436.1102.580
S41159.10954.8292.902
S42126.79942.8582.959
S43150.38948.7673.084
S44112.46834.4363.266
S45139.46040.9203.408
S46111.30632.5533.419
S47105.39730.0333.509
S48121.95534.5483.530
S49168.57047.3003.564
1.60–1.70S50150.119106.7911.406
S51100.28568.6191.461
S52109.56772.4831.512
S53210.149131.4251.599
S54183.867107.1281.716
S5599.90153.5801.865
S5682.63142.6931.935
S5797.15248.7201.994
S58152.05874.2272.049
S59107.01550.6442.113
S60194.69084.5652.302
S6183.90135.8662.339
S62127.19949.8382.552
S63123.67348.0752.573
S64285.70775.6583.776
S65364.60191.2683.995
Publisher’s Note: MDPI stays neutral with regard to jurisdictional claims in published maps and institutional affiliations.

