
Comprehensive Areal Geometric Quality Characterisation of Injection Moulded Thermoplastic Gears


Abstract
:
1. Introduction
- Development and evaluation of novel injection quality parameters and areal surface quality parameters.
- Investigation of the influence of injection moulding process parameters on the introduced novel quality parameters.
- Enhancement of the gear quality assessment using the developed analysis procedure.
- A method for rapid refinement of the injection moulding process parameters in order to achieve the required precision of the produced gears.
2. Methodology
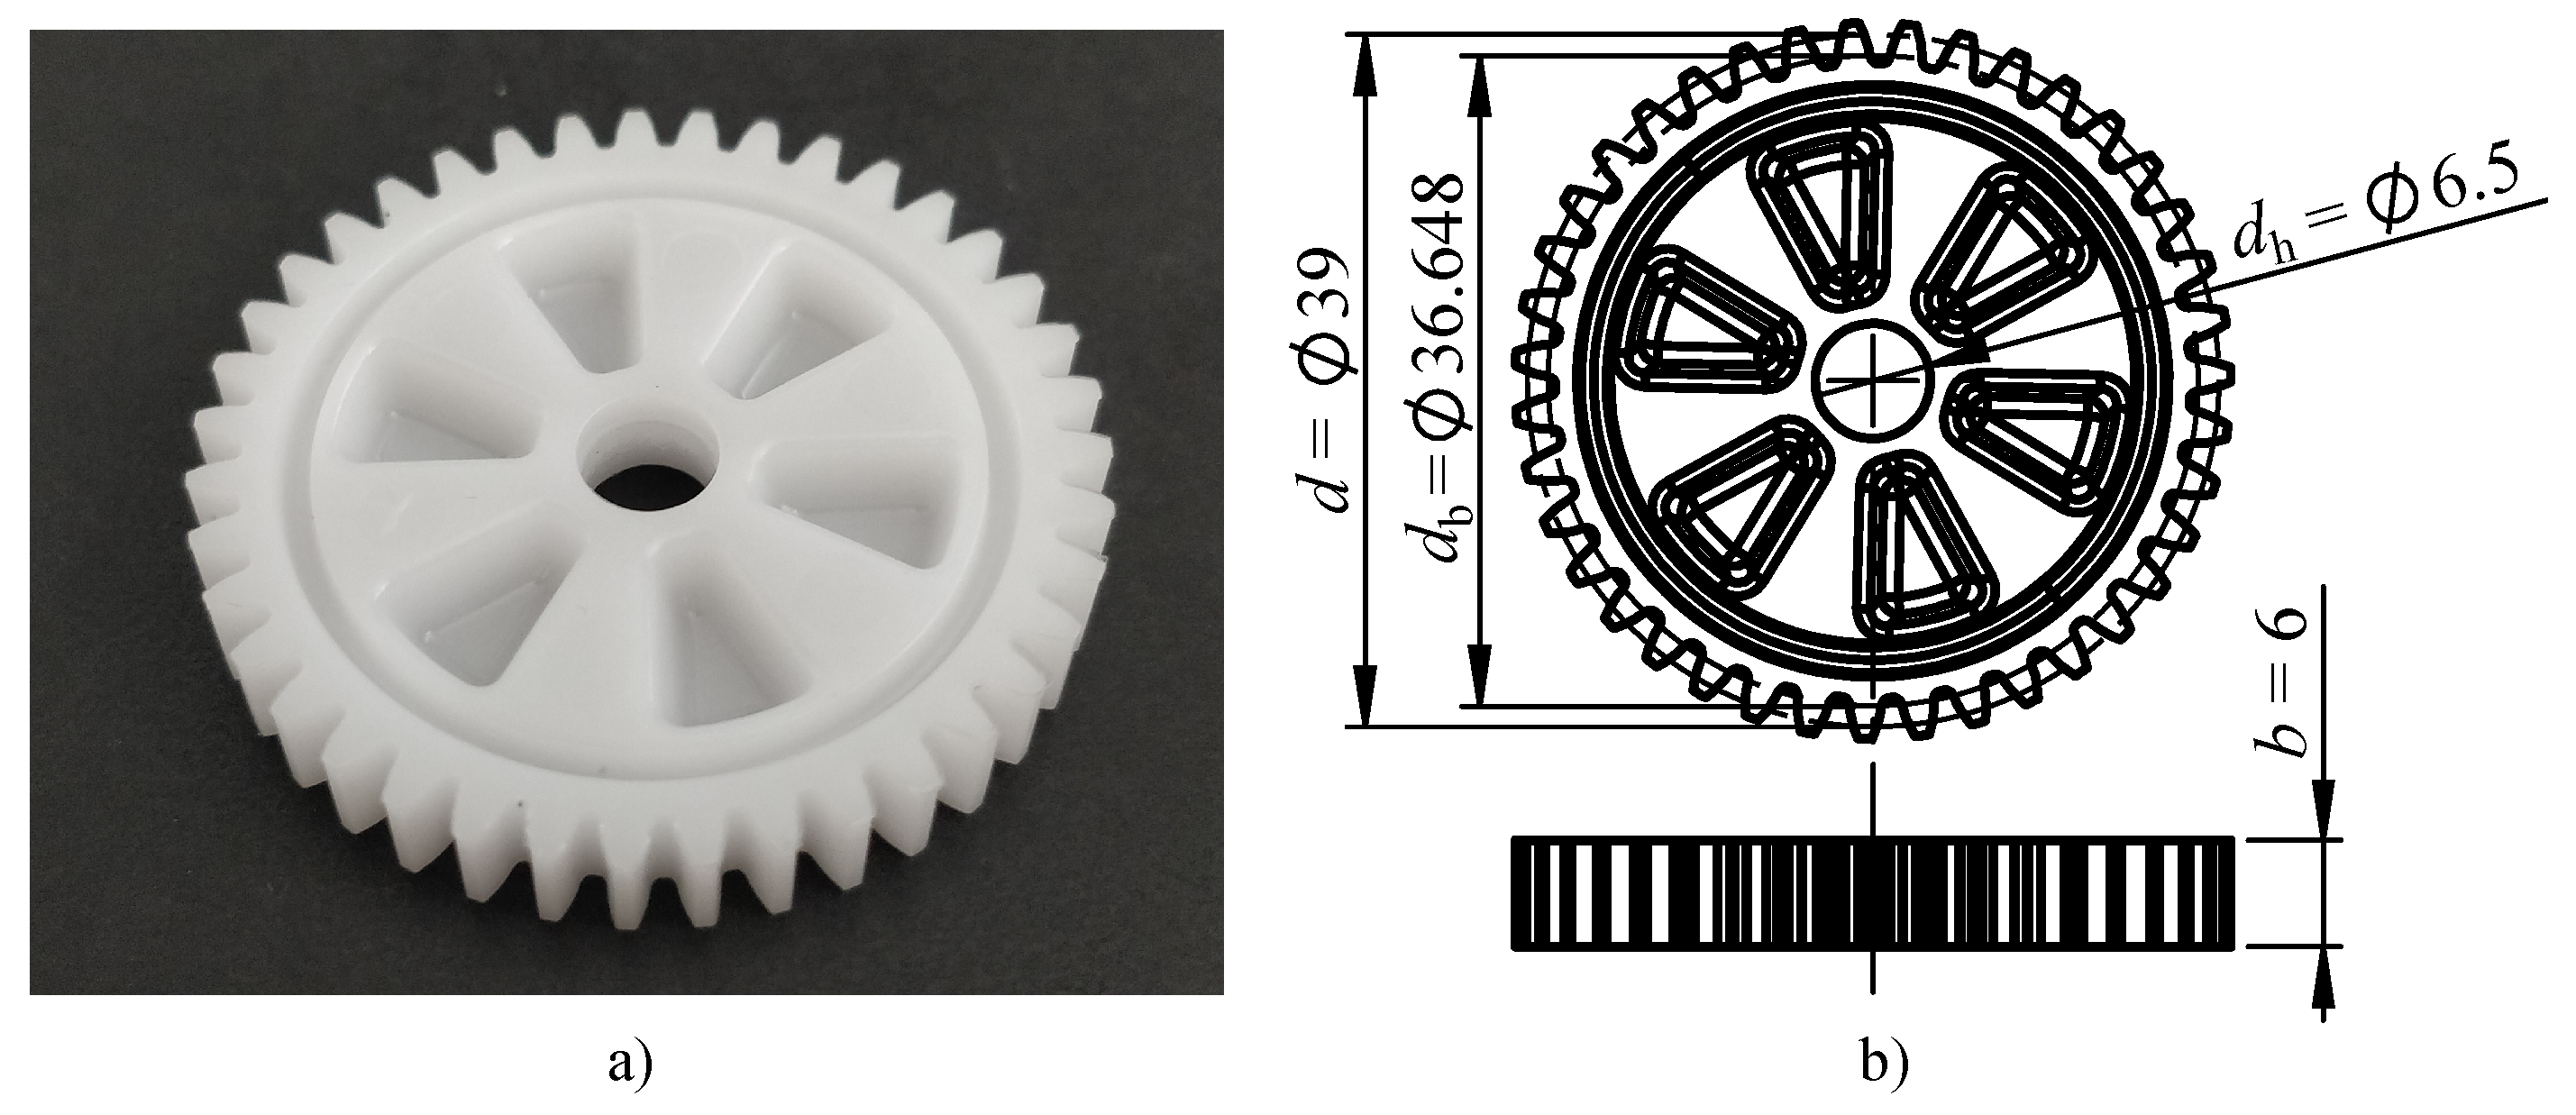
2.1. Polymer Gear Manufacturing
2.2. Optical Measurement
2.3. Data Processing
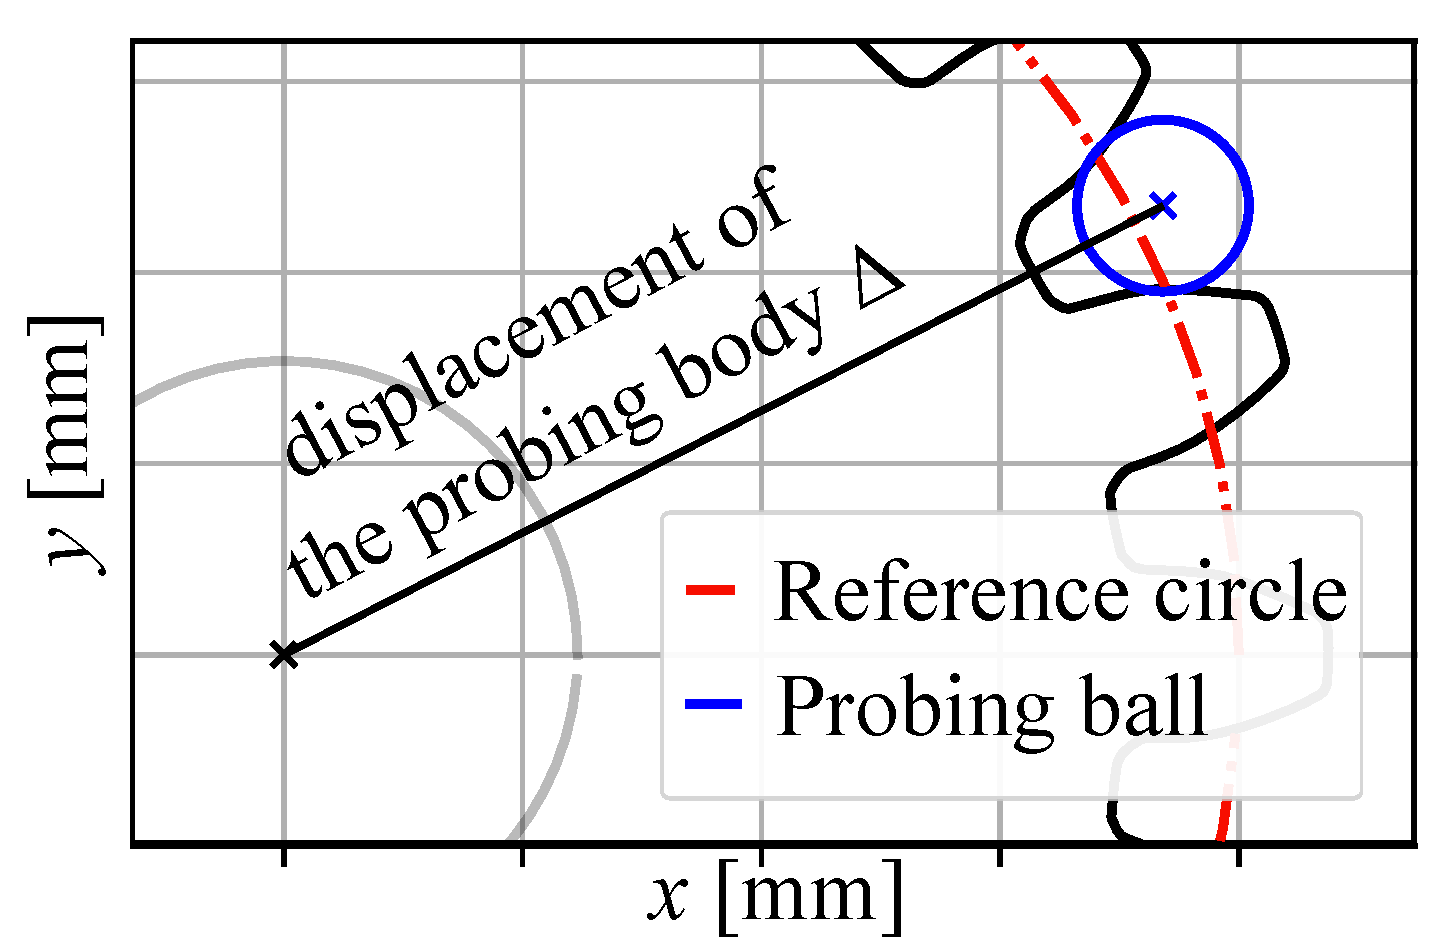
2.3.1. Moulding Runout Quality Parameter
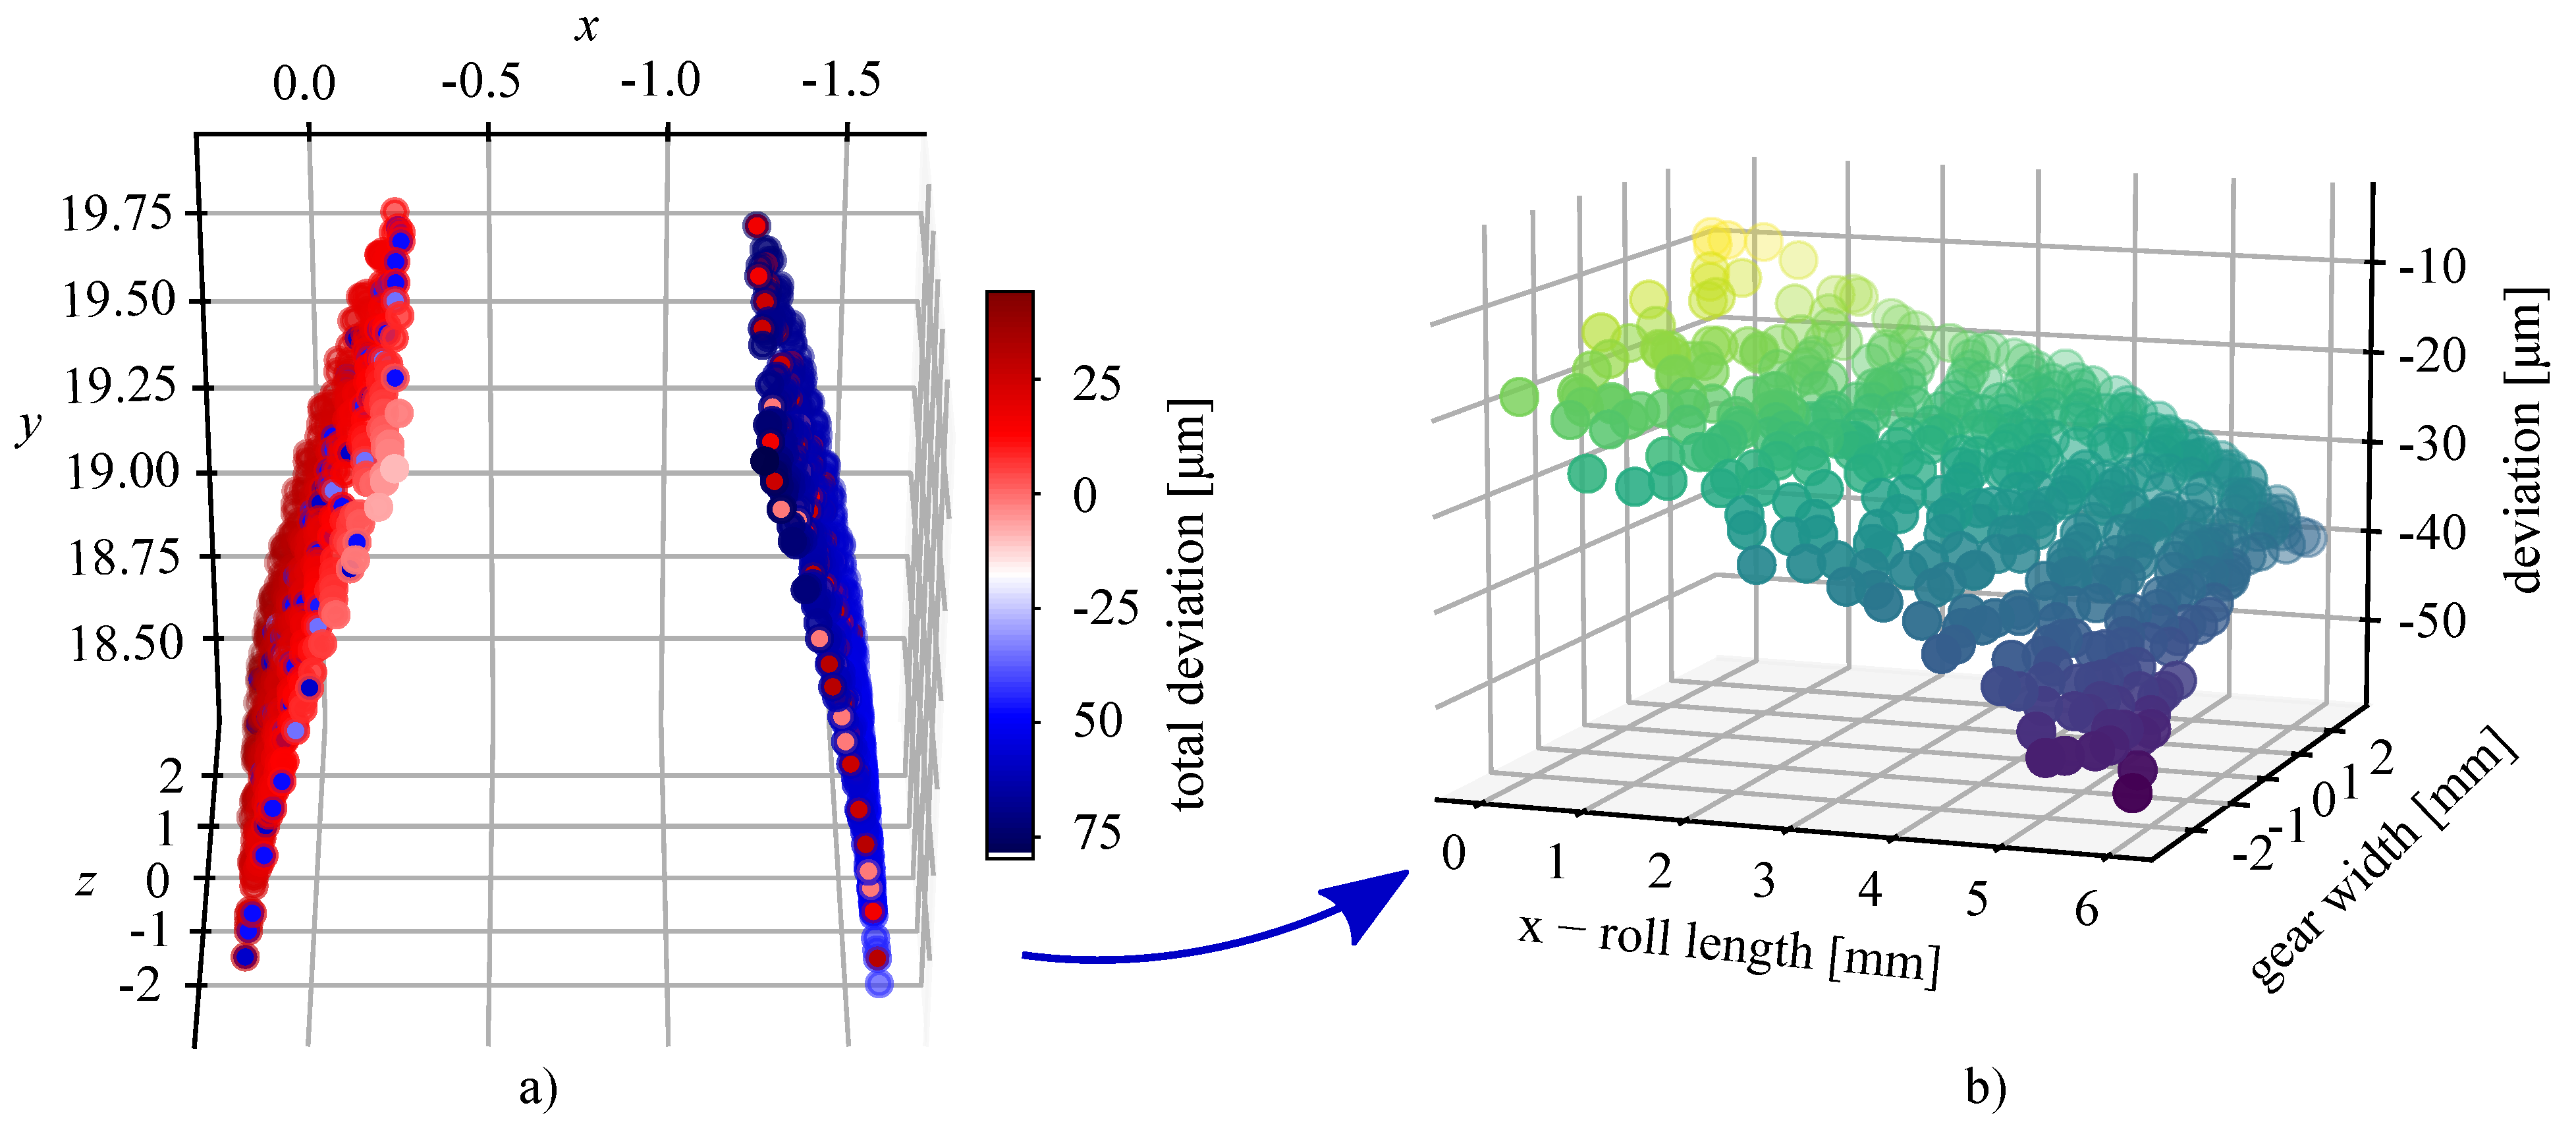
2.3.2. Novel Areal Parameters
2.4. Post-Processing
3. Results and Discussion
3.1. Parameter
3.2. Areal Parameter Results
4. Conclusions
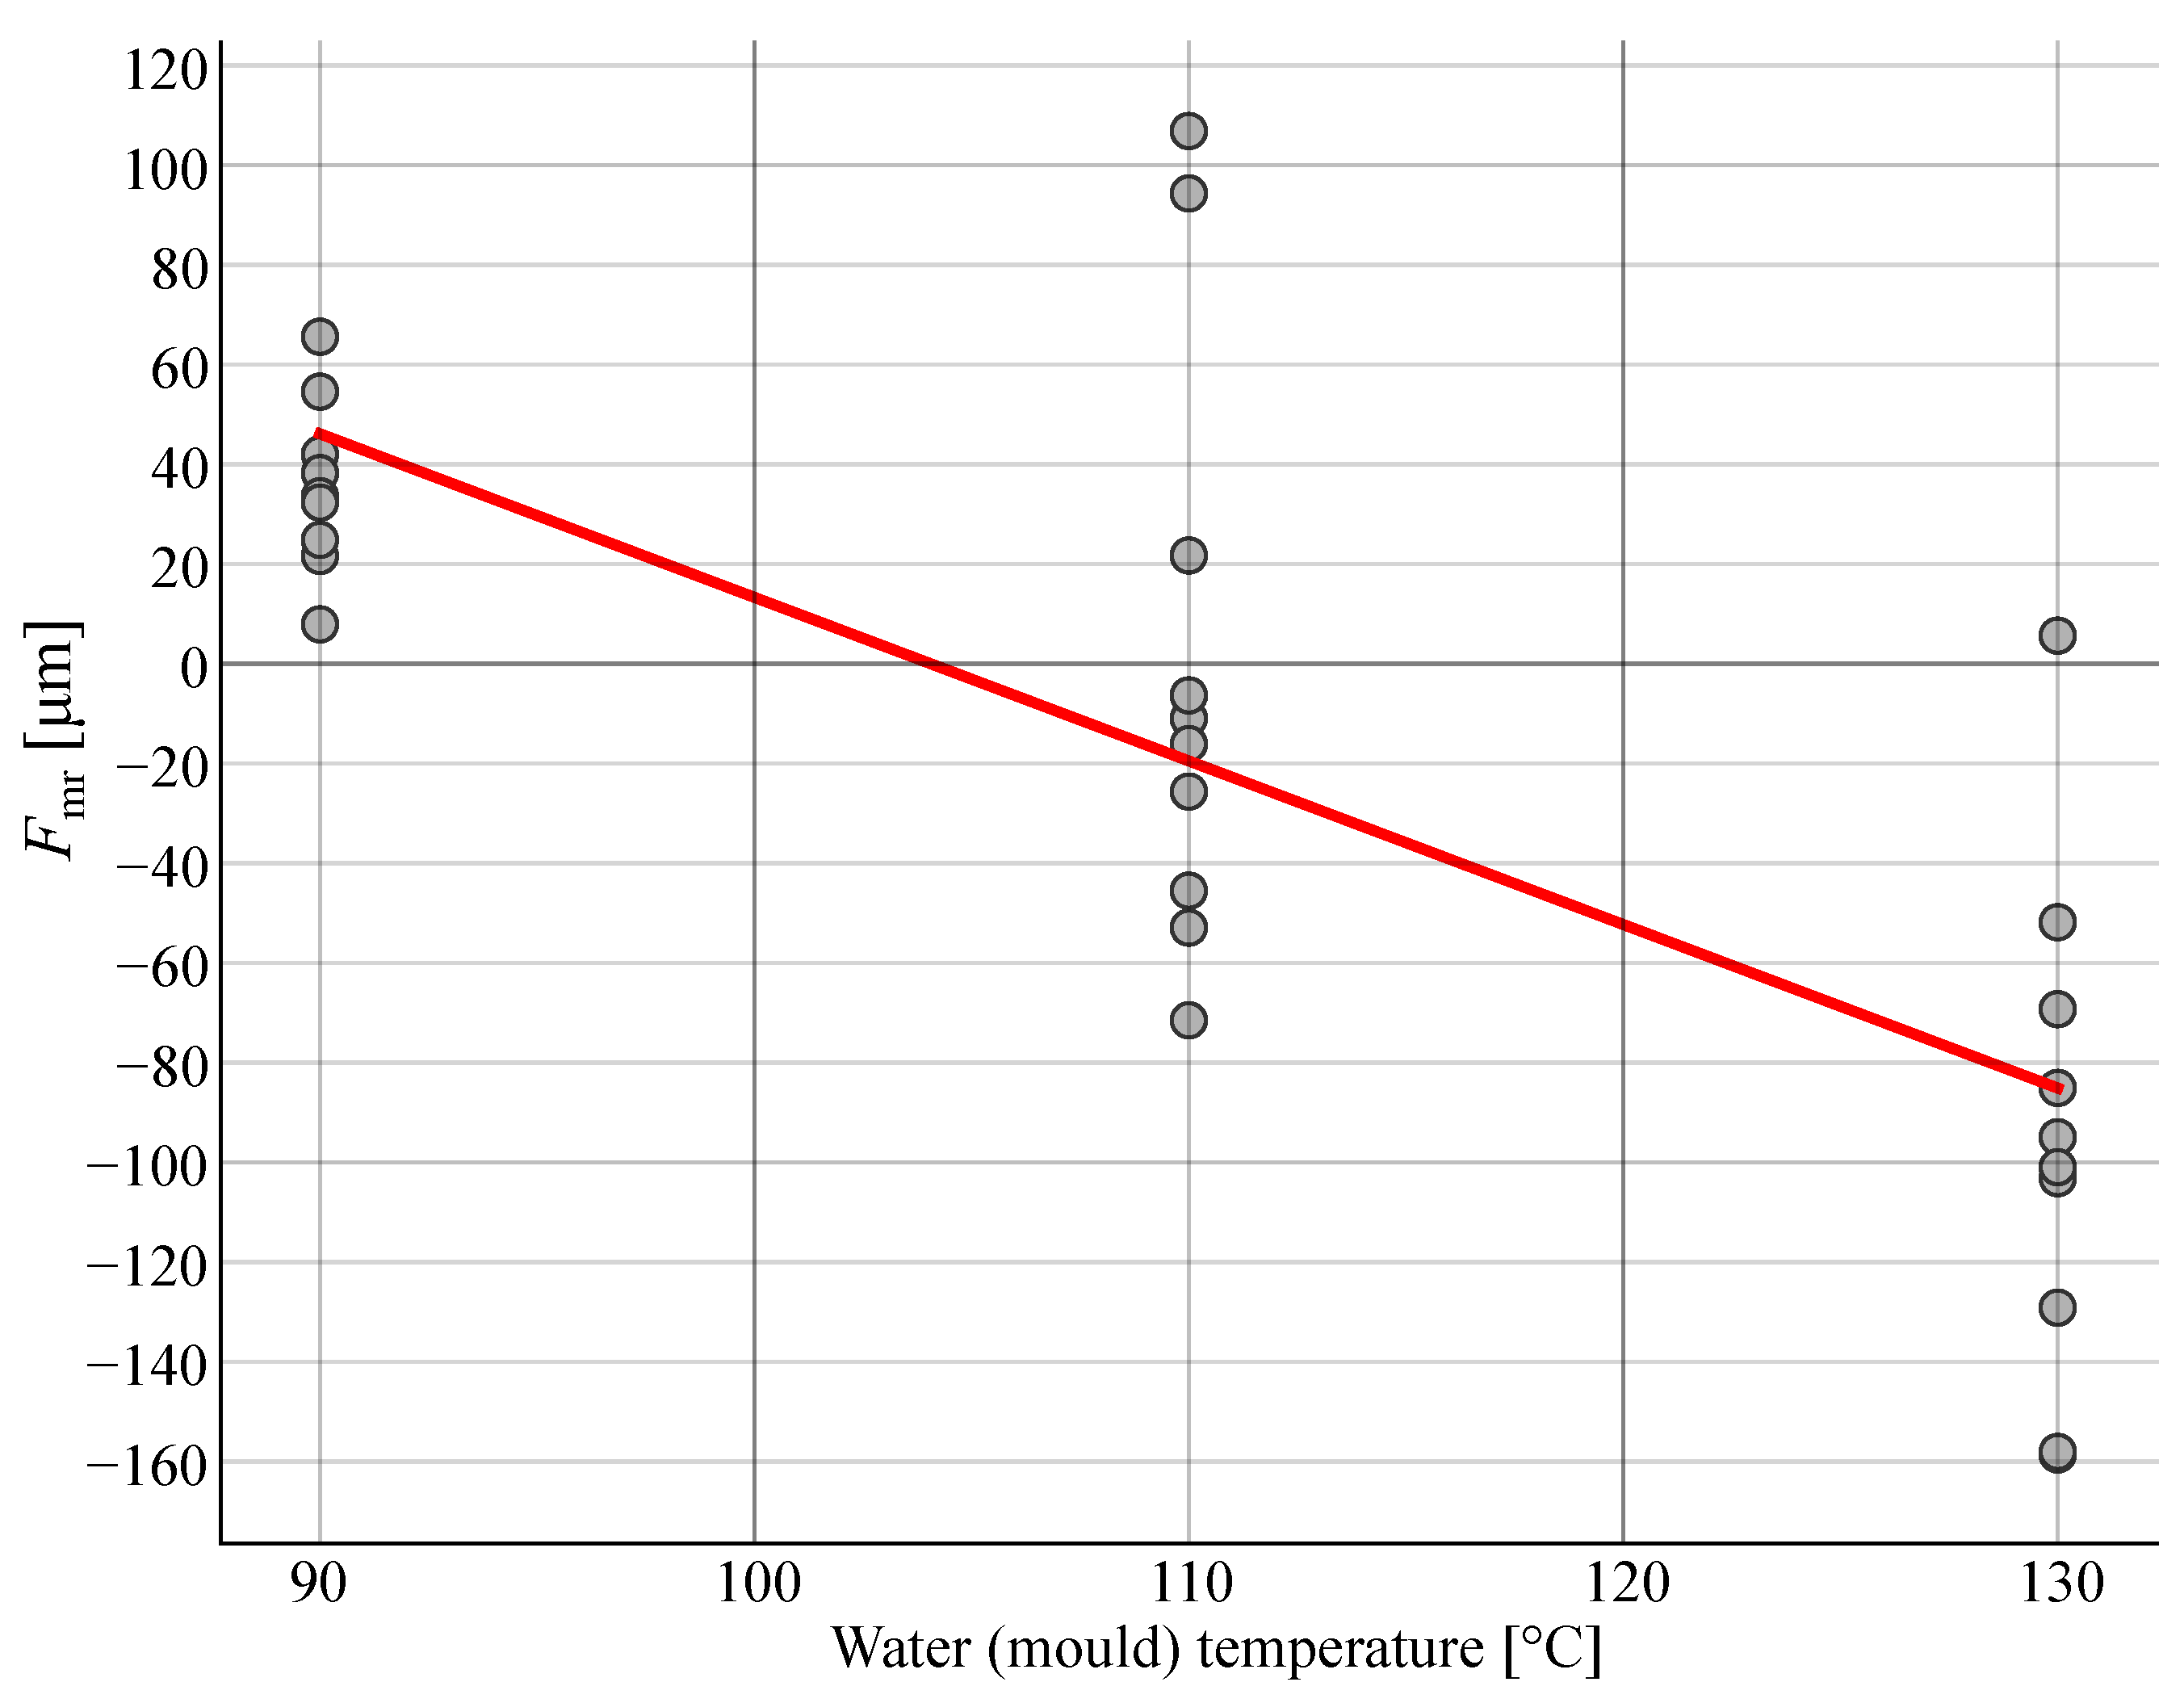
- The developed parameter proved to be effective in evaluating the shrinkage that can occur in the injection moulding process, whereas the standard quality parameters are incapable of determining it. The average value of parameter of all the gears was 29.4 m, whereas the average value of was −21.8 m. Here, the negative value of the parameter is directly associated with moulding shrinkages. The developed areal parameters , , , and proved to be advantageous in characterising the deviations on the teeth more comprehensively.
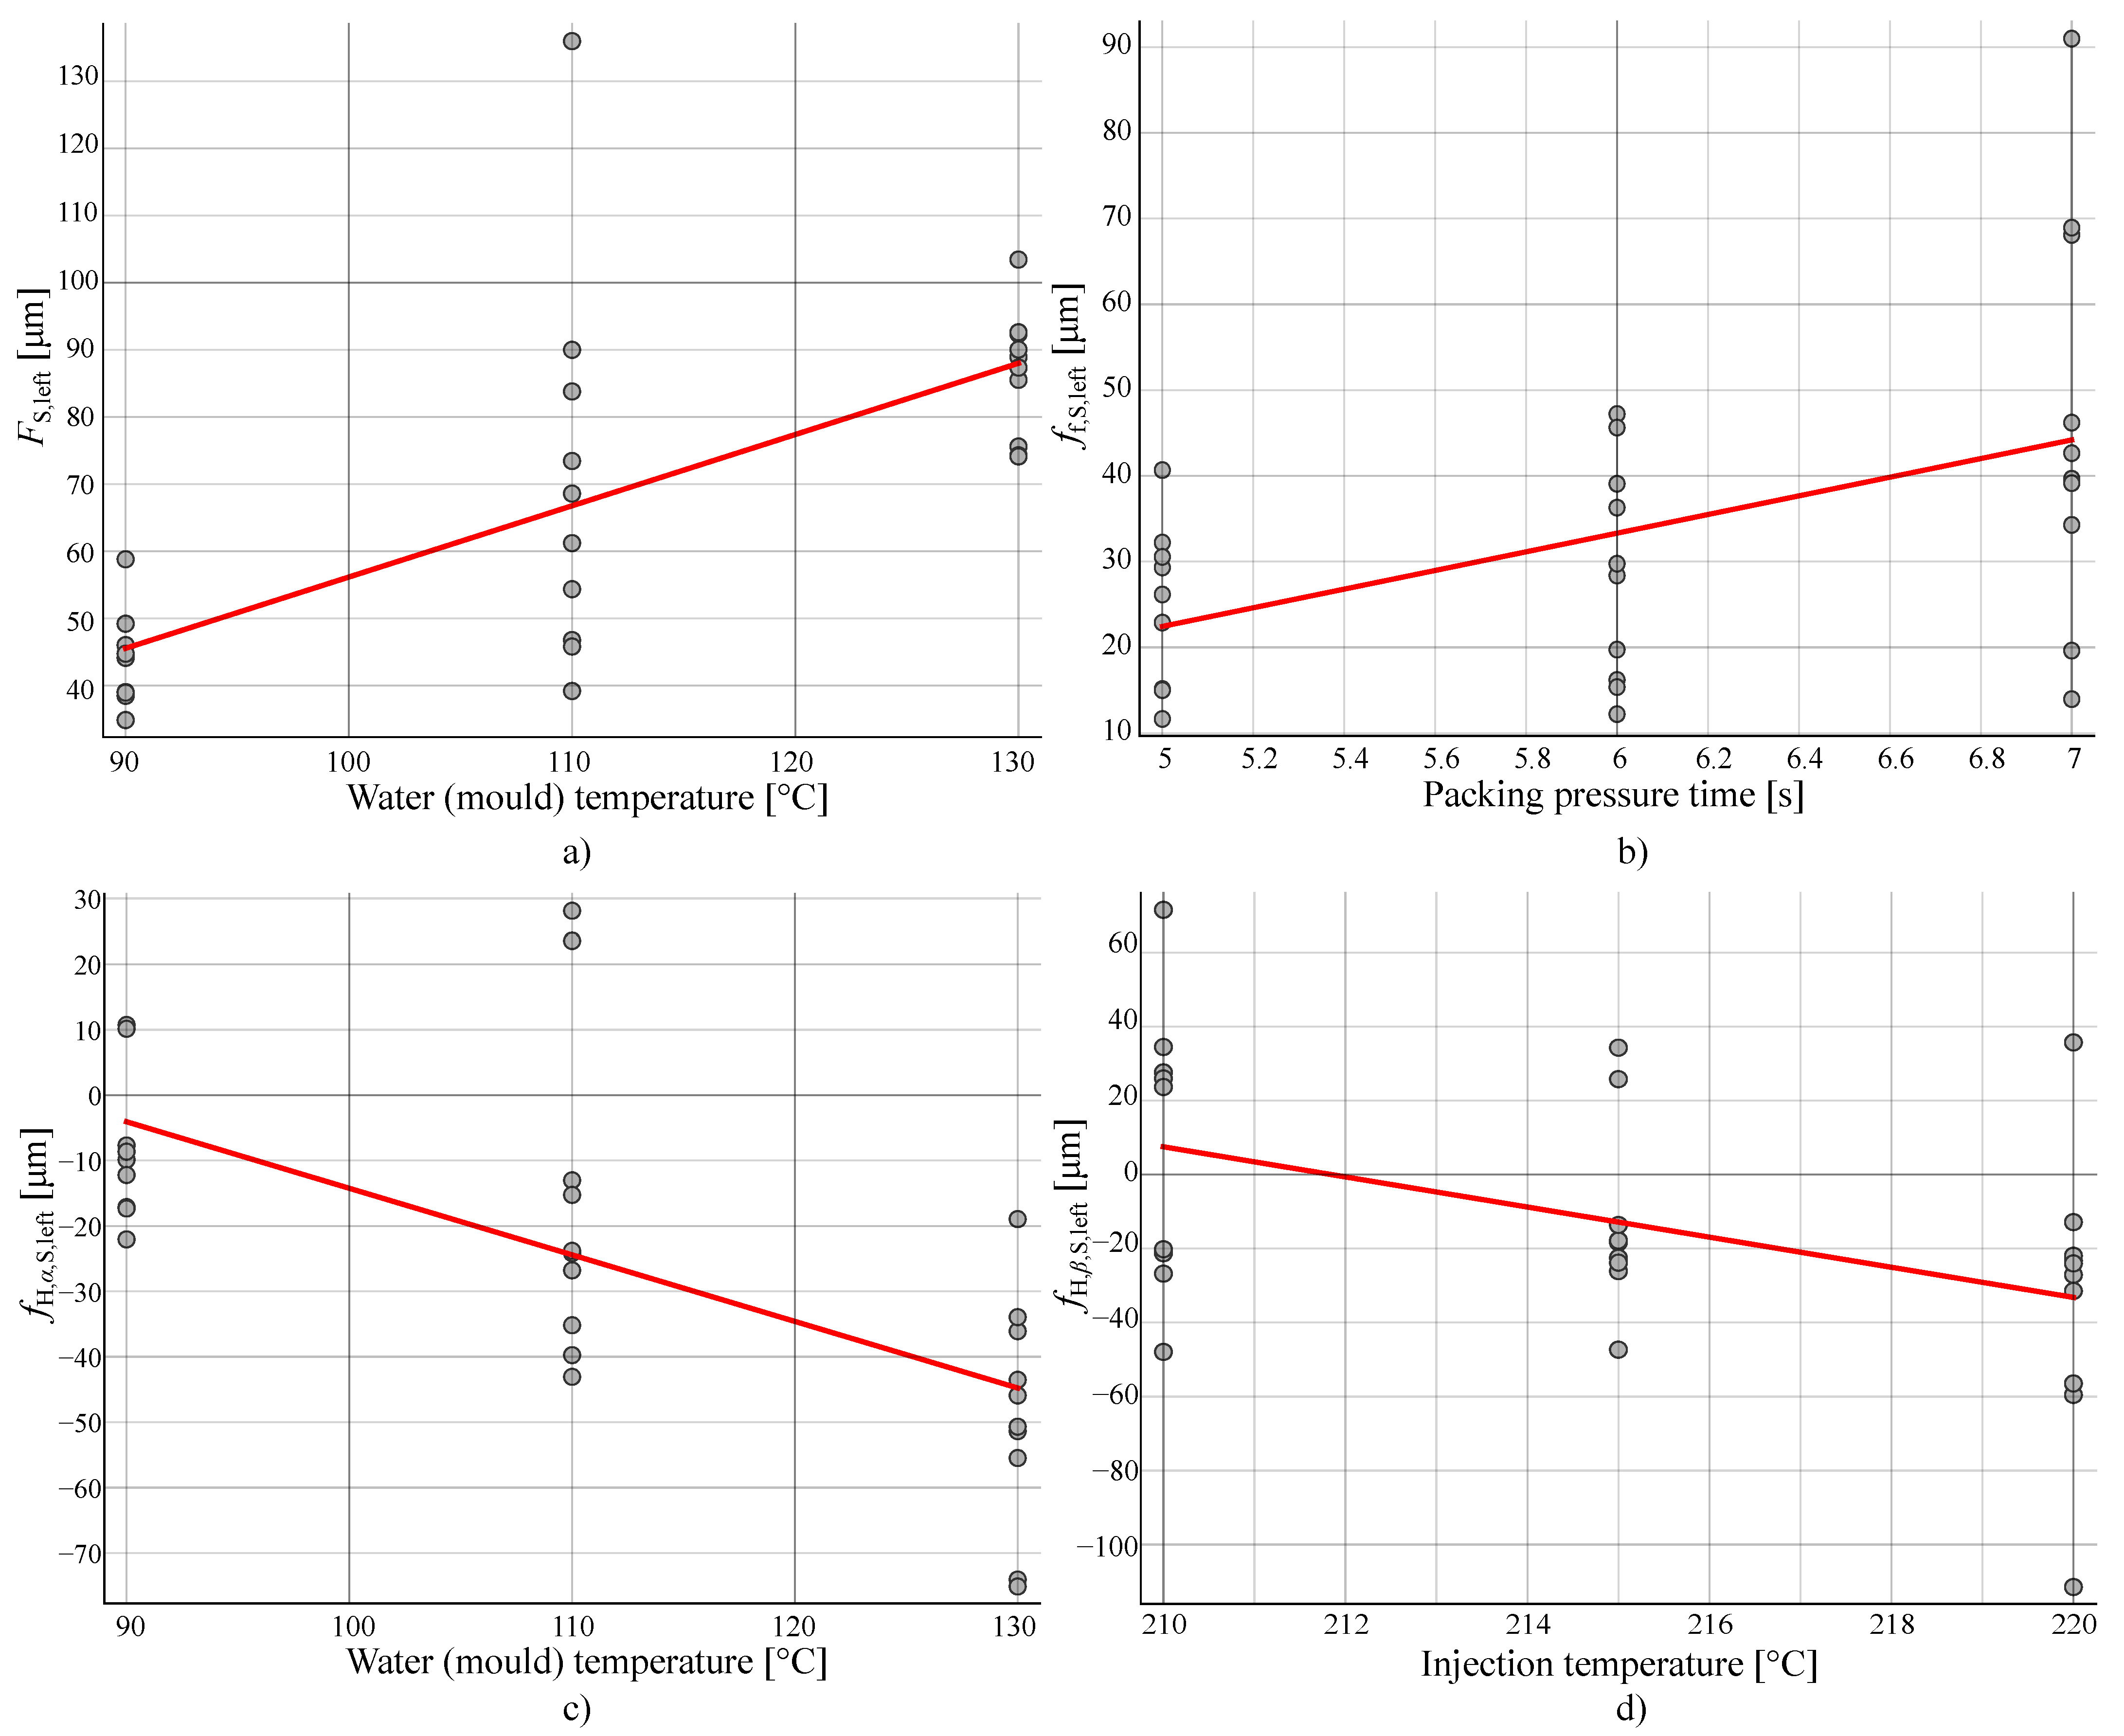
- The influence of the moulding process parameters on the new quality parameters was investigated. The rate of cooling was determined to be the most influential factor for the shrinkage of the gears, which we were able to determine through the parameter . The study also determined the linear regression coefficients for the new quality parameters, based on Spearman’s correlation coefficient. The results and coefficients are valid for the investigated range of the process parameters and the used material, outside this range further testing should be carried out to confirm their validity.
- The developed analysis will contribute to an enhanced quality assessment of gears and a refinement of the injection moulding process parameters.
- The introduced quality parameters and evaluation methods are useful for both gear manufacturers and developers in R&D departments. With this method, we can quickly characterise the geometrical quality using commercially available scanners while considering surface deviations and shrinkages typical of injection moulded gears. The method also offers many possibilities for automating measuring procedures, which could allow measurements to be performed not only on a pair of samples from a batch but on a much larger number by means of automated in-process control.
Author Contributions
Funding
Institutional Review Board Statement
Informed Consent Statement
Data Availability Statement
Acknowledgments
Conflicts of Interest
Nomenclature
| Parameter | Symbol | Unit |
| gear width | b | (mm) |
| specific heat | (J/(kgK)) | |
| reference circle diameter | d | (mm) |
| base diameter | (mm) | |
| nominal gear hole diameter | (mm) | |
| elastic modulus | E | (MPa) |
| moulding runout quality parameter | (µm) | |
| cumulative pitch deviation | (µm) | |
| runout deviation | (µm) | |
| flank surface deviation | (µm) | |
| profile deviation | (µm) | |
| lead profile deviation | (µm) | |
| surface form deviation | (µm) | |
| profile form deviation | (µm) | |
| lead profile form deviation | (µm) | |
| profile slope deviation | (µm) | |
| surface profile slope deviation | (µm) | |
| lead profile slope deviation | (µm) | |
| surface lead profile slope deviation | (µm) | |
| single pitch deviation | (µm) | |
| thermal conductivity | k | (W/(mK)) |
| normal gear module | (mm) | |
| packing pressure | (Bar) | |
| tensile yield strength | (MPa) | |
| injection T | (C) | |
| melting temperature | (C) | |
| recommended moulding temperature | (C) | |
| water (mould) T | (C) | |
| cooling time | (s) | |
| packing pressure time | (s) | |
| injection speed | (mm/s) | |
| number of teeth | Z | (/) |
| linear thermal expansion | (K) | |
| normal pressure angle | (°) | |
| displacement of the runout probing body | (mm) | |
| Poisson’s ratio | (/) | |
| density | (kg/m) |
Appendix A

| Smpl. | (m) | Q() (/) | (m) | Q() (/) | Q() (/) | Q() (/) | Q() (/) | Q() (/) | Q() (/) | Q() (/) |
|---|---|---|---|---|---|---|---|---|---|---|
| 1 | 6.4 | 6 | 35.1 | 8 | 10 | 8 | 11 | 10 | 8 | 11 |
| 2 | 6.5 | 6 | 41.8 | 9 | 9 | 8 | 10 | 11 | 9 | 11 |
| 3 | 6.1 | 6 | 33.7 | 8 | 8 | 7 | 8 | 10 | 9 | 11 |
| 4 | 6.0 | 6 | 41.7 | 9 | 12 | 10 | 13 | 10 | 9 | 11 |
| 5 | 5.2 | 6 | 34.5 | 8 | 10 | 8 | 11 | 10 | 9 | 10 |
| 6 | 15.2 | 9 | 30.9 | 8 | 9 | 10 | 10 | 10 | 9 | 10 |
| 7 | 7.4 | 7 | 35.2 | 8 | 13 | 11 | 13 | 12 | 8 | 13 |
| 8 | 5.6 | 6 | 33.8 | 8 | 11 | 6 | 13 | 11 | 8 | 12 |
| 9 | 11.7 | 8 | 49.5 | 9 | 9 | 8 | 10 | 13 | 10 | 13 |
| 10 | 6.3 | 6 | 44.0 | 9 | 8 | 7 | 8 | 10 | 8 | 11 |
| 11 | 5.2 | 6 | 16.3 | 6 | 8 | 7 | 9 | 10 | 8 | 10 |
| 12 | 9.9 | 7 | 40.7 | 8 | 9 | 9 | 10 | 11 | 10 | 12 |
| 13 | 6.3 | 6 | 39.8 | 8 | 11 | 8 | 12 | 9 | 8 | 10 |
| 14 | 6.7 | 6 | 34.3 | 8 | 10 | 8 | 12 | 10 | 9 | 11 |
| 15 | 5.2 | 6 | 21.1 | 7 | 11 | 10 | 13 | 11 | 12 | 10 |
| 16 | 8.2 | 7 | 17.5 | 6 | 12 | 7 | 13 | 9 | 8 | 9 |
| 17 | 4.0 | 5 | 18.3 | 6 | 11 | 7 | 12 | 9 | 8 | 9 |
| 18 | 10.3 | 8 | 28.3 | 7 | 12 | 9 | 13 | 12 | 9 | 13 |
| 19 | 7.0 | 6 | 27.3 | 7 | 8 | 8 | 8 | 10 | 9 | 11 |
| 20 | 5.9 | 6 | 35.0 | 8 | 9 | 10 | 10 | 10 | 8 | 11 |
| 21 | 5.3 | 6 | 23.5 | 7 | 9 | 8 | 9 | 10 | 8 | 10 |
| 22 | 2.8 | 4 | 13.3 | 5 | 9 | 8 | 10 | 9 | 9 | 9 |
| 23 | 38.4 | 11 | 87.7 | 11 | 10 | 9 | 12 | 12 | 10 | 13 |
| 24 | 7.7 | 7 | 43.6 | 9 | 10 | 9 | 12 | 13 | 10 | 13 |
| 25 | 6.4 | 6 | 41.2 | 9 | 12 | 8 | 13 | 10 | 8 | 11 |
| 26 | 5.7 | 6 | 38.6 | 8 | 13 | 7 | 13 | 11 | 8 | 12 |
| 27 | 5.8 | 6 | 39.3 | 8 | 12 | 7 | 13 | 11 | 8 | 12 |
| 28 | 6.7 | 6 | 21.7 | 7 | 10 | 8 | 11 | 10 | 9 | 11 |
| 29 | 12.3 | 8 | 27.1 | 7 | 11 | 9 | 12 | 12 | 10 | 13 |
| Smpl. | ||||||||
|---|---|---|---|---|---|---|---|---|
| 1 | 31.5 | 8.1 | 9.9 | 4.5 | −14.3 | 4.2 | −9.6 | 8.8 |
| 2 | 29.2 | 6.9 | 10.8 | 4.3 | −10.6 | 3.9 | 9.9 | 9.1 |
| 3 | 21.8 | 7.1 | 11.5 | 4.1 | −3.3 | 2.1 | 7.5 | 10.0 |
| 4 | 49.6 | 9.3 | 9.3 | 4.8 | −33.5 | 4.3 | 10.1 | 8.2 |
| 5 | 32.8 | 6.4 | 7.4 | 2.9 | −18.5 | 3.5 | −7.1 | 8.9 |
| 6 | 25.3 | 5.5 | 12.5 | 6.1 | −8.4 | 2.7 | −7.2 | 8.0 |
| 7 | 76.8 | 11.6 | 9.3 | 7.5 | −64.0 | 5.0 | −14.3 | 17.8 |
| 8 | 54.2 | 9.0 | 6.9 | 2.9 | −36.6 | 3.9 | 10.6 | 13.7 |
| 9 | 59.4 | 21.4 | 19.0 | 6.1 | −7.7 | 4.8 | 39.2 | 21.5 |
| 10 | 21.0 | 6.6 | 10.1 | 2.2 | −3.6 | 3.3 | 8.6 | 8.3 |
| 11 | 22.0 | 8.6 | 12.3 | 9.6 | 5.4 | 2.9 | −9.6 | 4.9 |
| 12 | 37.8 | 8.0 | 27.4 | 9.4 | 3.3 | 3.6 | 4.4 | 16.1 |
| 13 | 44.5 | 7.1 | 9.4 | 2.8 | −27.5 | 4.5 | −10.9 | 6.3 |
| 14 | 42.0 | 5.7 | 8.9 | 3.1 | −22.5 | 3.1 | −12.9 | 9.3 |
| 15 | 54.2 | 11.3 | 20.2 | 16.3 | −32.6 | 2.9 | −9.3 | 4.0 |
| 16 | 57.1 | 6.8 | 8.7 | 5.6 | −49.2 | 3.1 | −7.0 | 5.7 |
| 17 | 44.9 | 13.3 | 11.2 | 11.7 | −32.2 | 3.2 | −5.0 | 3.0 |
| 18 | 62.4 | 14.3 | 17.8 | 16.8 | −32.7 | 5.0 | −18.8 | 17.6 |
| 19 | 24.7 | 7.9 | 12.2 | 4.4 | −3.9 | 2.3 | −10.9 | 9.9 |
| 20 | 26.7 | 7.2 | 10.4 | 4.1 | −8.6 | 4.1 | −9.9 | 8.4 |
| 21 | 25.3 | 5.4 | 11.2 | 3.6 | −6.8 | 3.6 | −9.1 | 8.5 |
| 22 | 28.2 | 4.9 | 11.6 | 4.7 | −11.4 | 2.0 | −7.3 | 3.8 |
| 23 | 63.5 | 18.8 | 22.1 | 10.2 | 17.6 | 9.0 | −42.7 | 13.8 |
| 24 | 67.4 | 27.7 | 14.1 | 9.2 | 15.7 | 4.1 | 12.2 | 51.8 |
| 25 | 56.3 | 8.2 | 6.2 | 2.9 | −43.2 | 4.2 | −11.9 | 8.2 |
| 26 | 72.8 | 8.8 | 6.1 | 3.4 | −67.9 | 4.3 | −11.7 | 11.9 |
| 27 | 62.1 | 10.0 | 6.7 | 2.6 | −44.1 | 3.7 | 16.2 | 9.6 |
| 28 | 45.1 | 9.8 | 14.7 | 11.1 | −18.9 | 5.8 | −16.1 | 4.8 |
| 29 | 54.0 | 18.2 | 22.5 | 15.6 | −26.6 | 4.1 | −9.6 | 20.6 |
References
- Trobentar, B.; Hriberšek, M.; Kulovec, S.; Glodež, S.; Belšak, A. Noise Evaluation of S-Polymer Gears. Polymers 2022, 14, 438. [Google Scholar] [CrossRef]
- Zorko, D.; Duhovnik, J.; Tavčar, J. Tooth bending strength of gears with a progressive curved path of contact. J. Comput. Des. Eng. 2021, 8, 1037–1058. [Google Scholar] [CrossRef]
- Urbas, U.; Zorko, D.; Vukašinović, N. Machine learning based nominal root stress calculation model for gears with a progressive curved path of contact. Mech. Mach. Theory 2021, 165, 104430. [Google Scholar] [CrossRef]
- Zorko, D.; Tavčar, J.; Šturm, R.; Bergant, Z. Investigation of the durability and performance of autoclave-cured, woven carbon fiber-reinforced polymer composite gears in mesh with a steel pinion. Compos. Struct. 2021, 273, 114250. [Google Scholar] [CrossRef]
- Kuo, C.C.; Li, D.Y.; Lin, Z.C.; Kang, Z.F. Characterizations of Polymer Gears Fabricated by Differential Pressure Vacuum Casting and Fused Deposition Modeling. Polymers 2021, 13, 4126. [Google Scholar] [CrossRef] [PubMed]
- Zorko, D.; Tavčar, J.; Bizjak, M.; Šturm, R.; Bergant, Z. High cycle fatigue behaviour of autoclave-cured woven carbon fibre-reinforced polymer composite gears. Polym. Test. 2021, 102, 107339. [Google Scholar] [CrossRef]
- Hakimian, E.; Sulong, A.B. Analysis of warpage and shrinkage properties of injection-molded micro gears polymer composites using numerical simulations assisted by the Taguchi method. Mater. Des. 2012, 42, 62–71. [Google Scholar] [CrossRef]
- Mehat, N.M.; Kamaruddin, S.; Othman, A.R. Modeling and Analysis of Injection Moulding Process Parameters for Plastic Gear Industry Application. ISRN Ind. Eng. 2013, 2013, 1–10. [Google Scholar] [CrossRef] [Green Version]
- Kenda, J.; Duhovnik, J.; Tavčar, J.; Kopač, J. Abrasive flow machining applied to plastic gear matrix polishing. Int. J. Adv. Manuf. Technol. 2014, 71, 141–151. [Google Scholar] [CrossRef]
- ISO 1328-1:2013; Cylindrical Gears—ISO System of Flank Tolerance Classification—Part 1: Definitions and Allowable Values of Deviations Relevant to Flanks of Gear Teeth. International Organization for Standardization: Geneva, Switzerland, 2013.
- ISO 1328-1:1995; Cylindrical Gears—ISO System of Accuracy—Part 1: Definitions and Allowable Values of Deviations Relevant to Corresponding Flanks of Gear Teeth. International Organization for Standardization: Geneva, Switzerland, 1995.
- Gnatowski, A.; Gołębski, R.; Sikora, P. Analysis of the Impact of Changes in Thermomechanical Properties of Polymer Materials on the Machining Process of Gears. Polymers 2021, 13, 28. [Google Scholar] [CrossRef]
- Polanec, B.; Zupanič, F.; Bončina, T.; Tašner, F.; Glodež, S. Experimental Investigation of the Wear Behaviour of Coated Polymer Gears. Polymers 2021, 13, 3588. [Google Scholar] [CrossRef] [PubMed]
- Trobentar, B.; Kulovec, S.; Hlebanja, G.; Glodež, S. Experimental failure analysis of S-polymer gears. Eng. Fail. Anal. 2020, 111, 104496. [Google Scholar] [CrossRef]
- ISO/TR 10064-1:2019; Code of Inspection Practice—Part 1: Measurement of Cylindrical Gear Tooth Flanks. International Organization for Standardization: Geneva, Switzerland, 2019.
- Linke, H.; Börner, J.; Heß, R. 8—Ensuring the Accuracy of Cylindrical Gears. In Cylindrical Gears; Linke, H., Börner, J., Heß, R., Eds.; Hanser: Munich, Germany, 2016; pp. 554–589. [Google Scholar] [CrossRef]
- Goch, G. Gear Metrology. CIRP Ann. 2003, 52, 659–695. [Google Scholar] [CrossRef]
- Ni, K.; Peng, Y.; Stöbener, D.; Goch, G. Cylindrical Gear Metrology. In Metrology; Gao, W., Ed.; Springer: Singapore, 2019; pp. 1–29. [Google Scholar] [CrossRef]
- Auerswald, M.M.; Freyberg, A.v.; Fischer, A. Optical Sensor system for 3D measurements on large gears. In Proceedings of the AMA Conferences 2017, Nürnberg, Germany, 30 May–1 June 2017; pp. 227–232. [Google Scholar] [CrossRef]
- Härtig, F.; Stein, M. 3D involute gear evaluation—Part I: Workpiece coordinates. Measurement 2019, 134, 569–573. [Google Scholar] [CrossRef]
- Zelený, V.; Linkeová, I.; Sýkora, J.; Skalník, P. Mathematical approach to evaluate involute gear profile and helix deviations without using special gear software. Mech. Mach. Theory 2019, 135, 150–164. [Google Scholar] [CrossRef]
- Goch, G.; Ni, K.; Peng, Y.; Guenther, A. Future gear metrology based on areal measurements and improved holistic evaluations. CIRP Ann. 2017, 66, 469–474. [Google Scholar] [CrossRef]
- Lotze, W. Zahnradmessung mit Koordinatenmeßgeräten: Grundlagen und Algorithmen für die 3D-Auswertung nach dem Flächenmodell; W. Lotze: Dresden, Germany, 2005. [Google Scholar]
- Stöbener, D.; von Freyberg, A.; Fuhrmann, M.; Goch, G. Areal parameters for the characterisation of gear distortions. Mater. Werkst. 2012, 43, 120–124. [Google Scholar] [CrossRef]
- Guo, X.; Shi, Z.; Yu, B.; Zhao, B.; Li, K.; Sun, Y. 3D measurement of gears based on a line structured light sensor. Precis. Eng. 2020, 61, 160–169. [Google Scholar] [CrossRef]
- Urbas, U.; Zorko, D.; Černe, B.; Tavčar, J.; Vukašinović, N. A method for enhanced polymer spur gear inspection based on 3D optical metrology. Measurement 2021, 169, 108584. [Google Scholar] [CrossRef]
- Urbas, U.; Ariansyah, D.; Erkoyuncu, J.A.; Vukašinović, N. Augmented Reality Aided Inspection of Gears. Tehnički Vjesnik 2021, 28, 1032–1037. [Google Scholar] [CrossRef]
- He, X.; Wu, W. A Practical Numerical Approach to Characterizing Non-Linear Shrinkage and Optimizing Dimensional Deviation of Injection-Molded Small Module Plastic Gears. Polymers 2021, 13, 2092. [Google Scholar] [CrossRef]
- Lu, X.; Li, M.V.; Yang, H. Geometric characteristics of AlSi10Mg ultrathin walls fabricated by selective laser melting with energy density and related process parameters. Int. J. Adv. Manuf. Technol. 2021, 115, 3773–3790. [Google Scholar] [CrossRef]
- Mohajernia, B.; Mirazimzadeh, S.E.; Pasha, A.; Urbanic, R.J. Machine Learning Approaches for Predicting Geometric and Mechanical Characteristics for Single P420 Laser Beads Clad onto an AISI 1018 Substrate. Int. J. Adv. Manuf. Technol. 2022. [Google Scholar] [CrossRef]
- Chua, Z.Y.; Moon, S.K.; Jiao, L.; Ahn, I.H. Geometric influence of the laser-based powder bed fusion process in Ti6AL4V and AlSi10Mg. Int. J. Adv. Manuf. Technol. 2021, 114, 3165–3176. [Google Scholar] [CrossRef]
- Zhang, Y.; Mao, K.; Leigh, S.; Shah, A.; Chao, Z.; Ma, G. A parametric study of 3D printed polymer gears. Int. J. Adv. Manuf. Technol. 2020, 107, 4481–4492. [Google Scholar] [CrossRef]
- Wang, J.; Hopmann, C.; Kahve, C.; Hohlweck, T.; Alms, J. Measurement of specific volume of polymers under simulated injection molding processes. Mater. Des. 2020, 196, 109136. [Google Scholar] [CrossRef]
- Karbhari, V.; Slotte, S.; Steenkamer, D.; Wilkins, D. Effect of material, process, and equipment variables on the performance of resin transfer moulded parts. Compos. Manuf. 1992, 3, 143–152. [Google Scholar] [CrossRef]
- Pisula, J.; Budzik, G.; Turek, P.; Cieplak, M. An Analysis of Polymer Gear Wear in a Spur Gear Train Made Using FDM and FFF Methods Based on Tooth Surface Topography Assessment. Polymers 2021, 13, 1649. [Google Scholar] [CrossRef]
- Joint Committee for Guides in Metrology (JCGM 106:2012). Evaluation of Measurement Data—The Role of Measurement Uncertainty in Conformity Assessment; Joint Committee for Guides in Metrology: Sèvres, France, 2012. [Google Scholar]
- Wojtyła, M.; Jakubiec, W.; Płowucha, W. Comparison ISO standards 1328-1:1995 and 1328-1:2013. In Proceedings of the Sixth International Scientific Conference on Coordinate Measuring Technique CMT, Bielsko-Biała, Poland, 2–4 April 2014. [Google Scholar]
- Orange Data Mining—Data Mining. Available online: https://orange.biolab.si/ (accessed on 18 February 2020).
- Myers, J.L.; Well, A.A. Research Design and Statistical Analysis; Mahwah, N.J., Ed.; Lawrence Erlbaum Associates: Mahwah, NJ, USA, 2003. [Google Scholar]
- Kuo, C.C.; Nguyen, T.D.; Zhu, Y.J.; Lin, S.X. Rapid Development of an Injection Mold with High Cooling Performance Using Molding Simulation and Rapid Tooling Technology. Micromachines 2021, 12, 311. [Google Scholar] [CrossRef]
- Xiao, F.; Chen, L.; Wang, X. Calculation of Shrinkage Rate for Injection Molding Based on Moldflow. In Proceedings of the FISITA 2012 World Automotive Congress, Beijing, China, 17–19 May 2013; Springer: Berlin/Heidelberg, Germany, 2013; pp. 1501–1510. [Google Scholar]


| Parameter (Standard) | Symbol (Unit) | Delrin 100 NC010 |
|---|---|---|
| Density (ISO 1183) | (kg/m) | 1420 |
| Elastic modulus (ISO 527) | E (MPa) | 2900 |
| Tensile yield strength (ISO 527) | (MPa) | ≈71 |
| Poisson’s ratio (ISO 527) | (/) | 0.37 |
| Specific heat | (J/(kgK)) | ≈3000 |
| Thermal conductivity | k (W/(mK)) | ≈0.36 |
| Melting temperature (ISO 11357) | (C) | 178 |
| Lin. therm. expansion (ISO 11359) | (K) | 110 × 10 |
| Recommended moulding temperature | (C) | 215 ± 5 |
| Gear Characteristic | Symbol (Unit) | Value |
|---|---|---|
| Number of teeth | Z (/) | 39 |
| Reference circle diameter | d (mm) | 39 |
| Gear width | b (mm) | 6 |
| Nominal gear hole diameter | (mm) | 6.5 |
| Normal gear module | (mm) | 1 |
| Base diameter | (mm) | 36.648 |
| Normal pressure angle | (°) | 20 |
| Type of profile | / | Involute; ISO 53.2:1997 |
| Sample | (C) | (C) | (mm/s) | (Bar) | (s) | (s) |
|---|---|---|---|---|---|---|
| 1 | 210 | 90 | 10 | 800 | 5 | 30 |
| 2 | 210 | 90 | 10 | 800 | 6 | 40 |
| 3 | 210 | 90 | 10 | 800 | 7 | 50 |
| 4 | 210 | 110 | 20 | 1000 | 5 | 30 |
| 5 | 210 | 110 | 20 | 1000 | 6 | 40 |
| 6 | 210 | 110 | 20 | 1000 | 7 | 50 |
| 7 | 210 | 130 | 40 | 1200 | 5 | 30 |
| 8 | 210 | 130 | 40 | 1200 | 6 | 40 |
| 9 | 210 | 130 | 40 | 1200 | 7 | 50 |
| 10 | 215 | 90 | 20 | 1200 | 5 | 40 |
| 11 | 215 | 90 | 20 | 1200 | 6 | 50 |
| 12 | 215 | 90 | 20 | 1200 | 7 | 30 |
| 13 | 215 | 110 | 40 | 800 | 5 | 40 |
| 14 | 215 | 110 | 40 | 800 | 6 | 50 |
| 15 | 215 | 110 | 40 | 800 | 7 | 30 |
| 16 | 215 | 130 | 10 | 1000 | 5 | 40 |
| 17 | 215 | 130 | 10 | 1000 | 6 | 50 |
| 18 | 215 | 130 | 10 | 1000 | 7 | 30 |
| 19 | 220 | 90 | 40 | 1000 | 5 | 50 |
| 20 | 220 | 90 | 40 | 1000 | 6 | 30 |
| 21 | 220 | 90 | 40 | 1000 | 7 | 40 |
| 22 | 220 | 110 | 10 | 1200 | 5 | 50 |
| 23 | 220 | 110 | 10 | 1200 | 6 | 30 |
| 24 | 220 | 110 | 10 | 1200 | 7 | 40 |
| 25 | 220 | 130 | 20 | 800 | 5 | 50 |
| 26 | 220 | 130 | 20 | 800 | 6 | 30 |
| 27 | 220 | 130 | 20 | 800 | 7 | 40 |
| 28 | 215 | 110 | 20 | 1000 | 6 | 40 |
| 29 | 220 | 130 | 40 | 1200 | 7 | 50 |
| Smpl. | (m) | (m) | Q() (/) | Q() (/) | (m) | Q() (/) | (m) | Q() (/) | (m) | Q() (/) | (m) | Q() (/) |
|---|---|---|---|---|---|---|---|---|---|---|---|---|
| 1 | 38.0 | 7.9 | 9 | 4 | 49.2 | 12 | 29.3 | 11 | −22.1 | 11 | −26.8 | 11 |
| 2 | 37.9 | 21.6 | 9 | 7 | 46.0 | 12 | 28.4 | 11 | −17.1 | 10 | 27.6 | 11 |
| 3 | 27.0 | 42.0 | 8 | 9 | 44.1 | 12 | 34.3 | 12 | −7.7 | 8 | 26.0 | 10 |
| 4 | 34.1 | −71.5 | 9 | 11 | 68.6 | 13 | 26.2 | 11 | −43.1 | 13 | 23.7 | 10 |
| 5 | 35.1 | −11.0 | 9 | 5 | 46.8 | 12 | 16.2 | 10 | −24.2 | 11 | −21.3 | 10 |
| 6 | 32.7 | 21.7 | 9 | 7 | 39.2 | 11 | 39.7 | 12 | −13.0 | 10 | −20.2 | 10 |
| 7 | 34.6 | −158.6 | 9 | 13 | 103.4 | 13 | 40.7 | 12 | −74.1 | 13 | −47.9 | 12 |
| 8 | 26.8 | −95.0 | 8 | 12 | 75.6 | 13 | 15.4 | 9 | −43.5 | 13 | 34.5 | 11 |
| 9 | 35.0 | 5.6 | 9 | 4 | 92.4 | 13 | 42.6 | 12 | −19.0 | 10 | 71.5 | 13 |
| 10 | 33.7 | 38.2 | 9 | 9 | 34.8 | 11 | 15.1 | 9 | −9.9 | 9 | 25.8 | 10 |
| 11 | 9.2 | 65.6 | 5 | 11 | 44.7 | 12 | 39.1 | 12 | 10.7 | 9 | −18.3 | 10 |
| 12 | 18.6 | 54.6 | 7 | 10 | 58.8 | 13 | 46.2 | 13 | 10.1 | 9 | 34.3 | 11 |
| 13 | 40.1 | −52.9 | 9 | 10 | 61.2 | 13 | 15.0 | 9 | −35.2 | 12 | −22.5 | 10 |
| 14 | 31.5 | −25.6 | 8 | 8 | 54.3 | 12 | 19.7 | 10 | −26.8 | 12 | −26.1 | 11 |
| 15 | 22.4 | −45.5 | 7 | 9 | 83.8 | 13 | 68.1 | 13 | −39.8 | 13 | −17.8 | 9 |
| 16 | 33.7 | −129.1 | 9 | 12 | 74.3 | 13 | 22.9 | 11 | −55.5 | 13 | −17.8 | 9 |
| 17 | 18.5 | −85.1 | 7 | 11 | 85.5 | 13 | 47.2 | 13 | −36.1 | 12 | −13.6 | 9 |
| 18 | 27.8 | −69.3 | 8 | 11 | 92.6 | 13 | 91.0 | 13 | −45.9 | 13 | −47.3 | 12 |
| 19 | 31.3 | 33.6 | 8 | 9 | 39.0 | 11 | 32.2 | 12 | −8.6 | 8 | −27.1 | 11 |
| 20 | 30.9 | 24.9 | 8 | 8 | 38.5 | 11 | 29.7 | 11 | −17.3 | 10 | −23.3 | 10 |
| 21 | 33.3 | 32.3 | 9 | 9 | 38.9 | 11 | 19.6 | 10 | −12.2 | 9 | −21.9 | 10 |
| 22 | 17.3 | −6.3 | 7 | 4 | 45.8 | 12 | 30.5 | 11 | −15.3 | 10 | −12.8 | 8 |
| 23 | 27.4 | 106.9 | 8 | 12 | 90.0 | 13 | 36.3 | 12 | 28.1 | 12 | −59.6 | 13 |
| 24 | 33.5 | 94.3 | 9 | 12 | 136.0 | 13 | 39.1 | 12 | 23.6 | 11 | −111.5 | 13 |
| 25 | 32.7 | −103.2 | 9 | 12 | 74.1 | 13 | 11.6 | 9 | −51.4 | 13 | −24.0 | 10 |
| 26 | 35.5 | −158.1 | 9 | 13 | 88.9 | 13 | 12.2 | 9 | −75.1 | 13 | −31.5 | 11 |
| 27 | 35.5 | −101.0 | 9 | 12 | 87.3 | 13 | 14.0 | 9 | −50.7 | 13 | 35.7 | 11 |
| 28 | 21.7 | −16.1 | 7 | 7 | 73.4 | 13 | 45.6 | 13 | −23.8 | 11 | −23.8 | 10 |
| 29 | 16.2 | −51.8 | 7 | 10 | 90.0 | 13 | 68.9 | 13 | −33.9 | 12 | −56.5 | 13 |
| Process Parameter | Symbol | Spearman Correlation Coefficient (/) |
|---|---|---|
| Water (mould) T | (C) | −0.791 |
| Packing pressure | (Bar) | +0.317 |
| Packing pressure time | (s) | +0.270 |
| Injection speed | (mm/s) | −0.167 |
| Cooling time | (s) | +0.113 |
| Injection T | (C) | +0.087 |
| Spearman Correlation for Areal Parameters | ||||
|---|---|---|---|---|
| Process Parameter | ||||
| Water (mould) T | +0.789 | +0.030 | −0.756 | −0.104 |
| Cooling time | −0.238 | +0.002 | +0.219 | +0.185 |
| Packing pressure time | +0.230 | +0.455 | +0.229 | +0.123 |
| Packing pressure | +0.162 | +0.395 | +0.373 | −0.019 |
| Injection speed | −0.074 | −0.088 | −0.183 | −0.013 |
| Injection T | +0.066 | −0.116 | +0.098 | −0.414 |
| Regression Coefficients | ||||||
|---|---|---|---|---|---|---|
| Areal Parameter | A (µm/C) | B (µm/C) | C (s/103) | D (µm/Bar) | E (µm/s) | F (µm/s) |
| −0.315 | 1.032 | −0.205 | 0.024 | 6.276 | −0.885 | |
| −0.264 | 0.131 | −0.108 | 0.027 | 10.800 | −0.329 | |
| −0.117 | −1.093 | −0.462 | 0.062 | 7.956 | 0.550 | |
| −0.249 | −0.117 | 0.270 | −0.010 | 4.300 | 0.740 | |
Publisher’s Note: MDPI stays neutral with regard to jurisdictional claims in published maps and institutional affiliations. |
© 2022 by the authors. Licensee MDPI, Basel, Switzerland. This article is an open access article distributed under the terms and conditions of the Creative Commons Attribution (CC BY) license (https://creativecommons.org/licenses/by/4.0/).
Share and Cite
Urbas, U.; Zorko, D.; Vukašinović, N.; Černe, B. Comprehensive Areal Geometric Quality Characterisation of Injection Moulded Thermoplastic Gears. Polymers 2022, 14, 705. https://doi.org/10.3390/polym14040705
Urbas U, Zorko D, Vukašinović N, Černe B. Comprehensive Areal Geometric Quality Characterisation of Injection Moulded Thermoplastic Gears. Polymers. 2022; 14(4):705. https://doi.org/10.3390/polym14040705
Chicago/Turabian StyleUrbas, Uroš, Damijan Zorko, Nikola Vukašinović, and Borut Černe. 2022. "Comprehensive Areal Geometric Quality Characterisation of Injection Moulded Thermoplastic Gears" Polymers 14, no. 4: 705. https://doi.org/10.3390/polym14040705
APA StyleUrbas, U., Zorko, D., Vukašinović, N., & Černe, B. (2022). Comprehensive Areal Geometric Quality Characterisation of Injection Moulded Thermoplastic Gears. Polymers, 14(4), 705. https://doi.org/10.3390/polym14040705