
Rheology of Poly(glycidyl methacrylate) Macromolecular Nano Assemblies


Abstract
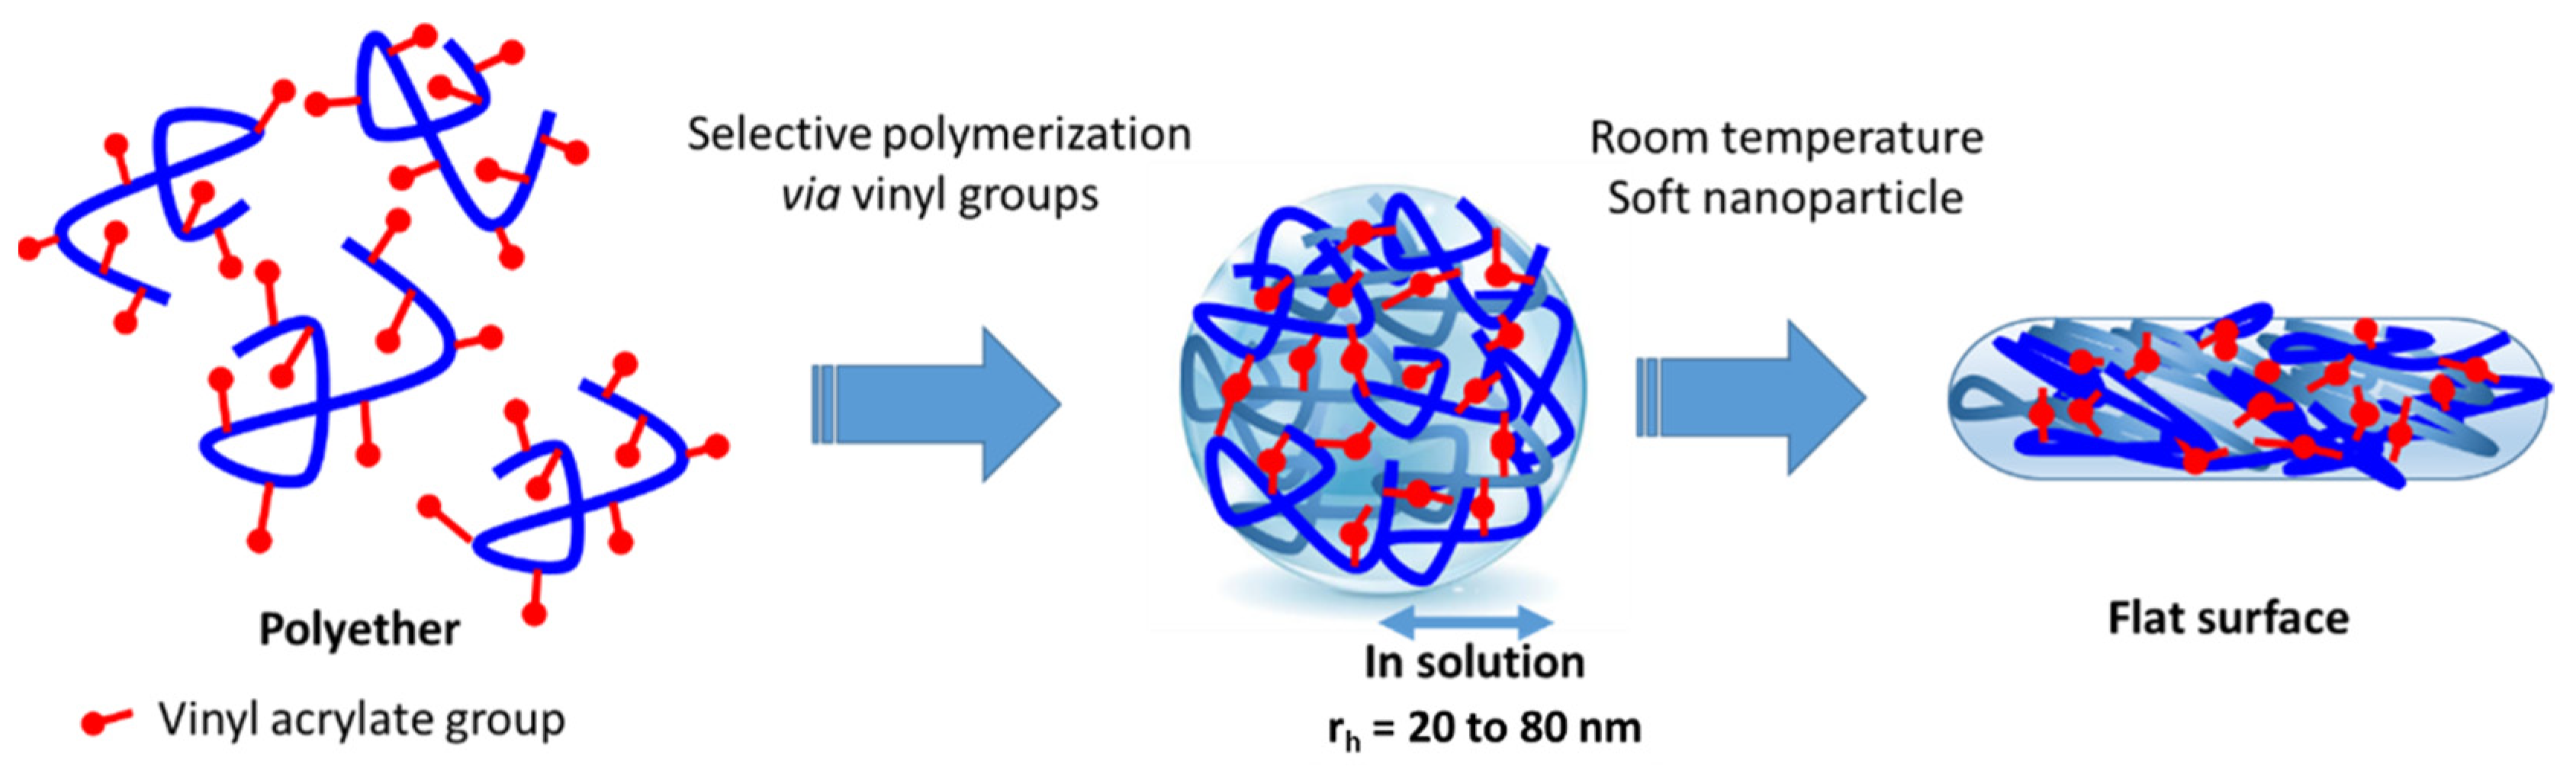
:1. Introduction
2. Materials and Methods
2.1. Materials
2.2. Synthesis
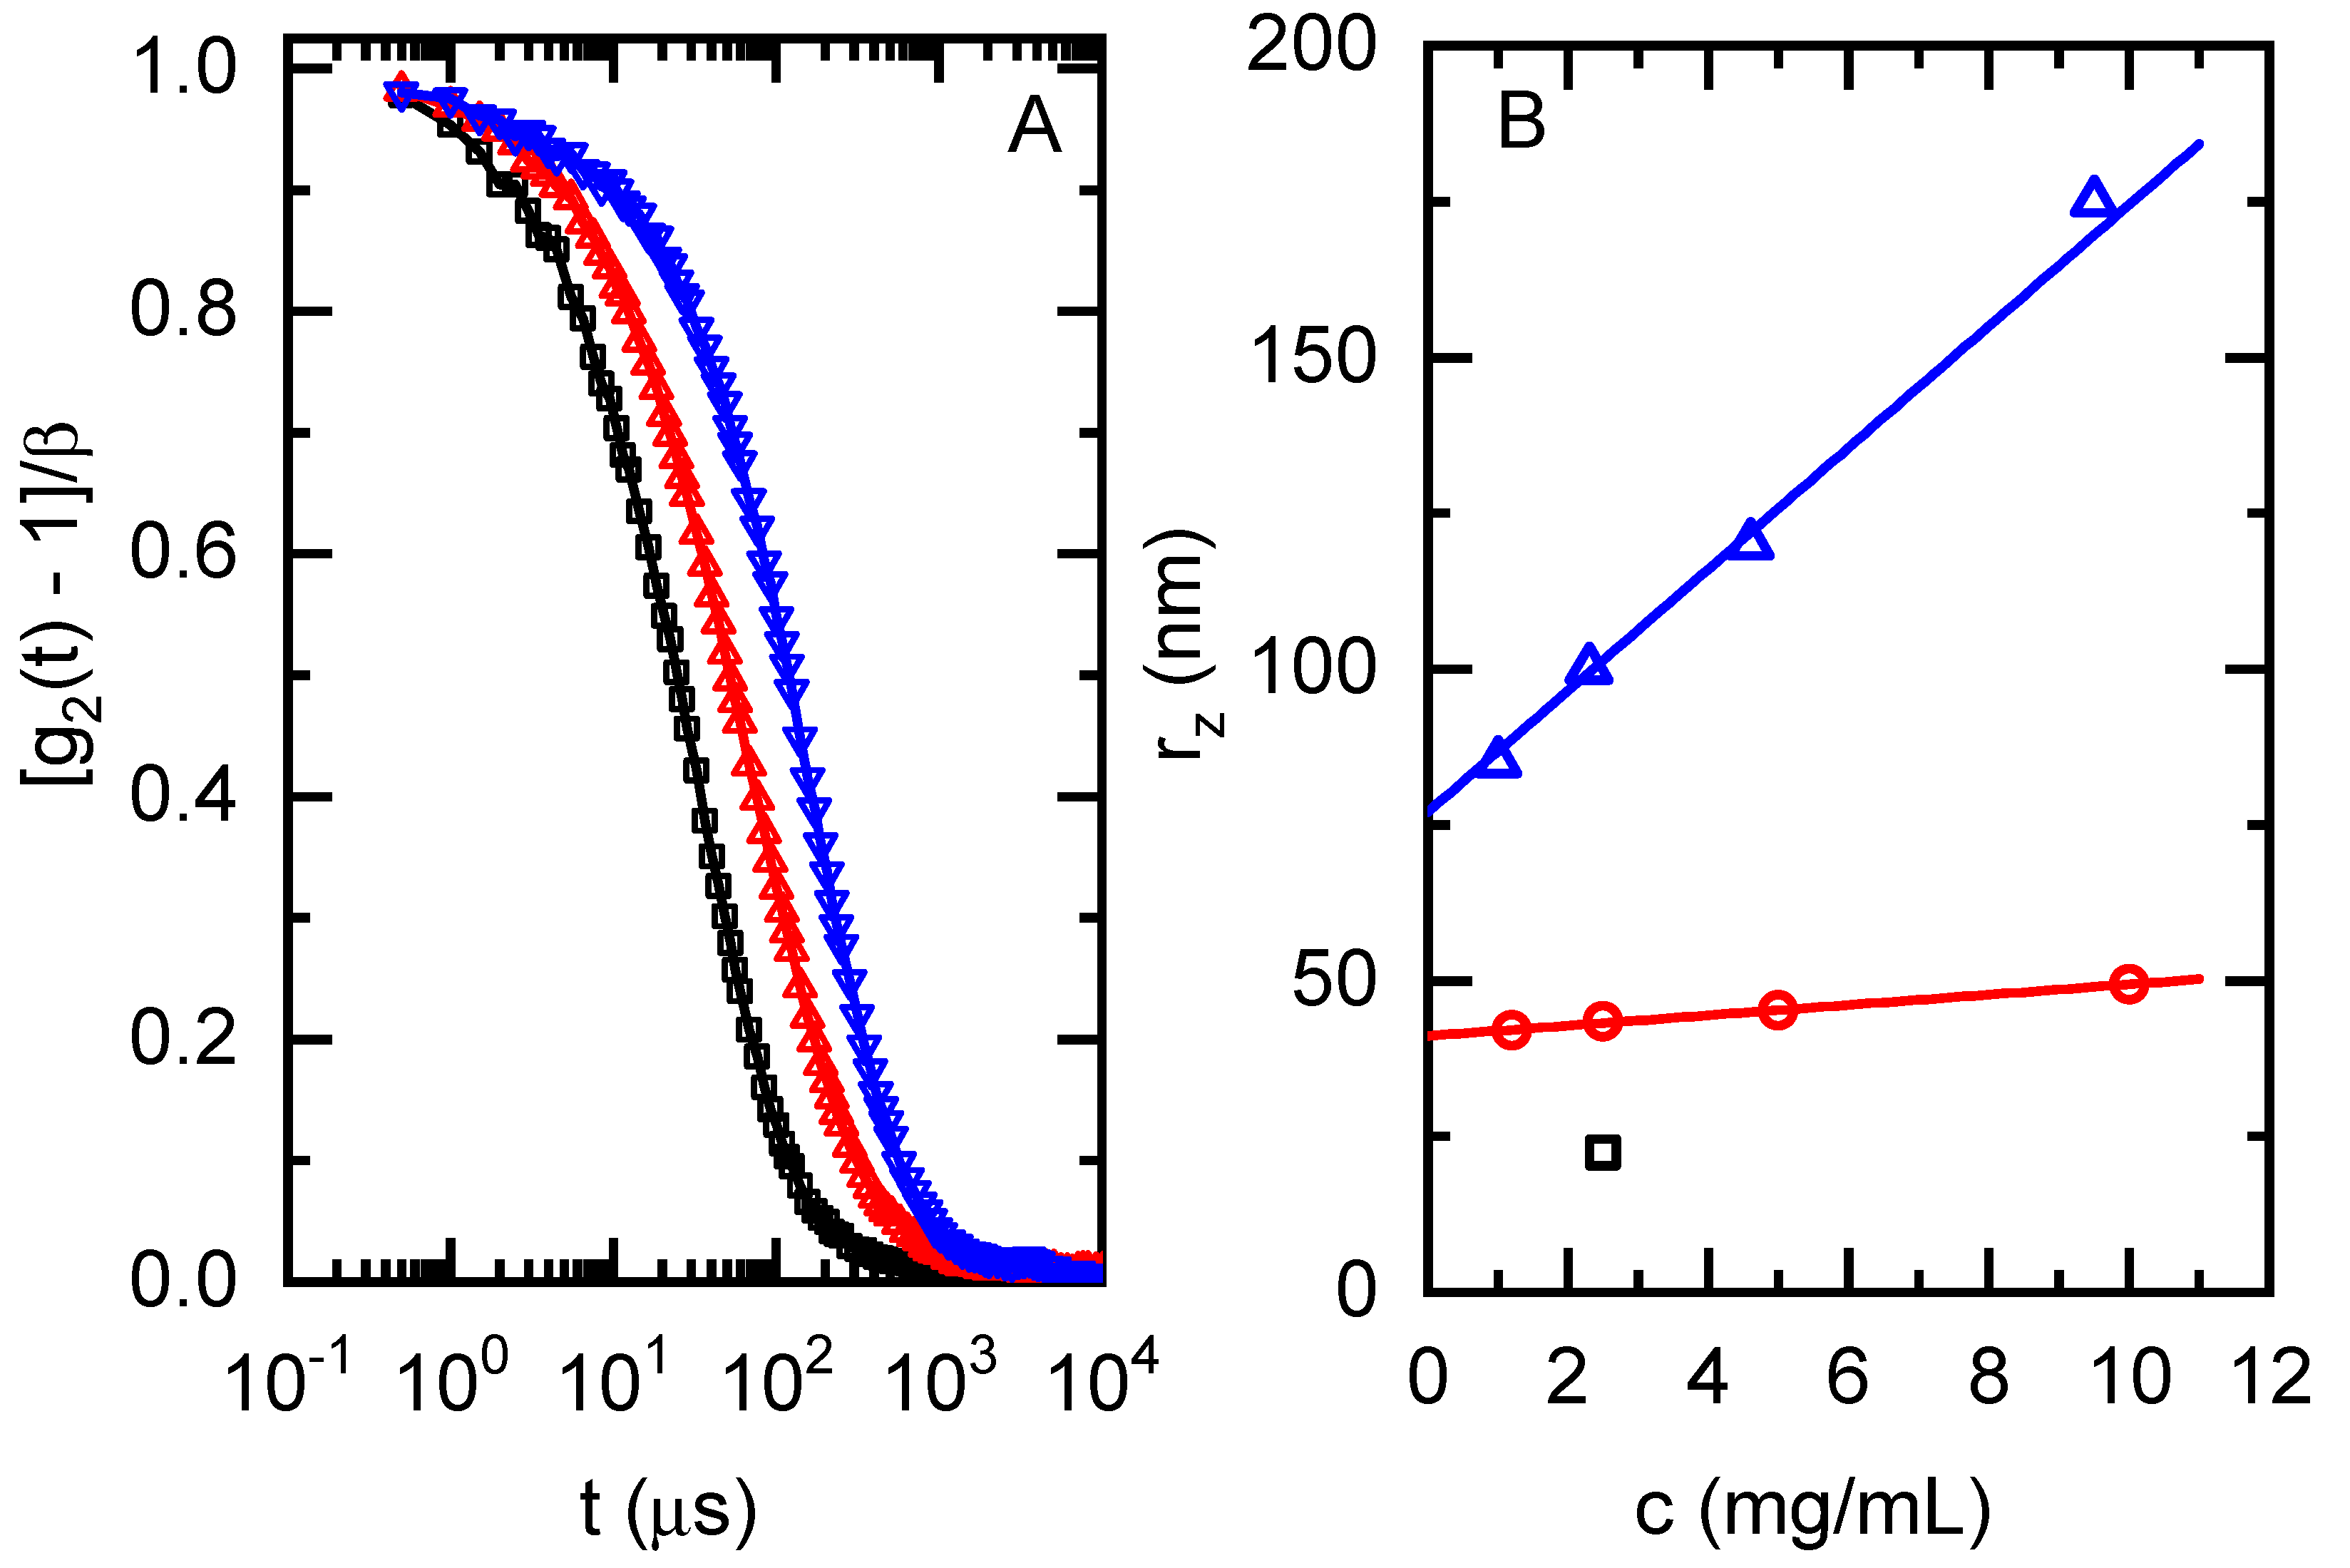
2.3. Dynamic Light Scattering: Hydrodynamic Properties
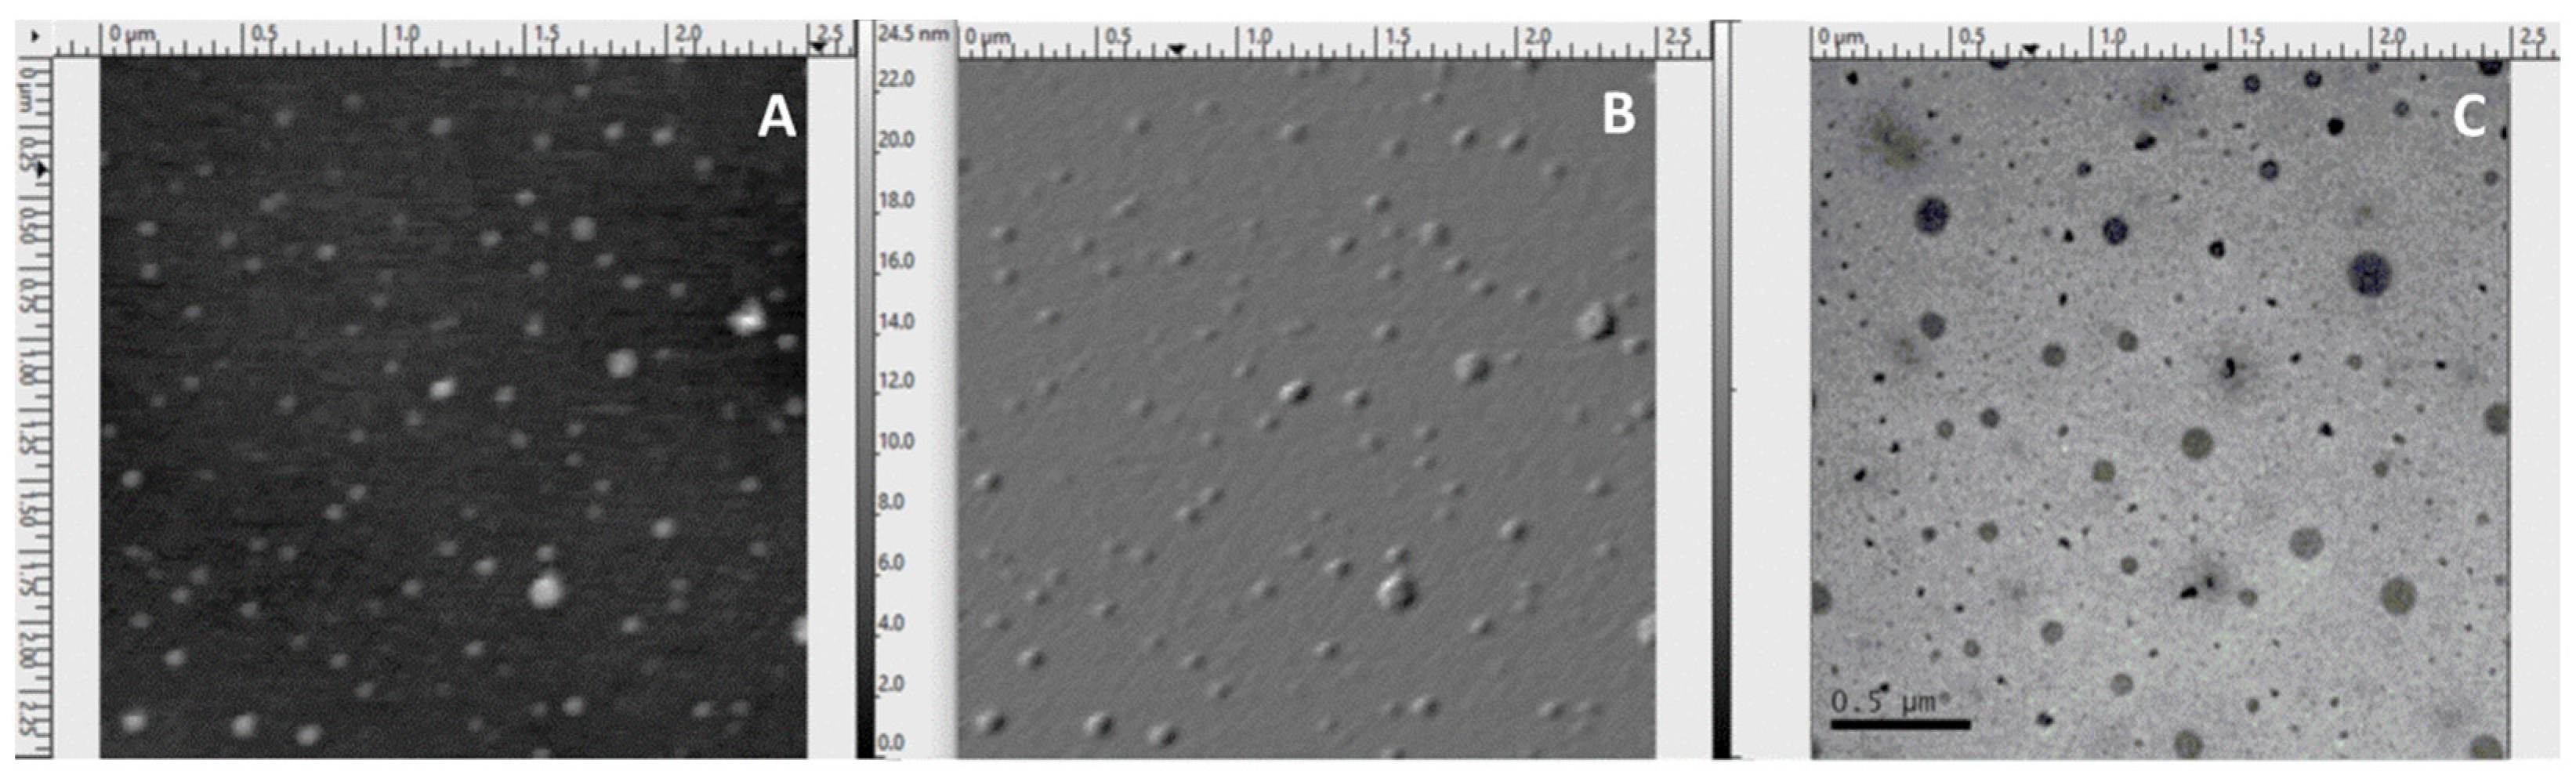
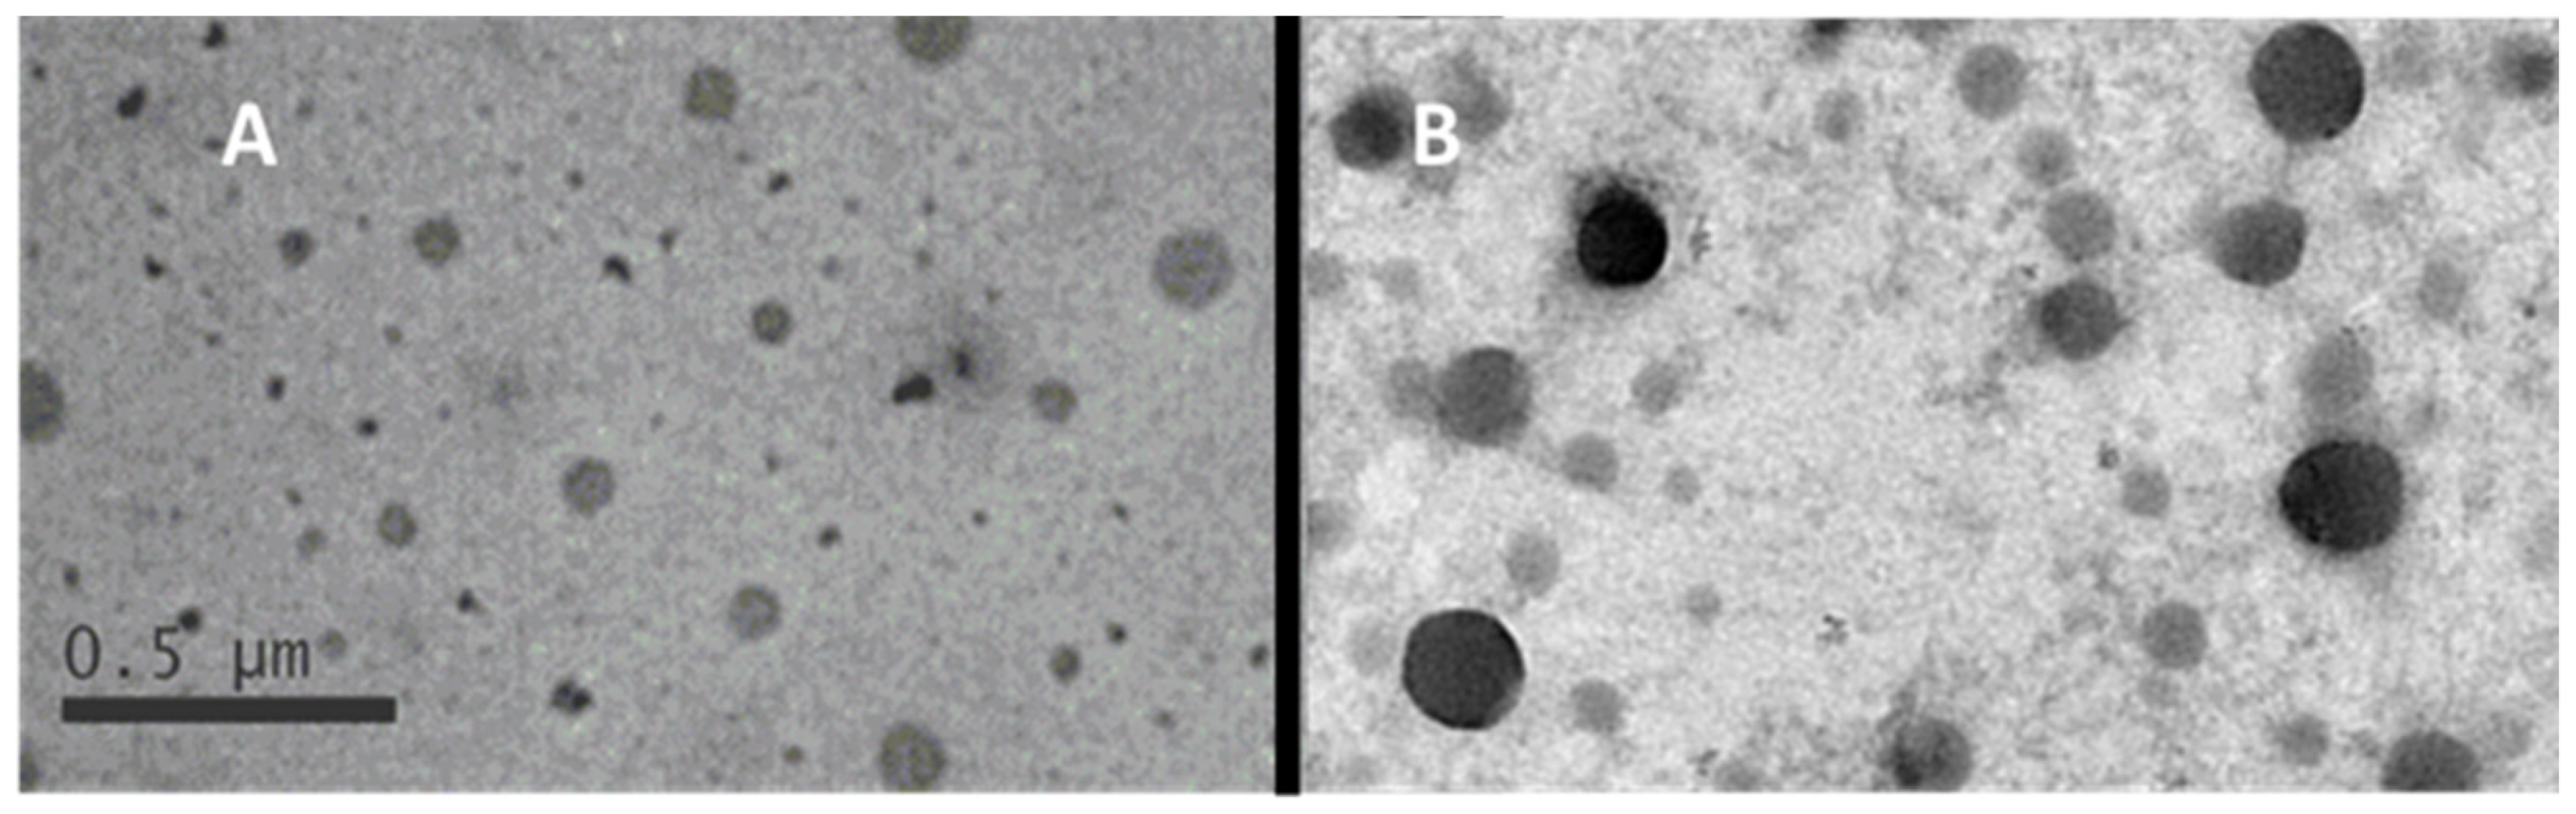
2.4. Atomic Force and Transmission Electron Microscopies: Morphological Aspects
2.5. Rheological Analysis: The Linear Viscoelastic Fingerprint
3. Results and Discussion
3.1. Characterization of The Samples
3.1.1. Hydrodynamic Size and Molecular Weight
3.1.2. Morphological Features of the Samples
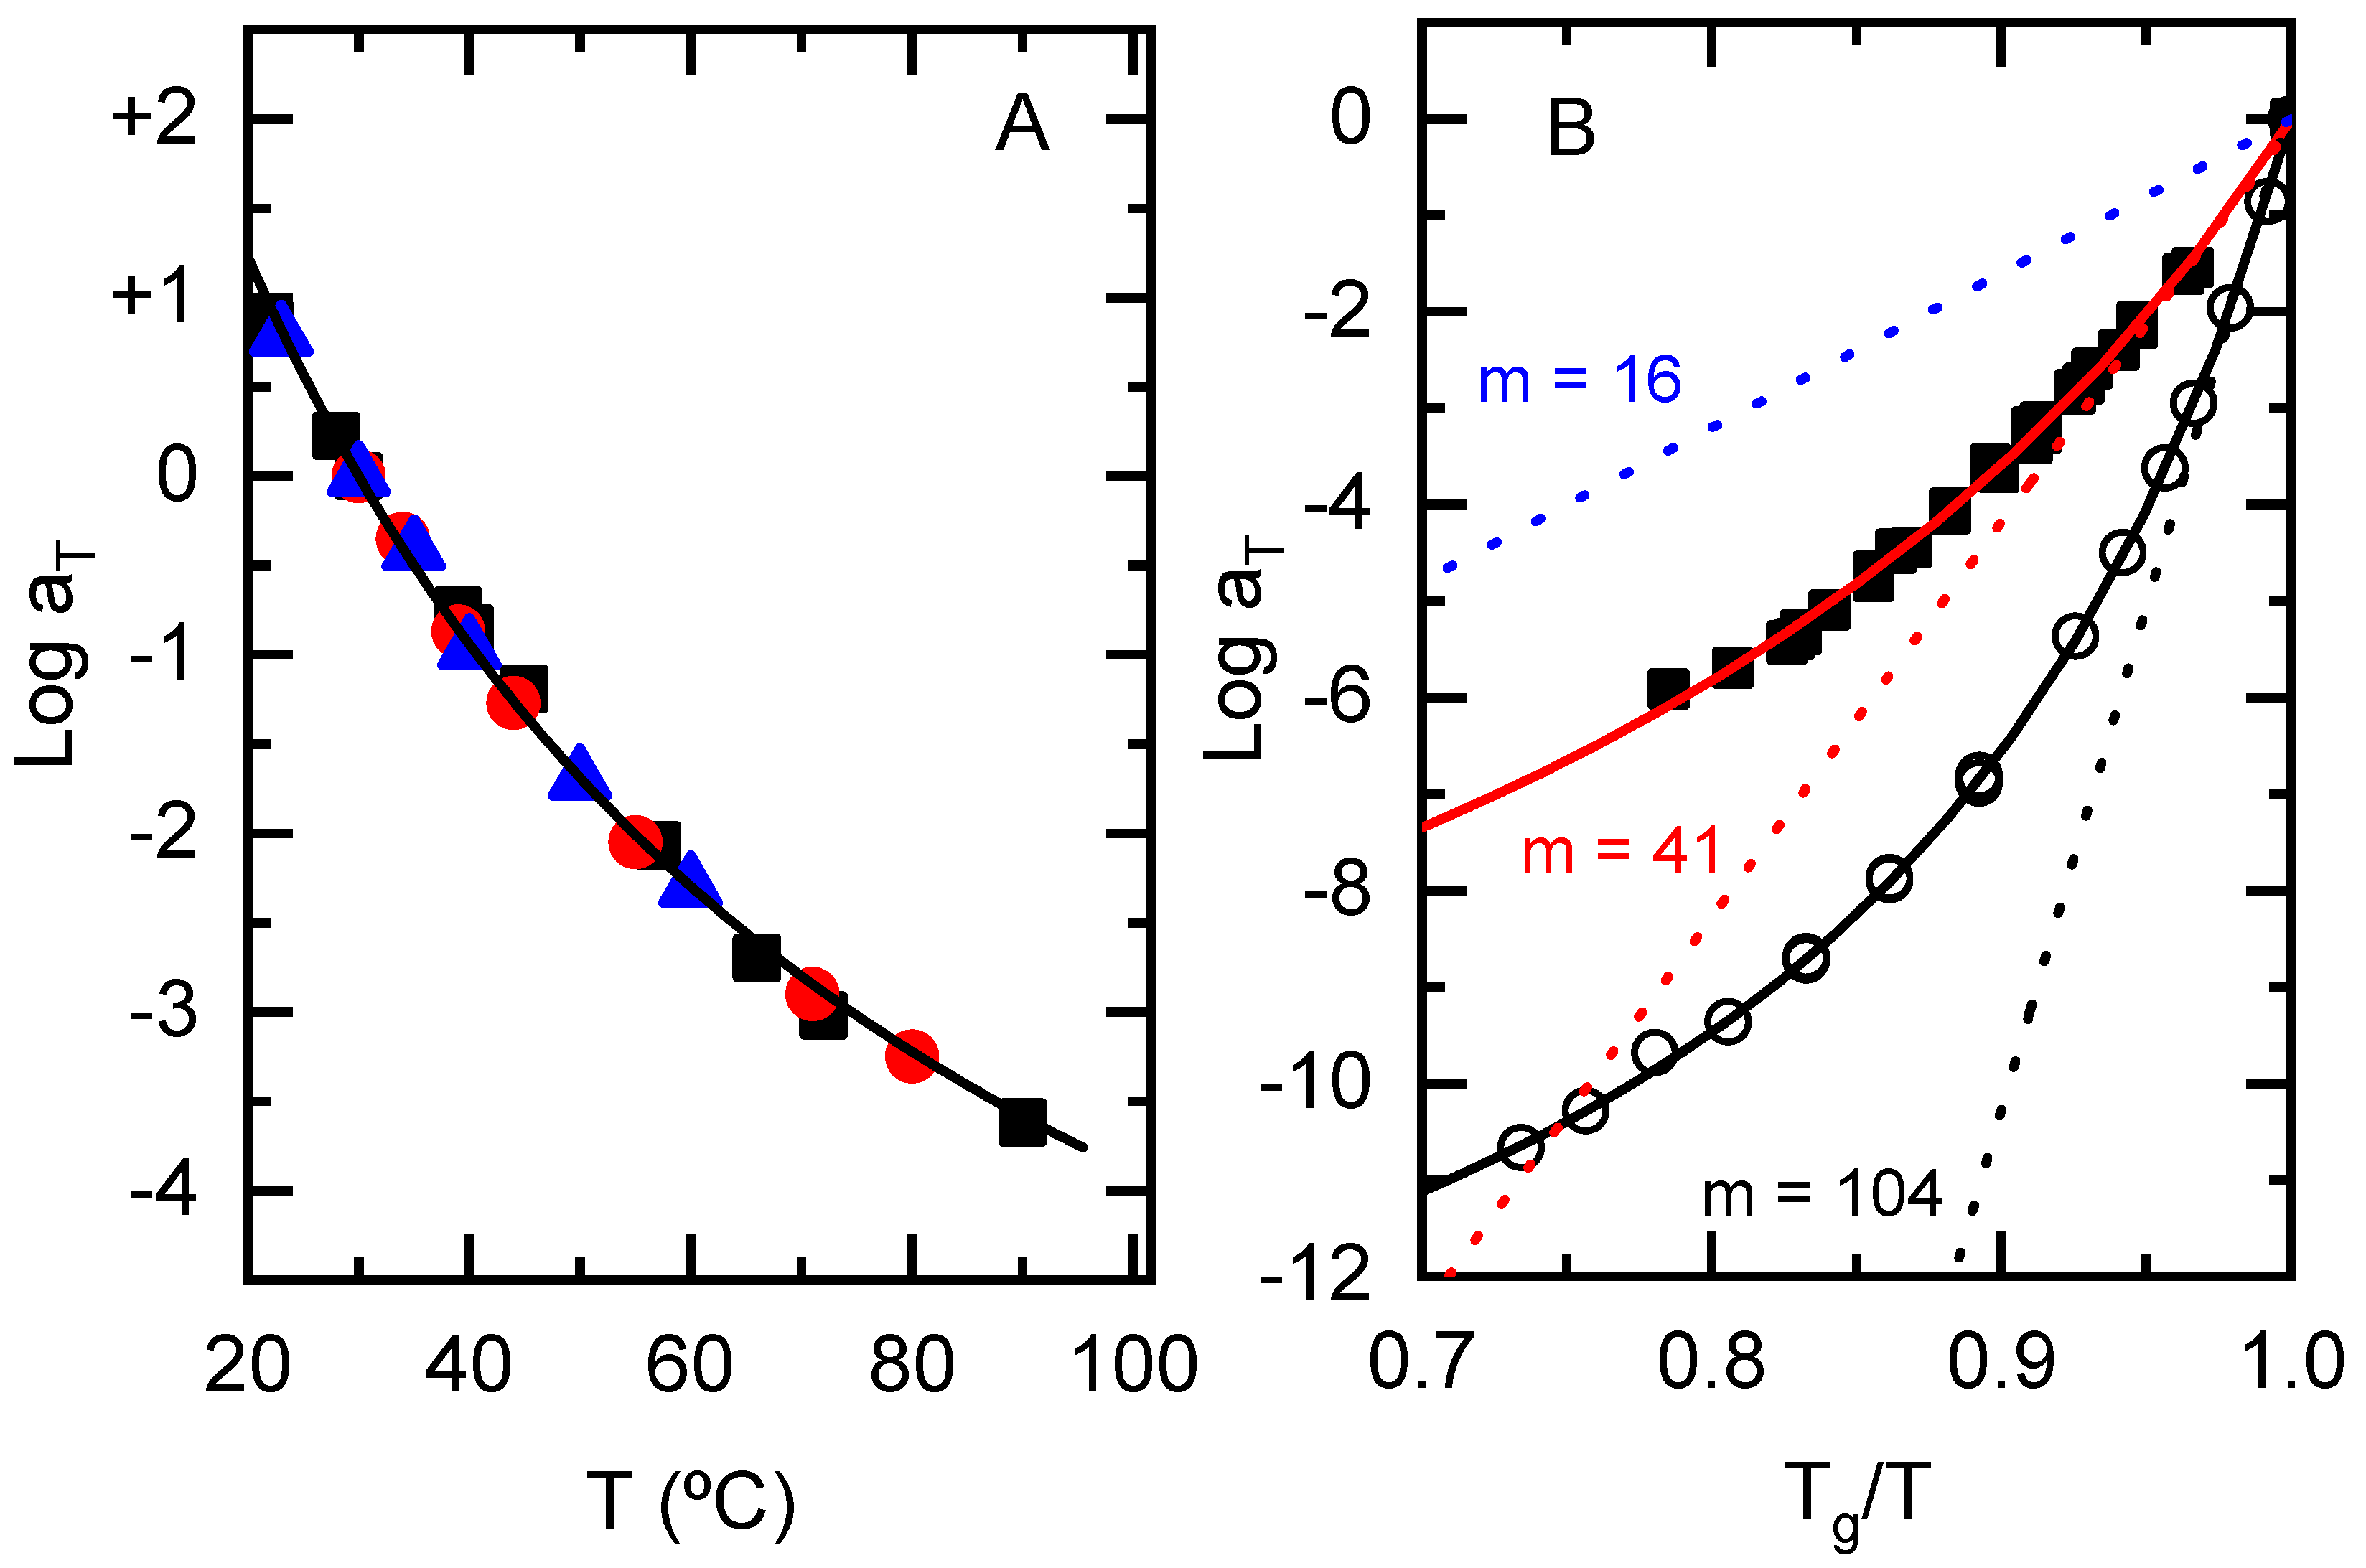
3.2. Temperature Dependence of the Rheological Response: Fragility
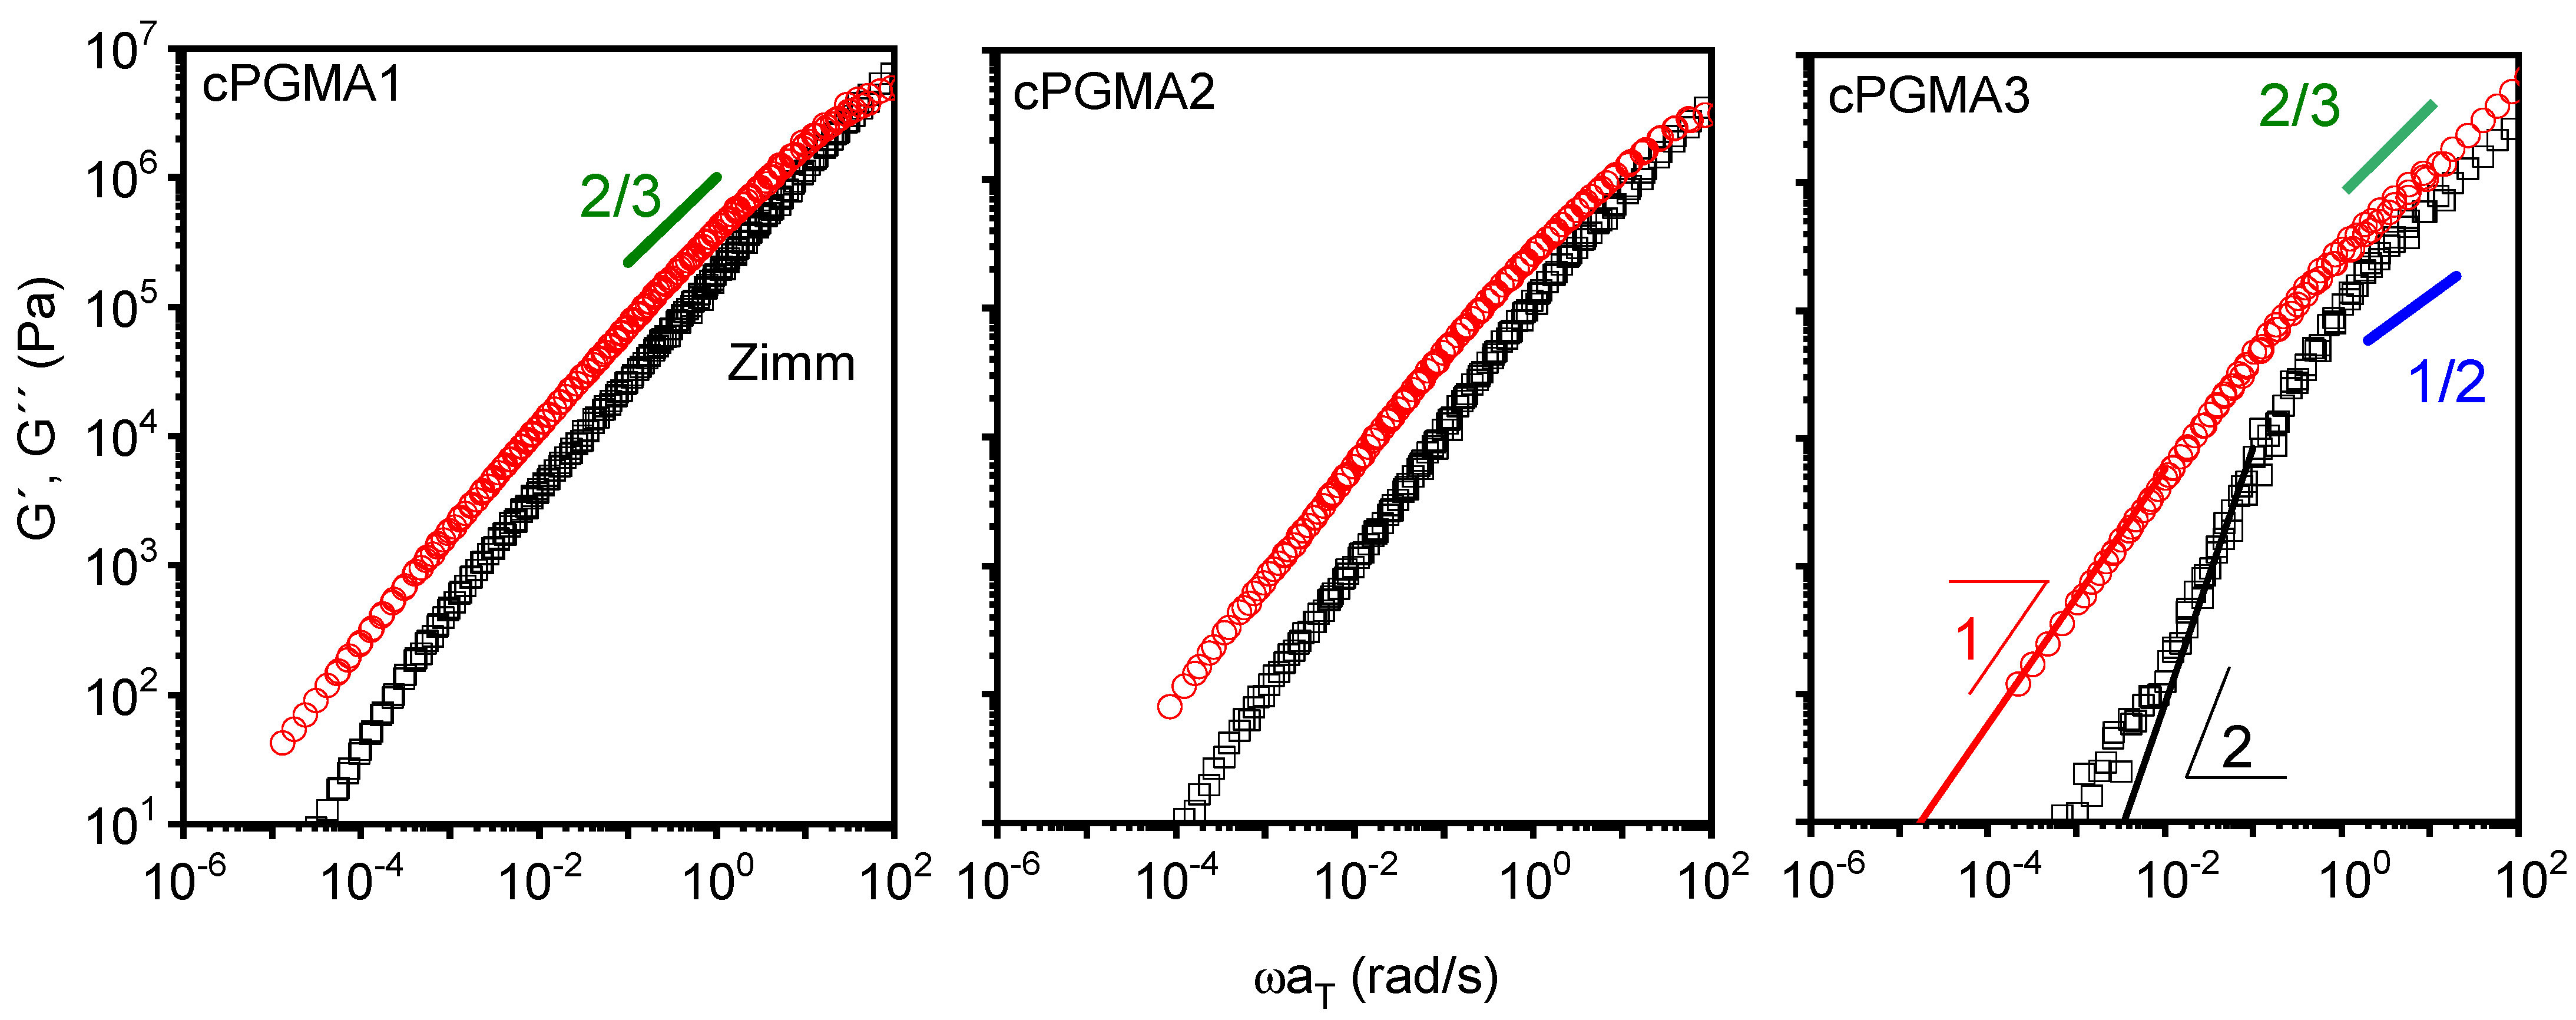
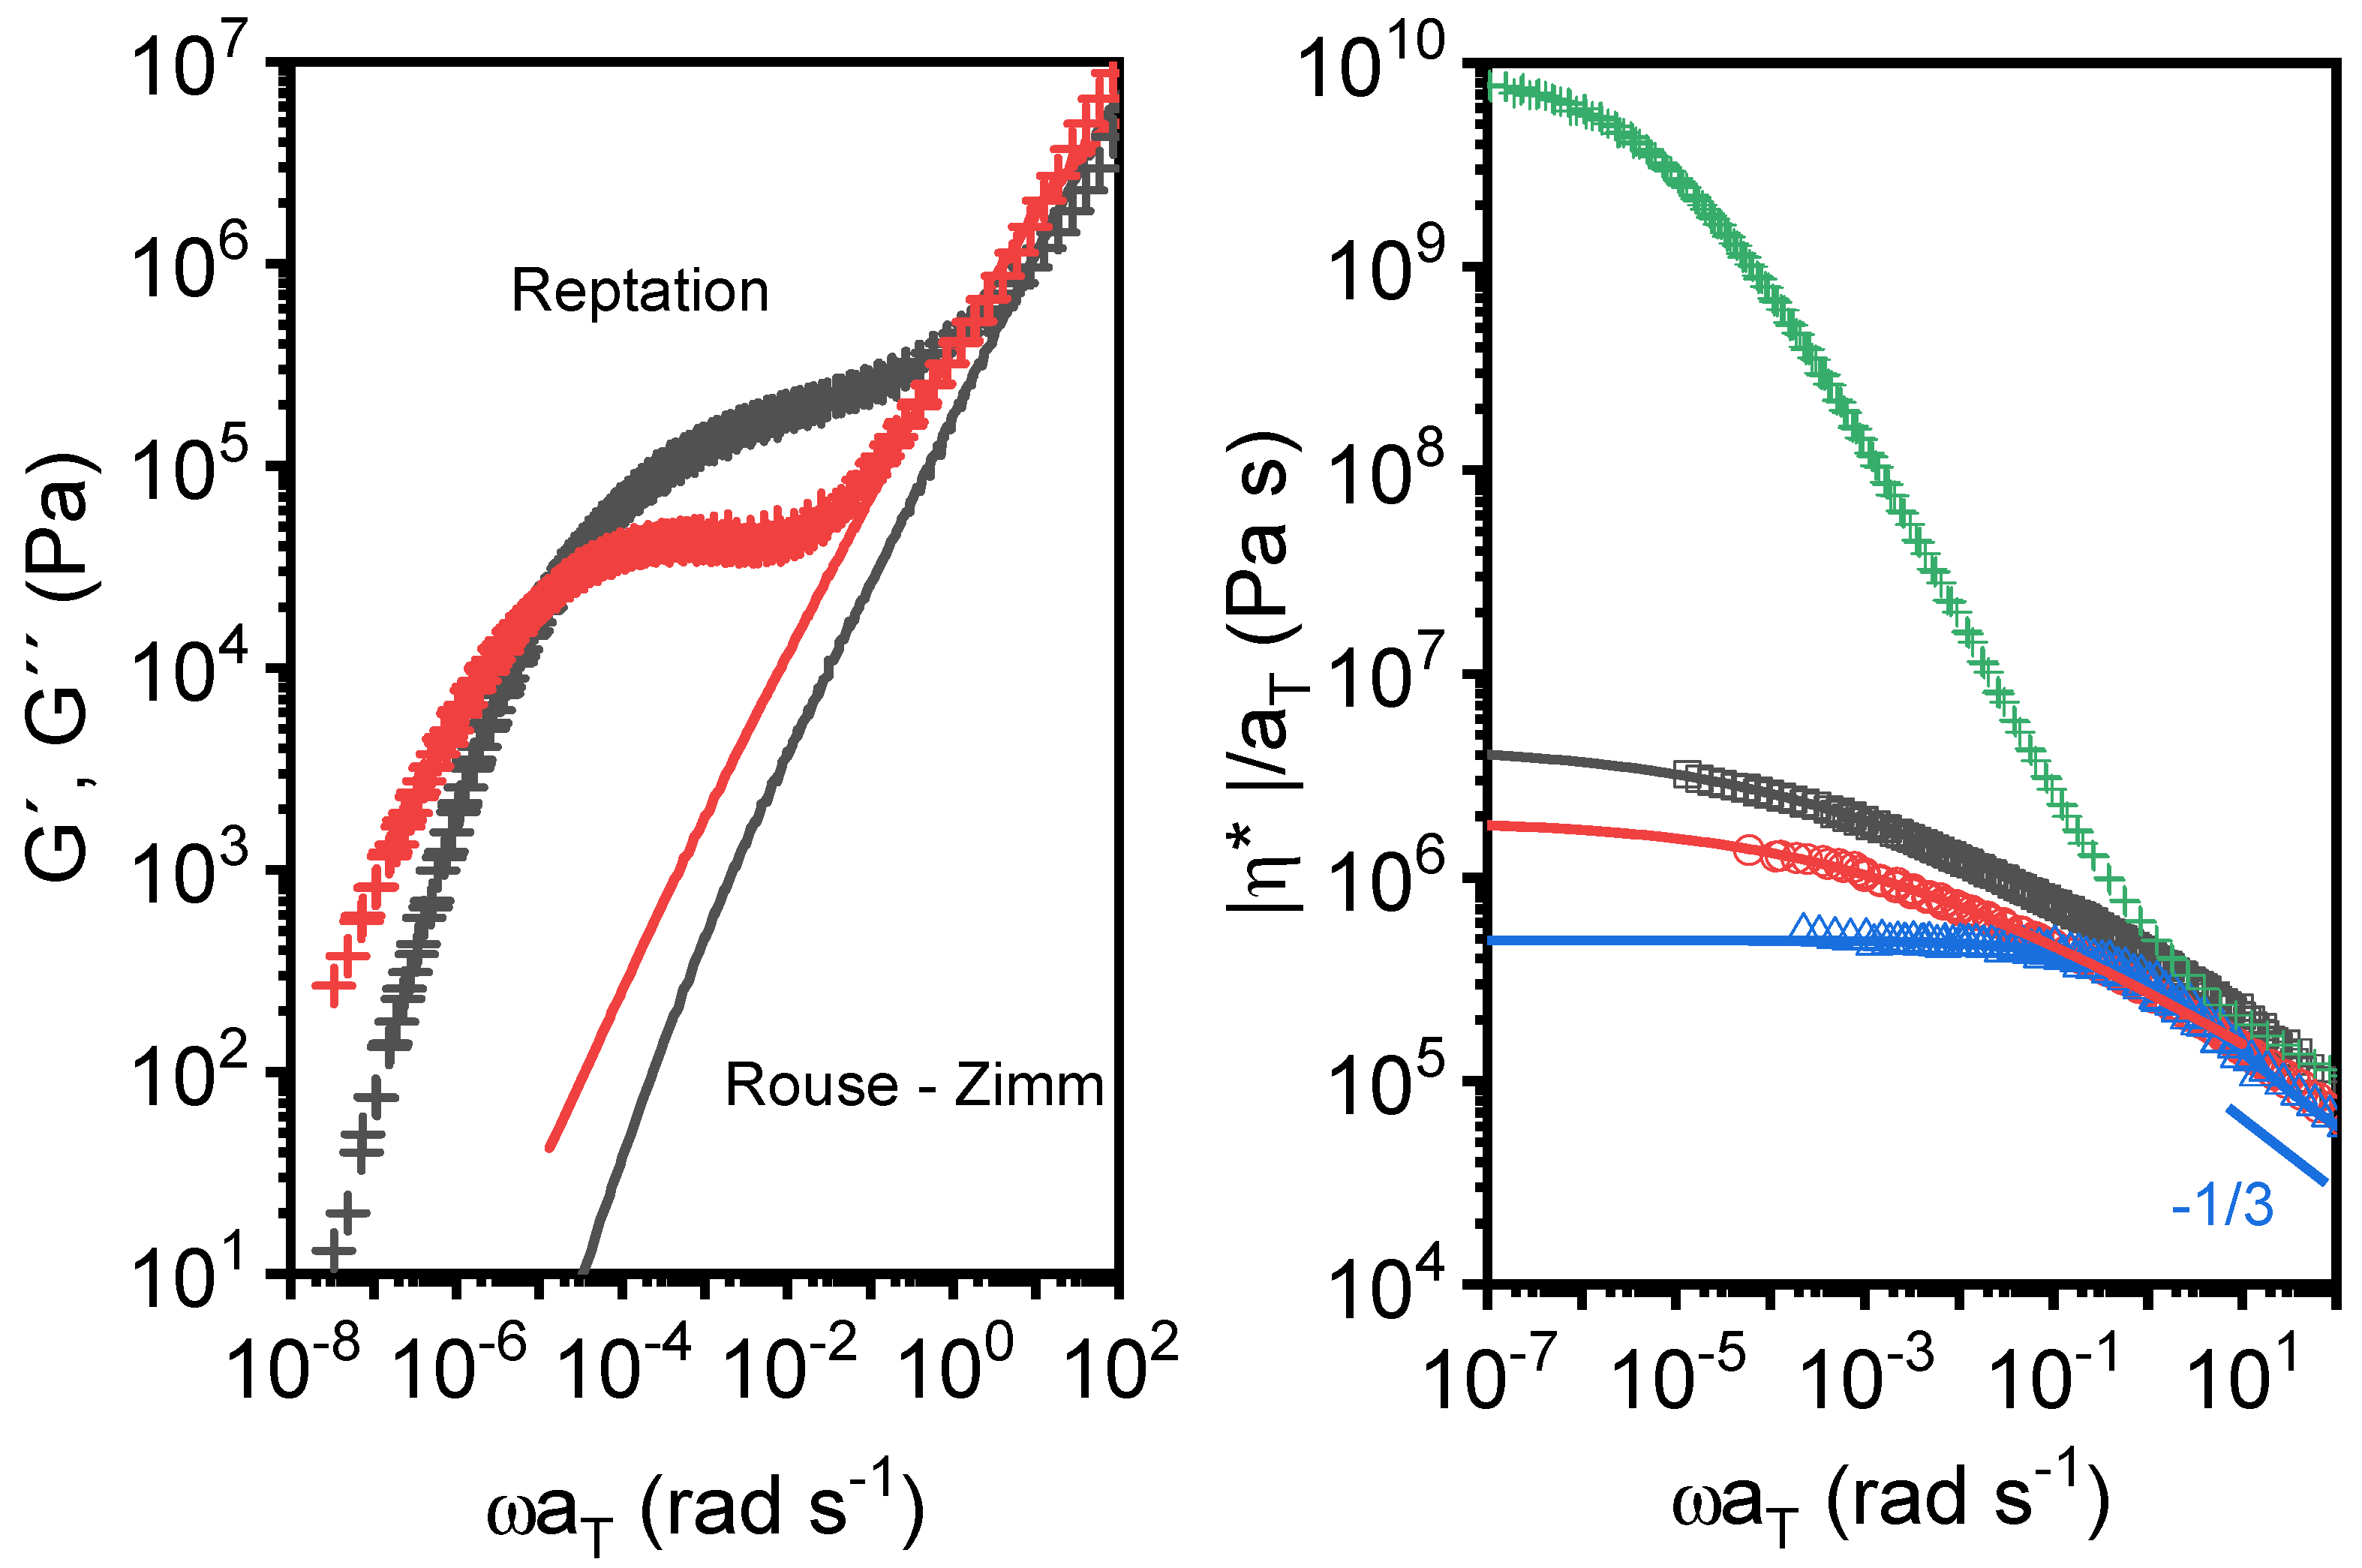
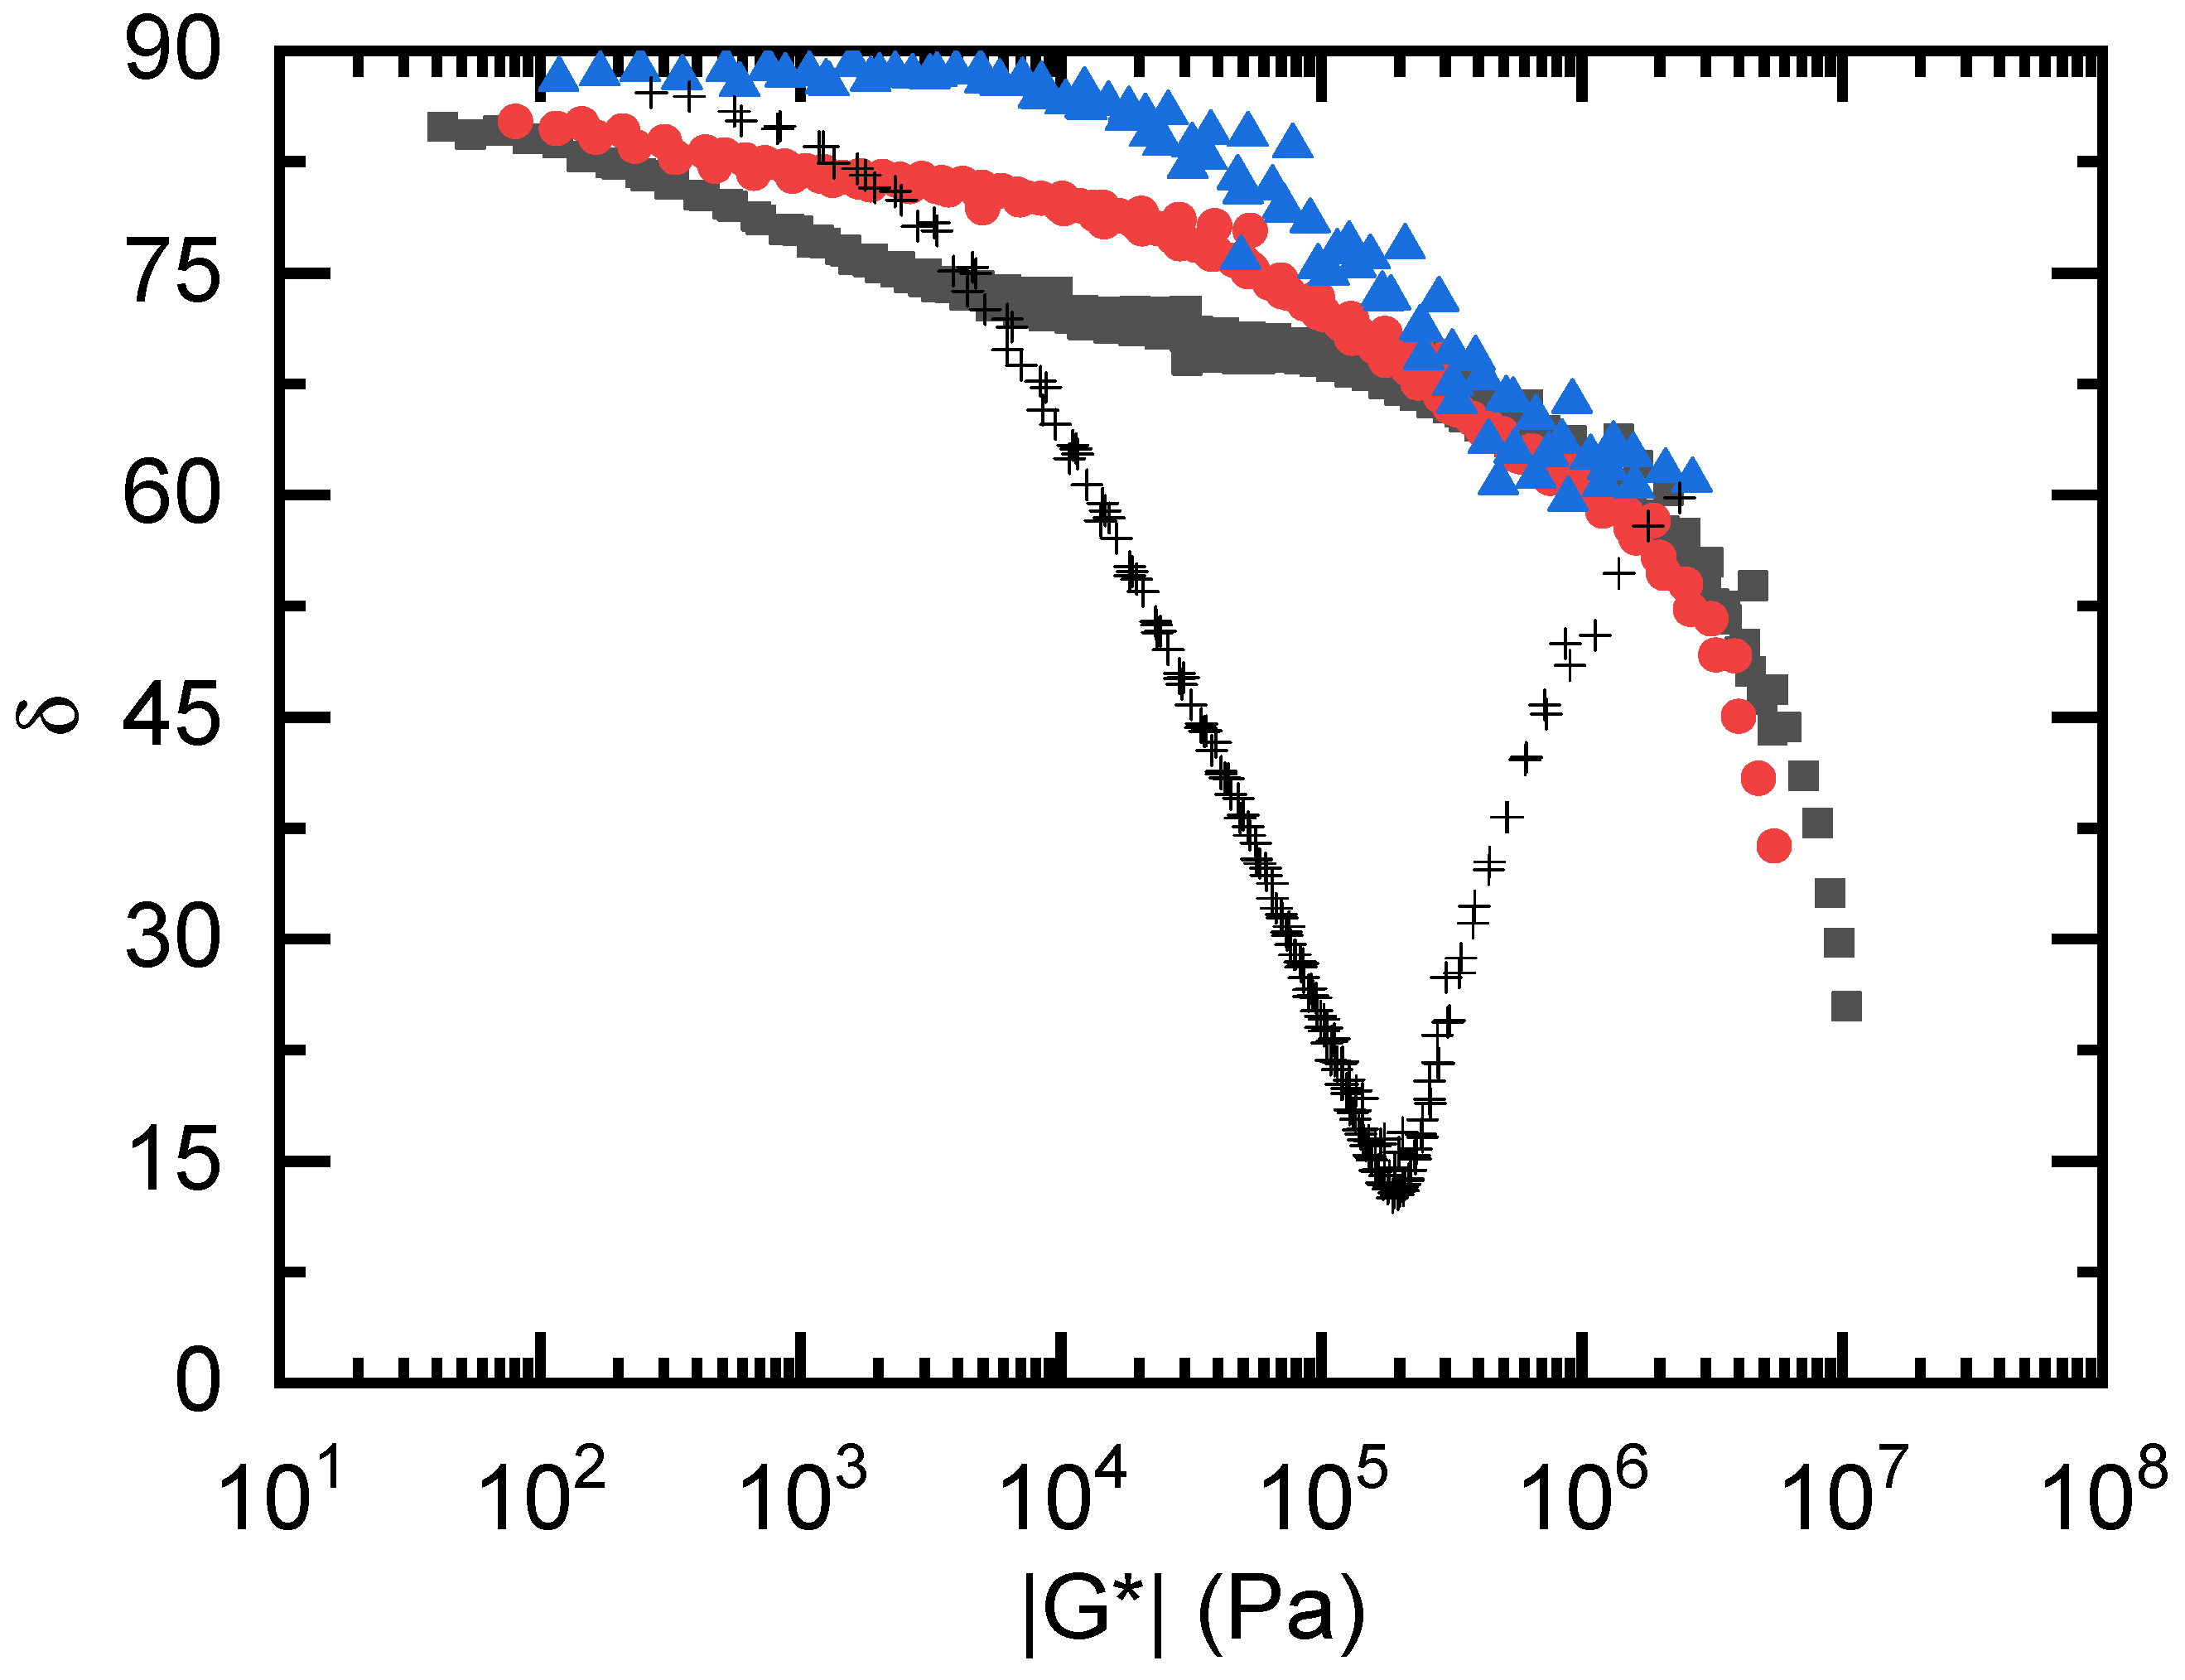
3.3. Linear Viscoelastic Response of the cPGMA Samples
4. Conclusions
Author Contributions
Funding
Institutional Review Board Statement
Informed Consent Statement
Data Availability Statement
Acknowledgments
Conflicts of Interest
References
- Tasdelen, M.A.; Kahveci, M.U.; Yagci, Y. Telechelic polymers by living and controlled/living polymerization methods. Prog. Polym. Sci. 2011, 36, 455–567. [Google Scholar] [CrossRef]
- Krishnamoorthy, M.; Hakobyan, S.; Ramstedt, M.; Gautrot, J.E. Surface-Initiated Polymer Brushes in the Biomedical Field: Applications in Membrane Science, Biosensing, Cell Culture, Regenerative Medicine and Antibacterial Coatings. Chem. Rev. 2014, 114, 10976–11026. [Google Scholar] [CrossRef] [PubMed]
- Muñoz, M.T.; Palenzuela, M.; Cuenca, T.; Mosquera, M.E.G. Aluminum Aryloxide Compounds as Very Active Catalysts for Glycidyl Methacrylate Selective Ring-Opening Polymerization. ChemCatChem 2018, 10, 936–939. [Google Scholar] [CrossRef]
- Palenzuela, M.; Muñoz, M.T.; Vega, J.F.; Gutiérrez-Rodríguez, A.; Cuenca, T.; Mosquera, M.E.G. Heterobimetallic aluminate derivatives with bulky phenoxide ligands: A catalyst for selective vinyl polymerization. Dalton Trans. 2019, 48, 6435–6444. [Google Scholar] [CrossRef] [PubMed]
- Palenzuela, M.; Valenzuela, L.; Amariei, G.; Vega, J.F.; Mosquera, M.E.; Rosal, R. Poly(glycidyl methacrylate) macromolecular assemblies as biocompatible nanocarrier for the antimicrobial lysozyme. Int. J. Pharm. 2021, 603, 120695. [Google Scholar] [CrossRef] [PubMed]
- Stetsyshyn, Y.; Raczkowska, J.; Budkowski, A.; Kostruba, A.; Harhay, K.; Ohar, H.; Awsiuk, K.; Bernasik, A.; Ripak, N.; Zemła, J. Synthesis and Postpolymerization Modification of Thermoresponsive Coatings Based on Pentaerythritol Monomethacrylate: Surface Analysis, Wettability, and Protein Adsorption. Langmuir 2015, 31, 9675–9683. [Google Scholar] [CrossRef]
- Dworakal, A.; Trzebicka, B.; Wojciech, A.; Utrataa, A.; Walach, W. Hydrophobically modified polyglycidol—The control of lower critical solution temperature. Polym. Bull. 2003, 50, 47–54. [Google Scholar] [CrossRef]
- Sivakumaran, D.; Mueller, E.; Hoare, T. Temperature-induced assembly of monodisperse, covalently cross-linked, and de-gradable poly(N-isopropylacrylamide) microgels based on oligomeric precursors. Langmuir 2015, 31, 5767–5778. [Google Scholar] [CrossRef]
- Agrawal, G.; Agrawal, R.; Pich, A. Dual Responsive Poly(N-vinylcaprolactam) Based Degradable Microgels for Drug Delivery. Part. Part. Syst. Charact. 2017, 34. [Google Scholar] [CrossRef]
- Chen, W.; Hou, Y.; Tu, Z.; Gao, L.; Haag, R. pH-degradable PVA-based nanogels via photo-crosslinking of thermo-preinduced nanoaggregates for controlled drug delivery. J. Control. Release 2017, 259, 160–167. [Google Scholar] [CrossRef]
- Antonietti, M.; Basten, R.; Lohmann, S. Polymerization in microemulsions—A new approach to ultrafine, highly functional-ized polymer dispersions. Macromol. Chem. Phys. 1995, 196, 441–466. [Google Scholar] [CrossRef]
- Antonietti, M.; Pakula, T.; Bremser, W. Rheology of Small Spherical Polystyrene Microgels: A Direct Proof for a New Transport Mechanism in Bulk Polymers besides Reptation. Macromolecules 1995, 28, 4227–4233. [Google Scholar] [CrossRef]
- Roland, C.M.; Santangelo, P.G.; Antonietti, M.; Neese, M. Mechanical Behavior of Polystyrene Microgels. Macromolecules 1999, 32, 2283–2287. [Google Scholar] [CrossRef] [Green Version]
- Dorgan, J.R.; Knauss, D.M.; Al-Muallem, H.A.; Huang, T.; Vlassopulos, D. Melt rheology of dendritically branched polysty-renes. Macromolecules 2003, 36, 380–388. [Google Scholar] [CrossRef]
- Tande, B.M.; Wagner, N.J.; Kim, Y.H. Influence of End Groups on Dendrimer Rheology and Conformation. Macromolecules 2003, 36, 4619–4623. [Google Scholar] [CrossRef] [Green Version]
- Hofmann, M.; Gainaru, C.; Çetinkaya, B.; Valiullin, R.; Fatkullin, N.; Rössler, E.A. Field-Cycling Relaxometry as a Molecular Rheology Technique: Common Analysis of NMR, Shear Modulus and Dielectric Loss Data of Polymers vs Dendrimers. Macromolecules 2015, 48, 7521–7534. [Google Scholar] [CrossRef]
- Dolgushev, M.; Markelov, D.A.; Lähderanta, E. Linear Viscoelasticity of Carbosilane Dendrimer Melts. Macromolecules 2019, 52, 2542–2547. [Google Scholar] [CrossRef] [Green Version]
- Hu, M.; Xia, Y.; McKenna, G.B.; Kornfield, J.A.; Grubbs, R.H. Linear Rheological Response of a Series of Densely Branched Brush Polymers. Macromolecules 2011, 44, 6935–6943. [Google Scholar] [CrossRef]
- Dalsin, S.J.; Hillmyer, M.A.; Bates, F.S. Linear Rheology of Polyolefin-Based Bottlebrush Polymers. Macromolecules 2015, 48, 4680–4691. [Google Scholar] [CrossRef]
- Daniel, W.F.M.; Burdyńska, J.; Vatankhah-Varnoosfaderani, M.; Matyjaszewski, K.; Paturej, J.; Rubinstein, M.; Dobrynin, A.V.; Sheiko, S.S. Solvent-free, supersoft and superelastic bottlebrush melts and networks. Nat. Mater. 2015, 15, 183–189. [Google Scholar] [CrossRef]
- Alexandris, S.; Peponaki, K.; Petropoulou, P.; Sakellariou, G.; Vlassopoulos, D. Linear Viscoelastic Response of Unentangled Polystyrene Bottlebrushes. Macromolecules 2020, 53, 3923–3932. [Google Scholar] [CrossRef]
- Iwawaki, H.; Urakawa, O.; Inoue, T.; Nakamura, Y.; Matsumiya, Y.; Watanabe, H. Rheo-Optical and Dielectric Study on Dynamics of Bottlebrush-like Polymacromonomer Consisting of a Polyisoprene Main Chain and Polystyrene Side Chains. Macromolecules 2020, 53, 7096–7106. [Google Scholar] [CrossRef]
- Van Ruymbeke, E.; Muliawan, E.B.; Vlassopoulos, D.; Gao, H.; Matyjaszewski, K. Melt rheology of star polymers with large number of small arms, prepared by crosslinking poly(n-butyl acrylate) macromonomers via ATRP. Eur. Polym. J. 2011, 47, 746–751. [Google Scholar] [CrossRef]
- Snijkers, F.; Cho, H.Y.; Nese, A.; Matyjaszewski, K.; Pyckhout-Hintzen, W.; Vlassopoulos, D. Effects of Core Microstructure on Structure and Dynamics of Star Polymer Melts: From Polymeric to Colloidal Response. Macromolecules 2014, 47, 5347–5356. [Google Scholar] [CrossRef]
- Vlassopoulos, D. Macromolecular topology and rheology: Beyond the tube model. Rheol. Acta 2016, 55, 613–632. [Google Scholar] [CrossRef]
- Costanzo, S.; Scherz, L.F.; Schweizer, T.; Kröger, M.; Floudas, G.; Schlüter, A.D.; Vlassopoulos, D. Rheology and Packing of Dendronized Polymers. Macromolecules 2016, 49, 7054–7068. [Google Scholar] [CrossRef]
- Qian, Z.; Koh, Y.P.; Pallaka, M.R.; Chang, A.B.; Lin, T.-P.; Guzmán, P.E.; Grubbs, R.H.; Simon, S.L.; McKenna, G.B. Linear Rheology of a Series of Second-Generation Dendronized Wedge Polymers. Macromolecules 2019, 52, 2063–2074. [Google Scholar] [CrossRef]
- Vereroudakis, E.; Bang, K.-T.; Karouzou, M.; Ananiadou, A.; Noh, J.; Choi, T.-L.; Loppinet, B.; Floudas, G.; Vlassopoulos, D. Multi-scale Structure and Dynamics of Dendronized Polymers with Varying Generations. Macromolecules 2020, 54, 235–248. [Google Scholar] [CrossRef]
- Berne, B.J.; Pecora, R. Dynamic Light Scattering with Applications to Chemistry, Biology and Physics; Dover Publications Inc.: Mineola, NY, USA, 2000. [Google Scholar]
- Frisken, B.J. Revisiting the method of cumulants for the analysis of dynamic light-scattering data. Appl. Opt. 2001, 40, 4087–4091. [Google Scholar] [CrossRef] [Green Version]
- Hassan, P.A.; Kulshreshtha, S.K. Modification to the cumulant analysis of polydispersity in quasielastic light scattering data. J. Colloid Interface Sci. 2006, 300, 744–748. [Google Scholar] [CrossRef]
- Hanus, L.H.; Ploehn, H.J. Conversion of intensity-averaged photon correlation spectroscopy measurements to number-averaged particle size distributions. 1. Theoretical development. Langmuir 1999, 15, 3091–3100. [Google Scholar] [CrossRef]
- Mecke, A.; Lee, I.; Baker, J.R.; Holl, M.M.B.; Orr, B.G. Deformability of poly(amidoamine) dendrimers. Eur. Phys. J. E 2004, 14, 7–16. [Google Scholar] [CrossRef] [PubMed]
- Taranekar, P.; Park, J.Y.; Patton, D.; Fulghum, T.; Ramon, G.J.; Advincula, R. Conjugated polymer nanoparticles via intra-molecular crosslinking of dendrimeric precursors. Adv. Mater. 2006, 18, 2461–2465. [Google Scholar] [CrossRef]
- Wang, P.; Pu, H.; Jin, M. Single-chain nanoparticles with well-defined structure via intramolecular crosslinking of linear polymers with pendant benzoxazine groups. J. Polym. Sci. Part A Polym. Chem. 2011, 49, 5133–5141. [Google Scholar] [CrossRef]
- Myerson, J.W.; Braender, B.; Mcpherson, O.; Glassman, P.M.; Kiseleva, R.Y.; Shuvaev, V.V.; Marcos-Contreras, O.; Grady, M.E.; Lee, H.S.; Greineder, C.F.; et al. Flexible Nanoparticles Reach Sterically Obscured Endothelial Targets Inaccessible to Rigid Nanoparticles. Adv. Mater. 2018, 30, e1802373. [Google Scholar] [CrossRef]
- Nickel, A.C.; Scotti, A.; Houston, J.E.; Ito, T.H.; Crassous, J.J.; Pedersen, J.S.; Richtering, W. Anisotropic Hollow Microgels That Can Adapt Their Size, Shape, and Softness. Nano Lett. 2019, 19, 8161–8170. [Google Scholar] [CrossRef]
- Karg, M.; Pich, A.; Hellweg, T.; Hoare, T.; Lyon, L.A.; Crassous, J.J.; Suzuki, D.; Gumerov, R.A.; Schneider, S.; Potemkin, I.I.; et al. Nanogels and Microgels: From Model Colloids to Applications, Recent Developments, and Future Trends. Langmuir 2019, 35, 6231–6255. [Google Scholar] [CrossRef]
- Angell, C.A. Spectroscopy simulation and scattering, and the medium range order problem in glass. J. Non-Cryst. Solids 1985, 73, 1–17. [Google Scholar] [CrossRef]
- Plazek, D.J.; Ngai, K.L. Correlation of polymer segmental chain dynamics with temperature-dependent time-scale shifts. Macromolecules 1991, 24, 1222–1224. [Google Scholar] [CrossRef]
- Wang, L.-M.; Angell, C.A.; Richert, R. Fragility and thermodynamics in nonpolymeric glass-forming liquids. J. Chem. Phys. 2006, 125, 074505. [Google Scholar] [CrossRef] [Green Version]
- Böhmer, R.; Ngai, K.L.; Angell, C.A.; Plazek, D.J. Non-exponential relaxations in strong and fragile glass-formers. J. Chem. Phys. 1993, 99, 4201–4209. [Google Scholar] [CrossRef]
- Roland, C.M.; Santangelo, P.G.; Ngai, K.L. The application of the energy landscape model to polymers. J. Chem. Phys. 1999, 111, 5593–5598. [Google Scholar] [CrossRef]
- Qin, Q.; McKenna, G.B. Correlation between dynamic fragility and glass transition temperature for different classes of glass forming liquids. J. Non-Cryst. Solids 2006, 352, 2977–2985. [Google Scholar] [CrossRef]
- Van der Scheer, P.; van de Laar, T.; van der Gucht, J.; Vlassopoulos, D.; Sprakel, J. Fragility and strength in nanoparticle glasses. ACS Nano 2017, 11, 6755–6763. [Google Scholar] [CrossRef]
- Rouse, P.E., Jr. A Theory of the Linear Viscoelastic Properties of Dilute Solutions of Coiling Polymers. J. Chem. Phys. 1953, 21, 1272–1280. [Google Scholar] [CrossRef]
- Zimm, B.H. Dynamics of Polymer Molecules in Dilute Solution: Viscoelasticity, Flow Birefringence and Dielectric Loss. J. Chem. Phys. 1956, 24, 269–278. [Google Scholar] [CrossRef]
- Kapnistos, M.; Semenov, A.N.; Vlassopoulos, D.; Roovers, J. Viscoelastic response of hyperstar polymers in the linear regime. J. Chem. Phys. 1999, 111, 1753–1759. [Google Scholar] [CrossRef]
- Carreau, P.J. Rheological Equations from Molecular Network Theories. Trans. Soc. Rheol. 1972, 16, 99–127. [Google Scholar] [CrossRef]
- Luo, J.; Zhu, Y.; Ruan, Y.; Wu, W.; Ouyang, X.; Du, Z.; Liu, G. Diameter and Elasticity Governing the Relaxation of Soft-Nanoparticle Melts. Macromolecules 2021, 54, 8077–8087. [Google Scholar] [CrossRef]
- Van Gurp, M.; Palmen, J. Time temperature superposition for polymeric blends. Rheol. Bull. 1998, 67, 5–8. [Google Scholar]
- Trinkle, S.; Friedrich, C. Van Gurp-Palmen-plot: A way to characterize polydispersity of linear polymers. Rheol. Acta 2001, 40, 322–328. [Google Scholar] [CrossRef]
- Trinkle, S.; Walter, P.; Friedrich, C. Van Gurp-Palmen Plot II—Classification of long chain branched polymers by their topology. Rheol. Acta 2002, 41, 103–113. [Google Scholar] [CrossRef]


| [AlMeXOAr] | [MAlMeOAr] | |
|---|---|---|
| cPGMA1 | X = Me | M = Li |
| cPGMA2 | X = Cl | M = Li |
| cPGMA3 | X = Me | M = K |
| Sample | Dt (μm2/s) | rz (nm) a | Q | rn (nm) | Mw,app (kg/mol) b | η0 (kPa·s) c | τ0 (s) c | Tg (K) d |
|---|---|---|---|---|---|---|---|---|
| cPGMA1 | 17.1 | 23.1 | 0.40 | 11.2 | 800 | 4488.4 | 2335 | 285.5 |
| cPGMA2 | 8.80 | 41.1 | 0.50 | 20.2 | 3000 | 1010.4 | 23.0 | n.d. |
| cPGMA3 | 3.60 | 77.1 | 0.39 | 41.4 | 8000 | 489.9 | 0.61 | 285.0 |
| cPGMA1 | cPGMA2 | cPGMA3 | |
|---|---|---|---|
| [AlMeXOAr] | X = Me | X = Cl | X = Me |
| Mw (KDa) [3] | 33.8 | 20.0 | 33.8 |
| [MAlMe3OAr] | M = Li | M = Li | M = K |
| Mw,app cPGMA (KDa) | 800 | 3000 | 8000 |
Publisher’s Note: MDPI stays neutral with regard to jurisdictional claims in published maps and institutional affiliations. |
© 2022 by the authors. Licensee MDPI, Basel, Switzerland. This article is an open access article distributed under the terms and conditions of the Creative Commons Attribution (CC BY) license (https://creativecommons.org/licenses/by/4.0/).
Share and Cite
Cardil, A.; Palenzuela, M.; Vega, J.F.; Mosquera, M.E.G. Rheology of Poly(glycidyl methacrylate) Macromolecular Nano Assemblies. Polymers 2022, 14, 455. https://doi.org/10.3390/polym14030455
Cardil A, Palenzuela M, Vega JF, Mosquera MEG. Rheology of Poly(glycidyl methacrylate) Macromolecular Nano Assemblies. Polymers. 2022; 14(3):455. https://doi.org/10.3390/polym14030455
Chicago/Turabian StyleCardil, Andrés, Miguel Palenzuela, Juan F. Vega, and Marta E. G. Mosquera. 2022. "Rheology of Poly(glycidyl methacrylate) Macromolecular Nano Assemblies" Polymers 14, no. 3: 455. https://doi.org/10.3390/polym14030455
APA StyleCardil, A., Palenzuela, M., Vega, J. F., & Mosquera, M. E. G. (2022). Rheology of Poly(glycidyl methacrylate) Macromolecular Nano Assemblies. Polymers, 14(3), 455. https://doi.org/10.3390/polym14030455