
Mechanics of 3D-Printed Polymer Lattices with Varied Design and Processing Strategies


Abstract
1. Introduction
2. Materials and Methods
2.1. Lattice Design
2.2. Build Process
2.3. Dimensional Characterization
2.4. Mechanical Testing
2.5. Design and Process Strategies
3. Results and Discussion
3.1. Fabricated Designs
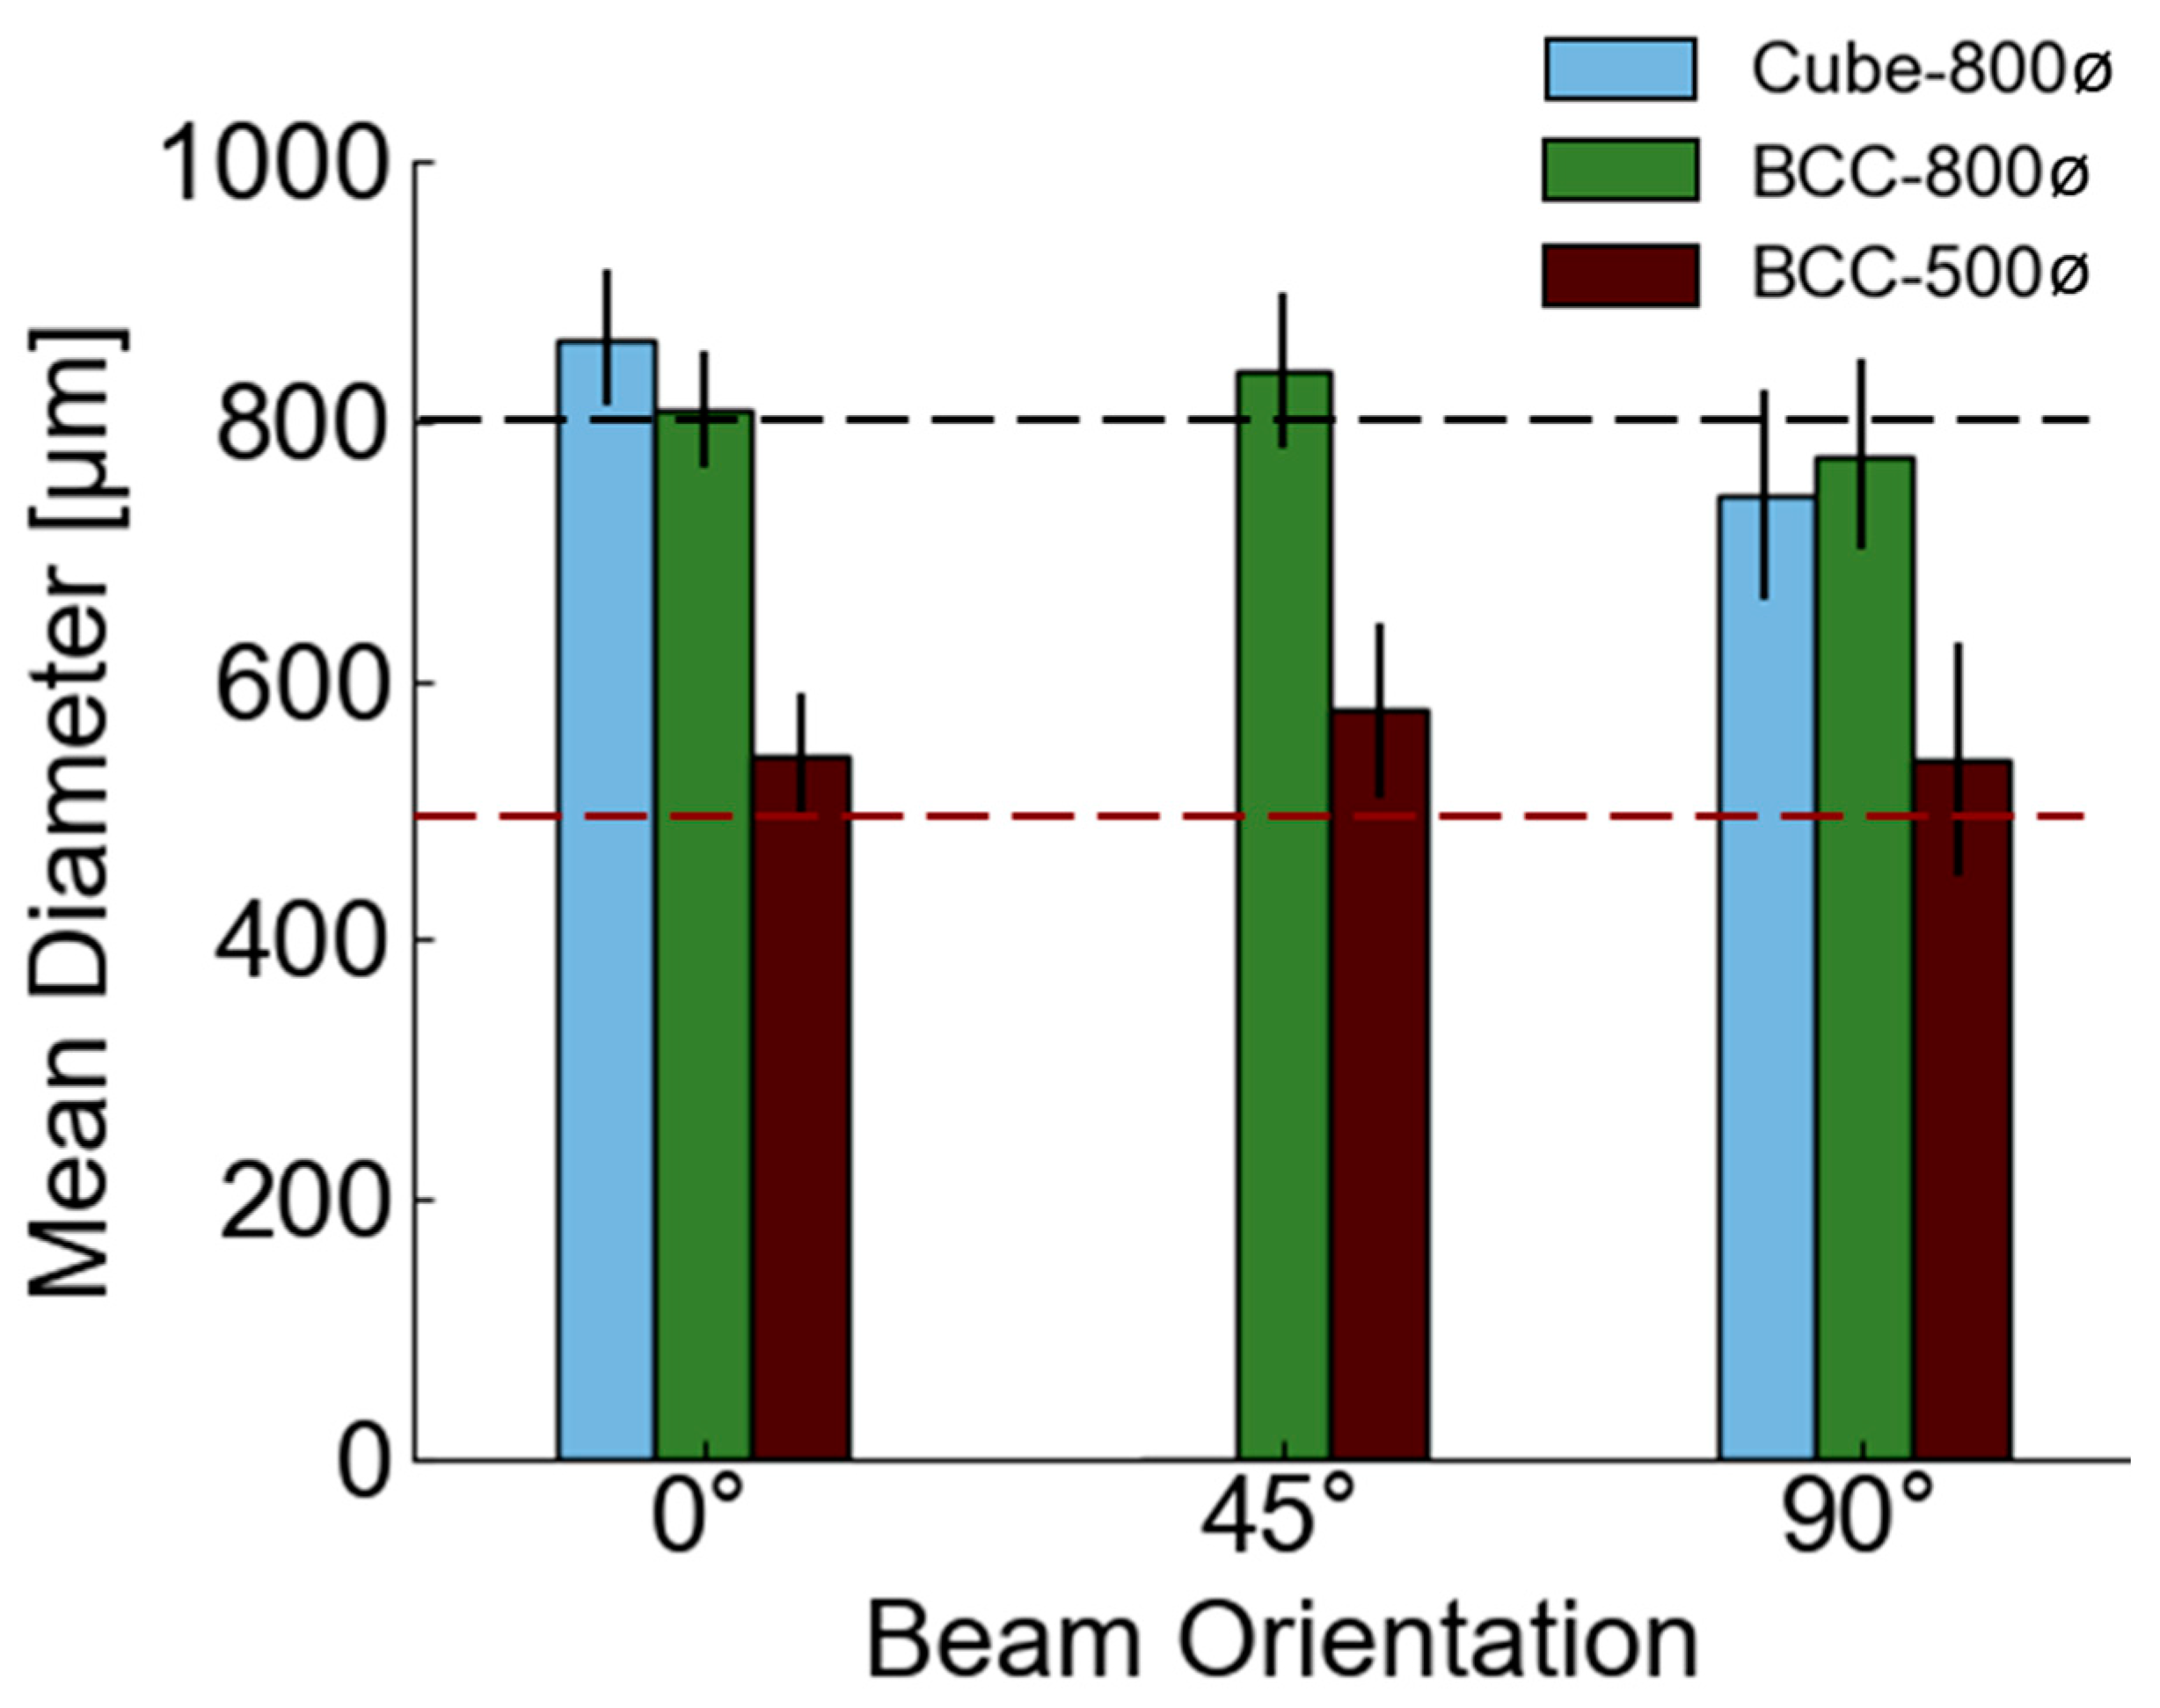
3.2. Microscopic Characterization
3.3. Lattice Mechanics
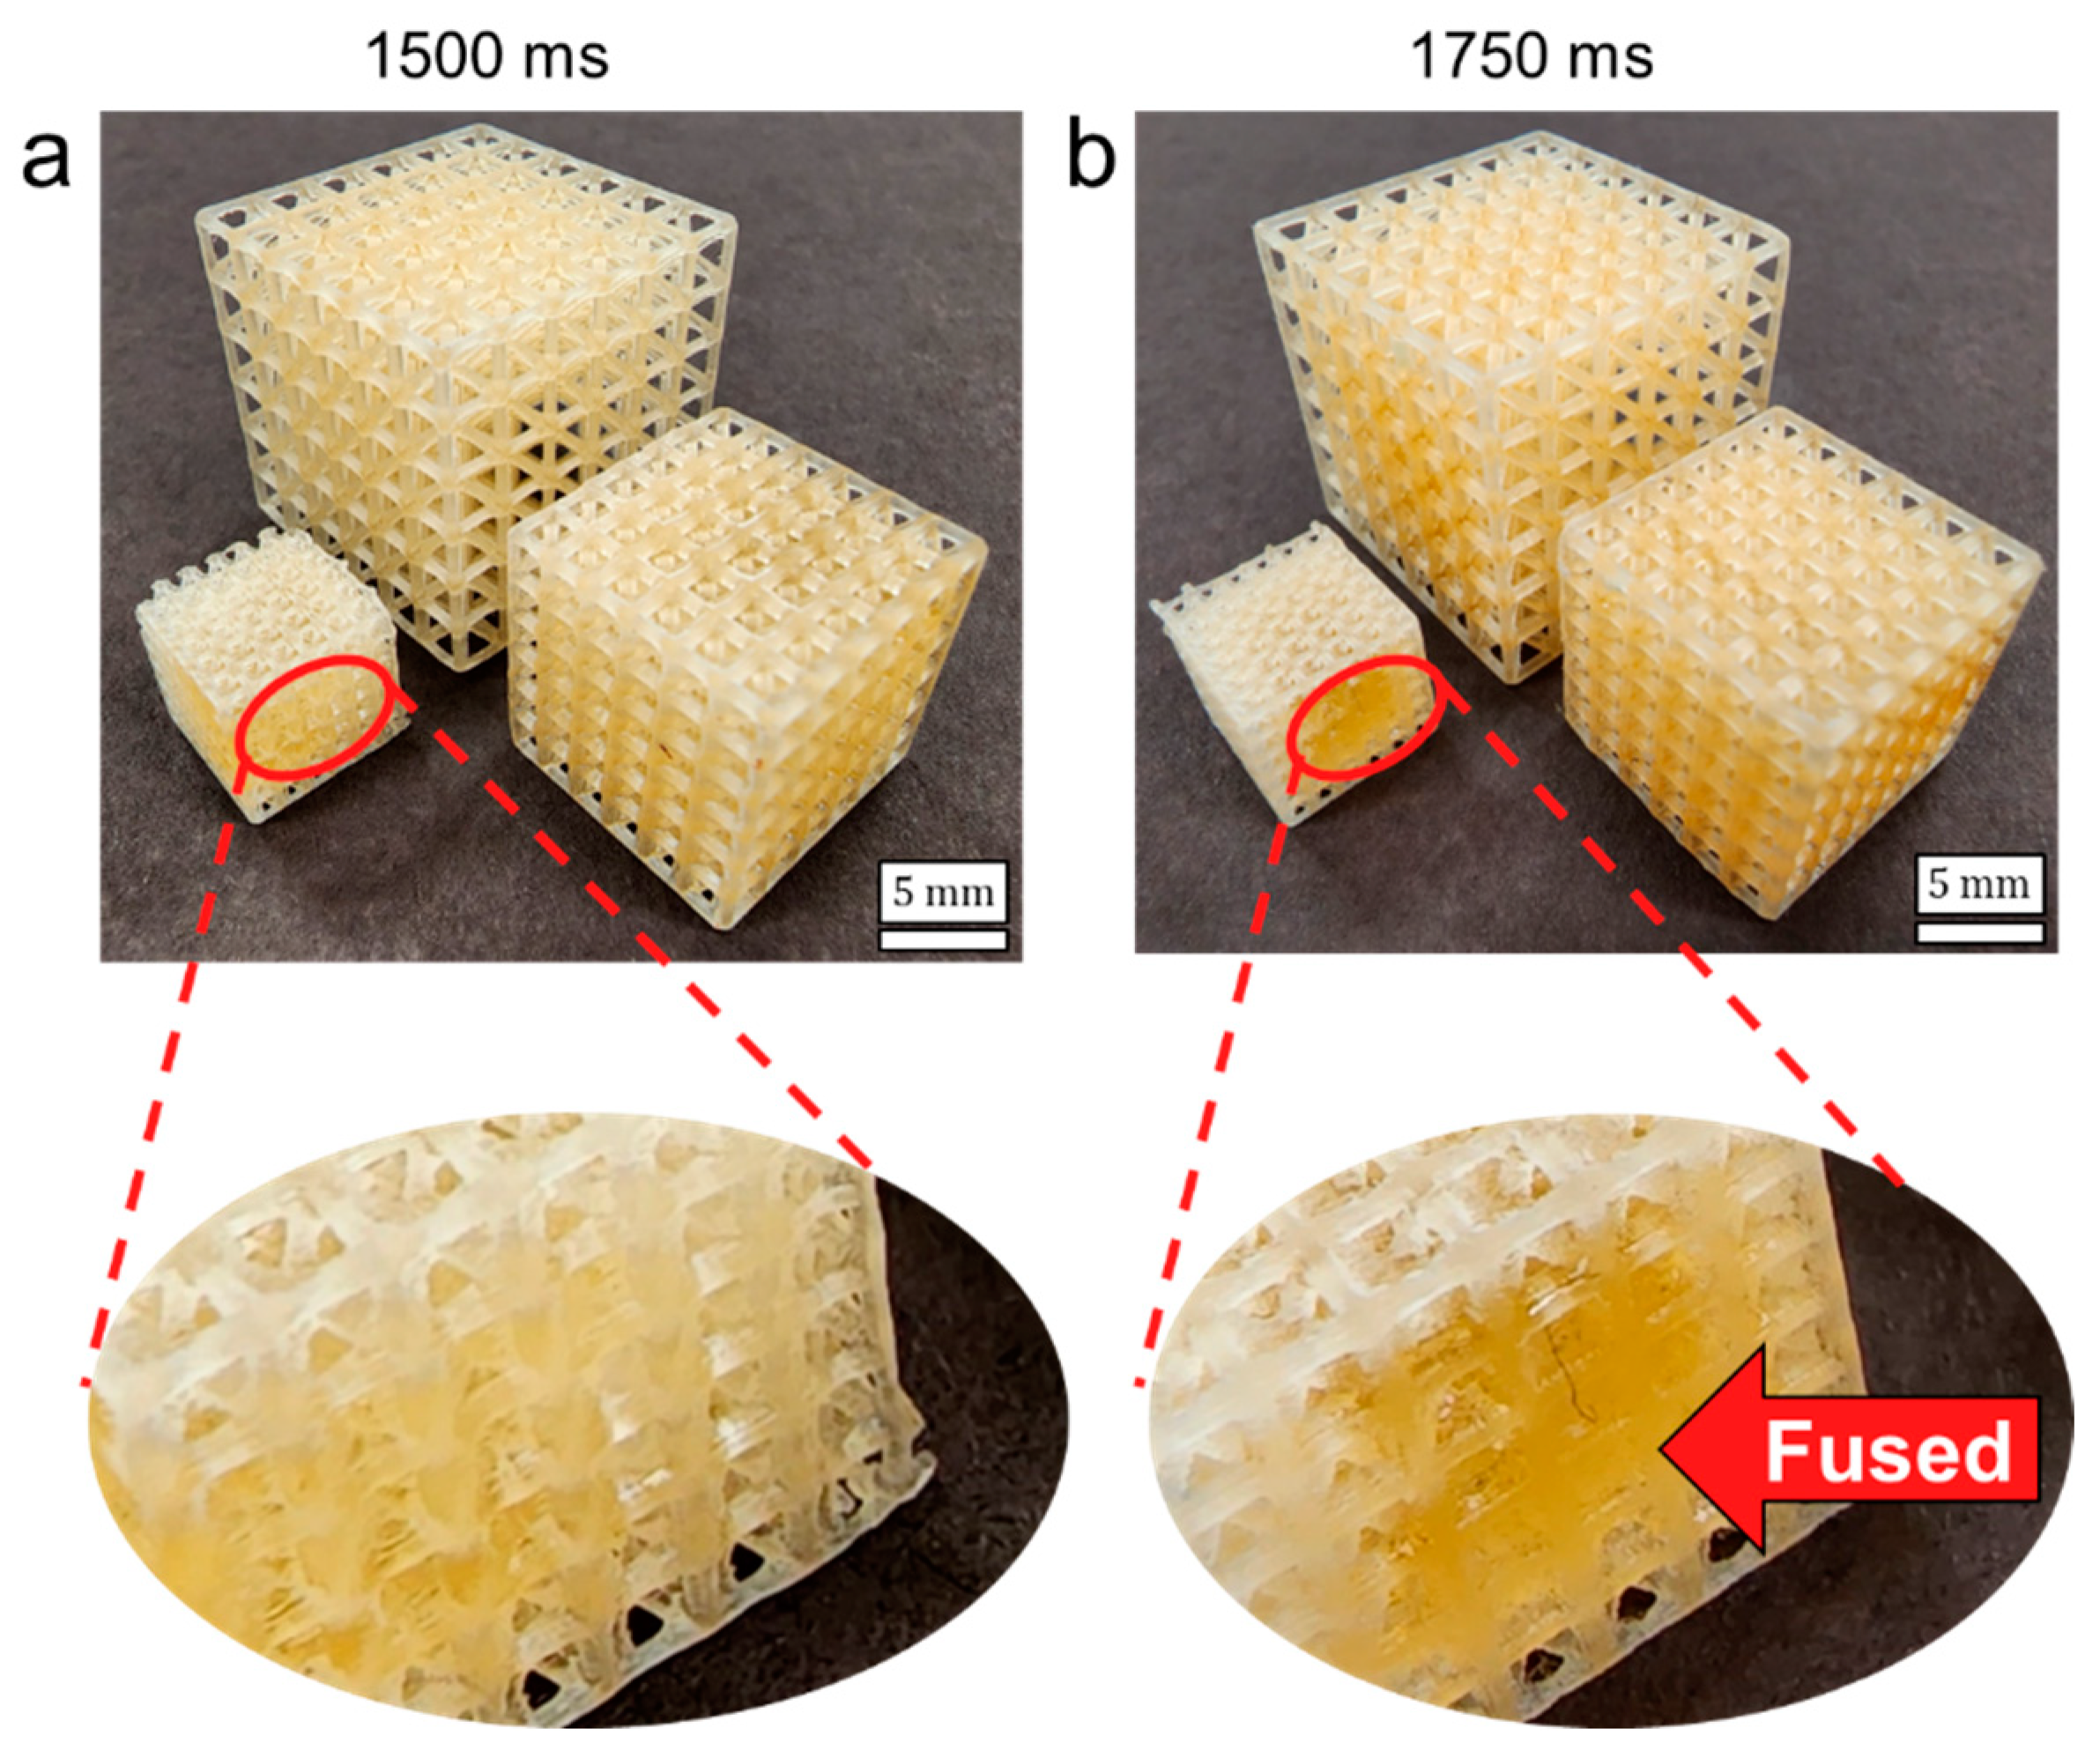
3.4. Process Effects
3.5. Further Discussion
4. Conclusions
Author Contributions
Funding
Conflicts of Interest
References
- Gregg, C.E.; Kim, J.H.; Cheung, K.C. Ultra-Light and Scalable Composite Lattice Materials. Adv. Eng. Mater. 2018, 20, 1800213. [Google Scholar] [CrossRef]
- Zheng, X.; Lee, H.; Weisgraber, T.H.; Shusteff, M.; Deotte, J.; Duoss, E.B.; Kuntz, J.D.; Biener, M.M.; Ge, Q.; Jackson, J.A.; et al. Ultralight, ultrastiff mechanical metamaterials. Science 2014, 344, 1373–1377. [Google Scholar] [CrossRef] [PubMed]
- Thompson, M.K.; Moroni, G.; Vaneker, T.; Fadel, G.; Campbell, R.I.; Gibson, I.; Bernard, A.; Schulz, J.; Graf, P.; Ahuja, B.; et al. Design for Additive Manufacturing: Trends, opportunities, considerations, and constraints. CIRP Ann. Manuf. Technol. 2016, 65, 737–760. [Google Scholar] [CrossRef]
- Arefin, A.M.; Khatri, N.R.; Kulkarni, N.; Egan, P.F. Polymer 3D Printing Review: Materials, Process, and Design Strategies for Medical Applications. Polymers 2021, 13, 1499. [Google Scholar] [CrossRef]
- Rendeki, S.; Nagy, B.; Bene, M.; Pentek, A.; Toth, L.; Szanto, Z.; Told, R.; Maroti, P. An Overview on Personal Protective Equipment (PPE) Fabricated with Additive Manufacturing Technologies in the Era of COVID-19 Pandemic. Polymers 2020, 12, 2703. [Google Scholar] [CrossRef] [PubMed]
- Caserta, G.D.; Iannucci, L.; Galvanetto, U. Shock absorption performance of a motorbike helmet with honeycomb reinforced liner. Compos. Struct. 2011, 93, 2748–2759. [Google Scholar] [CrossRef]
- Egan, P.F.; Bauer, I.; Shea, K.; Ferguson, S.J. Mechanics of Three-Dimensional Printed Lattices for Biomedical Devices. J. Mech. Des. 2019, 141, 031703. [Google Scholar] [CrossRef]
- Wang, S.; Liu, L.; Li, K.; Zhu, L.; Chen, J.; Hao, Y. Pore functionally graded Ti6Al4V scaffolds for bone tissue engineering application. Mater. Des. 2019, 168, 107643. [Google Scholar] [CrossRef]
- Liu, Y.; Zhuo, S.; Xiao, Y.; Zheng, G.; Dong, G.; Zhao, Y.F. Rapid modeling and design optimization of multi-topology lattice structure based on unit-cell library. J. Mech. Des. 2020, 142, 091705. [Google Scholar] [CrossRef]
- Dong, G.; Tang, Y.; Zhao, Y.F. A Survey of Modeling of Lattice Structures Fabricated by Additive Manufacturing. J. Mech. Des. 2017, 139, 100906. [Google Scholar] [CrossRef]
- Gorguluarslan, R.M.; Gandhi, U.N.; Mandapati, R.; Choi, S.-K. Design and fabrication of periodic lattice-based cellular structures. Comput. Aided Des. Appl. 2016, 13, 50–62. [Google Scholar] [CrossRef]
- Gorguluarslan, R.M.; Choi, S.-K.; Saldana, C.J. Uncertainty quantification and validation of 3D lattice scaffolds for computer-aided biomedical applications. J. Mech. Behav. Biomed. Mater. 2017, 71, 428–440. [Google Scholar] [CrossRef]
- Hu, Z.; Mahadevan, S. Uncertainty quantification in prediction of material properties during additive manufacturing. Scr. Mater. 2017, 135, 135–140. [Google Scholar] [CrossRef]
- Keleş, Ö.; Anderson, E.H.; Huynh, J. Mechanical reliability of short carbon fiber reinforced ABS produced via vibration assisted fused deposition modeling. Rapid Prototyp. J. 2018, 24, 1572–1578. [Google Scholar] [CrossRef]
- Jasveer, S.; Jianbin, X. Comparison of different types of 3D printing technologies. Int. J. Sci. Res. Publ. 2018, 8, 1–9. [Google Scholar] [CrossRef]
- Dizon, J.R.C.; Espera, A.H., Jr.; Chen, Q.; Advincula, R.C. Mechanical characterization of 3D-printed polymers. Addit. Manuf. 2018, 20, 44–67. [Google Scholar] [CrossRef]
- Lanzotti, A.; Martorelli, M.; Staiano, G. Understanding process parameter effects of reprap open-source three-dimensional printers through a design of experiments approach. J. Manuf. Sci. Eng. 2015, 137, 011017. [Google Scholar] [CrossRef]
- Buj-Corral, I.; Sánchez-Casas, X.; Luis-Pérez, C.J. Analysis of AM Parameters on Surface Roughness Obtained in PLA Parts Printed with FFF Technology. Polymers 2021, 13, 2384. [Google Scholar] [CrossRef]
- Niinomi, M.; Nakai, M. Titanium-based biomaterials for preventing stress shielding between implant devices and bone. Int. J. Biomater. 2011, 2011, 836587. [Google Scholar] [CrossRef]
- Mullen, L.; Stamp, R.C.; Brooks, W.K.; Jones, E.; Sutcliffe, C.J. Selective Laser Melting: A regular unit cell approach for the manufacture of porous, titanium, bone in-growth constructs, suitable for orthopedic applications. J. Biomed. Mater. Res. B Appl. Biomater. 2009, 89, 325–334. [Google Scholar] [CrossRef]
- Schmidleithner, C.; Kalaskar, D.M. Stereolithography; IntechOpen: London, UK, 2018. [Google Scholar]
- Melchels, F.P.; Bertoldi, K.; Gabbrielli, R.; Velders, A.H.; Feijen, J.; Grijpma, D.W. Mathematically defined tissue engineering scaffold architectures prepared by stereolithography. Biomaterials 2010, 31, 6909–6916. [Google Scholar] [CrossRef] [PubMed]
- Dean, D.; Wallace, J.; Siblani, A.; Wang, M.O.; Kim, K.; Mikos, A.G.; Fisher, J.P. Continuous digital light processing (cDLP): Highly accurate additive manufacturing of tissue engineered bone scaffolds: This paper highlights the main issues regarding the application of Continuous Digital Light Processing (cDLP) for the production of highly accurate PPF scaffolds with layers as thin as 60 μm for bone tissue engineering. Virtual Phys. Prototyp. 2012, 7, 13–24. [Google Scholar] [PubMed]
- Moon, W.; Kim, S.; Lim, B.-S.; Park, Y.-S.; Kim, R.J.-Y.; Chung, S.H. Dimensional accuracy evaluation of temporary dental restorations with different 3D printing systems. Materials 2021, 14, 1487. [Google Scholar] [CrossRef] [PubMed]
- Dikova, T.; Dzhendov, D.; Ivanov, D.; Bliznakova, K. Dimensional accuracy and surface roughness of polymeric dental bridges produced by different 3D printing processes. Arch. Mater. Sci. Eng. 2018, 94, 65–75. [Google Scholar] [CrossRef]
- Unkovskiy, A.; Schmidt, F.; Beuer, F.; Li, P.; Spintzyk, S.; Fernandez, P.K. Stereolithography vs. direct light processing for rapid manufacturing of complete denture bases: An in vitro accuracy analysis. J. Clin. Med. 2021, 10, 1070. [Google Scholar] [CrossRef]
- Woodward, I.R.; Fromen, C.A. Scalable, process-oriented beam lattices: Generation, characterization, and compensation for open cellular structures. Addit. Manuf. 2021, 48, 102386. [Google Scholar] [CrossRef]
- Gibson, L.J. Cellular solids. Mrs Bull. 2003, 28, 270–274. [Google Scholar] [CrossRef]
- Gibson, L.J.; Ashby, M.F. Cellular Solids: Structure and Properties; Cambridge University Press: Cambridge, UK, 1999. [Google Scholar]
- Maiti, A.; Small, W.; Lewicki, J.P.; Weisgraber, T.H.; Duoss, E.B.; Chinn, S.C.; Pearson, M.A.; Spadaccini, C.M.; Maxwell, R.S.; Wilson, T.S. 3D printed cellular solid outperforms traditional stochastic foam in long-term mechanical response. Sci. Rep. 2016, 6, 24871. [Google Scholar] [CrossRef]
- Mei, H.; Tan, Y.; Huang, W.; Chang, P.; Fan, Y.; Cheng, L. Structure design influencing the mechanical performance of 3D printing porous ceramics. Ceram. Int. 2021, 47, 8389–8397. [Google Scholar] [CrossRef]
- Alghamdi, A.; Maconachie, T.; Downing, D.; Brandt, M.; Qian, M.; Leary, M. Effect of additive manufactured lattice defects on mechanical properties: An automated method for the enhancement of lattice geometry. Int. J. Adv. Manuf. Technol. 2020, 108, 957–971. [Google Scholar] [CrossRef]
- Yu, X.; Zhou, J.; Liang, H.; Jiang, Z.; Wu, L. Mechanical metamaterials associated with stiffness, rigidity and compressibility: A brief review. Prog. Mater. Sci. 2018, 94, 114–173. [Google Scholar] [CrossRef]
- Bogusz, P.; Popławski, A.; Stankiewicz, M.; Kowalski, B. Experimental Research of Selected Lattice Structures Developed with 3D Printing Technology. Materials 2022, 15, 378. [Google Scholar] [CrossRef]
- Limmahakhun, S.; Oloyede, A.; Sitthiseripratip, K.; Xiao, Y.; Yan, C. 3D-printed cellular structures for bone biomimetic implants. Addit. Manuf. 2017, 15, 93–101. [Google Scholar] [CrossRef]
- Egan, P.; Wang, X.; Greutert, H.; Shea, K.; Wuertz-Kozak, K.; Ferguson, S. Mechanical and Biological Characterization of 3D Printed Lattices. 3D Print. Addit. Manuf. 2019, 2, 73–81. [Google Scholar] [CrossRef]
- Dong, G.; Wijaya, G.; Tang, Y.; Zhao, Y.F. Optimizing process parameters of fused deposition modeling by Taguchi method for the fabrication of lattice structures. Addit. Manuf. 2018, 19, 62–72. [Google Scholar] [CrossRef]
- Lubombo, C.; Huneault, M.A. Effect of infill patterns on the mechanical performance of lightweight 3D-printed cellular PLA parts. Mater. Today Commun. 2018, 17, 214–228. [Google Scholar] [CrossRef]
- Wang, Y.; Li, X.; Chen, Y.; Zhang, C. Strain rate dependent mechanical properties of 3D printed polymer materials using the DLP technique. Addit. Manuf. 2021, 47, 102368. [Google Scholar] [CrossRef]
- Shen, M.; Qin, W.; Xing, B.; Zhao, W.; Gao, S.; Sun, Y.; Jiao, T.; Zhao, Z. Mechanical properties of 3D printed ceramic cellular materials with triply periodic minimal surface architectures. J. Eur. Ceram. Soc. 2021, 41, 1481–1489. [Google Scholar] [CrossRef]
- Kulkarni, N.N.; Ekwaro-Osire, S.; Egan, P.F. Fabrication, Mechanics, and Reliability Analysis for Three-Dimensional Printed Lattice Designs. ASCE-ASME J. Risk Uncertain. Eng. Syst. B Mech. Eng. 2021, 8, 011107. [Google Scholar] [CrossRef]
- Moniruzzaman, M.; O’Neal, C.; Bhuiyan, A.; Egan, P.F. Design and Mechanical Testing of 3D Printed Hierarchical Lattices Using Biocompatible Stereolithography. Designs 2020, 4, 22. [Google Scholar] [CrossRef]
- Arefin, A.M.; Lahowetz, M.; Egan, P.F. Simulated tissue growth in tetragonal lattices with mechanical stiffness tuned for bone tissue engineering. Comput. Biol. Med. 2021, 138, 104913. [Google Scholar] [CrossRef] [PubMed]
- Ashby, M. The properties of foams and lattices. Philos. Trans. R. Soc. A Math. Phys. Eng. Sci. 2006, 364, 15–30. [Google Scholar] [CrossRef] [PubMed]
- Arabnejad, S.; Johnston, R.B.; Pura, J.A.; Singh, B.; Tanzer, M.; Pasini, D. High-strength porous biomaterials for bone replacement: A strategy to assess the interplay between cell morphology, mechanical properties, bone ingrowth and manufacturing constraints. Acta Biomater. 2016, 30, 345–356. [Google Scholar] [CrossRef] [PubMed]
- Egan, P.F.; Gonella, V.C.; Engensperger, M.; Ferguson, S.J.; Shea, K. Computationally designed lattices with tuned properties for tissue engineering using 3D printing. PLoS ONE 2017, 12, e0182902. [Google Scholar] [CrossRef] [PubMed]
- Miller, A.T.; Safranski, D.L.; Wood, C.; Guldberg, R.E.; Gall, K. Deformation and fatigue of tough 3D printed elastomer scaffolds processed by fused deposition modeling and continuous liquid interface production. J. Mech. Behav. Biomed. Mater. 2017, 75, 1–13. [Google Scholar] [CrossRef]
- Silva, R.G.; Torres, M.J.; Viñuela, J.Z.; Zamora, A.G. Manufacturing and Characterization of 3D Miniature Polymer Lattice Structures Using Fused Filament Fabrication. Polymers 2021, 13, 635. [Google Scholar] [CrossRef]
- Ravari, M.K.; Kadkhodaei, M.; Badrossamay, M.; Rezaei, R. Numerical investigation on mechanical properties of cellular lattice structures fabricated by fused deposition modeling. Int. J. Mech. Sci. 2014, 88, 154–161. [Google Scholar] [CrossRef]
- Bai, L.; Yi, C.; Chen, X.; Sun, Y.; Zhang, J. Effective Design of the Graded Strut of BCC Lattice Structure for Improving Mechanical Properties. Materials 2019, 12, 2192. [Google Scholar] [CrossRef]
- Du Plessis, A.; Yadroitsev, I.; Yadroitsava, I.; Le Roux, S.G. X-ray microcomputed tomography in additive manufacturing: A review of the current technology and applications. 3D Print. Addit. Manuf. 2018, 5, 227–247. [Google Scholar] [CrossRef]
- Zeng, C.; Liu, L.; Bian, W.; Leng, J.; Liu, Y. Compression behavior and energy absorption of 3D printed continuous fiber reinforced composite honeycomb structures with shape memory effects. Addit. Manuf. 2021, 38, 101842. [Google Scholar] [CrossRef]
- Jin, N.; Wang, F.; Wang, Y.; Zhang, B.; Cheng, H.; Zhang, H. Failure and energy absorption characteristics of four lattice structures under dynamic loading. Mater. Des. 2019, 169, 107655. [Google Scholar] [CrossRef]


| Design | Mean Measurements (± Standard Deviation) | ||||||
|---|---|---|---|---|---|---|---|
| Name | Unit Cell Topology | Unit Cell Length [mm] | Beam Diameter [µm] | Lattice Height/Length [mm] | Lattice Height [mm] | Lattice Length [mm] | Relative Density |
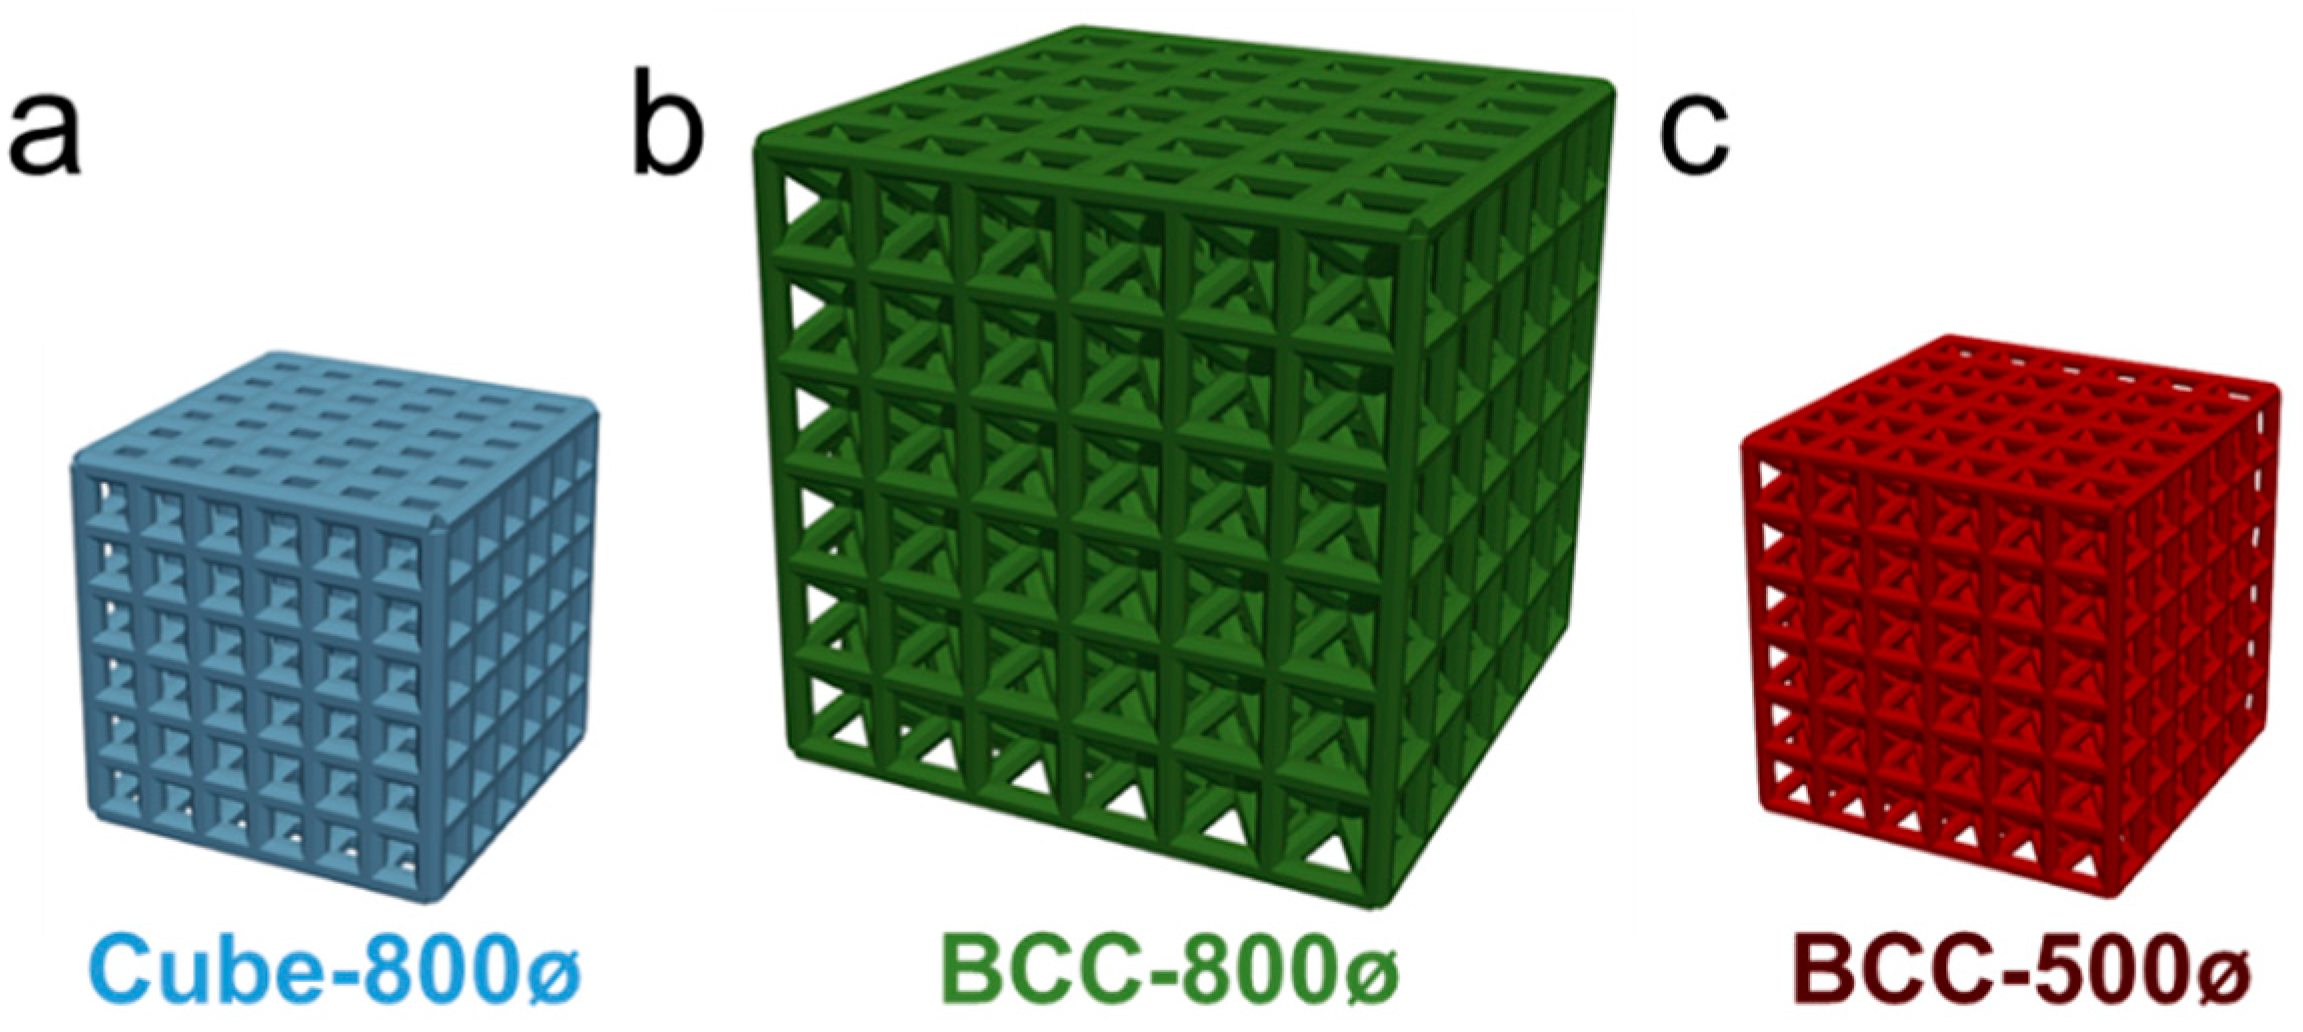
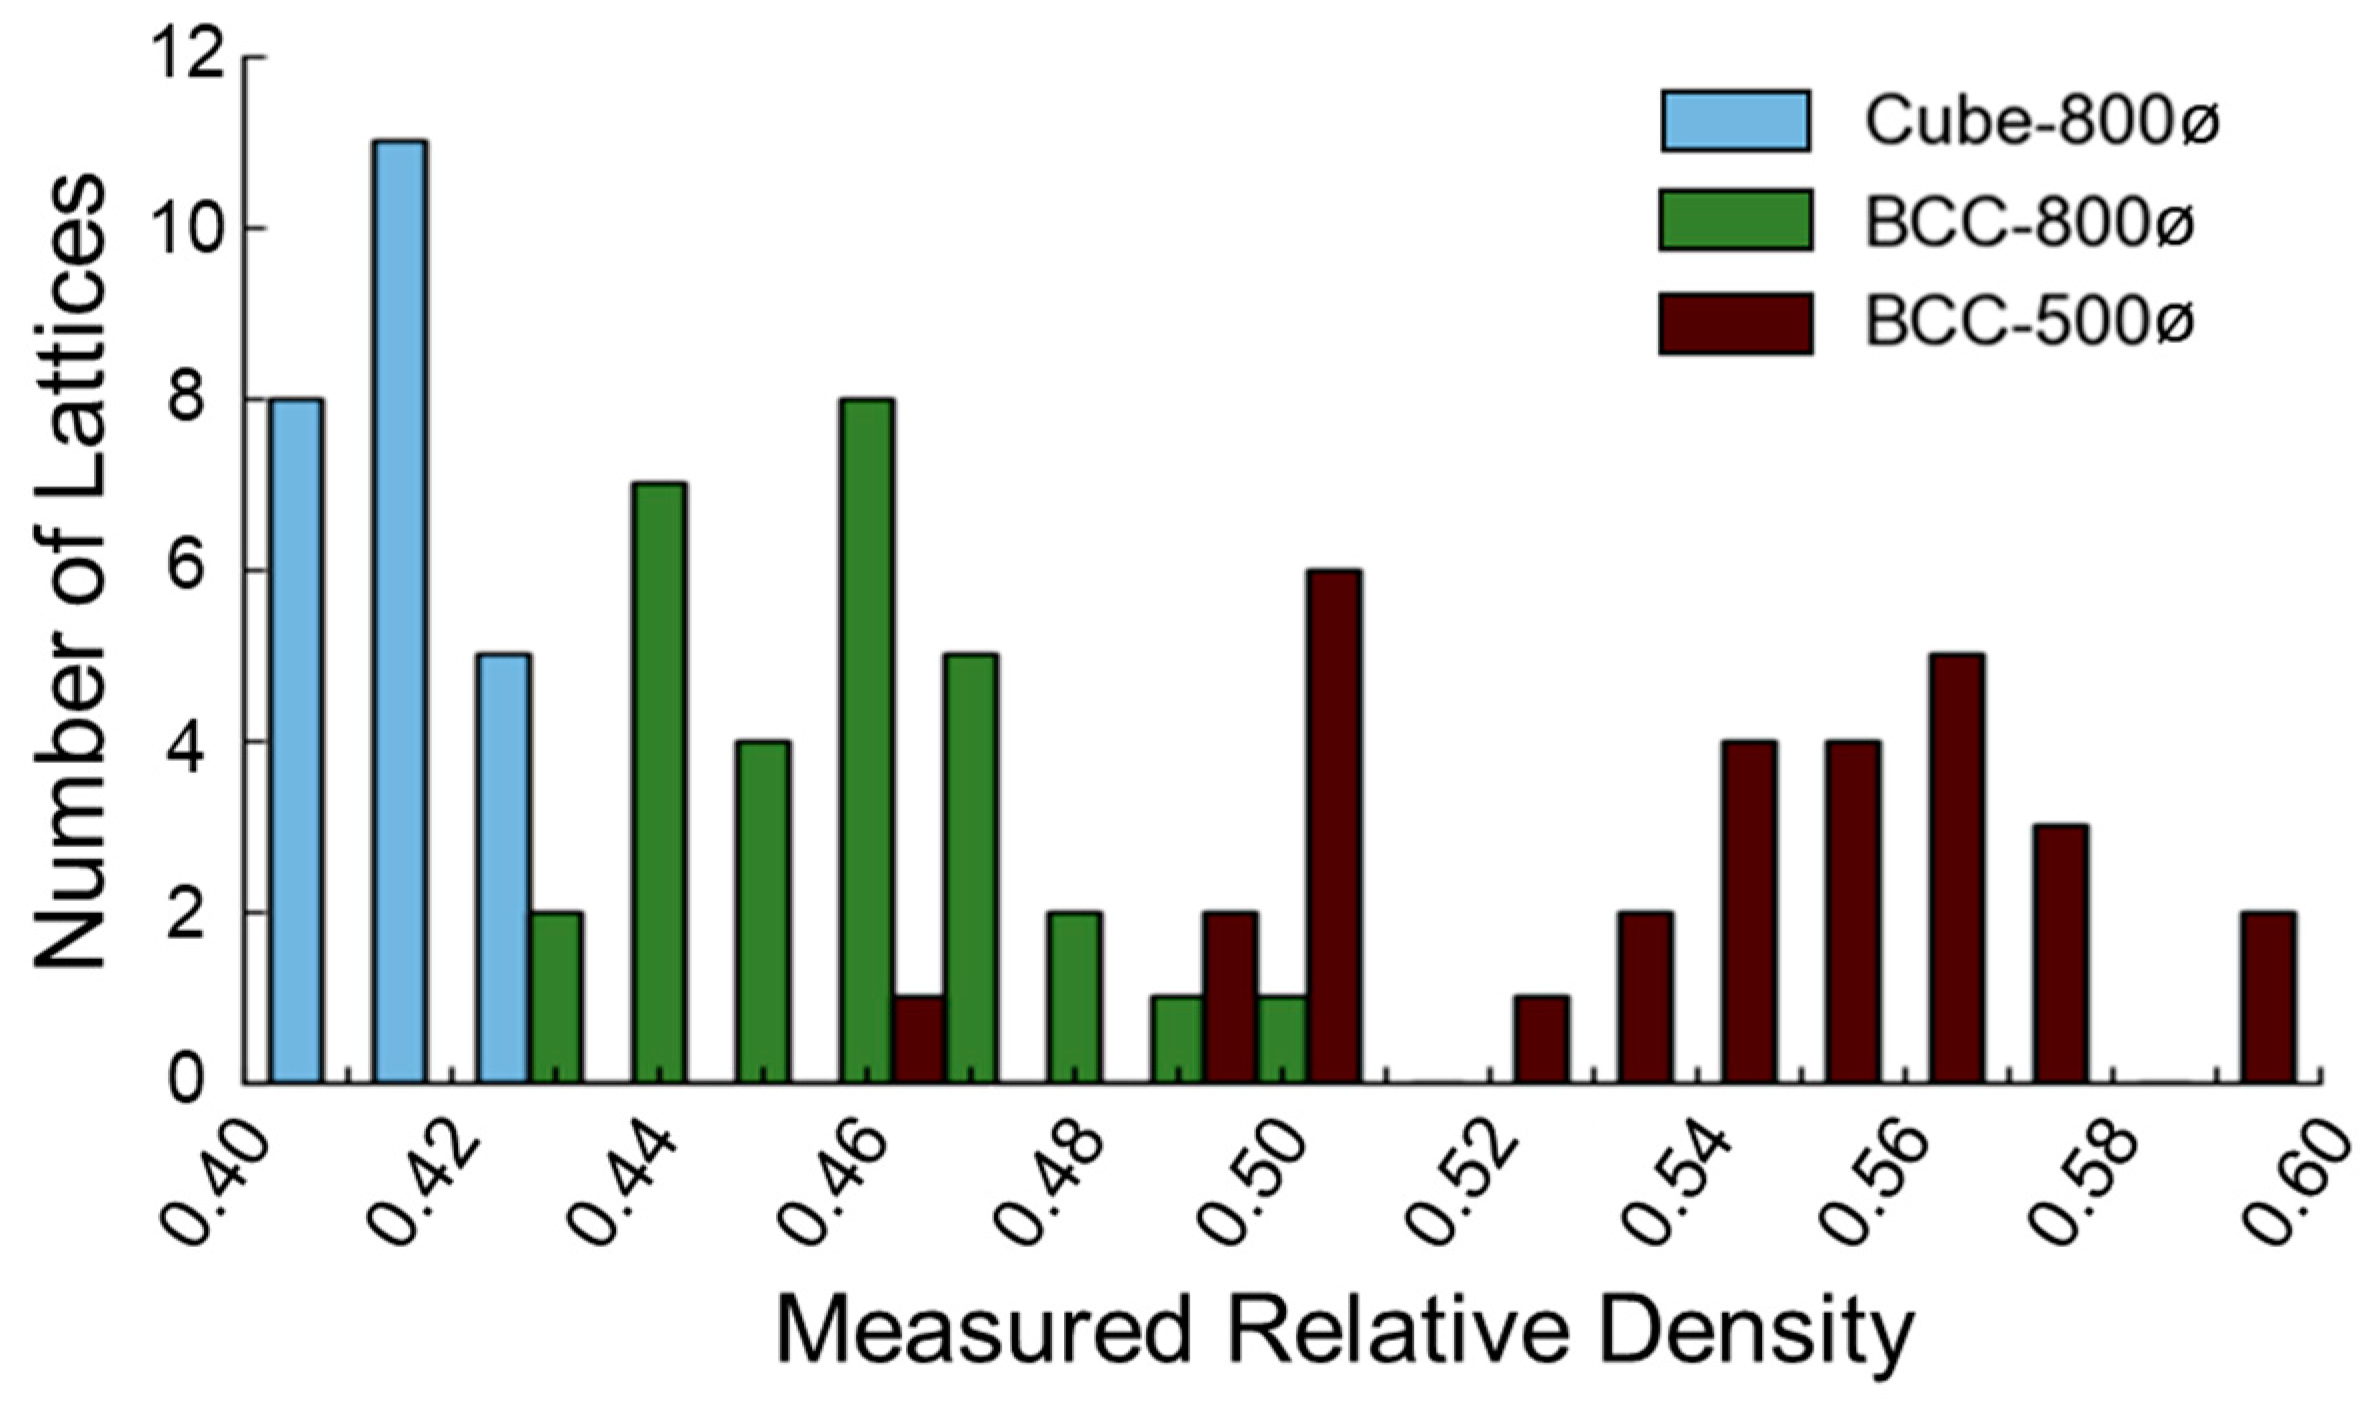
| Cube-800ø | Cube | 1.8 | 800 | 11.6 | 11.8 ± 0.06 | 11.8 ± 0.05 | 0.42 ± 0.01 |
| BCC-800ø | BCC | 3.1 | 800 | 19.4 | 19.5 ± 0.10 | 19.6 ± 0.09 | 0.46 ± 0.02 |
| BCC-500ø | BCC | 1.9 | 500 | 11.9 | 11.9 ± 0.07 | 12.0 ± 0.10 | 0.54 ± 0.03 |
| Design | Property p* | m | c | R2 |
|---|---|---|---|---|
| Em Ys Us | 641 | 64.0 | 0.02 | |
| Cube-800ø | 19.4 | 2.6 | 0.02 | |
| 98.1 | −20.8 | 0.39 | ||
| Em Ys Us | 1116 | −239.2 | 0.49 | |
| BCC-800ø | 42.9 | −10.7 | 0.60 | |
| 66.0 | −16.4 | 0.70 | ||
| Em Ys Us | 765 | −96.7 | 0.33 | |
| BCC-500ø | 26.3 | −3.8 | 0.34 | |
| 194.6 | −73.1 | 0.66 |
| Design | Process | Mean Measurements (± Standard Deviation) | |||||
|---|---|---|---|---|---|---|---|
| Name | Relative Density | Unit Cell Length [mm] | Layer Exposure Time [ms] | Relative Density | Elastic Modulus [MPa] | Yield Strength [MPa] | Ultimate Strength [MPa] |
| 0.5 | 2.3 | 1500 | 0.60 ± 0.02 | 222 ± 38 | 7.1 ± 1.1 | 27 ± 3.6 | |
| 0.4 | 1.9 | 1500 | 0.39 ± 0.02 | 157 ± 10 | 4.7 ± 0.4 | 11 ± 1.3 | |
| 0.3 | 1.6 | 1500 | 0.30 ± 0.01 | 71 ± 8 | 2.3 ± 0.2 | 5 ± 0.1 | |
| 0.5 | 2.3 | 1750 | 0.68 ± 0.01 | 517 ± 22 | 16.3 ± 0.1 | 36 ± 2.2 | |
| 0.4 | 1.9 | 1750 | 0.51 ± 0.01 | 351 ± 12 | 9.8 ± 0.4 | 28 ± 2.5 | |
| 0.3 | 1.6 | 1750 | 0.32 ± 0.01 | 84 ± 7 | 2.4 ± 0.2 | 6 ± 0.6 | |
| Layer Exposure Time | Property p* | m | c | R2 |
|---|---|---|---|---|
| Em Ys Us | 471 | −52.3 | 0.78 | |
| 1500 ms | 15.5 | −1.9 | 0.85 | |
| 73.9 | −17.5 | 0.97 | ||
| Em Ys Us | 1222 | −297 | 0.99 | |
| 1750 ms | 38.9 | −10.1 | 0.99 | |
| 86.9 | −20.5 | 0.95 |
Publisher’s Note: MDPI stays neutral with regard to jurisdictional claims in published maps and institutional affiliations. |
© 2022 by the authors. Licensee MDPI, Basel, Switzerland. This article is an open access article distributed under the terms and conditions of the Creative Commons Attribution (CC BY) license (https://creativecommons.org/licenses/by/4.0/).
Share and Cite
Egan, P.F.; Khatri, N.R.; Parab, M.A.; Arefin, A.M.E. Mechanics of 3D-Printed Polymer Lattices with Varied Design and Processing Strategies. Polymers 2022, 14, 5515. https://doi.org/10.3390/polym14245515
Egan PF, Khatri NR, Parab MA, Arefin AME. Mechanics of 3D-Printed Polymer Lattices with Varied Design and Processing Strategies. Polymers. 2022; 14(24):5515. https://doi.org/10.3390/polym14245515
Chicago/Turabian StyleEgan, Paul F., Nava Raj Khatri, Manasi Anil Parab, and Amit M. E. Arefin. 2022. "Mechanics of 3D-Printed Polymer Lattices with Varied Design and Processing Strategies" Polymers 14, no. 24: 5515. https://doi.org/10.3390/polym14245515
APA StyleEgan, P. F., Khatri, N. R., Parab, M. A., & Arefin, A. M. E. (2022). Mechanics of 3D-Printed Polymer Lattices with Varied Design and Processing Strategies. Polymers, 14(24), 5515. https://doi.org/10.3390/polym14245515