

Structural Breakdown of Collagen Type I Elastin Blend Polymerization


Abstract
1. Introduction
2. Experiments
2.1. Hydrogel Preparation
2.2. UV/VIS Plate Reader Experiments
2.3. Zeta Potential
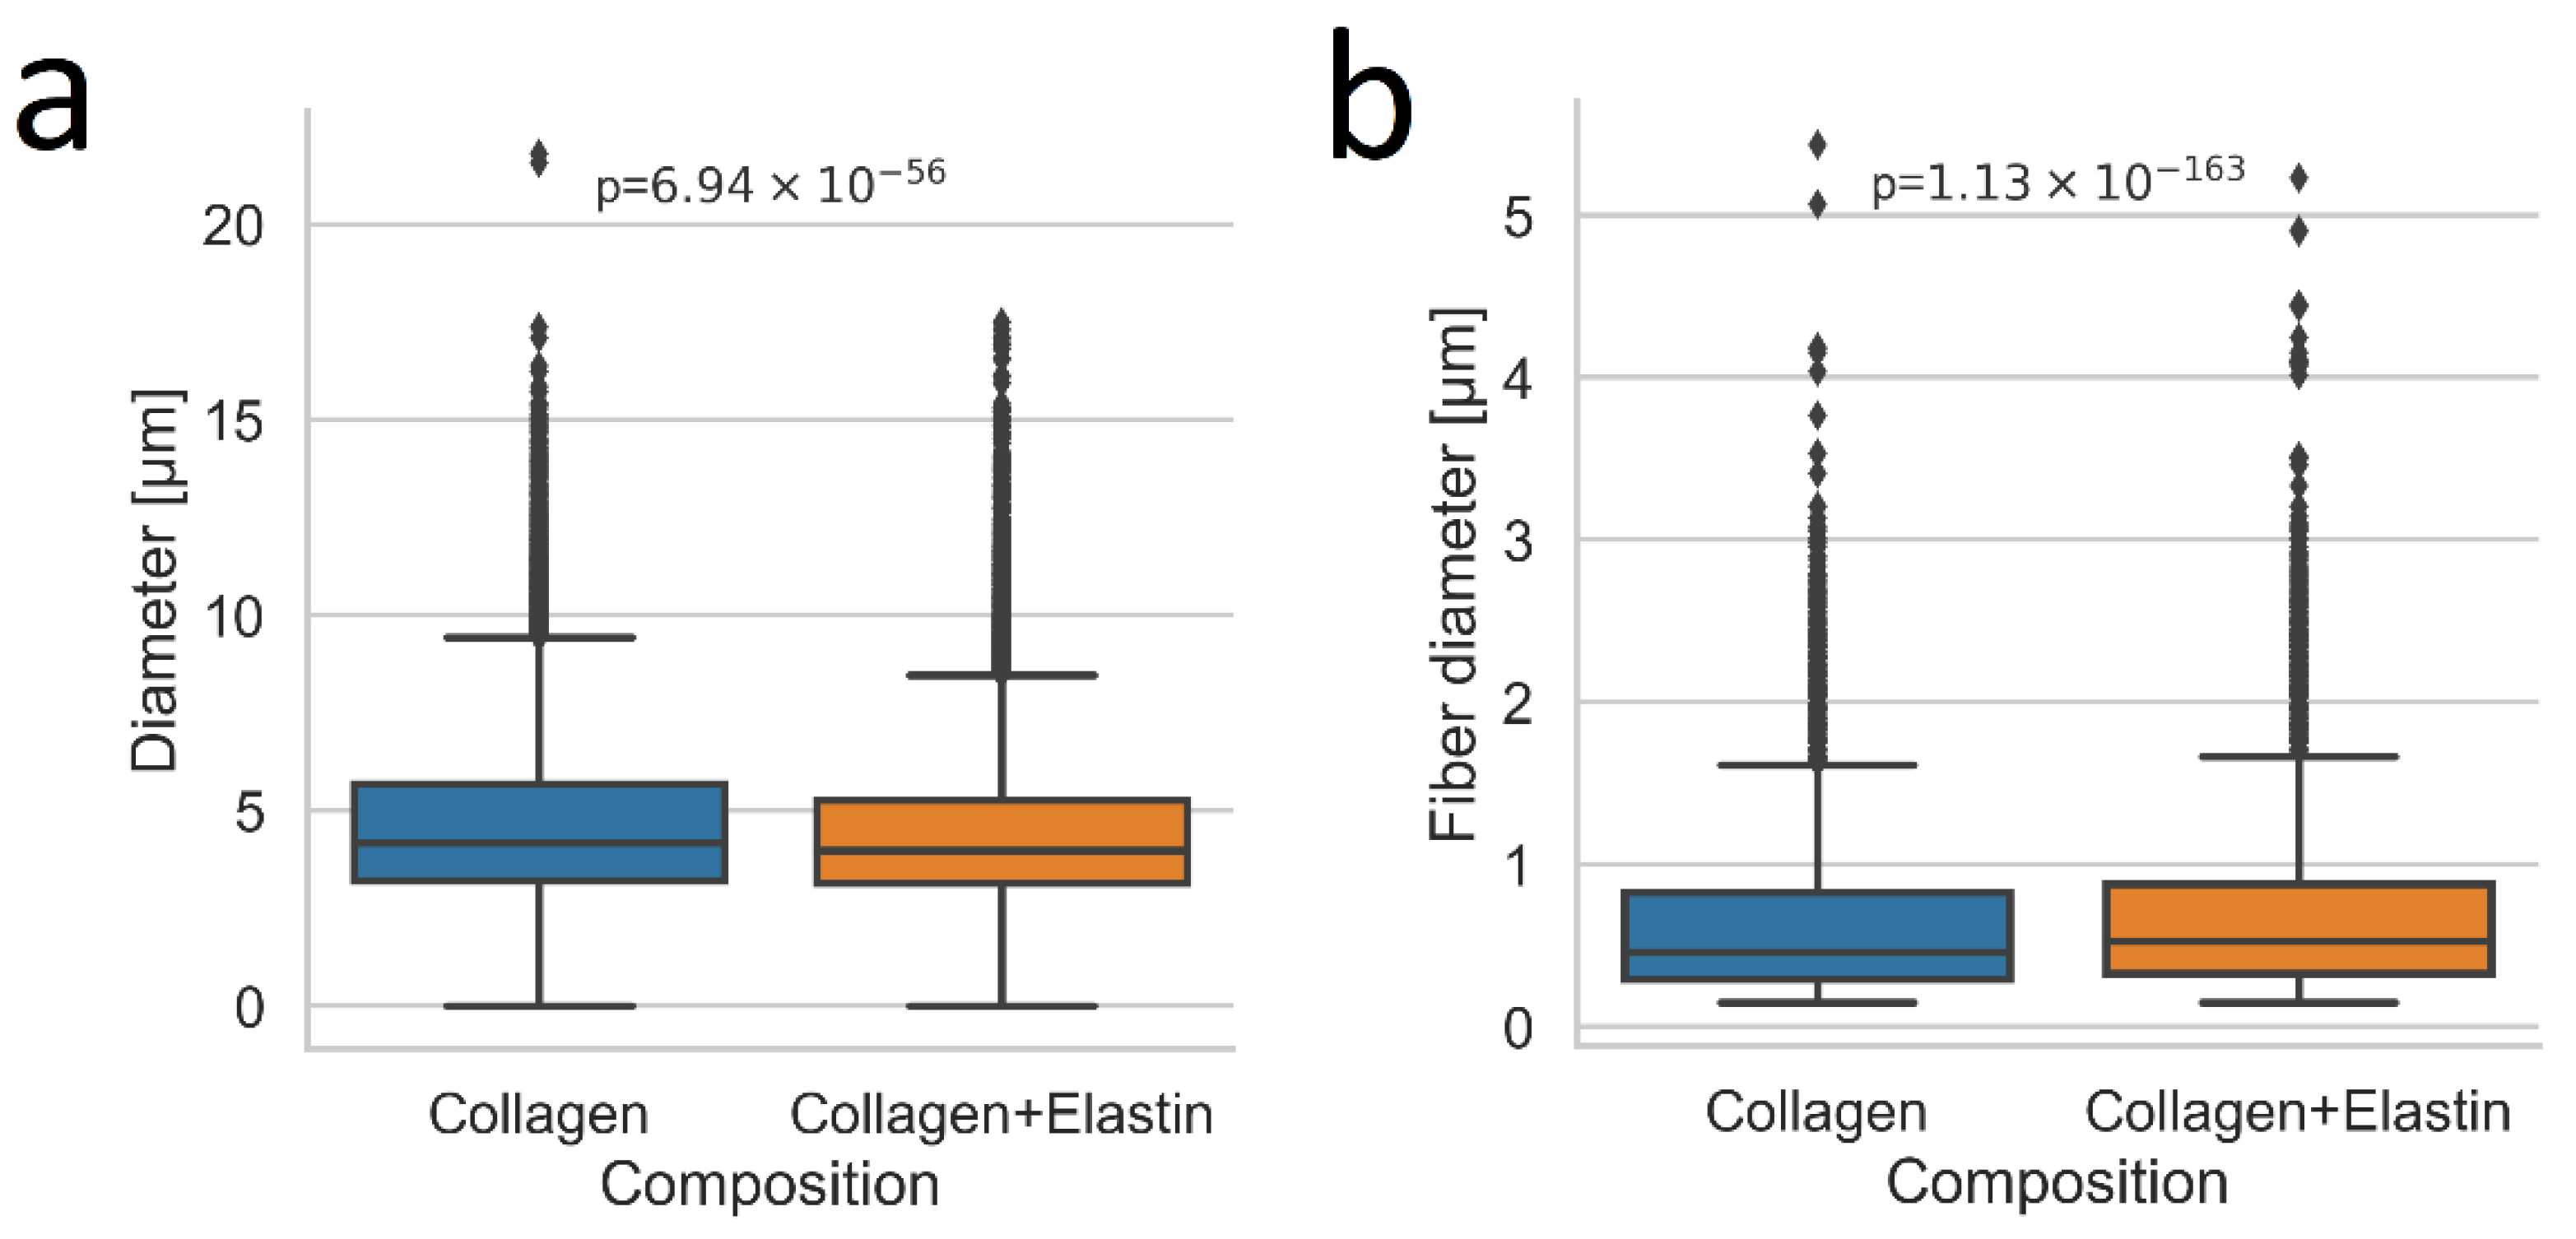
2.4. Pore size and Fiber Diameter
2.5. Directionality
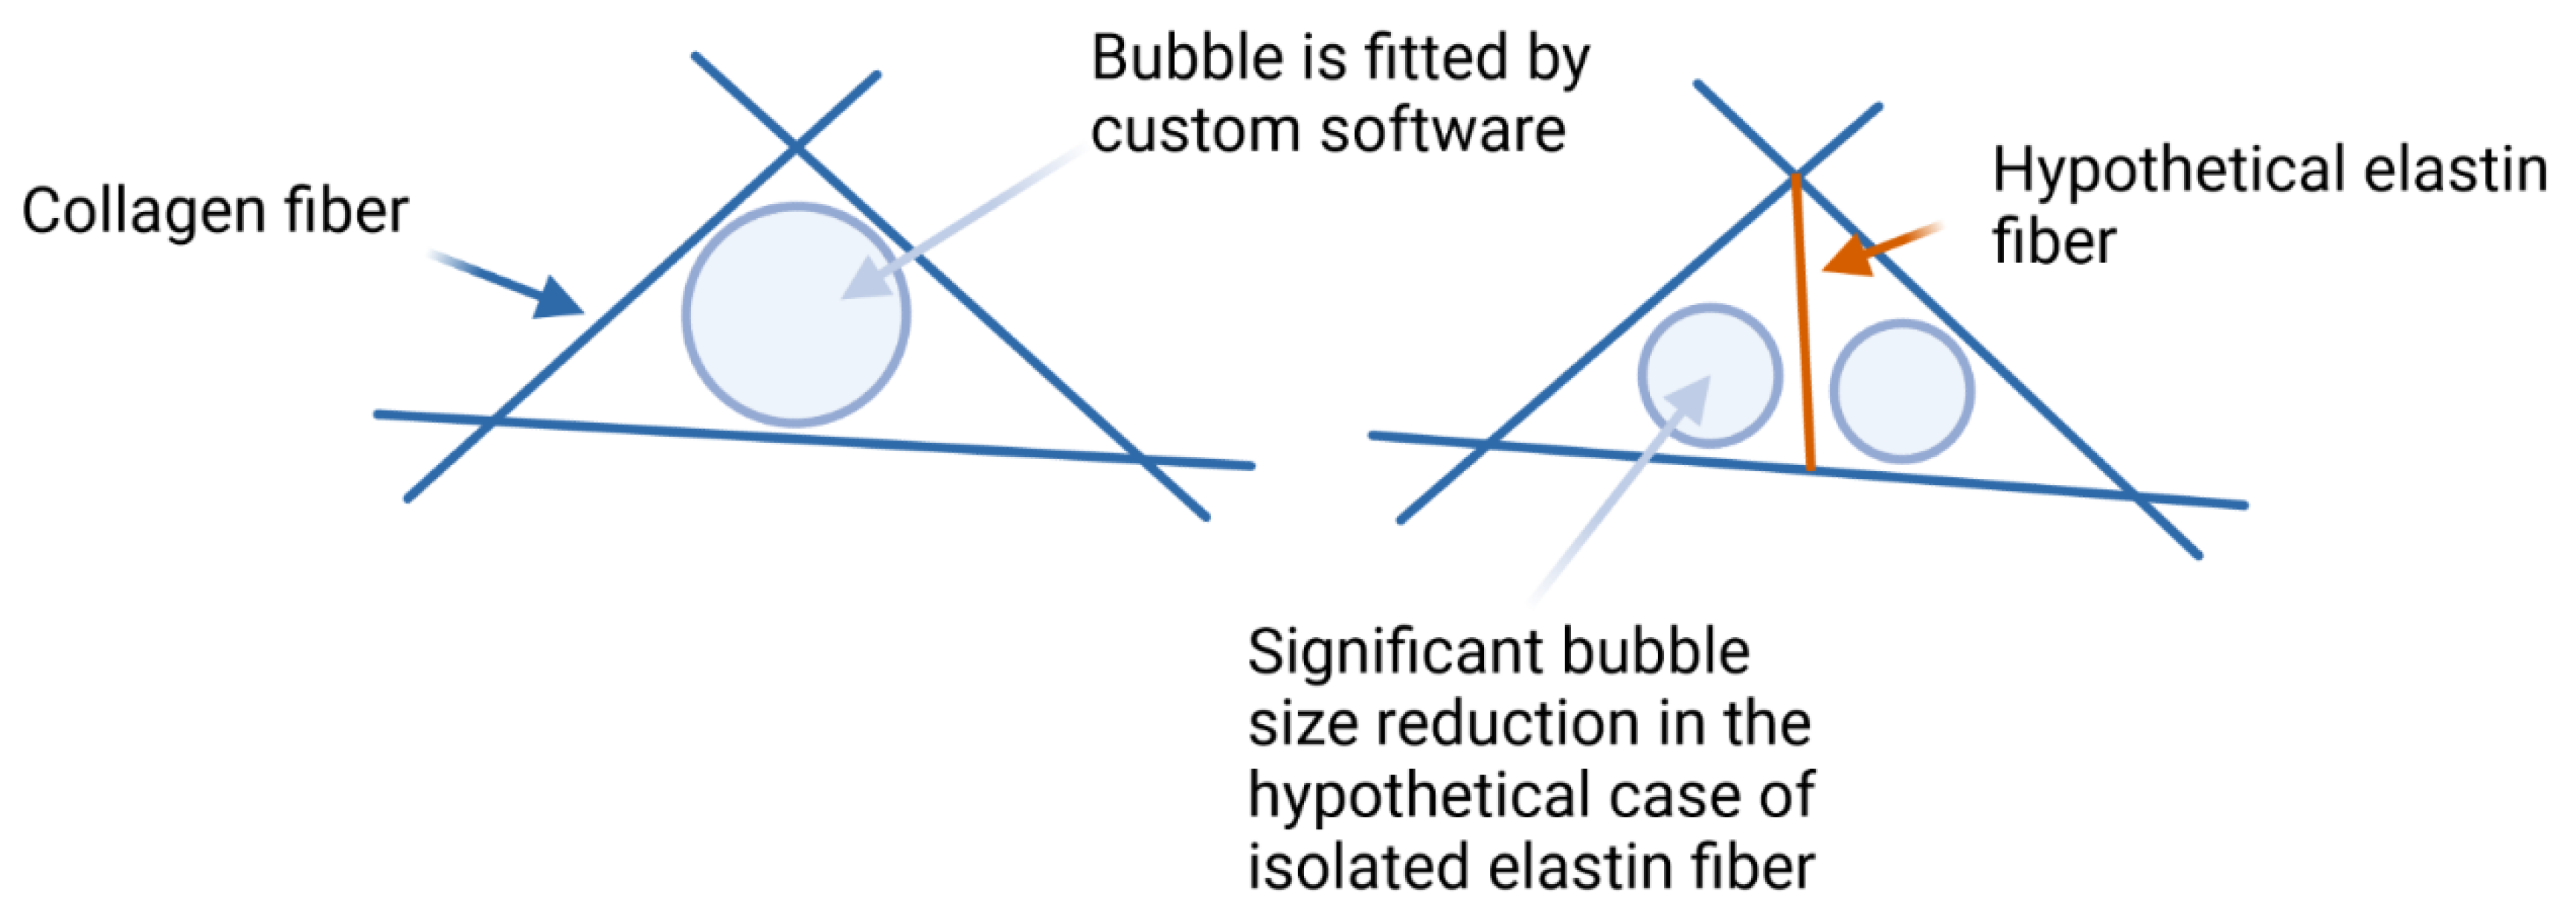
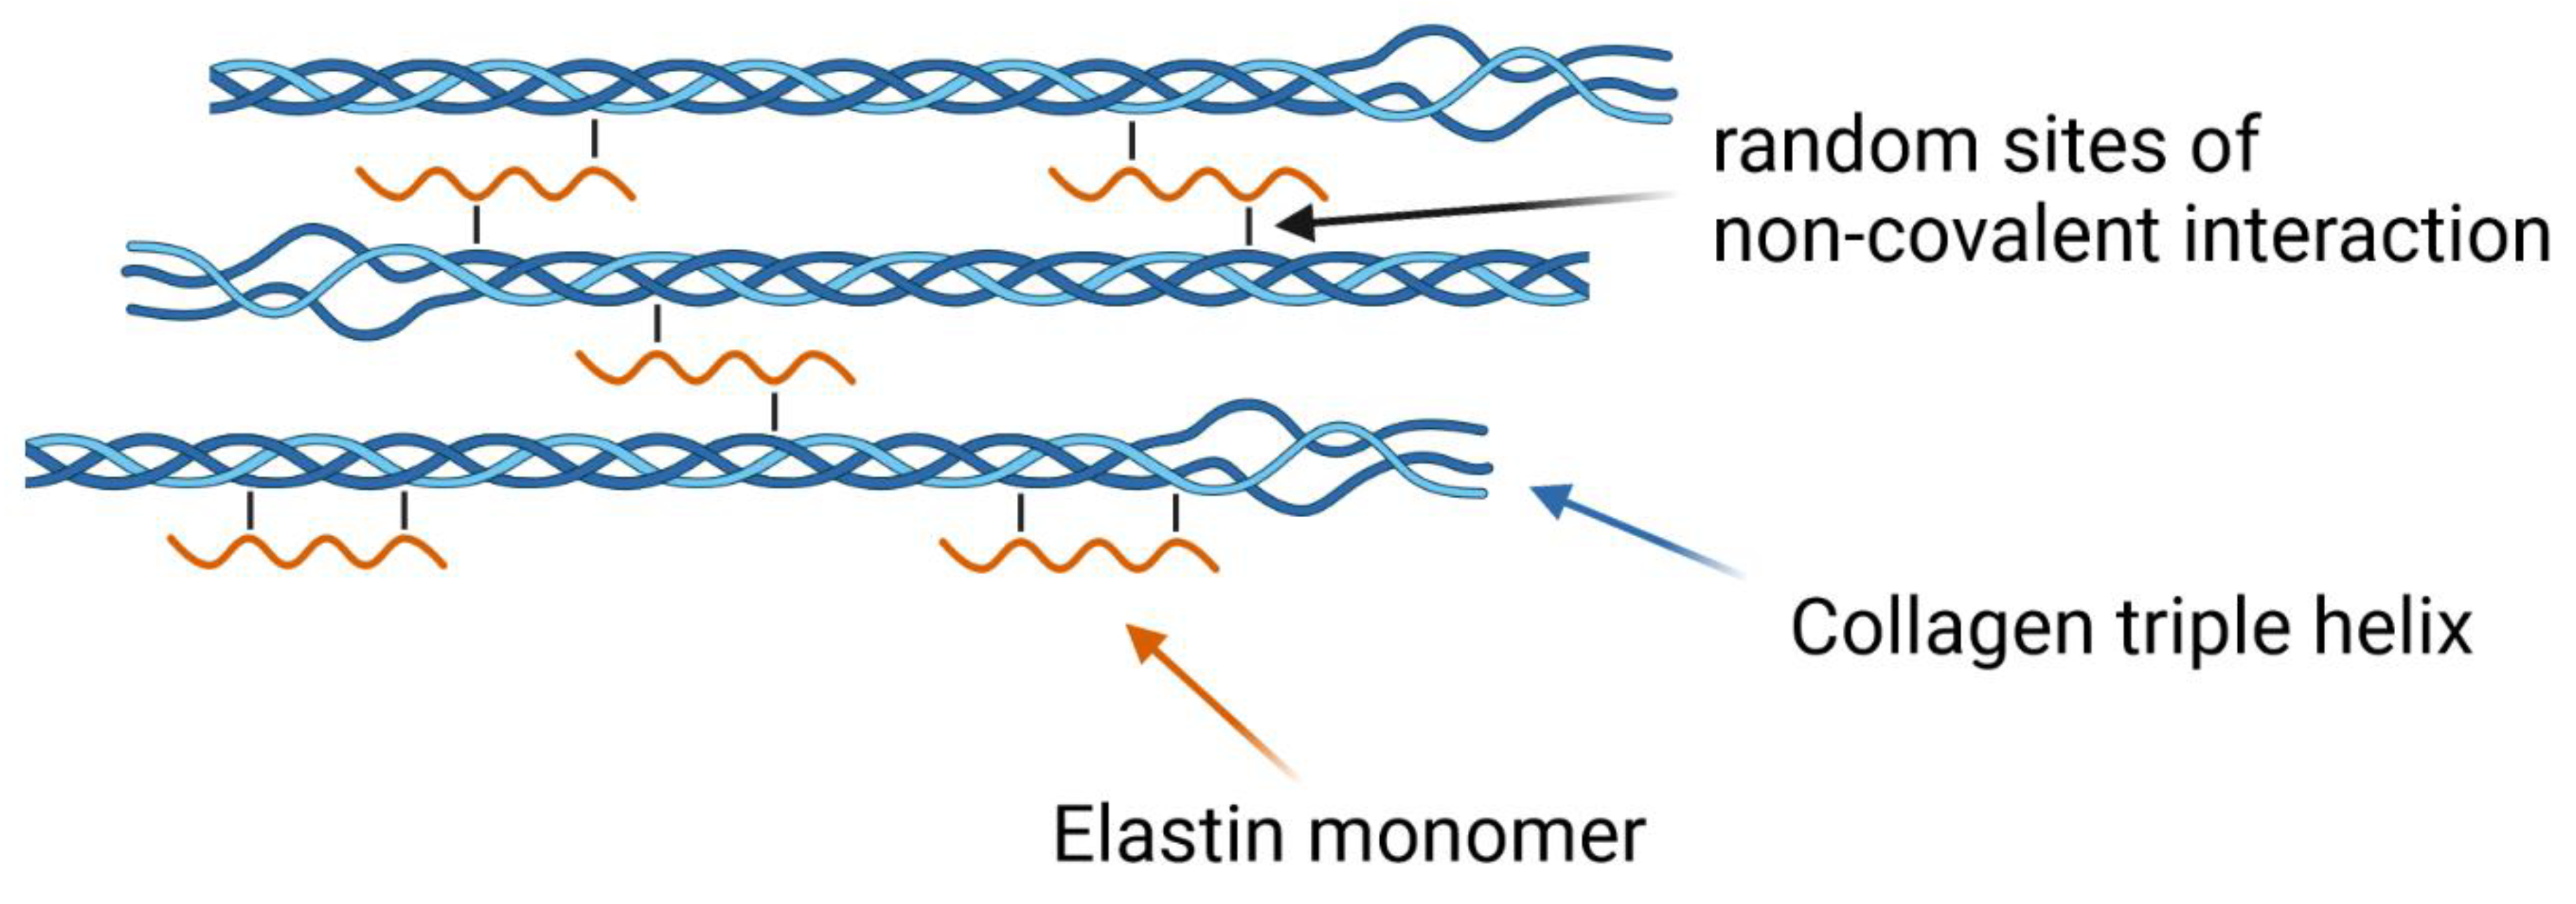
2.6. Elastin Influence on the Network Structure
2.7. Live Polymerization
2.8. Statistical Methods
3. Results
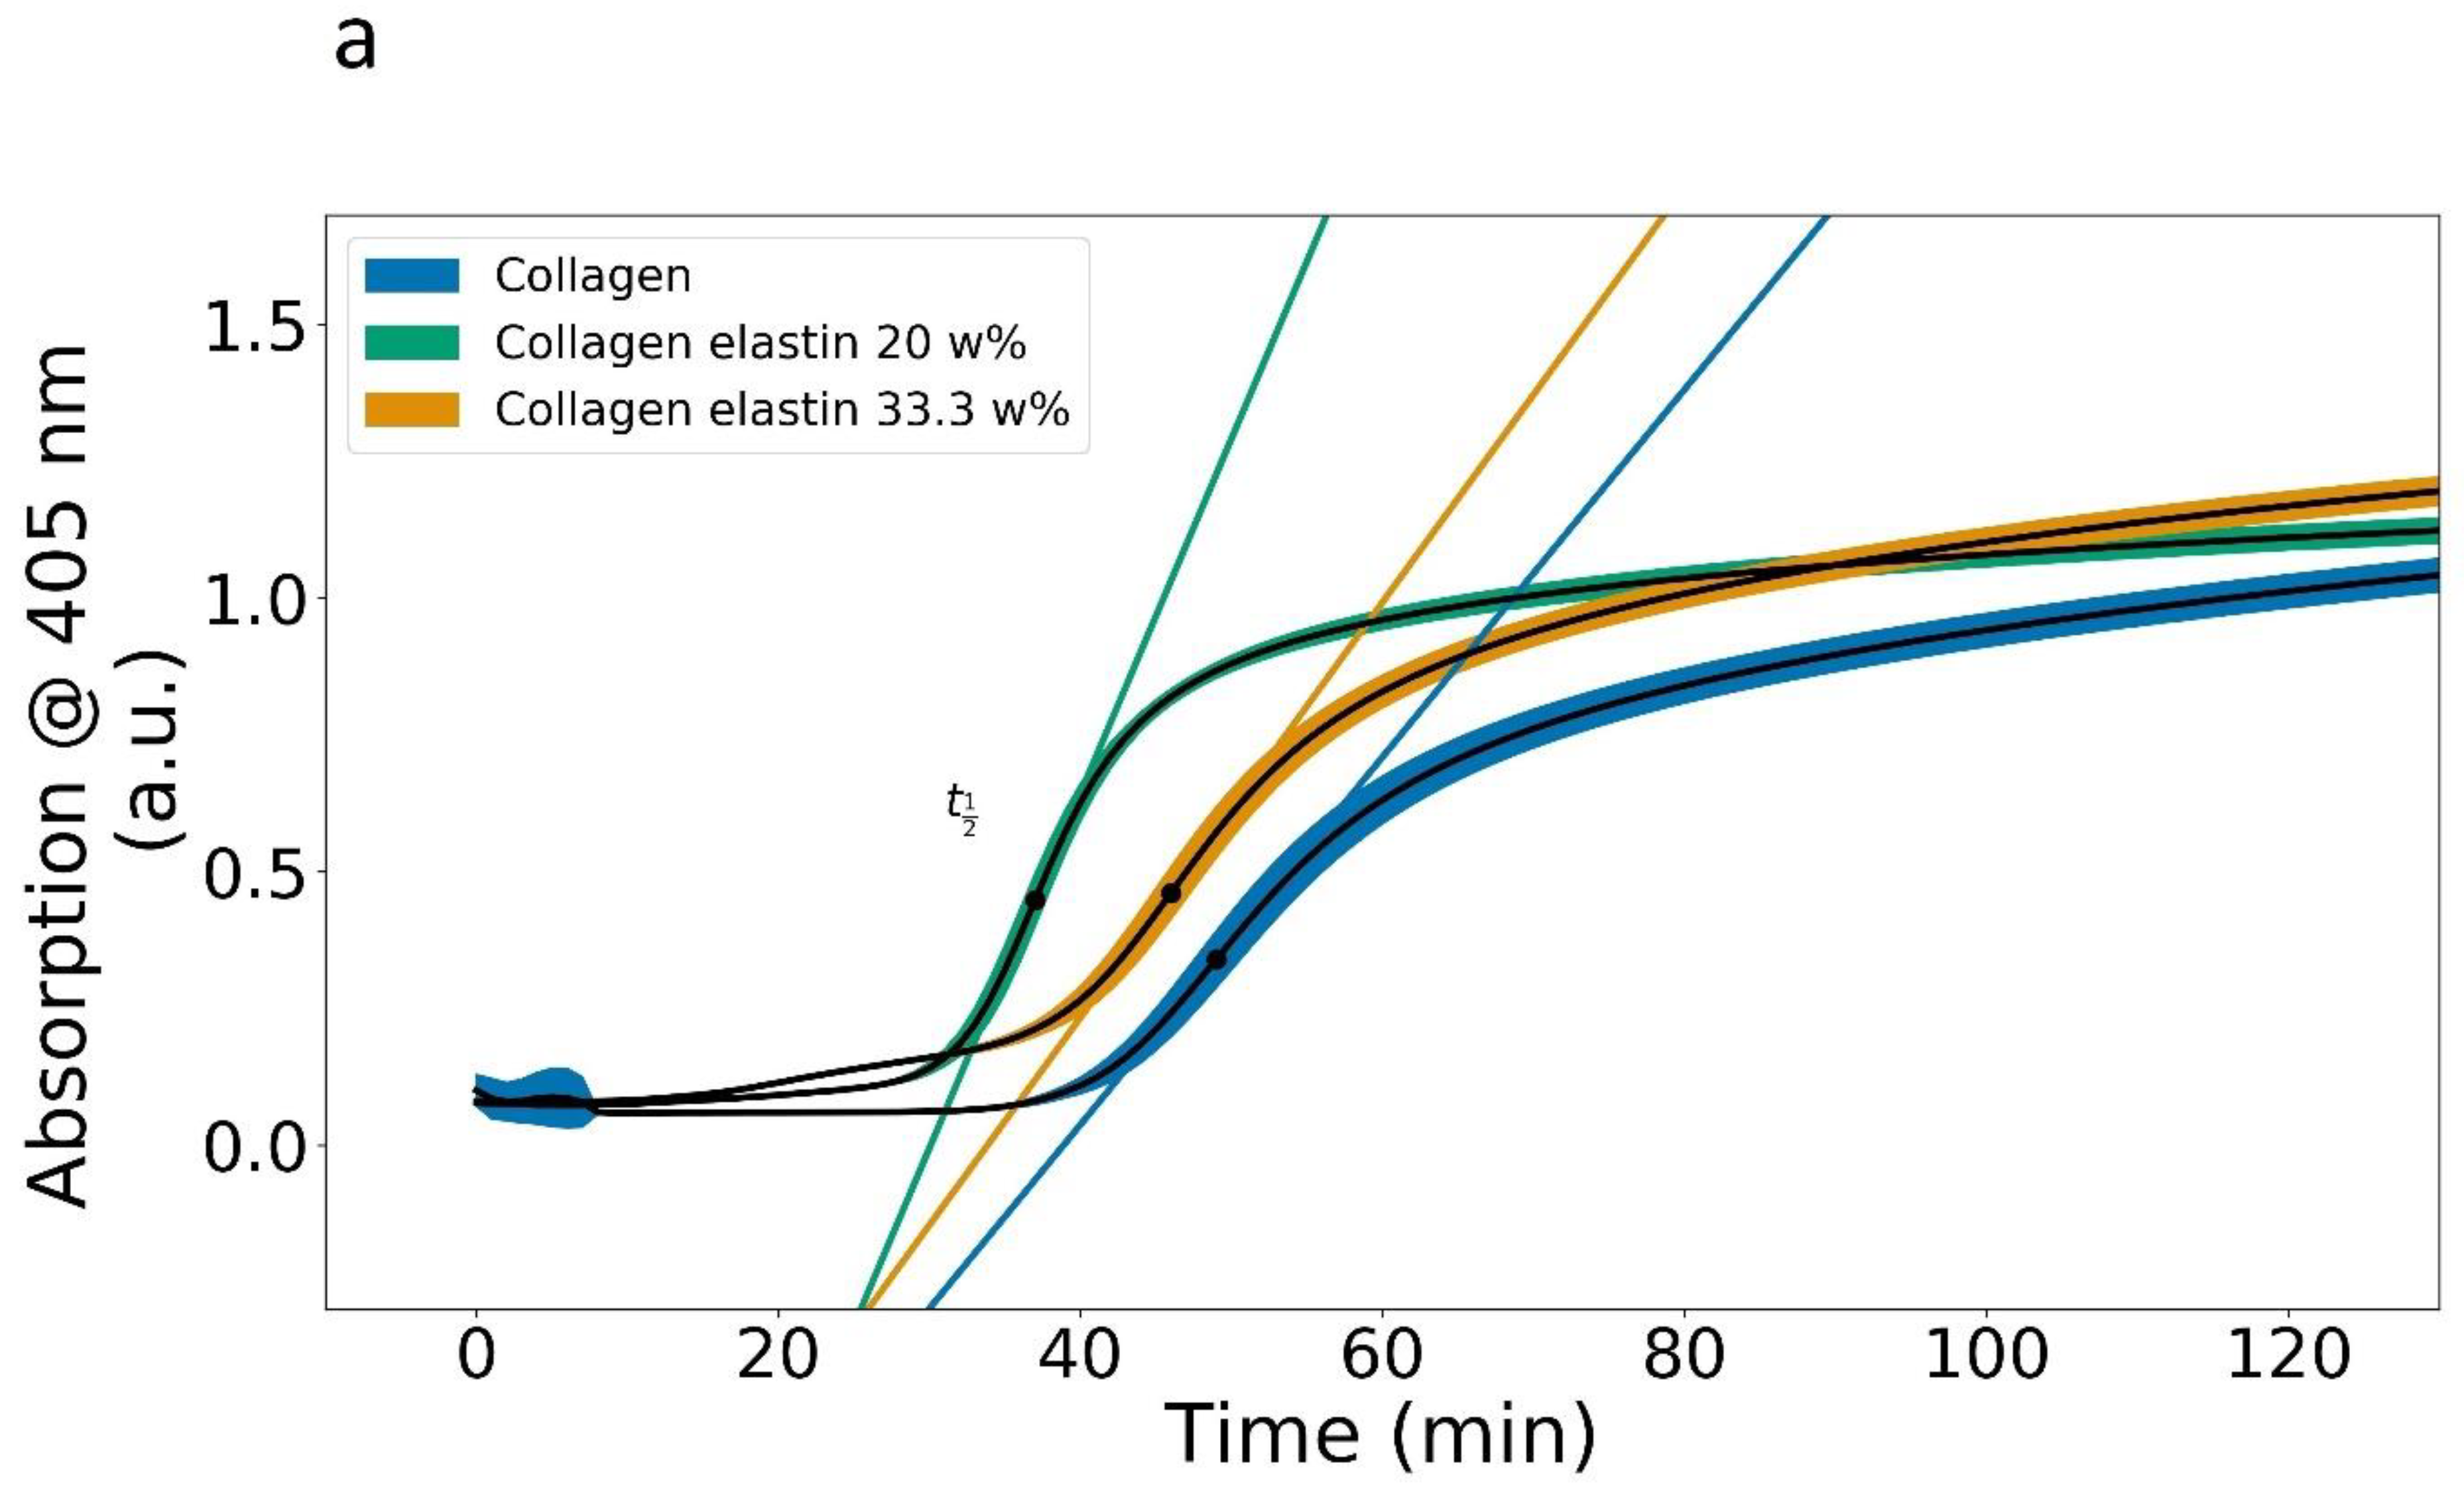
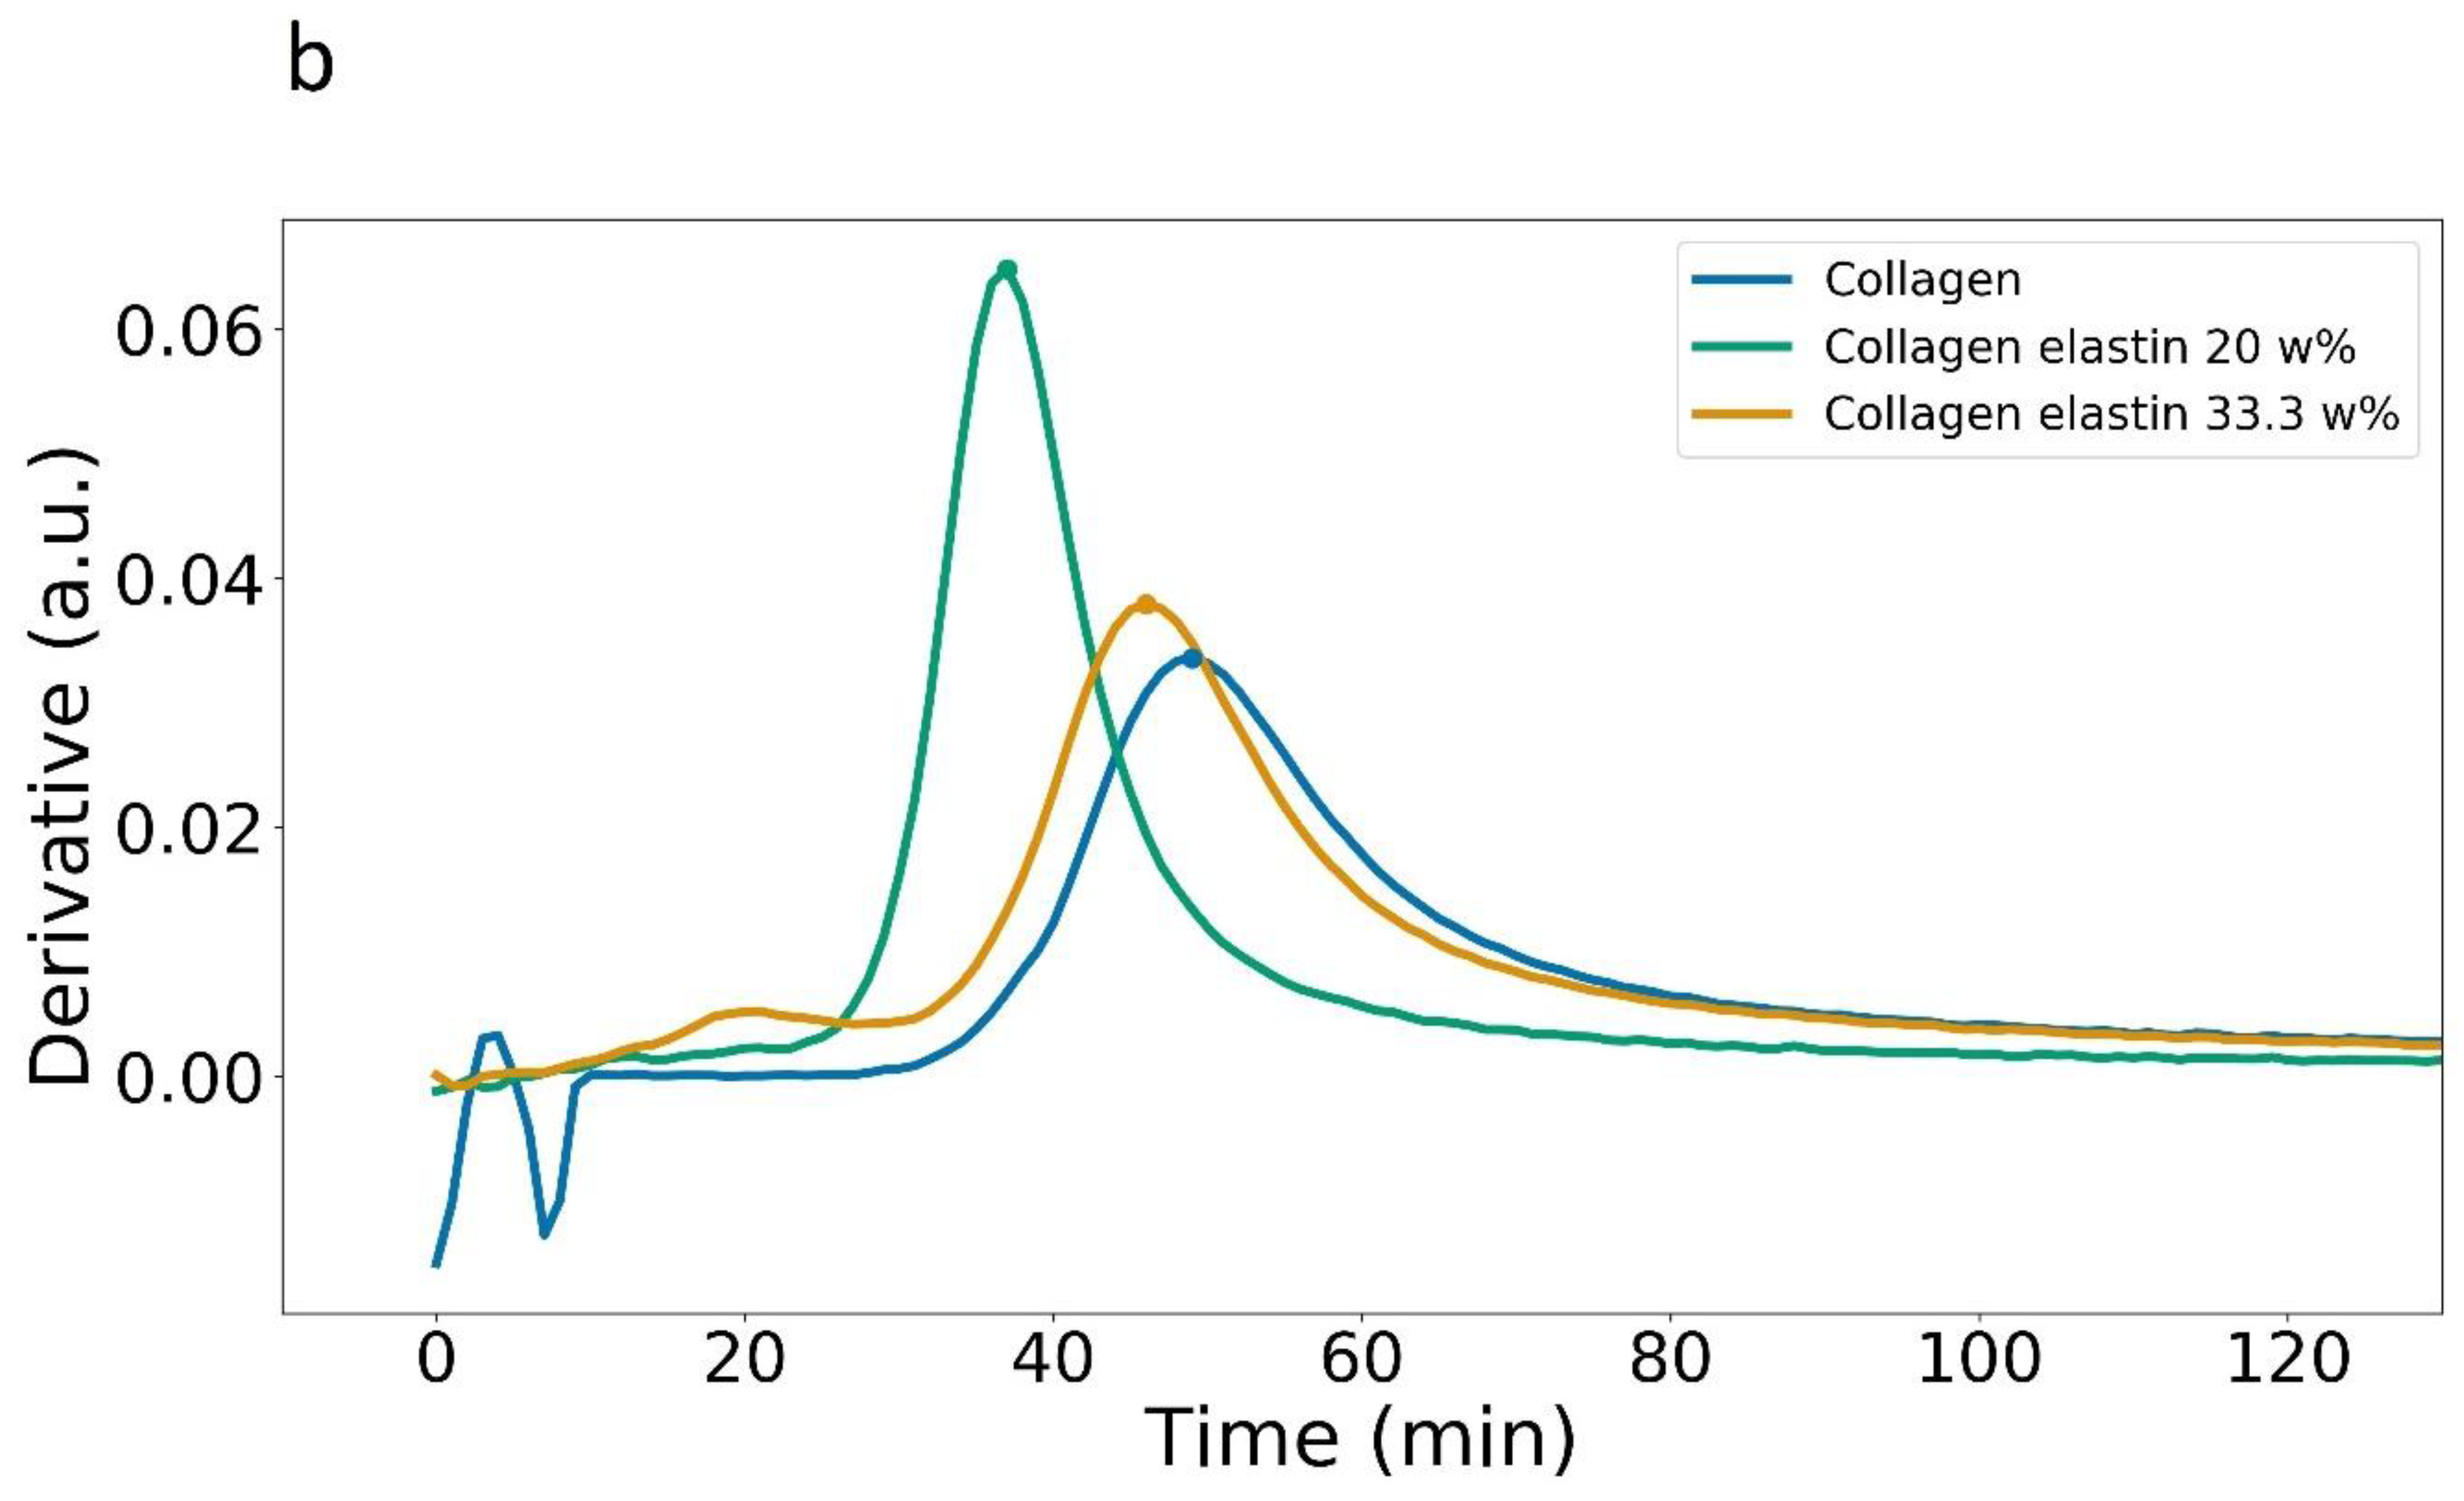
3.1. Plate Reader
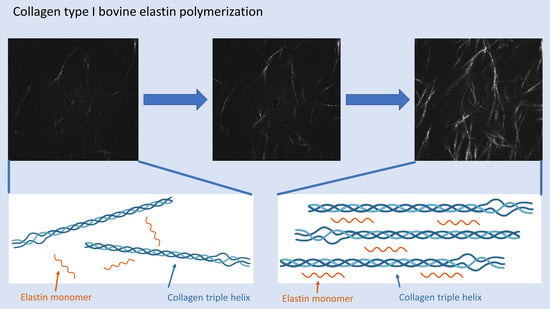
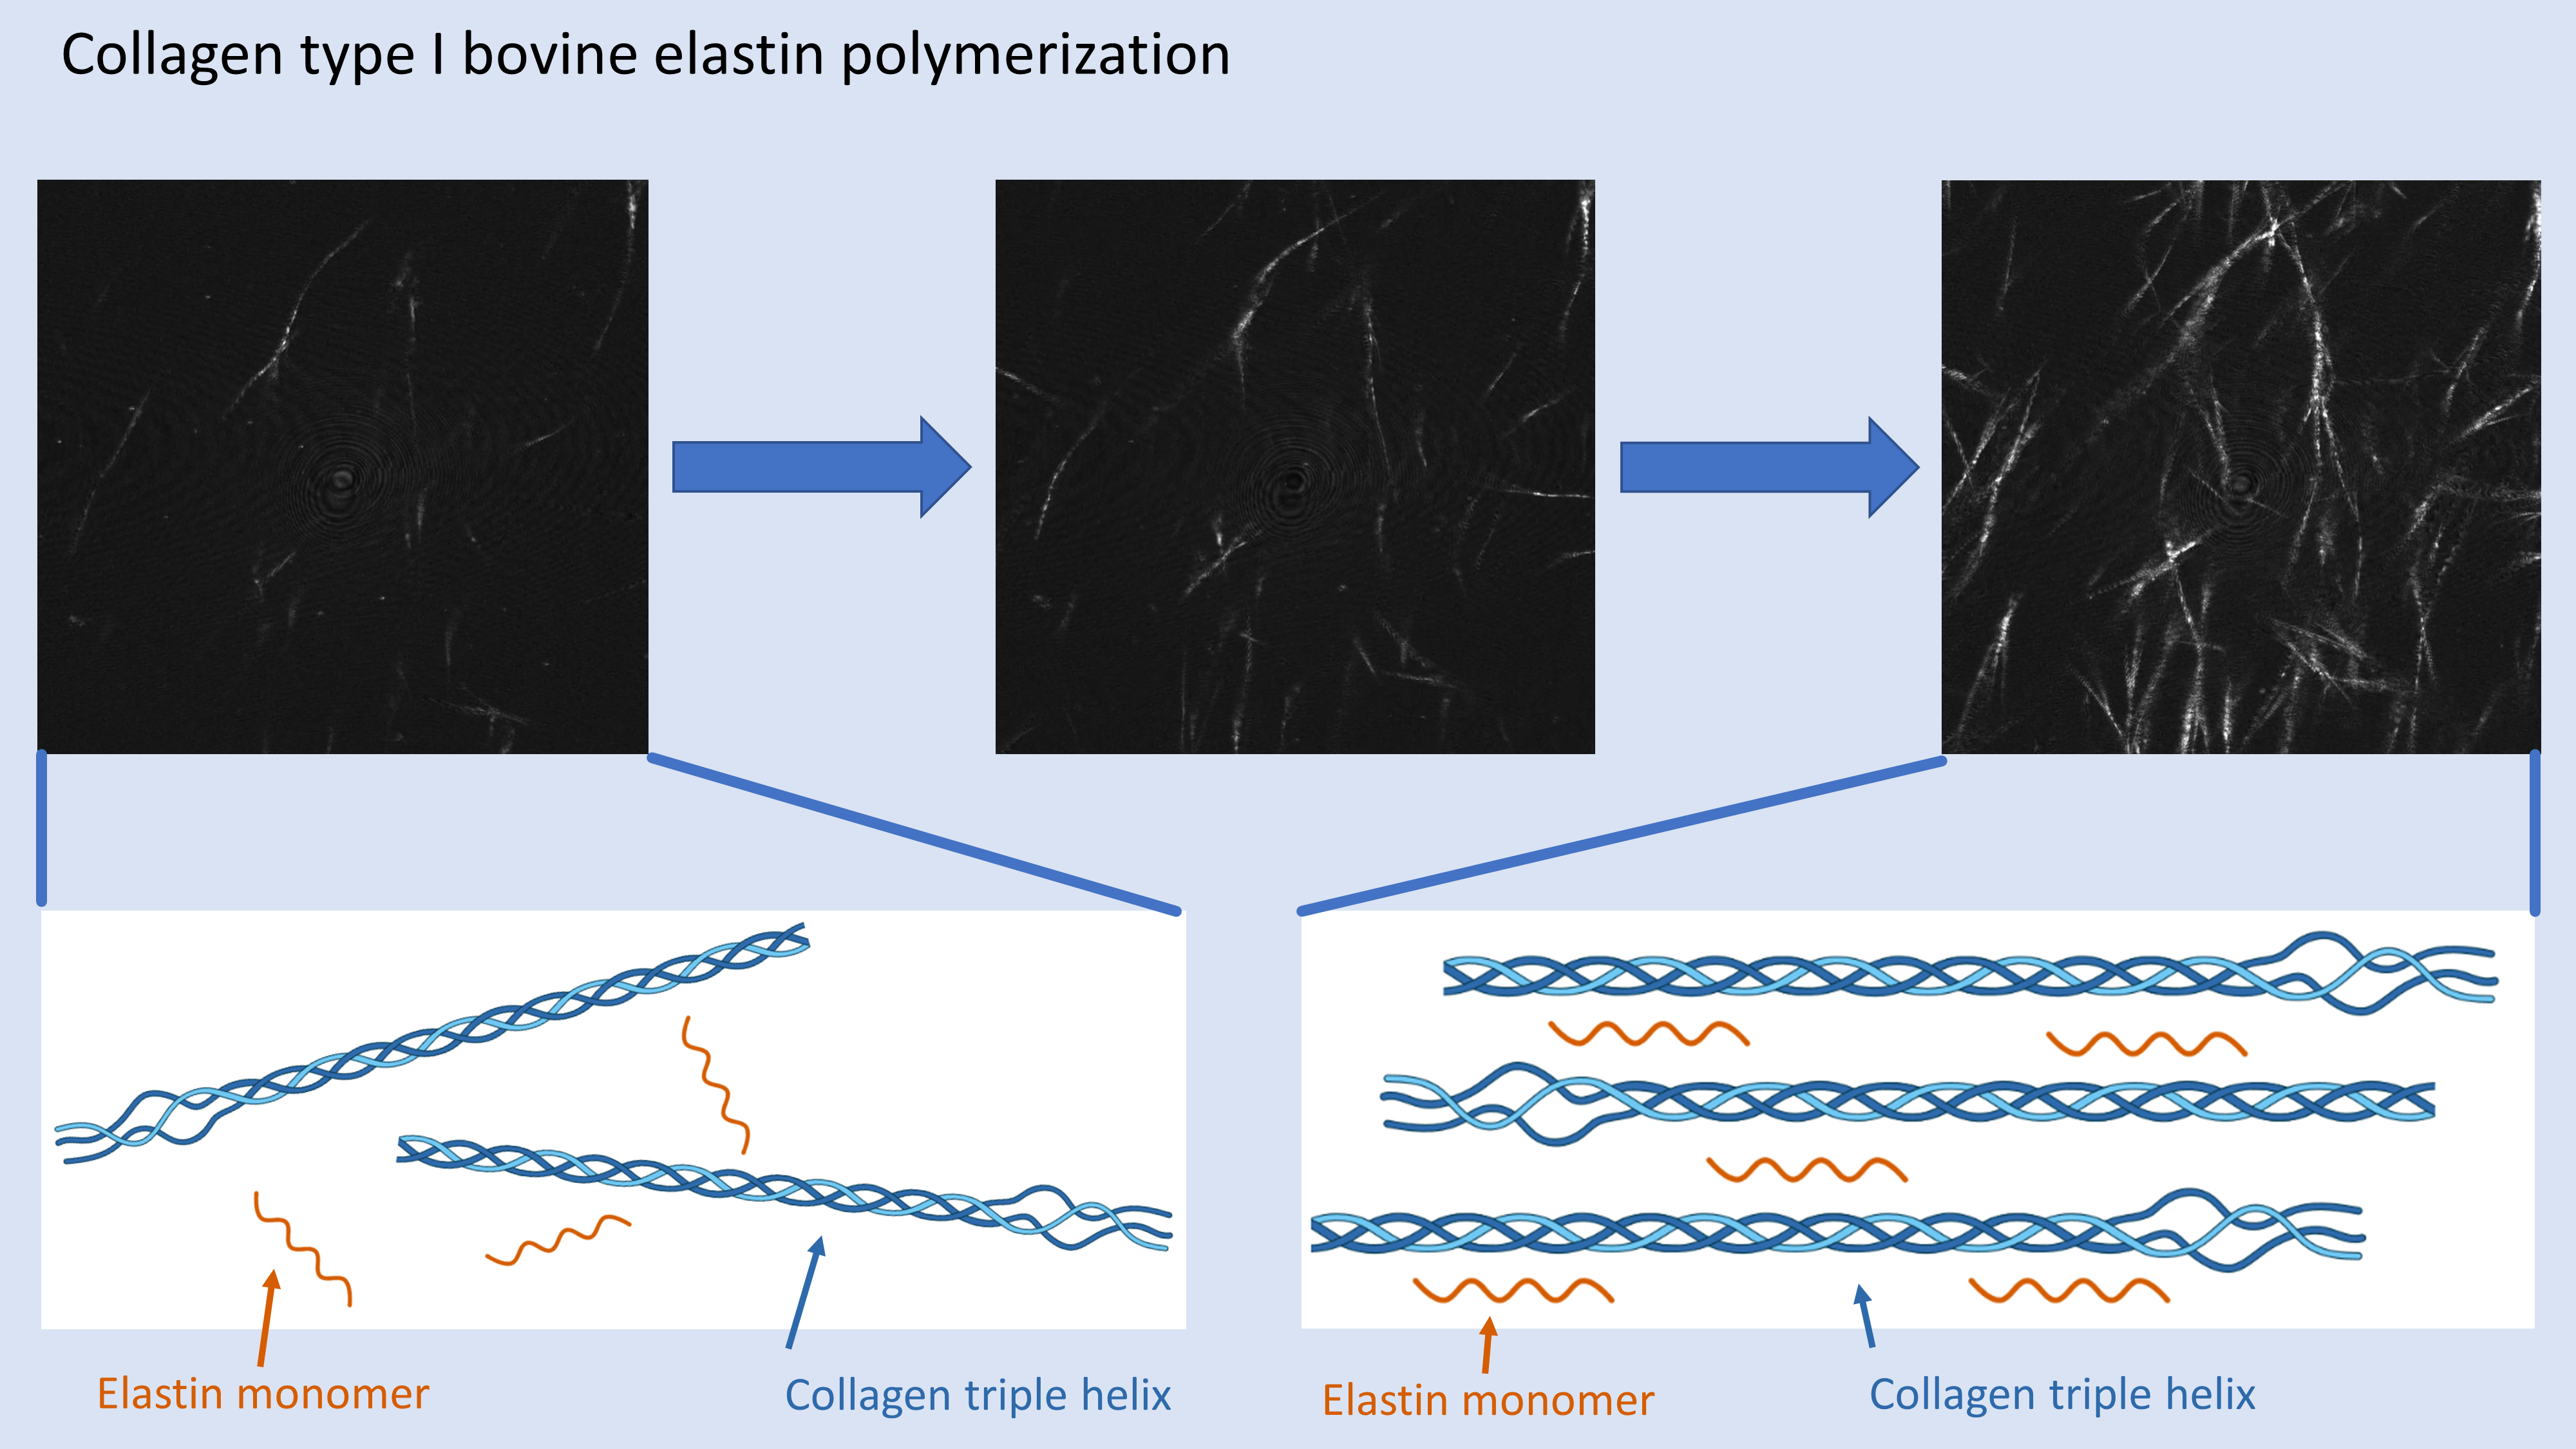
3.2. Videos of Polymerization
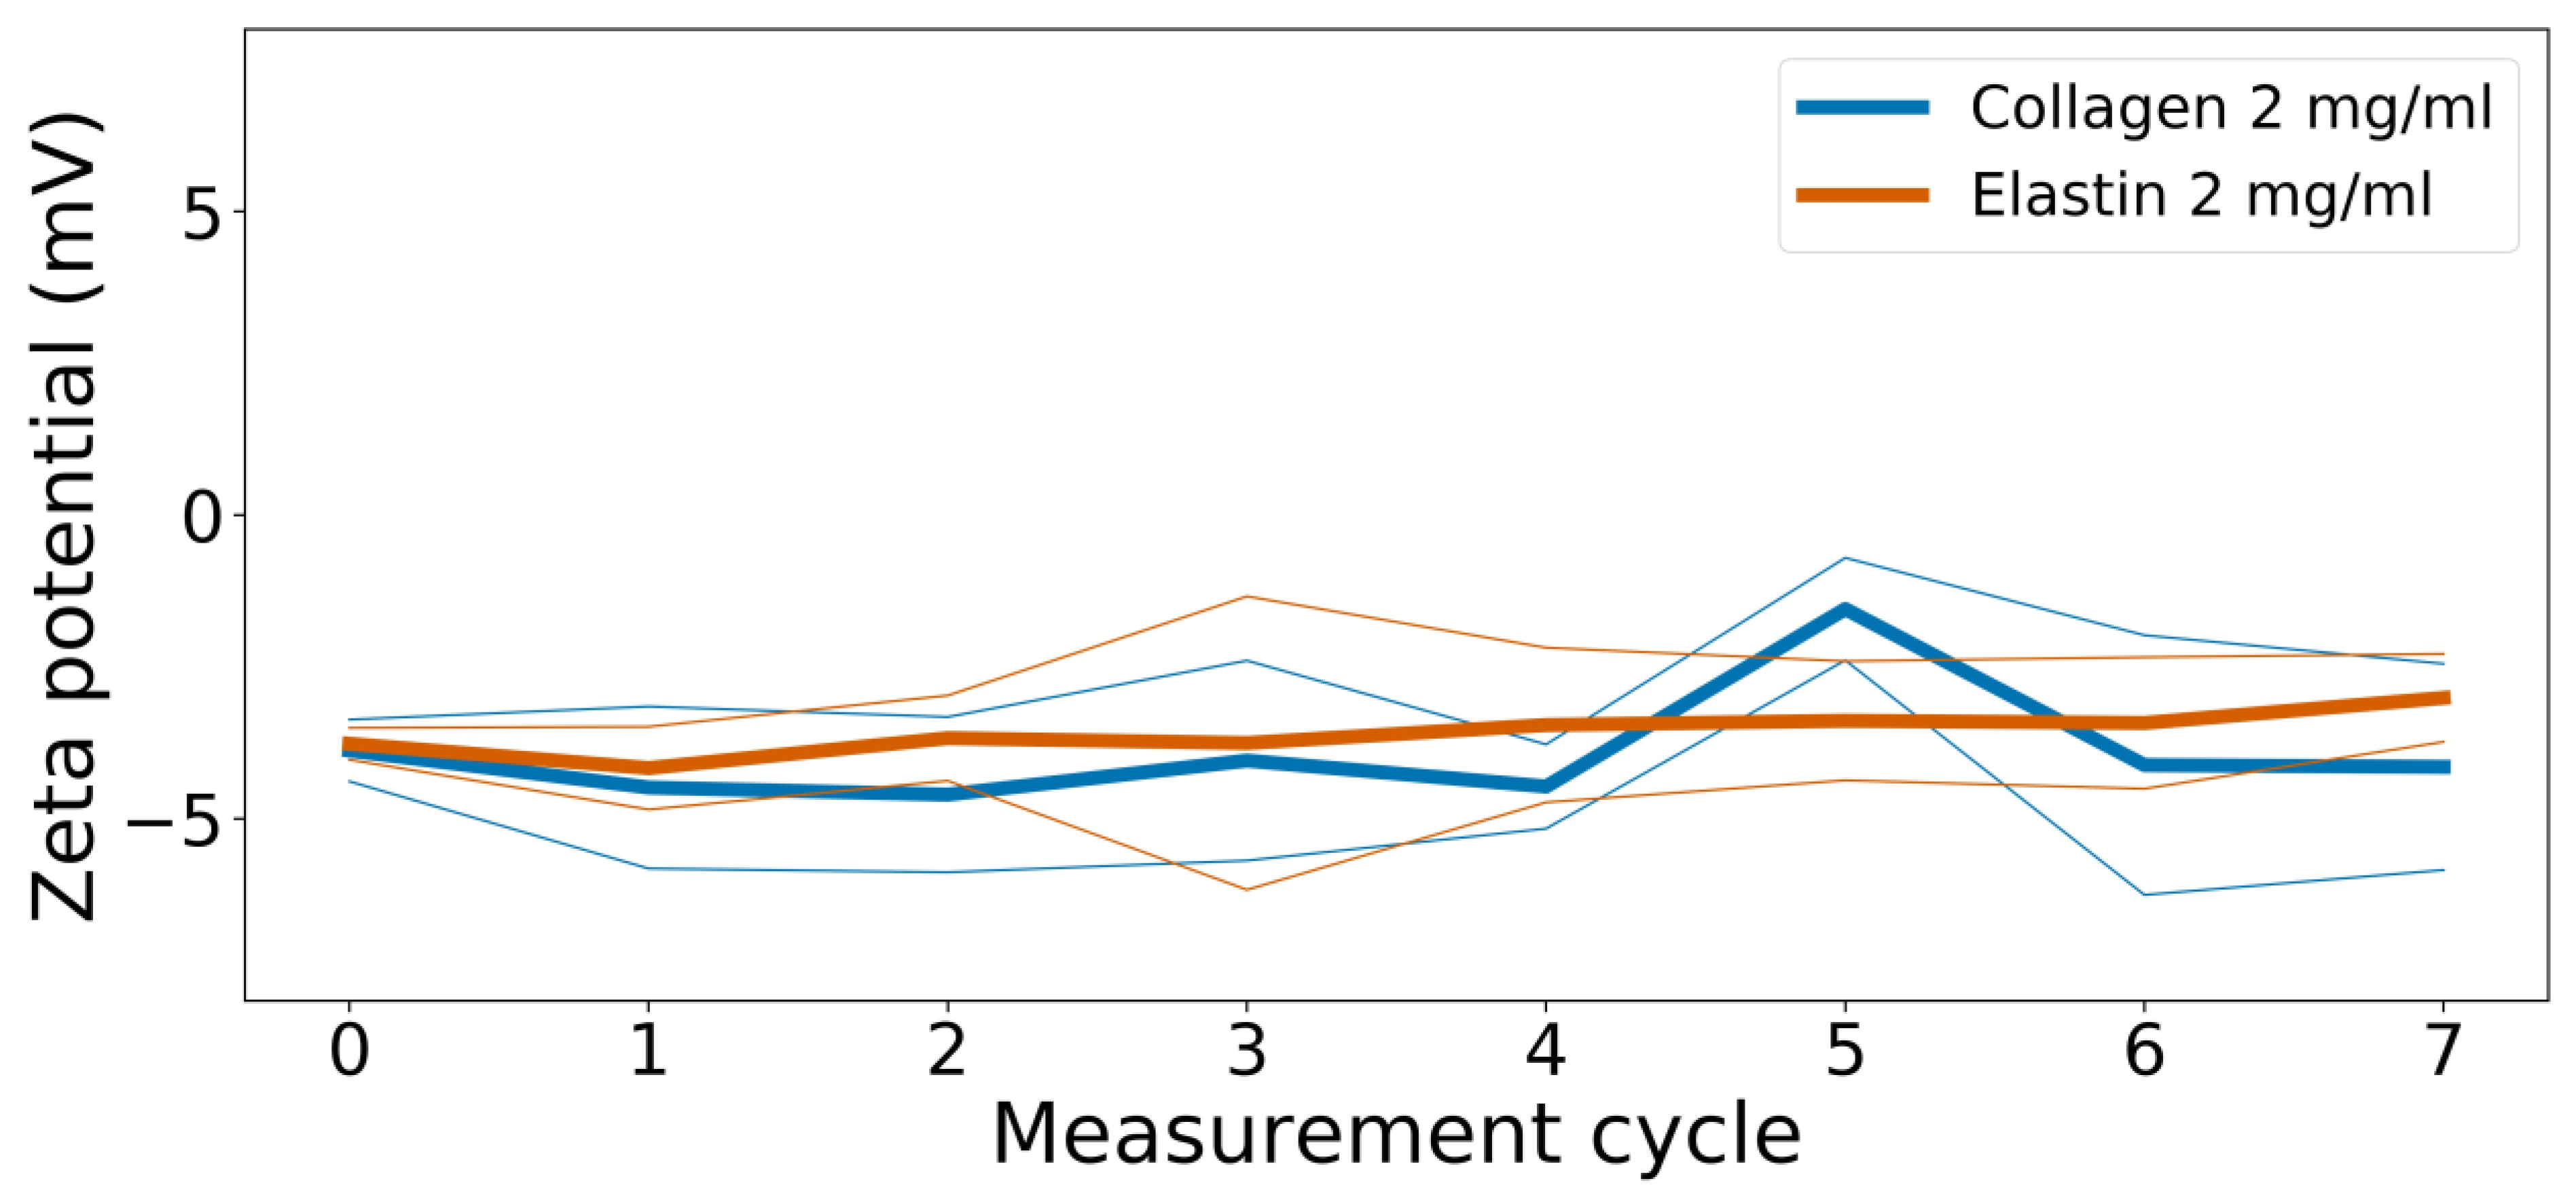
3.3. Zeta Potential
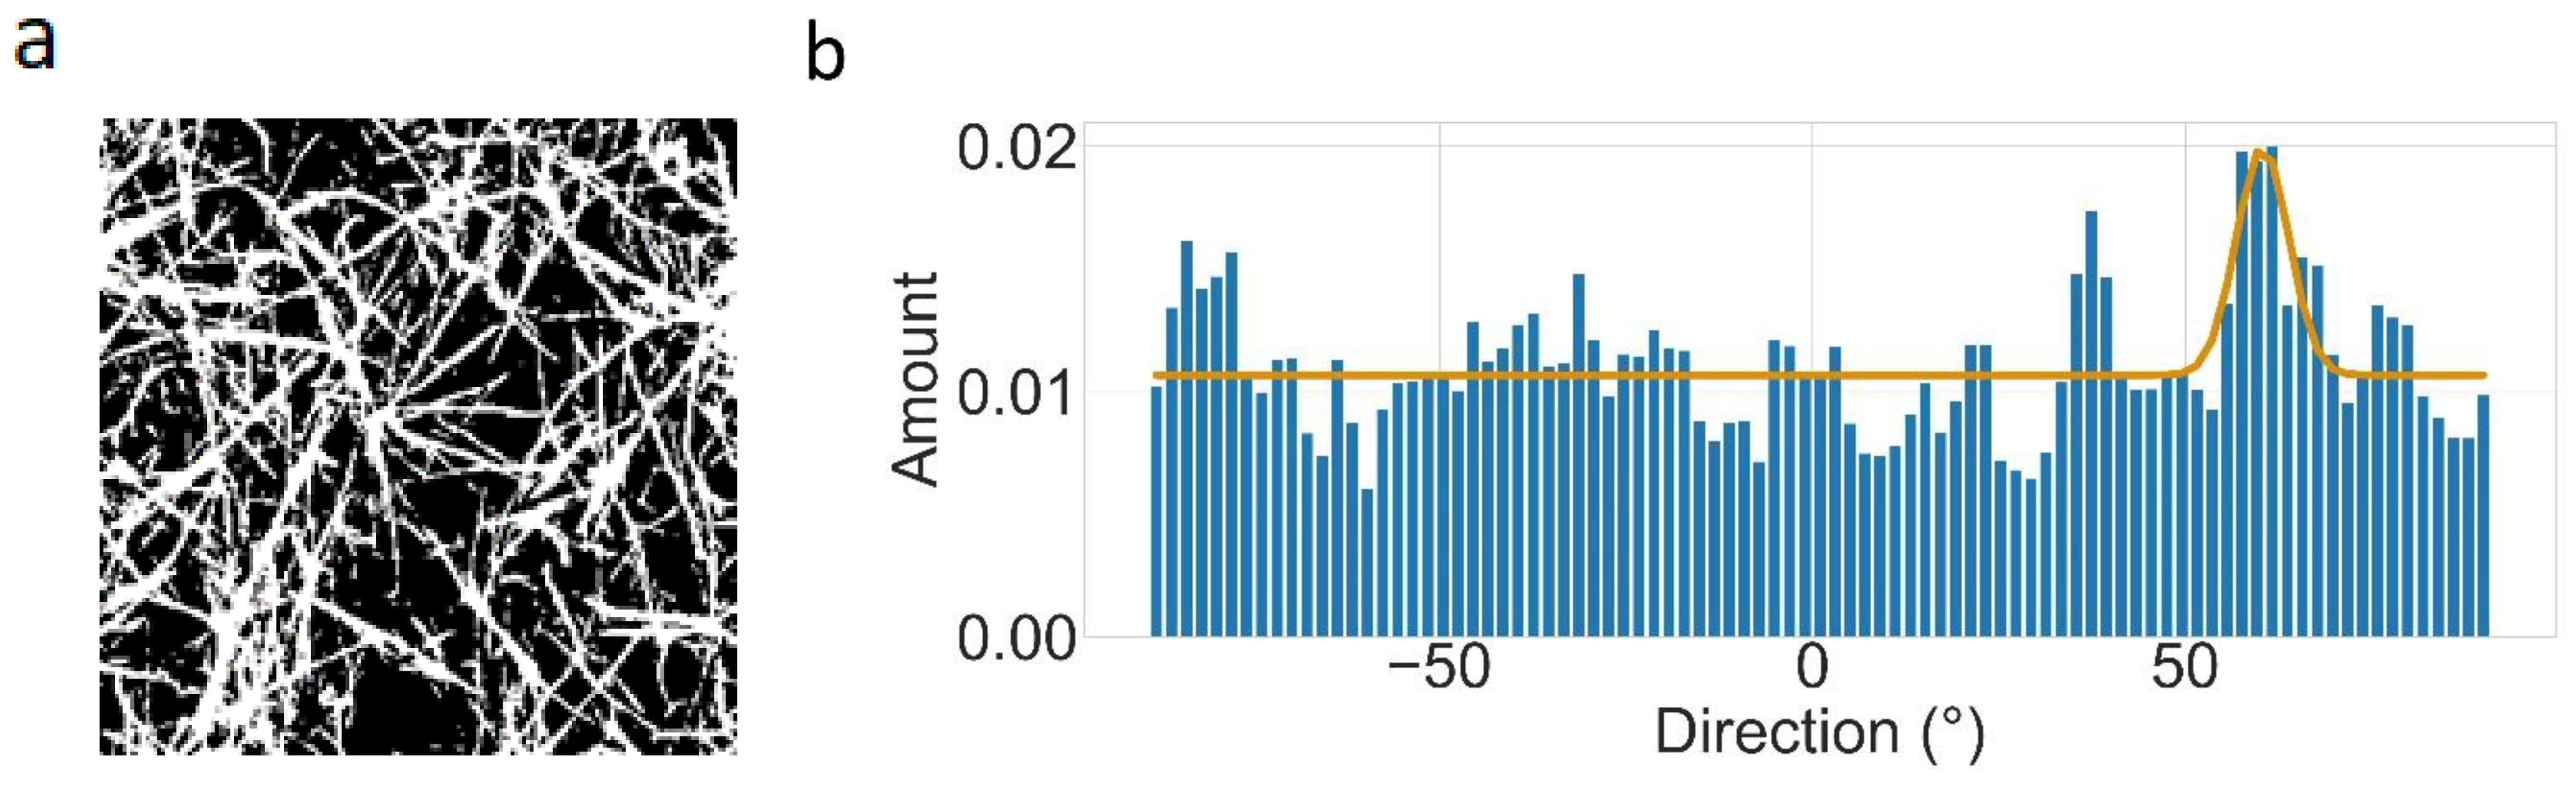
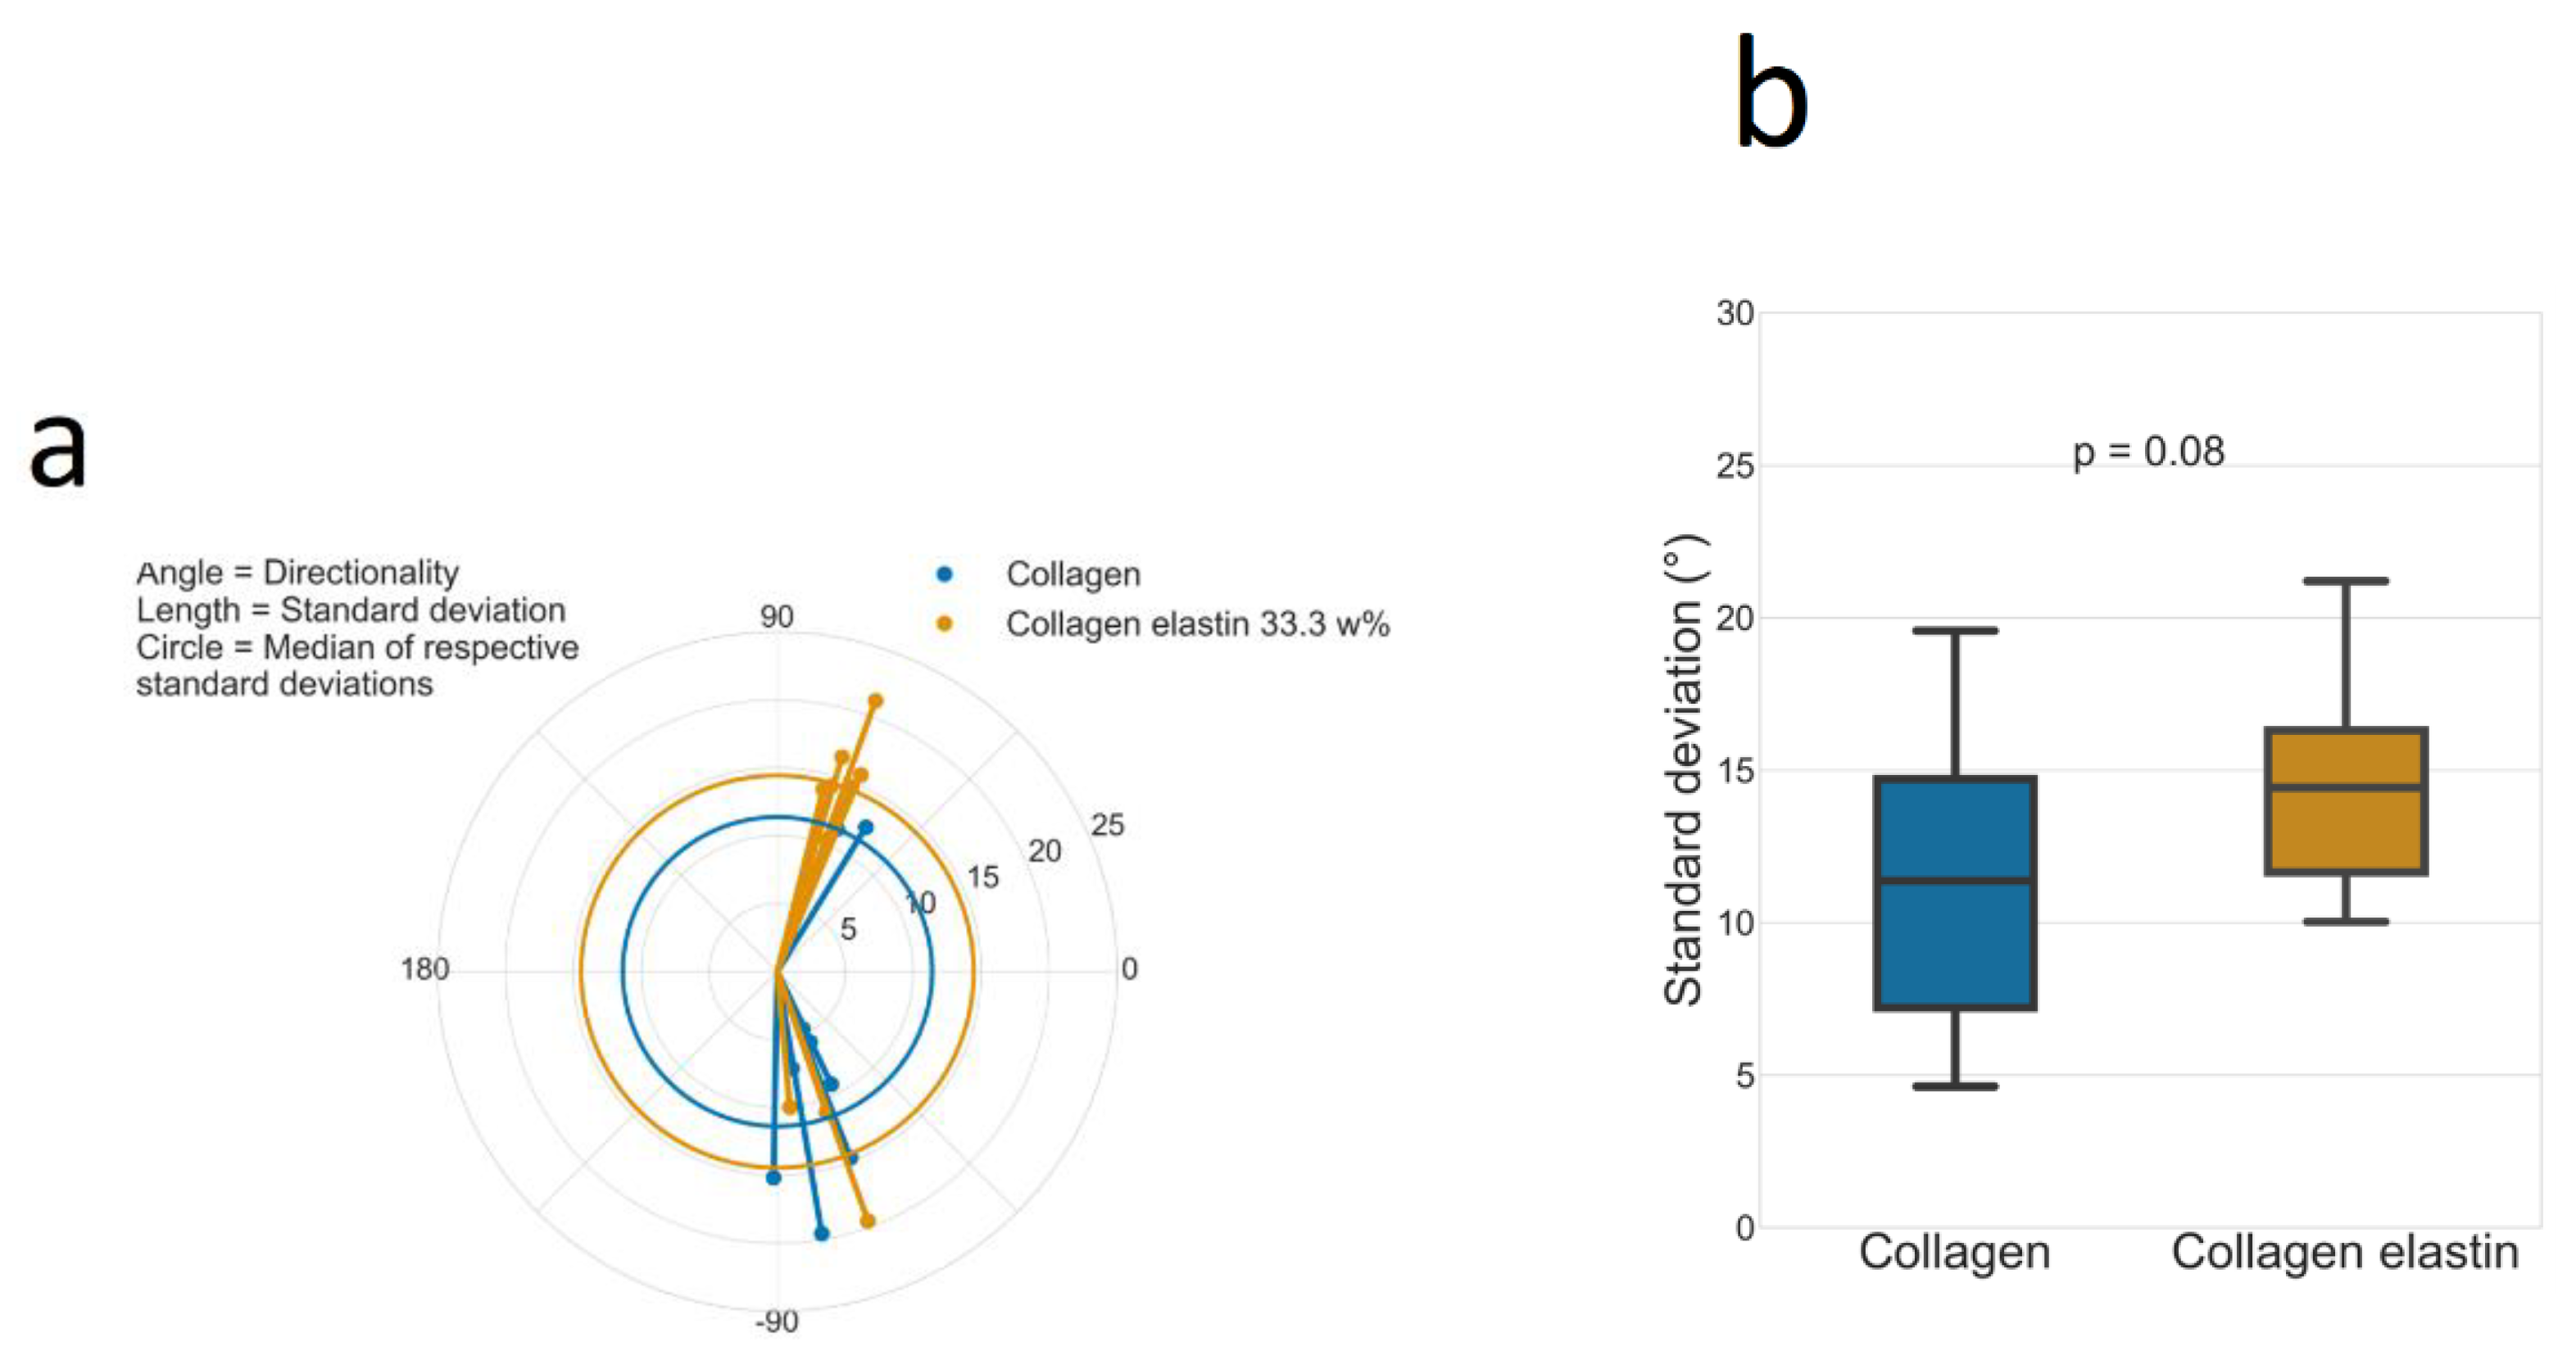
3.4. Directionality
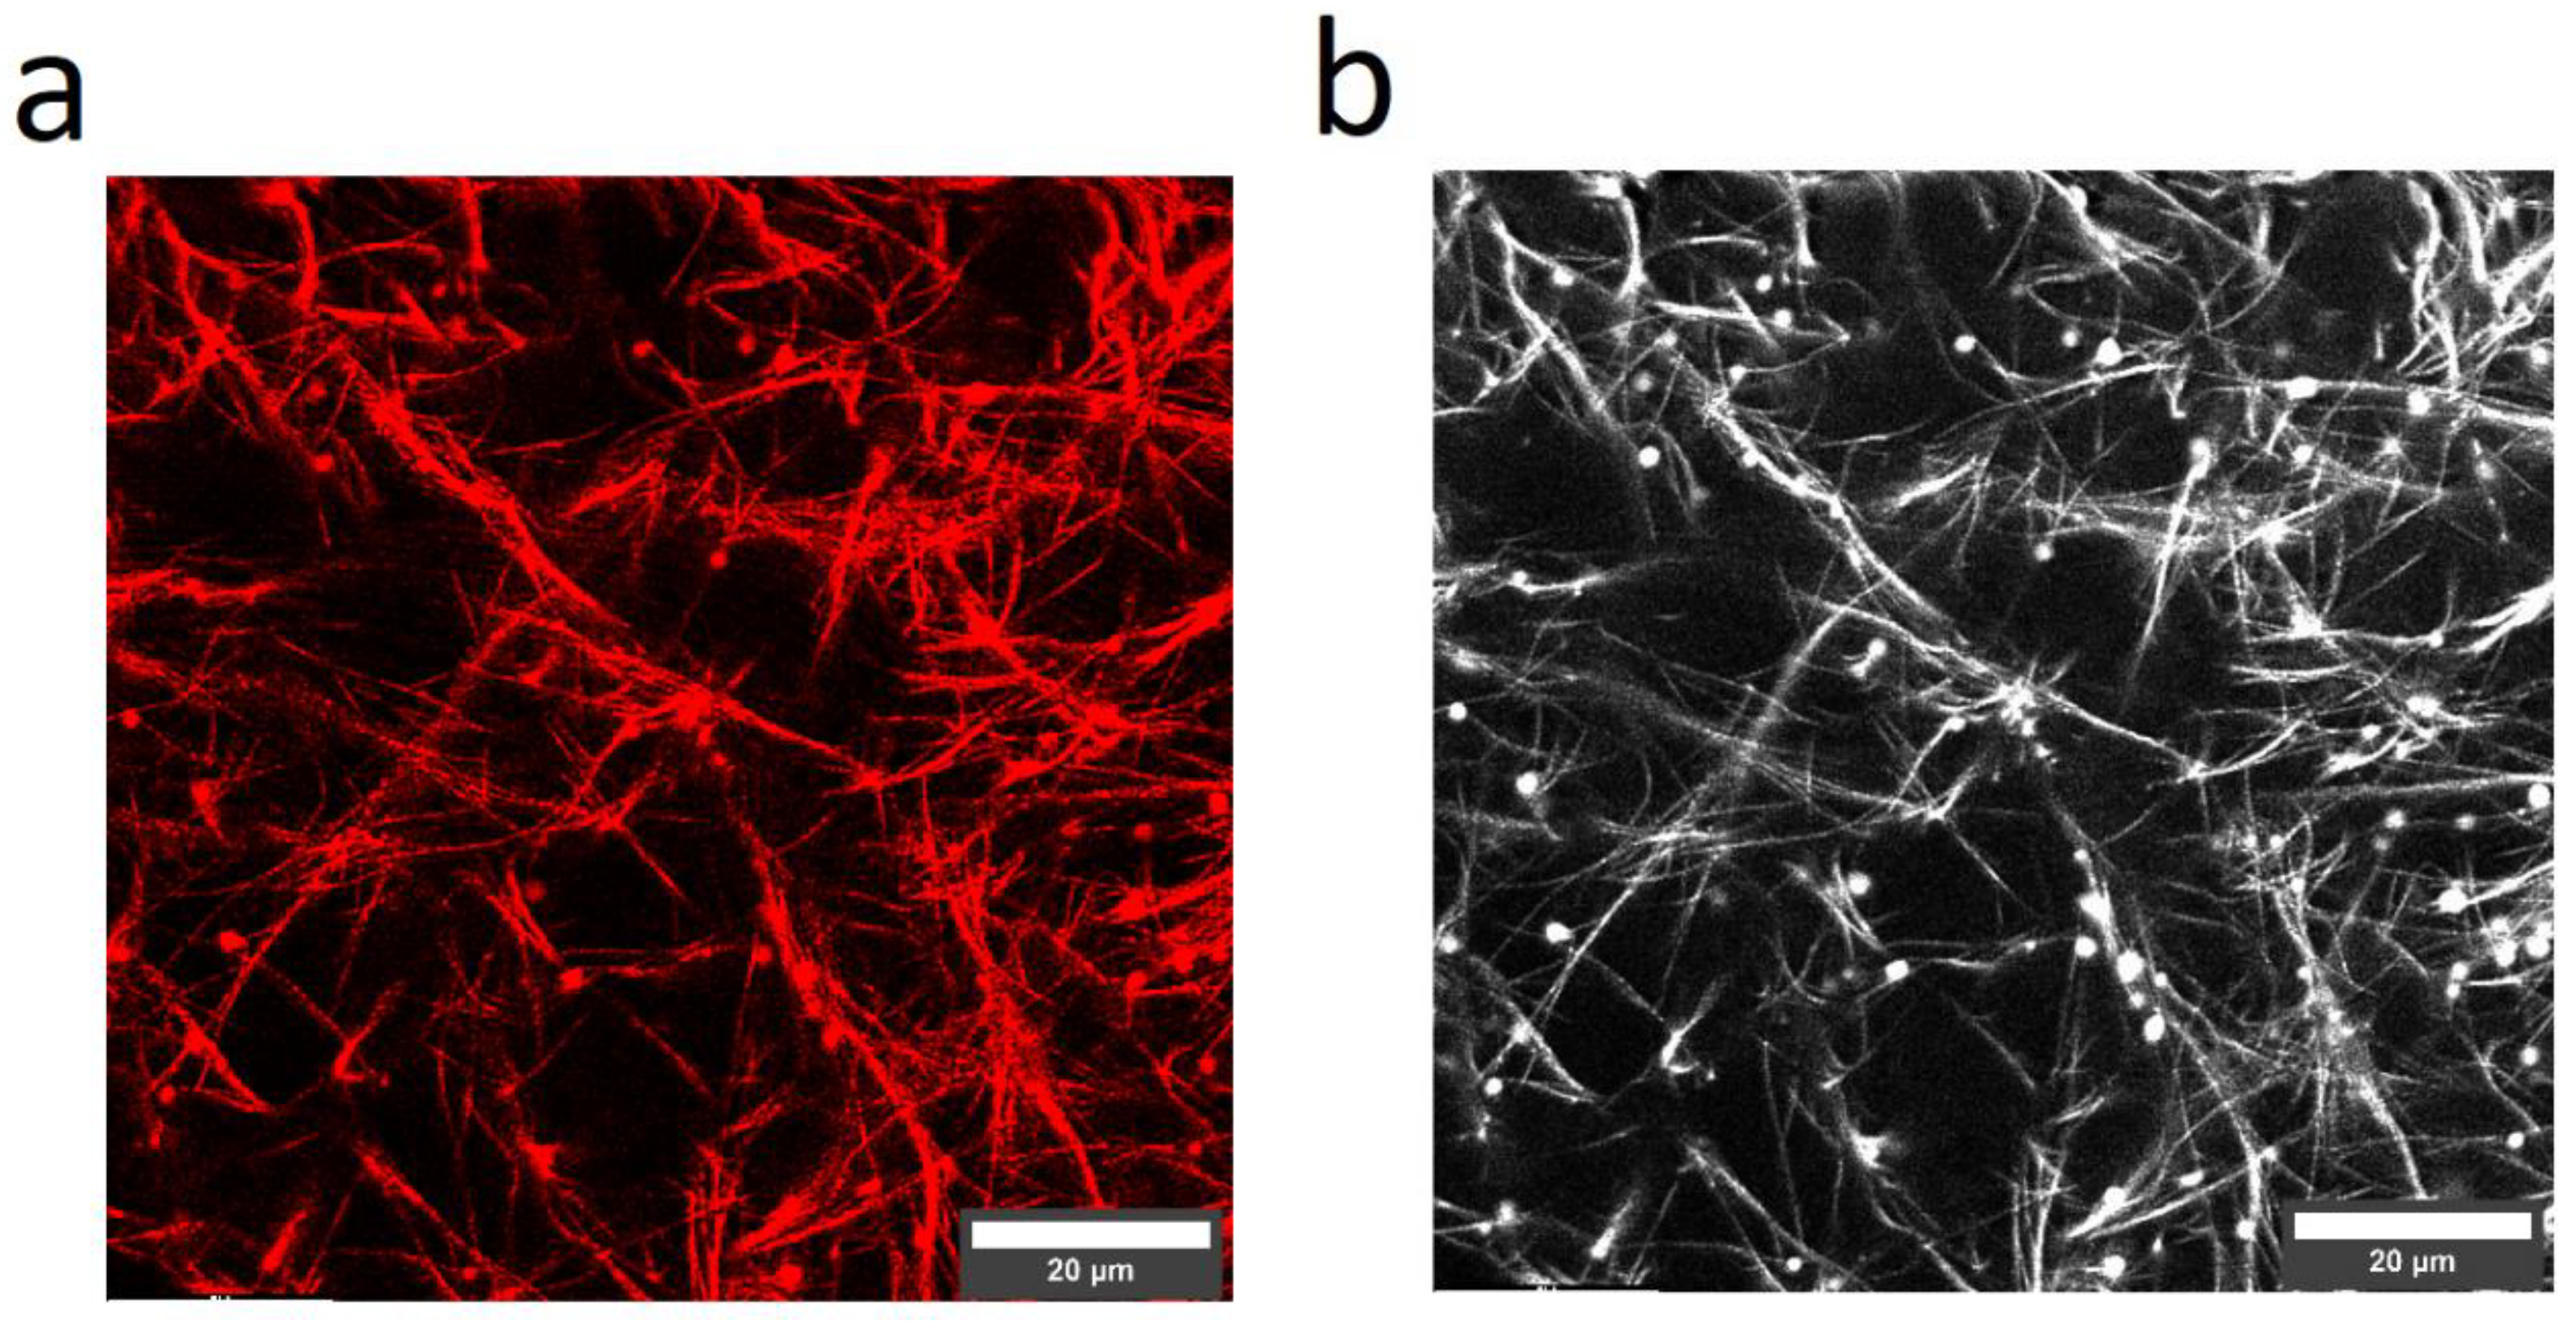
3.5. Laser Scanning Microscopy (LSM)
4. Discussion
5. Conclusions
Supplementary Materials
Author Contributions
Funding
Institutional Review Board Statement
Data Availability Statement
Acknowledgments
Conflicts of Interest
References
- Gandhi, A.; Paul, A.; Sen, S.O.; Sen, K.K. Studies on thermoresponsive polymers: Phase behaviour, drug delivery and biomedical applications. Asian J. Pharm. Sci. 2015, 10, 99–107. [Google Scholar] [CrossRef]
- Klouda, L. Thermoresponsive hydrogels in biomedical applications. Eur. J. Pharm. Biopharm. 2015, 97, 338–349. [Google Scholar] [CrossRef]
- Varghese, J.M.; Ismail, Y.A.; Lee, C.K.; Shin, K.M.; Shin, M.K.; Kim, S.I.; So, I.; Kim, S.J. Thermoresponsive hydrogels based on poly(N-isopropylacrylamide)/chondroitin sulfate. Sens. Actuators B Chem. 2008, 135, 336–341. [Google Scholar] [CrossRef]
- Mills, C.E.; Ding, E.; Olsen, B. Protein Purification by Ethanol-Induced Phase Transitions of the Elastin-like Polypeptide (ELP). Ind. Eng. Chem. Res. 2019, 58, 11698–11709. [Google Scholar] [CrossRef]
- Wang, E.; Desai, M.S.; Lee, S.-W. Light-Controlled Graphene-Elastin Composite Hydrogel Actuators. Nano Lett. 2013, 13, 2826–2830. [Google Scholar] [CrossRef]
- MacEwan, S.R.; Chilkoti, A. Elastin-like polypeptides: Biomedical applications of tunable biopolymers. Biopolymers 2010, 94, 60–77. [Google Scholar] [CrossRef]
- Bessa, P.C.; Machado, R.; Nürnberger, S.; Dopler, D.; Banerjee, A.; Cunha, A.M.; Rodríguez-Cabello, J.C.; Redl, H.; van Griensven, M.; Reis, R.L.; et al. Thermoresponsive self-assembled elastin-based nanoparticles for delivery of BMPs. J. Control. Release 2010, 142, 312–318. [Google Scholar] [CrossRef]
- Costa, R.R.; Custódio, C.A.; Arias, F.J.; Rodríguez-Cabello, J.C.; Mano, J.F. Layer-by-Layer Assembly of Chitosan and Recombinant Biopolymers into Biomimetic Coatings with Multiple Stimuli-Responsive Properties. Small 2011, 7, 2640–2649. [Google Scholar] [CrossRef]
- Kantardjiev, A.; Ivanov, P.M. Entropy Rules: Molecular Dynamics Simulations of Model Oligomers for Thermoresponsive Polymers. Entropy 2020, 22, 1187. [Google Scholar] [CrossRef]
- Hou, L.; Wu, P. LCST transition of PNIPAM-b-PVCL in water: Cooperative aggregation of two distinct thermally responsive segments. Soft Matter 2014, 10, 3578. [Google Scholar] [CrossRef]
- Cooperstein, M.A.; Canavan, H.E. Assessment of cytotoxicity of (N-isopropyl acrylamide) and Poly(N-isopropyl acrylamide)-coated surfaces. Biointerphases 2013, 8, 19. [Google Scholar] [CrossRef] [PubMed]
- Mithieux, S.M.; Weiss, A.S. Elastin. In Advances in Protein Chemistry; Academic Press: Cambridge, MA, USA, 2005; pp. 437–461. [Google Scholar] [CrossRef]
- Wilharm, N.; Fischer, T.; Ott, F.; Konieczny, R.; Zink, M.; Beck-Sickinger, A.G.; Mayr, S.G. Energetic electron assisted synthesis of highly tunable temperature-responsive collagen/elastin gels for cyclic actuation: Macroscopic switching and molecular origins. Sci. Rep. 2019, 9, 12363. [Google Scholar] [CrossRef] [PubMed]
- Usha, R.; Ramasami, T. Structure and conformation of intramolecularly cross-linked collagen. Colloids Surf. B Biointerfaces 2005, 41, 21–24. [Google Scholar] [CrossRef]
- Daamen, W.; Veerkamp, J.; Vanhest, J.; Vankuppevelt, T. Elastin as a biomaterial for tissue engineering. Biomaterials 2007, 28, 4378–4398. [Google Scholar] [CrossRef] [PubMed]
- Gaar, J.; Naffa, R.; Brimble, M. Enzymatic and non-enzymatic crosslinks found in collagen and elastin and their chemical synthesis. Org. Chem. Front. 2020, 7, 2789–2814. [Google Scholar] [CrossRef]
- Fischer, T.; Hayn, A.; Mierke, C.T. Effect of Nuclear Stiffness on Cell Mechanics and Migration of Human Breast Cancer Cells. Front. Cell Dev. Biol. 2020, 8, 393. [Google Scholar] [CrossRef]
- Fischer, T.; Hayn, A.; Mierke, C.T. Fast and reliable advanced two-step pore-size analysis of biomimetic 3D extracellular matrix scaffolds. Sci. Rep. 2019, 9, 8352. [Google Scholar] [CrossRef]
- Hayn, A.; Fischer, T.; Mierke, C.T. Inhomogeneities in 3D Collagen Matrices Impact Matrix Mechanics and Cancer Cell Migration. Front. Cell Dev. Biol. 2020, 8, 593879. [Google Scholar] [CrossRef]
- Na, G.C.; Phillips, L.J.; Freire, E.I. In vitro collagen fibril assembly: Thermodynamic studies. Biochemistry 1989, 28, 7153–7161. [Google Scholar] [CrossRef]
- Streeter, I.; de Leeuw, N.H. A molecular dynamics study of the interprotein interactions in collagen fibrils. Soft Matter 2011, 7, 3373–3382. [Google Scholar] [CrossRef]
- Znidarsic, W.J.; Chen, I.-W.; Shastri, V.P. ζ-potential characterization of collagen and bovine serum albumin modified silica nanoparticles: A comparative study. J. Mater. Sci. 2009, 44, 1374–1380. [Google Scholar] [CrossRef]
- Panduranga Rao, K. Recent developments of collagen-based materials for medical applications and drug delivery systems. J. Biomater. Sci. Polym. Ed. 1996, 7, 623–645. [Google Scholar] [CrossRef] [PubMed]
- Partridge, S.M.; Davis, H.F.; Adair, G.S. The chemistry of connective tissues. 2. Soluble proteins derived from partial hydrolysis of elastin. Biochem. J. 1955, 61, 11–21. [Google Scholar] [CrossRef] [PubMed]
- Vrhovski, B.; Jensen, S.; Weiss, A.S. Coacervation Characteristics of Recombinant Human Tropoelastin. Eur. J. Biochem. 1997, 250, 92–98. [Google Scholar] [CrossRef] [PubMed]
- Vazquez-Portalatin, N.; Alfonso-Garcia, A.; Liu, J.C.; Marcu, L.; Panitch, A. Physical, Biomechanical, and Optical Characterization of Collagen and Elastin Blend Hydrogels. Ann. Biomed. Eng. 2020, 48, 2924–2935. [Google Scholar] [CrossRef]
- Paderi, J.E.; Sistiabudi, R.; Ivanisevic, A.; Panitch, A. Collagen-Binding Peptidoglycans: A Biomimetic Approach to Modulate Collagen Fibrillogenesis for Tissue Engineering Applications. Tissue Eng. Part A 2009, 15, 2991–2999. [Google Scholar] [CrossRef]
- Cisneros, D.A.; Hung, C.; Franz, C.M.; Muller, D.J. Observing growth steps of collagen self-assembly by time-lapse high-resolution atomic force microscopy. J. Struct. Biol. 2006, 154, 232–245. [Google Scholar] [CrossRef]
- Kumar, A.; Dixit, C.K. 3-Methods for characterization of nanoparticles. In Advances in Nanomedicine for the Delivery of Therapeutic Nucleic Acids; Nimesh, S., Chandra, R., Gupta, N., Eds.; Woodhead Publishing: Buckingham, UK, 2017; pp. 43–58. [Google Scholar] [CrossRef]
- Kadler, K.E.; Hojima, Y.; Prockop, D.J. Assembly of collagen fibrils de novo by cleavage of the type I pC-collagen with procollagen C-proteinase. Assay of critical concentration demonstrates that collagen self-assembly is a classical example of an entropy-driven process. J. Biol. Chem. 1987, 262, 15696–15701. [Google Scholar] [CrossRef]
- Ravikumar, K.M.; Hwang, W. Role of Hydration Force in the Self-Assembly of Collagens and Amyloid Steric Zipper Filaments. J. Am. Chem. Soc. 2011, 133, 11766–11773. [Google Scholar] [CrossRef]
- Ahmed, A.; Joshi, I.M.; Mansouri, M.; Ahamed, N.N.N.; Hsu, M.-C.; Gaborski, T.R.; Abhyankar, V.V. Engineering fiber anisotropy within natural collagen hydrogels. Am. J. Physiol. Cell Physiol. 2021, 320, C1112–C1124. [Google Scholar] [CrossRef]
- Mostaço-Guidolin, L.B.; Smith, M.S.D.; Hewko, M.; Schattka, B.; Sowa, M.G.; Major, A.; Ko, A.C.-T. Fractal dimension and directional analysis of elastic and collagen fiber arrangement in unsectioned arterial tissues affected by atherosclerosis and aging. J. Appl. Physiol. 2019, 126, 638–646. [Google Scholar] [CrossRef]
- Gibson, M.A. Microfibril-Associated Glycoprotein-1 (MAGP-1) and Other Non-fibrillin Macromolecules Which May Possess a Functional Association with the 10 nm Microfibrils. Landes Biosci. 2013. Available online: https://www.ncbi.nlm.nih.gov/books/NBK6448/ (accessed on 17 June 2021).
- Trask, T.M.; Trask, B.C.; Ritty, T.M.; Abrams, W.R.; Rosenbloom, J.; Mecham, R.P. Interaction of tropoelastin with the amino-terminal domains of fibrillin-1 and fibrillin-2 suggests a role for the fibrillins in elastic fiber assembly. J. Biol. Chem. 2000, 275, 24400–24406. [Google Scholar] [CrossRef] [PubMed]
- Yanagisawa, H.; Davis, E.C.; Starcher, B.C.; Ouchi, T.; Yanagisawa, M.; Richardson, J.A.; Olson, E.N. Fibulin-5 is an elastin-binding protein essential for elastic fibre development in vivo. Nature 2002, 415, 168–171. [Google Scholar] [CrossRef] [PubMed]
- Chang, S.-W.; Buehler, M.J. Molecular biomechanics of collagen molecules. Mater. Today 2014, 17, 70–76. [Google Scholar] [CrossRef]
- Tarakanova, A.; Chang, S.-W.; Buehler, M.J. Computational Materials Science of Bionanomaterials: Structure, Mechanical Properties and Applications of Elastin and Collagen Proteins. In Handbook of Nanomaterials Properties; Bhushan, B., Luo, D., Schricker, S.R., Sigmund, W., Zauscher, S., Eds.; Springer: Berlin/Heidelberg, Germany, 2014; pp. 941–962. [Google Scholar] [CrossRef]
- Fluegel, S.; Fischer, K.; McDaniel, J.R.; Chilkoti, A.; Schmidt, M. Chain Stiffness of Elastin-Like Polypeptides. Biomacromolecules 2010, 11, 3216–3218. [Google Scholar] [CrossRef]


| Maximum Rate (a.u./Time) | (min) | Abs. at (a.u.) | Abs. after 120 min (a.u.) | |
|---|---|---|---|---|
| Collagen, 405 nm | 0.033 | 49 | 0.34 | 1.01 ± 0.03 |
| Collagen + 0.6 mg Elastin, 405 nm | 0.064 | 37 | 0.46 | 1.11 ± 0.02 |
| Collagen + 1.2 mg Elastin, 405 nm | 0.037 | 46 | 0.45 | 1.17 ± 0.03 |
Publisher’s Note: MDPI stays neutral with regard to jurisdictional claims in published maps and institutional affiliations. |
© 2022 by the authors. Licensee MDPI, Basel, Switzerland. This article is an open access article distributed under the terms and conditions of the Creative Commons Attribution (CC BY) license (https://creativecommons.org/licenses/by/4.0/).
Share and Cite
Wilharm, N.; Fischer, T.; Hayn, A.; Mayr, S.G. Structural Breakdown of Collagen Type I Elastin Blend Polymerization. Polymers 2022, 14, 4434. https://doi.org/10.3390/polym14204434
Wilharm N, Fischer T, Hayn A, Mayr SG. Structural Breakdown of Collagen Type I Elastin Blend Polymerization. Polymers. 2022; 14(20):4434. https://doi.org/10.3390/polym14204434
Chicago/Turabian StyleWilharm, Nils, Tony Fischer, Alexander Hayn, and Stefan G. Mayr. 2022. "Structural Breakdown of Collagen Type I Elastin Blend Polymerization" Polymers 14, no. 20: 4434. https://doi.org/10.3390/polym14204434
APA StyleWilharm, N., Fischer, T., Hayn, A., & Mayr, S. G. (2022). Structural Breakdown of Collagen Type I Elastin Blend Polymerization. Polymers, 14(20), 4434. https://doi.org/10.3390/polym14204434