
The Effect of Flame Retardant—Aluminum Trihydroxide on Mixed Mode I/II Fracture Toughness of Epoxy Resin

 ,
,  ,
,  , , ,
, , ,  ,
,  and
and
Abstract
1. Introduction
- Flame-retardant organic compounds bound to the polymer during synthesis or cross-linking. Such compounds (mainly used for polyesters, polyurethanes, or epoxides) include, for example, pentabromophenol, and polyols containing phosphorus, nitrogen, or halogens.
- Compounds non-reactive towards the polymer are usually added during the processing of thermoplastics. This group includes, among others, halogen compounds, brominated diphenyl oxides, chlorinated and brominated paraffins, antimony compounds, aluminum and magnesium hydroxides, boron compounds, and melanin derivatives [17].
- -
- colloidal silica and kaolinite—require the use of high concentrations, which unfortunately deteriorates the mechanical properties of polymeric materials,
- -
- montmorillonite—it is recommended to mix this with metal hydroxides, which improves the effectiveness of protection and allows the reduction of the concentration of flame retardants; a concentration of 5–10 phr is sufficient, which simultaneously improves the mechanical properties of polymeric materials,
- -
- aluminum hydroxide Al(OH)3— used in a concentration even above 60 phr, forming a glassy layer on the surface of the polymer material under the influence of heating, which prevents fire propagation. During combustion, metal hydroxides decompose and release water. This decreases the temperature of the matrix, reduces the quantity of oxygen in the air, reduces the toxicity of exhaust gases, and causes endothermic dehydration, absorbing the heat [23]. One of the main disadvantages is the amount of filling required to obtain the desired flame-resistance effect, which can be up to 40 %wt. This can lead to a reduction of the fluidity of the resin and deterioration of mechanical properties. It also significantly influences industrial processing, such as mixing, molding, and fiber wettability. Magnesium hydroxide Mg(OH)2—in a concentration above 60 phr, this reduces the flammability of polymeric materials exposed to higher temperatures, where Al(OH)3 is not very stable. Unfortunately, it worsens the mechanical properties of the material.
2. Materials and Methods
Materials
3. Results and Discussion
4. Conclusions
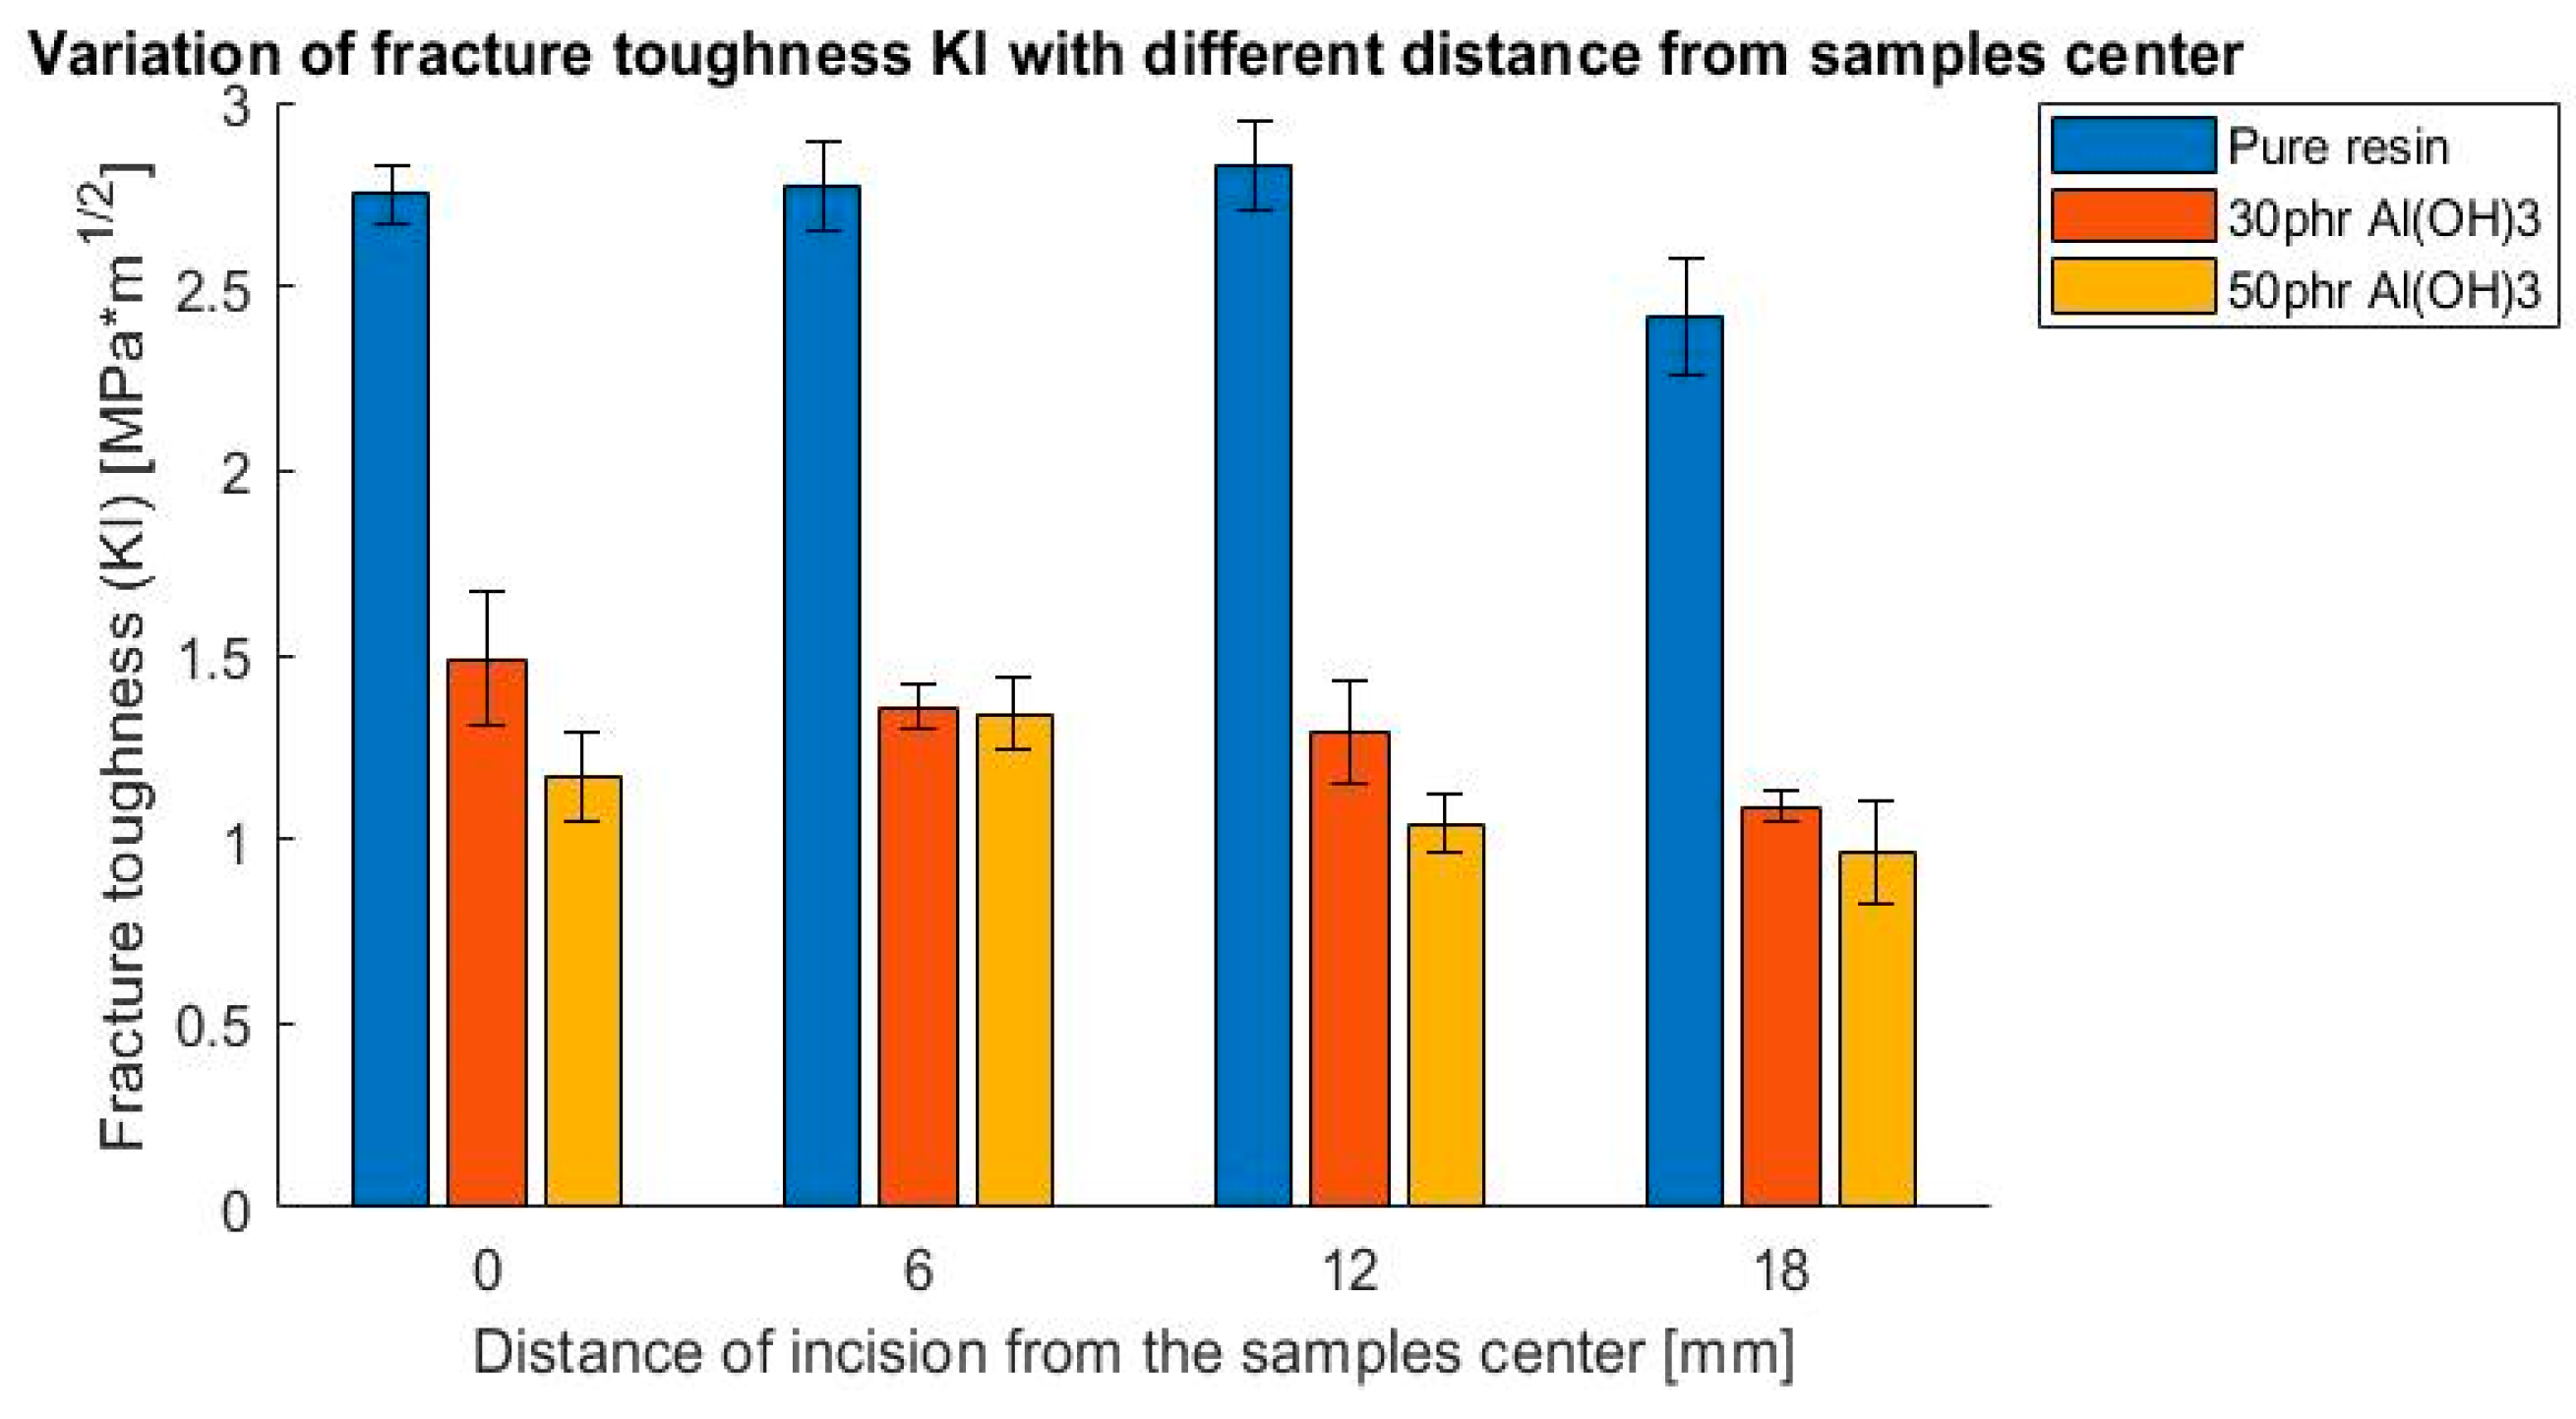
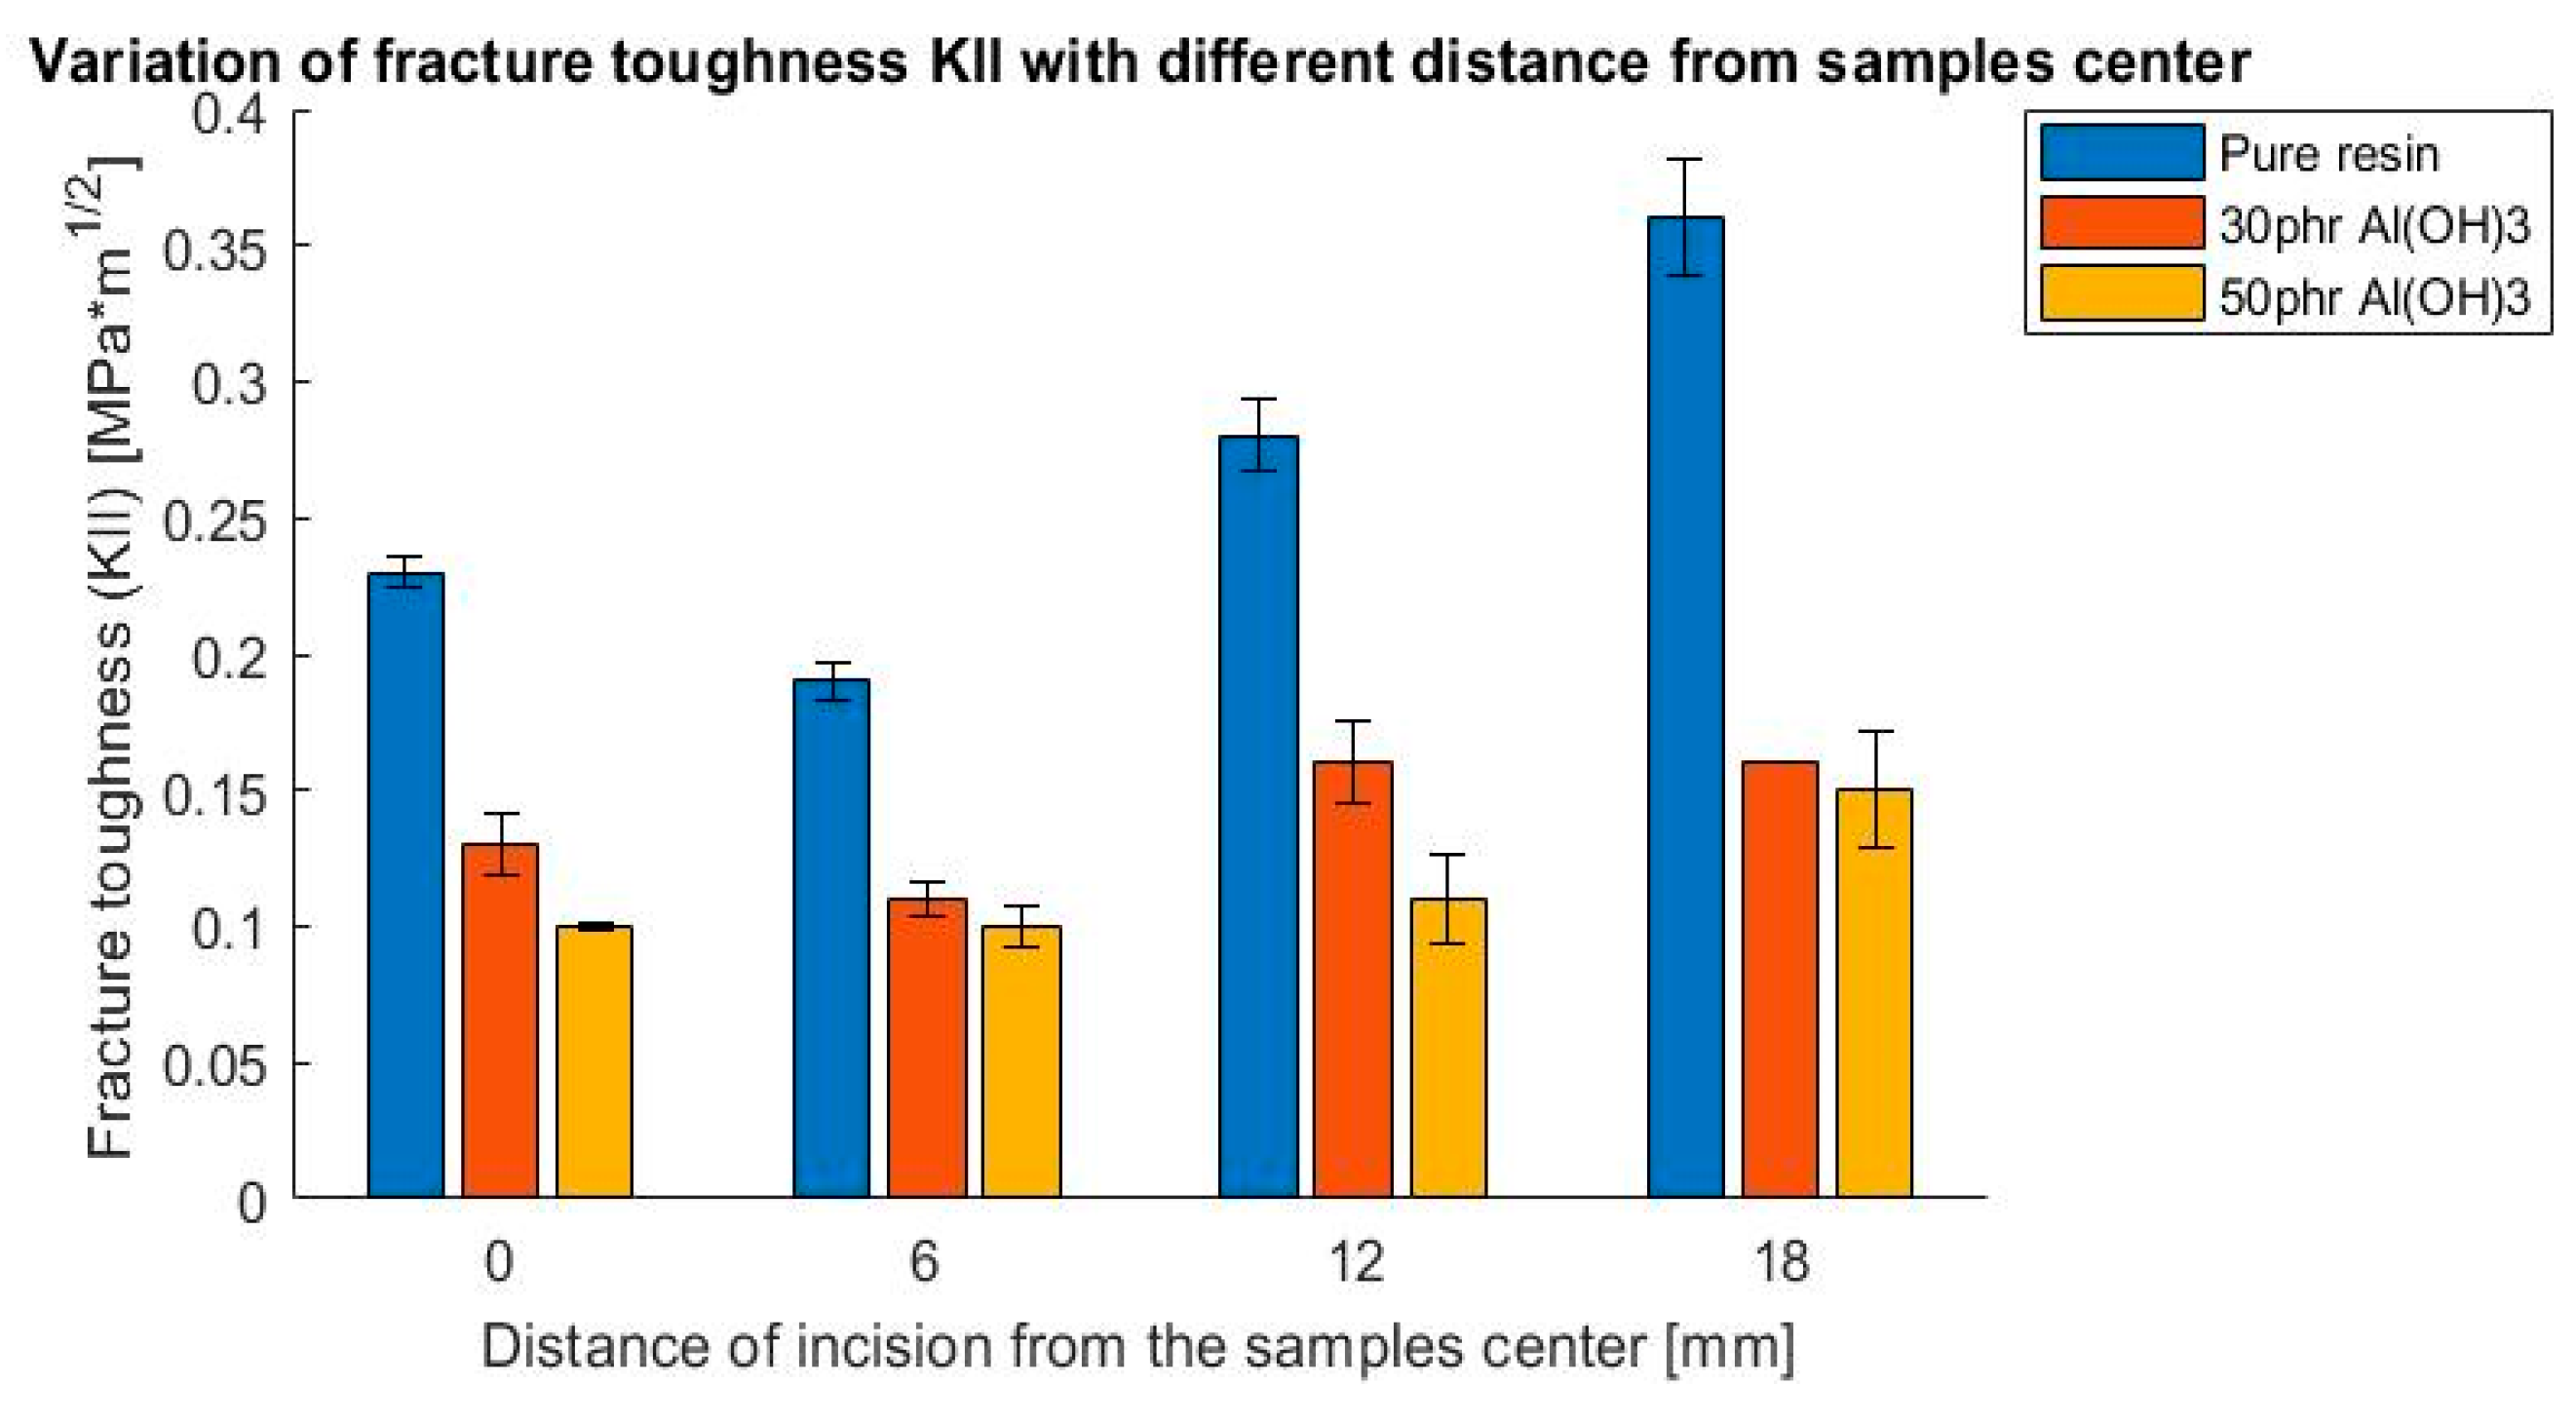
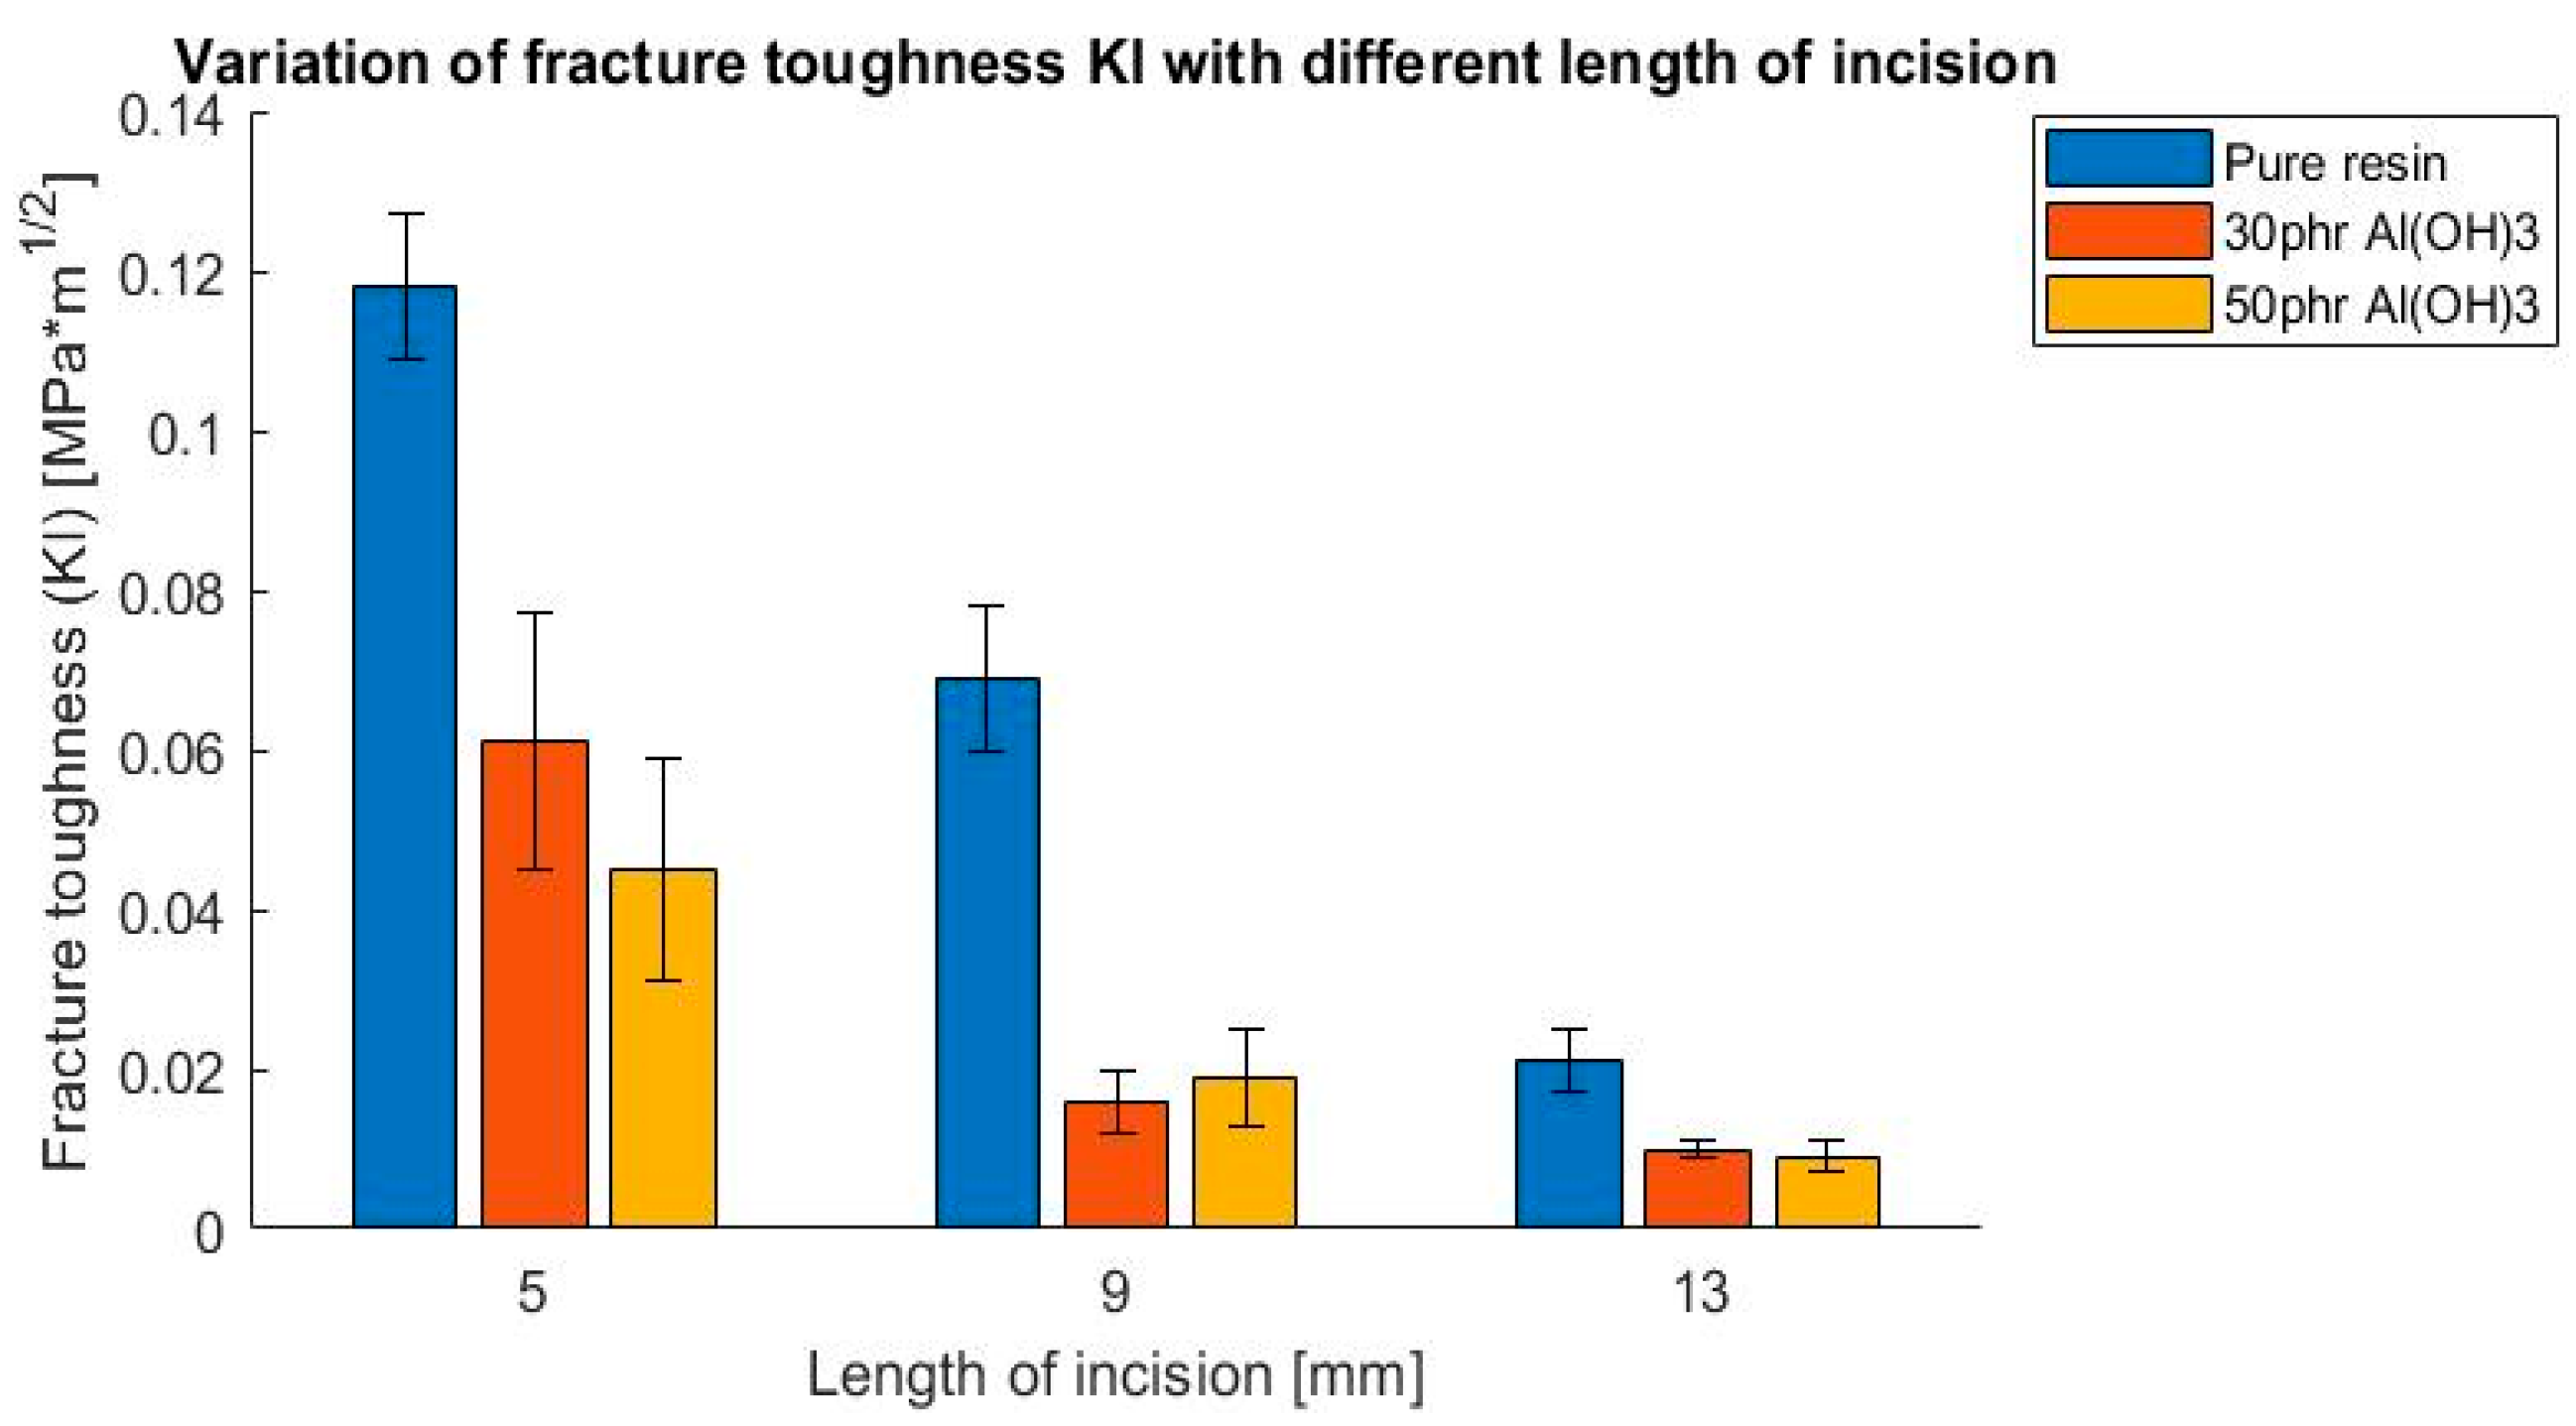
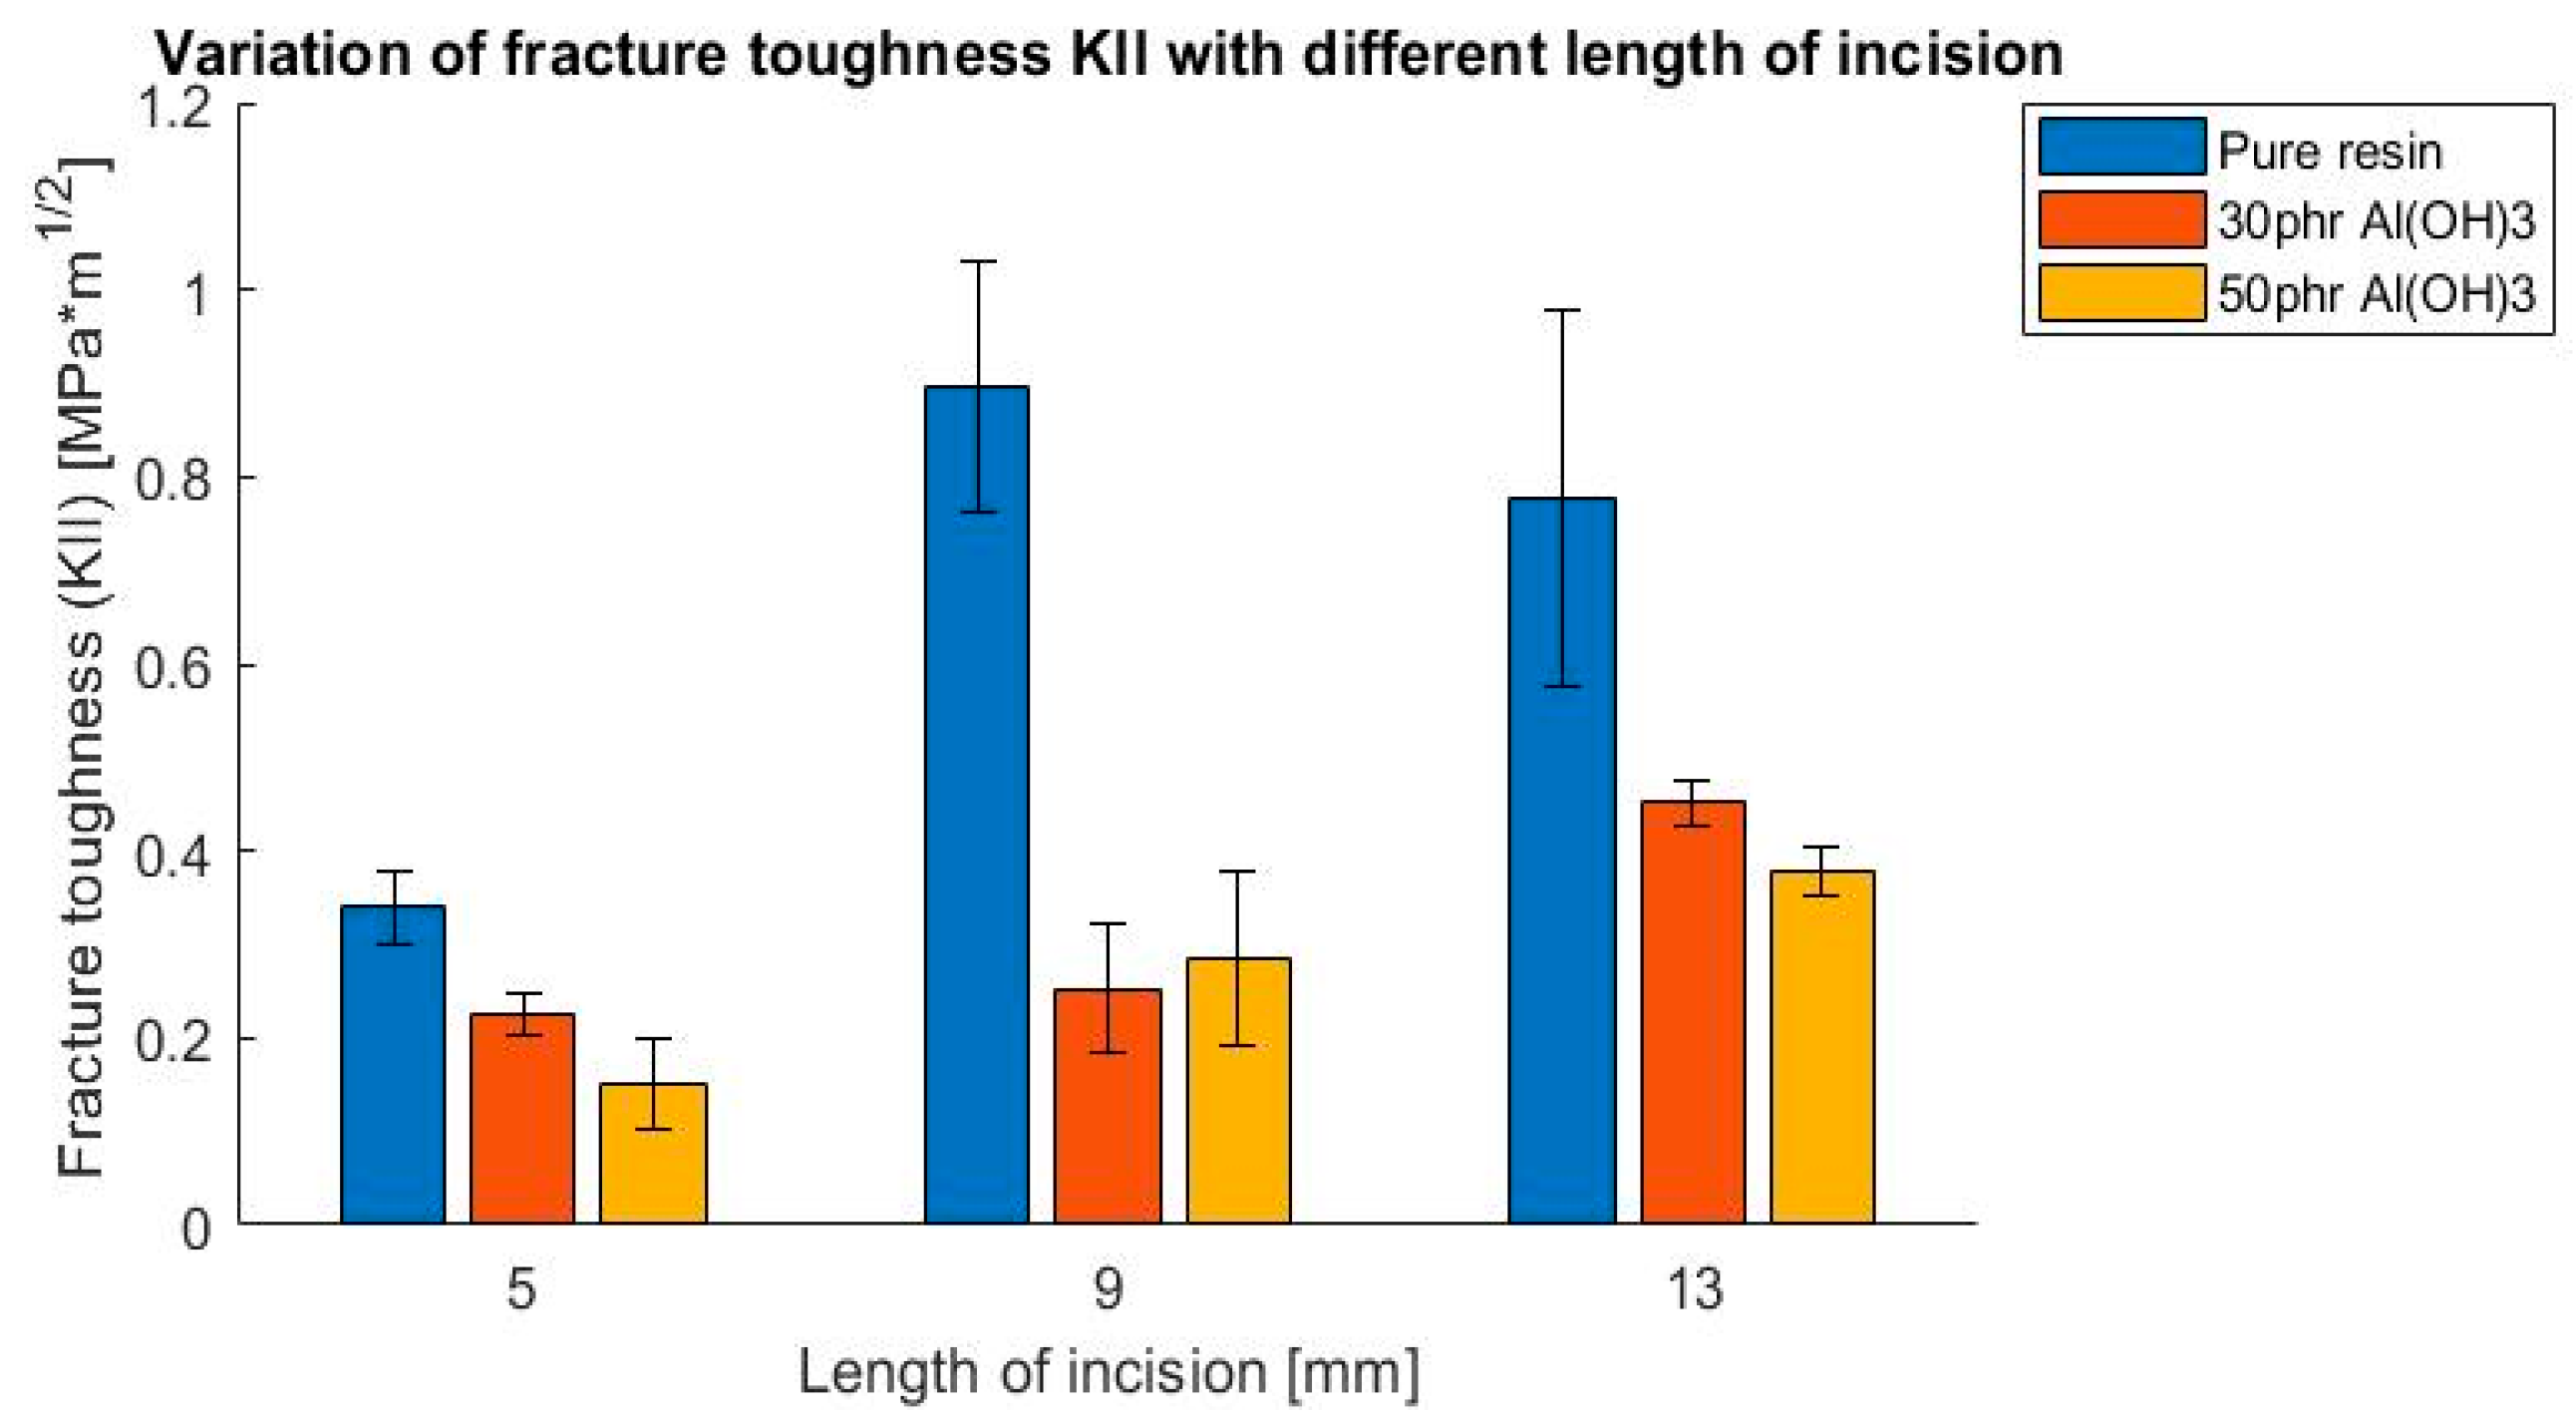
- The addition of ATH filler, despite the increase in flame resistance, causes a significant decrease in fracture toughness resistance. The fracture toughness value was reduced by more than 50%, when comparing neat resin with the modified resin.
- Changes in fracture toughness between the resin with 30 phr Al(OH)3 and 50 phr Al(OH)3 filler were insignificant.
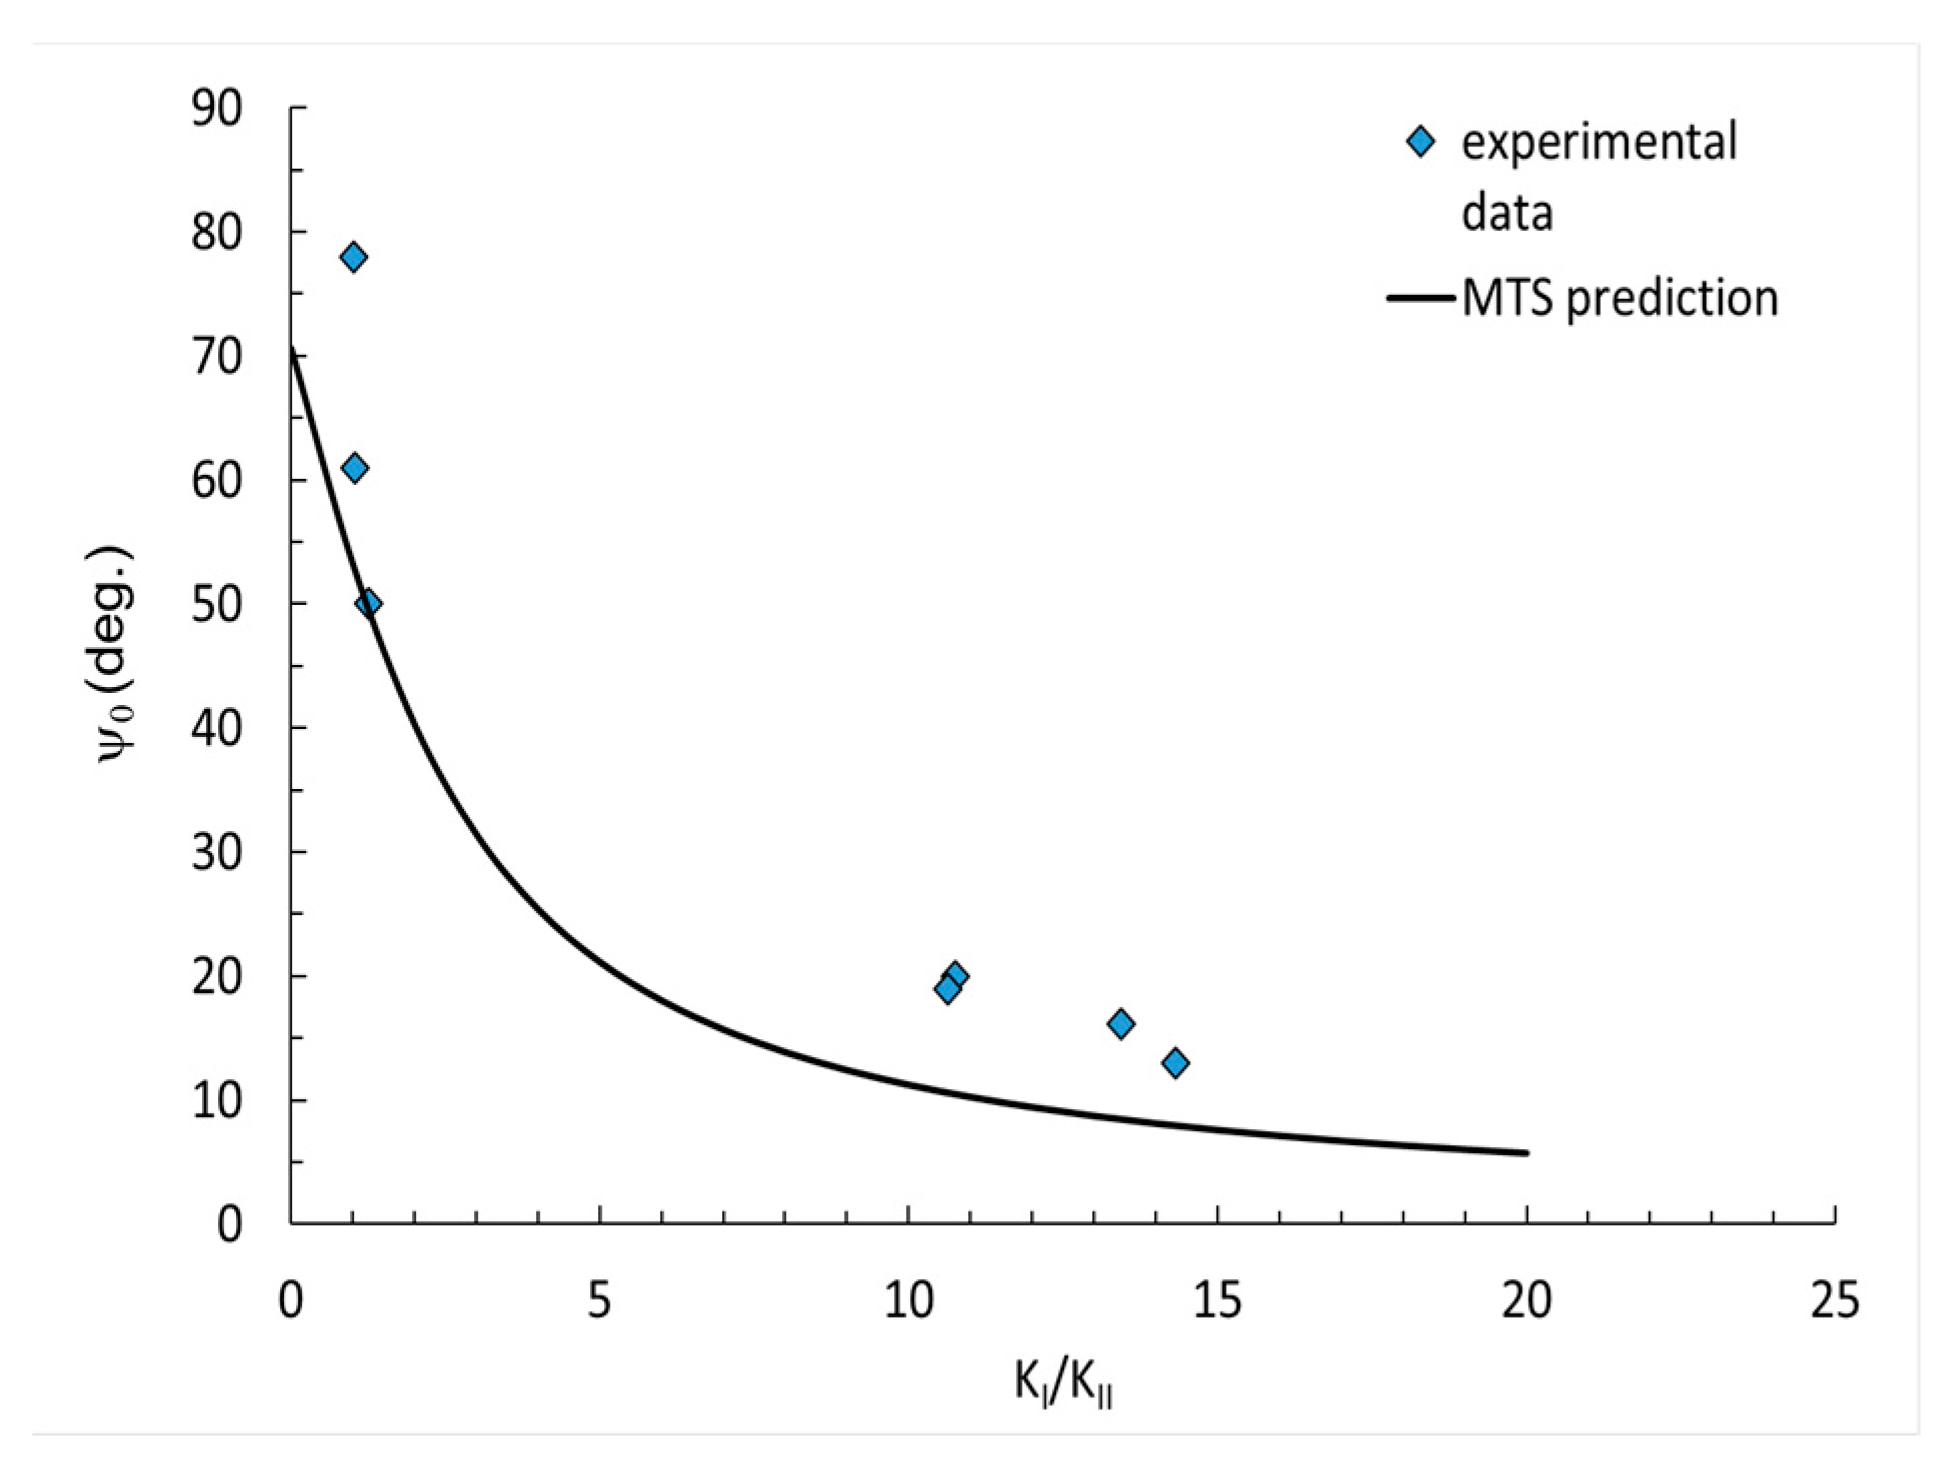
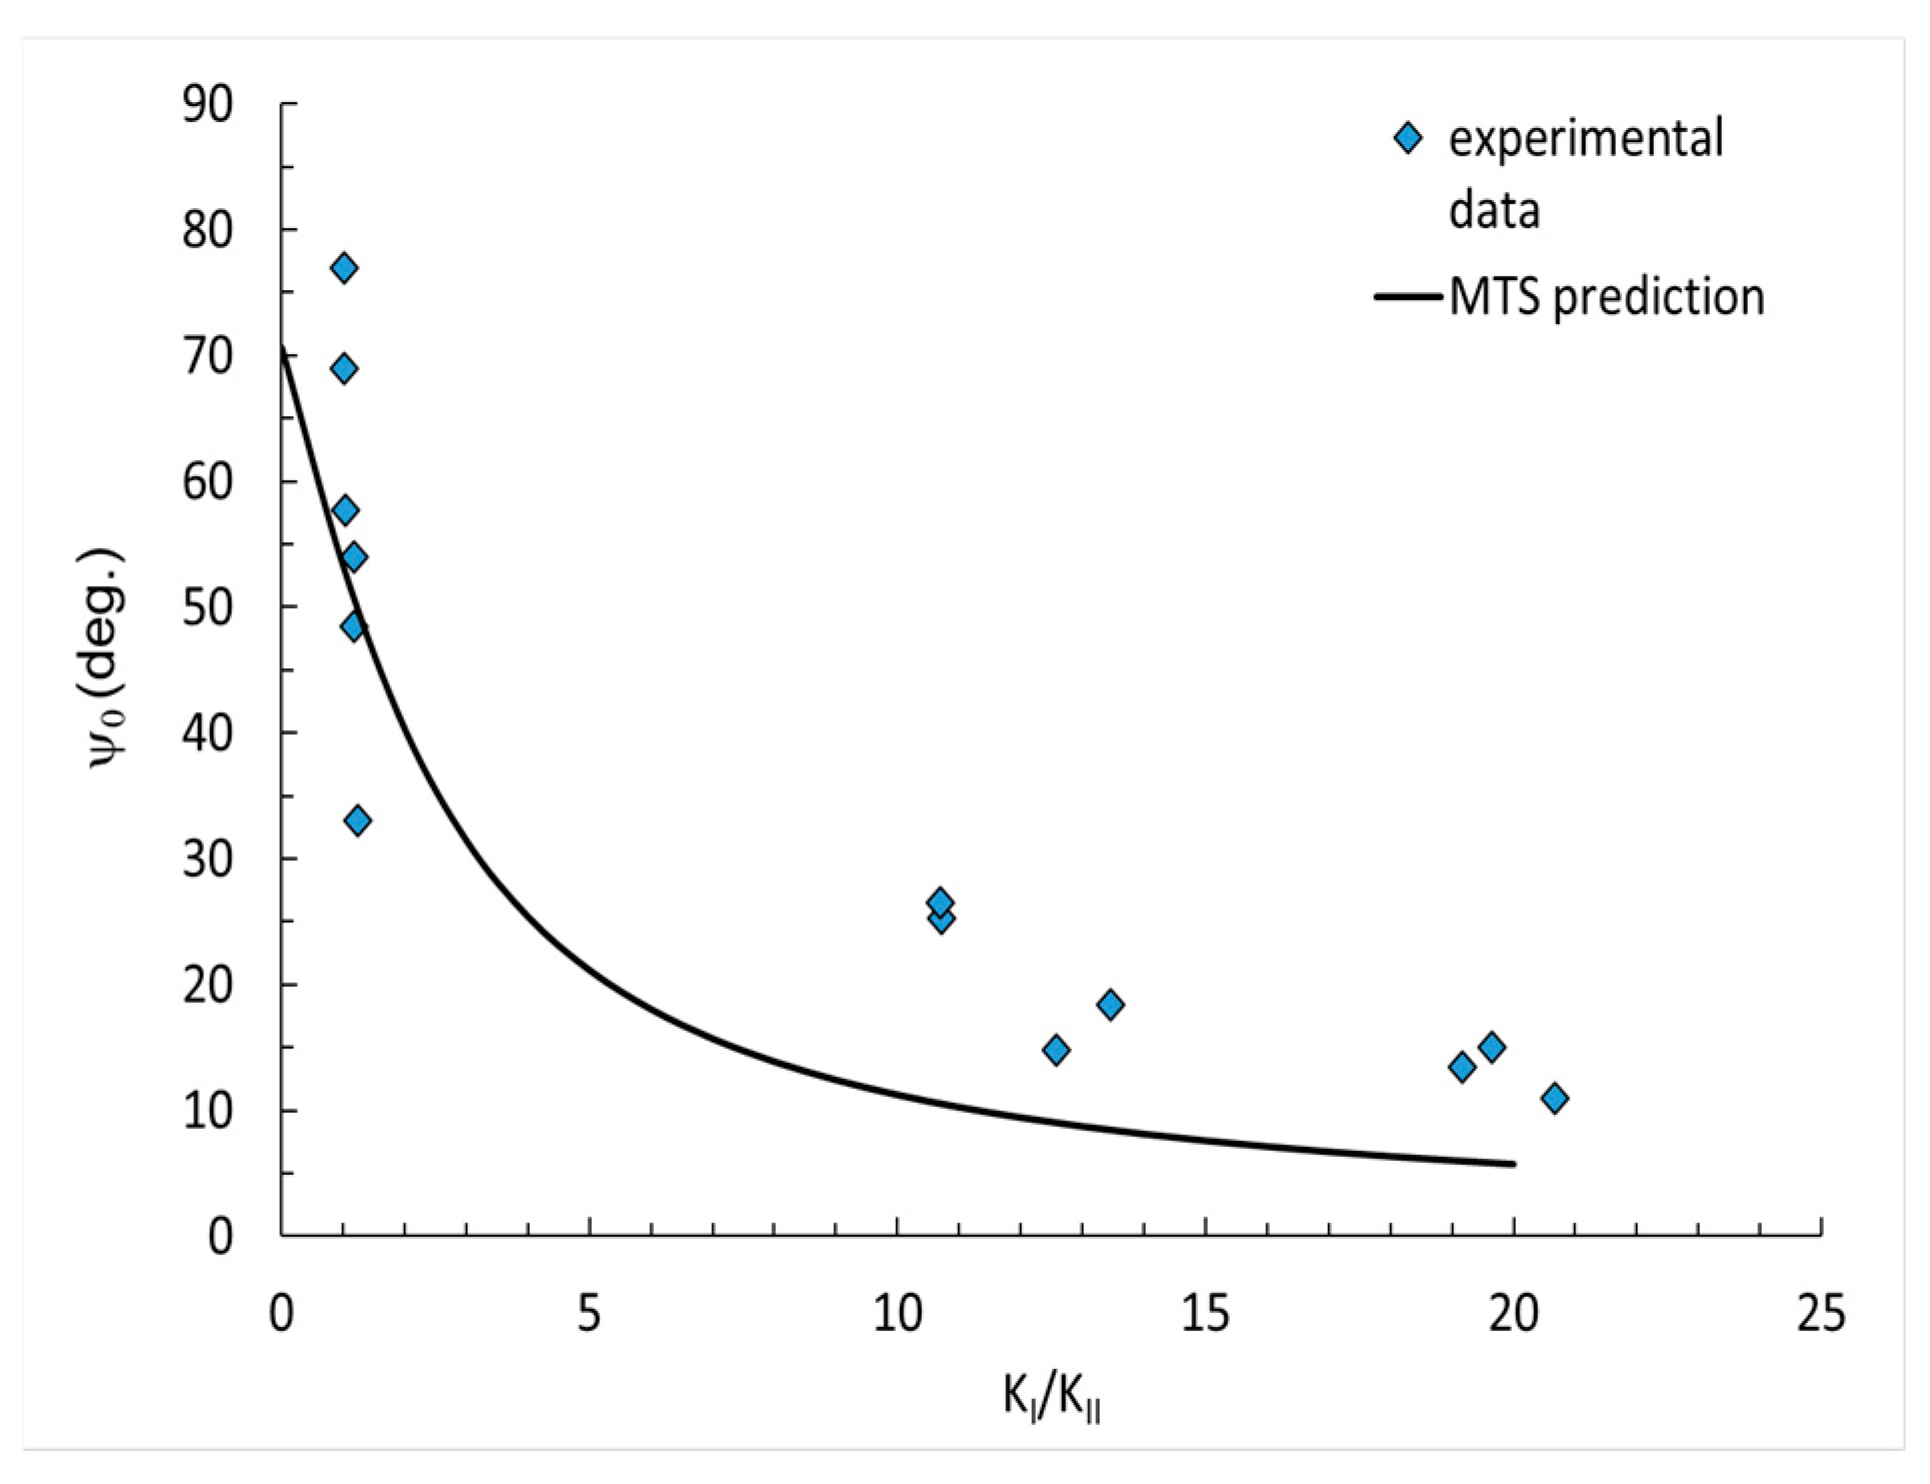
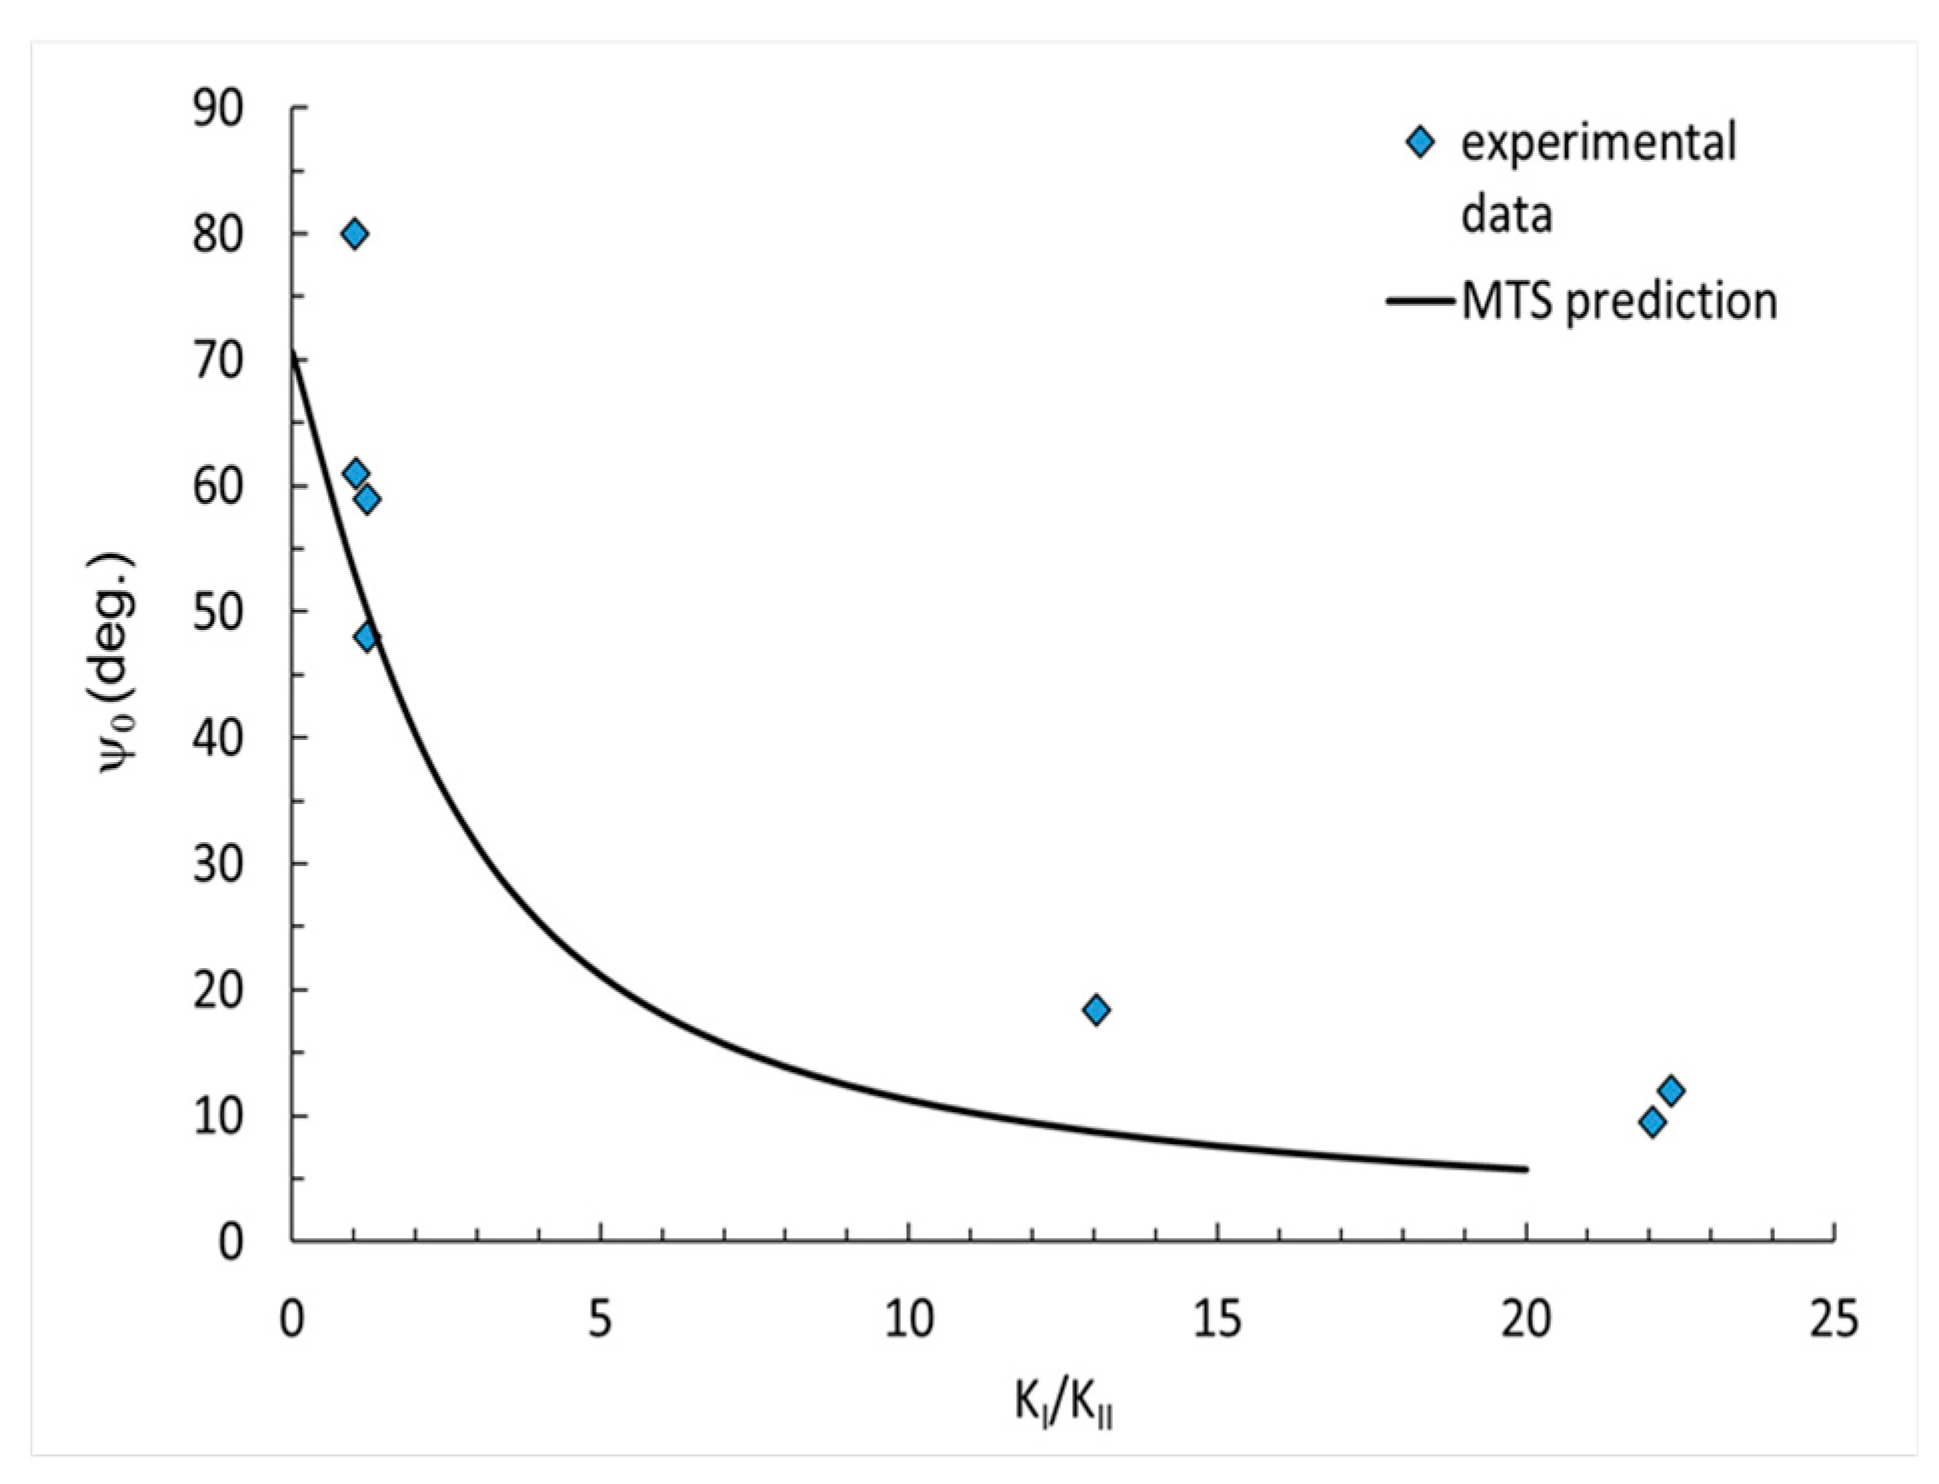
- The comparison of the experimental data and analytical prediction showed that the experimental data of the crack initiation angle for higher values of KI/KII factor had a reasonable correlation with MTS prediction.
- For small values of the factor KI/KII, the results of the crack initiation angle had significant divergences. The points for the crack initiation angle measured after the experiment basically demonstrated a similar nature of curve as those obtained from the prediction. As such, it may be necessary to introduce a correction parameter, to better correlate with the MTS prediction.
Author Contributions
Funding
Institutional Review Board Statement
Informed Consent Statement
Data Availability Statement
Acknowledgments
Conflicts of Interest
References
- British Standards Institution. Fire Classification of Construction Products and Building Elements. Classification Using Data from Reaction to Fire Tests; EN 13501; British Standards Institution: London, UK, 2018. [Google Scholar]
- US Fire Administration. Fire Death Rate Trends: An International Perspective; Topical Fire Report Series; US Fire Administration: Emmitsburg, MD, USA, 2011; Volume 12, pp. 1–8.
- Zhang, Q.; Wang, Y.C.; Soutis, C.; Bailey, C.G.; Hu, Y. Fire Safety Assessment of Epoxy Composites Reinforced by Carbon Fibre and Graphene. Appl. Compos. Mater. 2020, 27, 619–639. [Google Scholar] [CrossRef]
- Mujahid, Y.; Sallih, N.; Mustapha, M.; Abdullah, M.Z.; Mustapha, F. Effects of Processing Parameters for Vacuum-Bagging-Only Method on Shape Conformation of Laminated Composites. Processes 2020, 8, 1147. [Google Scholar] [CrossRef]
- Shevtsov, S.; Zhilyaev, I.; Chang, S.H.; Wu, J.K.; Snezhina, N. Multi-Criteria Decision Approach to Design a Vacuum Infusion Process Layout Providing the Polymeric Composite Part Quality | Enhanced Reader. Polymers 2022, 14, 313. [Google Scholar] [CrossRef] [PubMed]
- Barcikowski, M.; Lesiuk, G.; Czechowski, K.; Duda, S. Static and Flexural Fatigue Behavior of GFRP Pultruded Rebars. Materials 2021, 14, 297. [Google Scholar] [CrossRef] [PubMed]
- Duda, S.; Lesiuk, G.; Zielonka, P.; Stabla, P.; Lubecki, M.; Ziółkowski, G. Flexural Pseudo-Ductility Effect in Hybrid GFRP/CFRP Bars under Static Loading Conditions. Materials 2021, 14, 5608. [Google Scholar] [CrossRef] [PubMed]
- Stabla, P.; Smolnicki, M.; Błażejewski, W. The Numerical Approach to Mosaic Patterns in Filament-Wound Composite Pipes. Appl. Compos. Mater. 2021, 28, 181–199. [Google Scholar] [CrossRef]
- Błażejewski, W.; Barcikowski, M.; Lubecki, M.; Stabla, P.; Bury, P.; Stosiak, M.; Lesiuk, G. The Mechanical Investigation of Filament-Wound CFRP Structures Subjected to Different Cooling Rates in Terms of Compressive Loading and Residual Stresses—An Experimental Approach. Materials 2021, 14, 1041. [Google Scholar] [CrossRef]
- Stabla, P.; Lubecki, M.; Smolnicki, M. The effect of mosaic pattern and winding angle on radially compressed filament-wound CFRP composite tubes. Compos. Struct. 2022, 292, 115644. [Google Scholar] [CrossRef]
- Azeem, M.; Ya, H.H.; Alam, M.A.; Kumar, M.; Stabla, P.; Smolnicki, M.; Gemi, L.; Khan, R.; Ahmed, T.; Ma, Q.; et al. Application of Filament Winding Technology in Composite Pressure Vessels and Challenges: A Review. J. Energy Storage 2022, 49, 103468. [Google Scholar] [CrossRef]
- Kim, Y.; Lee, S.; Yoon, H. Fire-Safe Polymer Composites: Flame-Retardant Effect of Nanofillers. Polymers 2021, 13, 540. [Google Scholar] [CrossRef] [PubMed]
- Laoutid, F.; Bonnaud, L.; Alexandre, M.; Lopez-Cuesta, J.-M.; Dubois, P. New prospects in flame retardant polymer materials: From fundamentals to nanocomposites. Mater. Sci. Eng. R Rep. 2009, 63, 100–125. [Google Scholar] [CrossRef]
- Bourbigot, S.; Duquesne, S. Fire retardant polymers: Recent developments and opportunities. J. Mater. Chem. 2007, 17, 2283–2300. [Google Scholar] [CrossRef]
- Norouzi, M.; Zare, Y.; Kiany, P. Nanoparticles as Effective Flame Retardants for Natural and Synthetic Textile Polymers: Application, Mechanism, and Optimization. Polym. Rev. 2015, 55, 531–560. [Google Scholar] [CrossRef]
- Shen, J.; Liang, J.; Lin, X.; Lin, H.; Yu, J.; Wang, S. The Flame-Retardant Mechanisms and Preparation of Polymer Composites and Their Potential Application in Construction Engineering. Polymers 2021, 14, 82. [Google Scholar] [CrossRef] [PubMed]
- Jagdale, P.; Salimpour, S.; Islam, M.H.; Cuttica, F.; Hernandez, F.C.R.; Tagliaferro, A.; Frache, A. Flame retardant effect of nano fillers on polydimethylsiloxane composites. J. Nanosci. Nanotechnol. 2018, 18, 1468–1473. [Google Scholar] [CrossRef] [PubMed]
- Lazar, S.T.; Kolibaba, T.J.; Grunlan, J.C. Flame-retardant surface treatments. Nat. Rev. Mater. 2020, 5, 259–275. [Google Scholar] [CrossRef]
- Maqsood, M.; Seide, G. Biodegradable Flame Retardants for Biodegradable Polymer. Biomolecules 2020, 10, 1038. [Google Scholar] [CrossRef] [PubMed]
- Lyon, R.E.; Balaguru, P.N.; Foden, A.; Sorathia, U.; Davidovits, J.; Davidovics, M. Fire-resistant Aluminosilicate Composites. Fire Mater. 1997, 21, 67–73. [Google Scholar] [CrossRef]
- Deraman, L.M.; Abdullah, M.M.A.; Ming, L.Y.; Ibrahim, W.M.W.; Tahir, M.F.M. Mechanical properties on geopolymer brick: A review. In AIP Conference Proceedings; AIP Publishing LLC: Melville, NY, USA, 2017; Volume 1885, p. 20047. [Google Scholar] [CrossRef]
- Mackenzie, K.J.D.; Welter, M. Geopolymer (aluminosilicate) composites: Synthesis, properties and applications. In Advances in Ceramic Matrix Composites, 2nd ed.; Elsevier Inc.: Amsterdam, The Netherlands, 2014; pp. 545–568. [Google Scholar]
- Beyer, G. Flame retardant properties of EVA-nanocomposites and improvements by combination of nanofillers with aluminium trihydrate. Fire Mater. 2001, 25, 193–197. [Google Scholar] [CrossRef]
- Adachi, T.; Araki, W.; Nakahara, T.; Yamaji, A.; Gamou, M. Fracture toughness of silica particulate-filled epoxy composite. J. Appl. Polym. Sci. 2002, 86, 2261–2265. [Google Scholar] [CrossRef]
- Kwon, S.-C.; Adachi, T.; Araki, W.; Yamaji, A. Effect of composing particles of two sizes on mechanical properties of spherical silica-particulate-reinforced epoxy composites. Compos. Part B Eng. 2008, 39, 740–746. [Google Scholar] [CrossRef]
- Liu, S.; Yan, H.; Fang, Z.; Wang, H. Effect of graphene nanosheets on morphology, thermal stability and flame retardancy of epoxy resin. Compos. Sci. Technol. 2014, 90, 40–47. [Google Scholar] [CrossRef]
- Liu, S.; Fang, Z.; Yan, H.; Wang, H. Superior flame retardancy of epoxy resin by the combined addition of graphene nanosheets and DOPO. RSC Adv. 2016, 6, 5288–5295. [Google Scholar] [CrossRef]
- Kovačević, Z.; Grgac, S.F.; Bischof, S. Progress in Biodegradable Flame Retardant Nano-Biocomposites. Polymers 2021, 13, 741. [Google Scholar] [CrossRef] [PubMed]
- Madyaratri, E.W.; Ridho, M.R.; Aristri, M.A.; Lubis, M.A.R.; Iswanto, A.H.; Nawawi, D.S.; Antov, P.; Kristak, L.; Majlingová, A.; Fatriasari, W. Recent Advances in the Development of Fire-Resistant Biocomposites—A Review. Polymers 2022, 14, 362. [Google Scholar] [CrossRef] [PubMed]
- Villamil Watson, D.A.; Schiraldi, D.A. Biomolecules as Flame Retardant Additives for Polymers: A Review. Polymers 2020, 12, 849. [Google Scholar] [CrossRef] [PubMed]
- Qiu, Y.; Qian, L.; Chen, Y.; Hao, J. Improving the fracture toughness and flame retardant properties of epoxy thermosets by phosphaphenanthrene/siloxane cluster-like molecules with multiple reactive groups. Compos. Part B Eng. 2019, 178, 107481. [Google Scholar] [CrossRef]
- Bajpai, A.; Alapati, A.K.; Klingler, A.; Wetzel, B. Tensile Properties, Fracture Mechanics Properties and Toughening Mechanisms of Epoxy Systems Modified with Soft Block Copolymers, Rigid TiO2 Nanoparticles and Their Hybrids. J. Compos. Sci. 2018, 2, 72. [Google Scholar] [CrossRef]
- Häublein, M.; Peter, K.; Bakis, G.; Mäkimieni, R.; Altstädt, V.; Möller, M. Investigation on the Flame Retardant Properties and Fracture Toughness of DOPO and Nano-SiO2 Modified Epoxy Novolac Resin and Evaluation of Its Combinational Effects. Materials 2019, 12, 1528. [Google Scholar] [CrossRef] [PubMed]
- Kostagiannakopoulou, C.; Tsilimigkra, X.; Sotiriadis, G.; Kostopoulos, V. Synergy effect of carbon nano-fillers on the fracture toughness of structural composites. Compos. Part B Eng. 2017, 129, 18–25. [Google Scholar] [CrossRef]
- Ma, H.; Aravand, M.A.; Falzon, B.G. Synergistic enhancement of fracture toughness in multiphase epoxy matrices modified by thermoplastic and carbon nanotubes. Compos. Sci. Technol. 2020, 201, 108523. [Google Scholar] [CrossRef]
- Zhang, R.; Mohammed, I.K.; Taylor, A.C.; Charalambides, M.N. A microstructure image-based numerical model for predicting the fracture toughness of alumina trihydrate (ATH) filled poly(methyl methacrylate) (PMMA) composites. Compos. Part B Eng. 2022, 232, 109632. [Google Scholar] [CrossRef]
- Lauke, B. On the effect of particle size on fracture toughness of polymer composites. Compos. Sci. Technol. 2008, 68, 3365–3372. [Google Scholar] [CrossRef]
- Evans, A.G.; Williams, S.; Beaumont, P.W.R. On the toughness of particulate filled polymers. J. Mater. Sci. 1985, 20, 3668–3674. [Google Scholar] [CrossRef]
- Asim Iqbal, M.; Ahsan Iqbal, M.; Javaid, A. Synergistic effect of aluminum hydroxide and antimony trioxide on the flammability of phosphorous modified epoxy resin. Pak. J. Eng. Appl. Sci. 2019, 24, 50–56. [Google Scholar]
- Zhao, Q.; Jia, Z.; Li, X.; Ye, Z. Effect of Al(OH)3 particle fraction on mechanical properties of particle-reinforced composites using unsaturated polyester as matrix. J. Fail. Anal. Prev. 2010, 10, 515–519. [Google Scholar] [CrossRef]
- Qin, Z.; Li, D.; Li, Q.; Yang, R. Effect of nano-aluminum hydroxide on mechanical properties, flame retardancy and combustion behavior of intumescent flame retarded polypropylene. Mater. Des. 2016, 89, 988–995. [Google Scholar] [CrossRef]
- Petersen, M.R.; Chen, A.; Roll, M.; Jung, S.; Yossef, M. Mechanical properties of fire-retardant glass fiber-reinforced polymer materials with alumina tri-hydrate filler. Compos. Part B Eng. 2015, 78, 109–121. [Google Scholar] [CrossRef]
- Alam Ansari, T.; Singh, K.K.; Azam, M.S. Fatigue damage analysis of fiber-reinforced polymer composites—A review. J. Reinf. Plast. Compos. 2018, 37, 636–654. [Google Scholar] [CrossRef]
- Carraro, P.A.; Maragoni, L.; Quaresimin, M. Characterisation and analysis of transverse crack-induced delamination in cross-ply composite laminates under fatigue loadings. Int. J. Fatigue 2019, 129, 105217. [Google Scholar] [CrossRef]
- Simonetto, M.; Carraro, P.; Maragoni, L.; Quaresimin, M. Crack initiation and evolution in glass/epoxy laminates under two-stage block loadings. Compos. Sci. Technol. 2022, 225, 109504. [Google Scholar] [CrossRef]
- Glud, J.; Carraro, P.; Quaresimin, M.; Dulieu-Barton, J.; Thomsen, O.; Overgaard, L. A damage-based model for mixed-mode crack propagation in composite laminates. Compos. Part A Appl. Sci. Manuf. 2018, 107, 421–431. [Google Scholar] [CrossRef]
- Carraro, P.; Maragoni, L.; Quaresimin, M. Damage evolution in cross-ply laminates under tension–compression and compression-compression cyclic loads. Compos. Part A Appl. Sci. Manuf. 2022, 156, 106888. [Google Scholar] [CrossRef]
- Oterkus, E.; Diyaroglu, C.; de Meo, D.; Allegri, G. Fracture modes, damage tolerance and failure mitigation in marine composites. In Marine Applications of Advanced Fibre-Reinforced Composites; Elsevier: Amsterdam, The Netherlands, 2016; pp. 79–102. [Google Scholar]
- Talreja, R. Multiscale failure assessment of composite laminates. In Modeling Damage, Fatigue and Failure of Composite Materials; Elsevier: Amsterdam, The Netherlands, 2016; pp. 349–355. [Google Scholar]
- Salvucci, O.; Tosato, G. Essential Roles of EphB Receptors and EphrinB Ligands in Endothelial Cell Function and Angiogenesis. Adv. Cancer Res. 2012, 114, 21–57. [Google Scholar]
- Leite, B.M.; Leite, L.F.M.; Reis, V.L.; Donadon, M.V.; da Silveira, N.N.A. Strain rate effects on the intralaminar fracture toughness of composite laminates subjected to compressive load. Compos. Struct. 2018, 186, 94–105. [Google Scholar] [CrossRef]
- Smolnicki, M.; Duda, S.; Stabla, P.; Osiecki, T. Mechanical investigation on interlaminar behaviour of inverse FML using acoustic emission and finite element method. Compos. Struct. 2022, 294, 115810. [Google Scholar] [CrossRef]
- Cantwell, W.J.; Kausch, H.H. Fracture behaviour of epoxy resins. In Chemistry and Technology of Epoxy Resins; Springer: Dordrecht, The Netherlands, 1993; pp. 144–174. [Google Scholar]
- Kaynak, C.; Nakas, G.I.; Isitman, N.A. Mechanical properties, flammability and char morphology of epoxy resin/montmorillonite nanocomposites. Appl. Clay Sci. 2009, 46, 319–324. [Google Scholar] [CrossRef]
- Yossef, M.; Chen, A. A Numerical Model to Study the Effect of Alumina Tri-Hydrate on Mechanical Properties of Fiber Reinforced Polymers. Earth Space 2016, 2016, 858–868. [Google Scholar]
- Paszkiewicz, S.; Irska, I.; Taraghi, I.; Piesowicz, E.; Sieminski, J.; Zawisza, K.; Pypeć, K.; Dobrzynska, R.; Terelak-Tymczyna, A.; Stateczny, K.; et al. Halloysite Nanotubes and Silane-Treated Alumina Trihydrate Hybrid Flame Retardant System for High-Performance Cable Insulation. Polymers 2021, 13, 2134. [Google Scholar] [CrossRef]
- Zhang, Q.; Wang, J.; Yang, S.; Cheng, J.; Ding, G.; Hu, Y.; Huo, S. Synthesis of a P/N/S-based flame retardant and its flame retardant effect on epoxy resin. Fire Saf. J. 2020, 113, 102994. [Google Scholar] [CrossRef]
- Araki, W.; Asahi, D.; Adachi, T.; Yamaji, A. Time-temperature dependency of mode II fracture toughness for bisphenol A type epoxy resin. J. Appl. Polym. Sci. 2005, 96, 51–55. [Google Scholar] [CrossRef]
- Araki, W.; Adachi, T.; Yamaji, A.; Gamou, M. Fracture toughness of bisphenol A-type epoxy resin. J. Appl. Polym. Sci. 2002, 86, 2266–2271. [Google Scholar] [CrossRef]
- Fett, T.; Gerteisen, G.; Hahnenberger, S.; Martin, G.; Munz, D. Fracture tests for ceramics under mode-I, mode-II and mixed-mode loading. J. Eur. Ceram. Soc. 1995, 15, 307–312. [Google Scholar] [CrossRef]
- Fett, T. Stress intensity factors for edge crack subjected to mixed mode four-point bending. Theor. Appl. Fract. Mech. 1991, 15, 99–104. [Google Scholar] [CrossRef]
- Araki, W.; Nemoto, K.; Adachi, T.; Yamaji, A. Fracture toughness for mixed mode I/II of epoxy resin. Acta Mater. 2005, 53, 869–875. [Google Scholar] [CrossRef]
- Ševčík, M.; Hutař, P.; Náhlík, L.; Seitl, S. The effect of constraint level on a crack path. Eng. Fail. Anal. 2013, 29, 83–92. [Google Scholar] [CrossRef]


| Biresin CR141 Sika Company | Biresin CH141 Sika Company | Biresin CA141 Sika Company | |
|---|---|---|---|
| Resin (A) | Hardener (B) | Accelerator (C) | |
| Components | ≥90% bisphenol-A-(epichloryhydrin) epoxy resin (number average molecular weight ≤ 700) | ≥50%–≤100% tetrahydromethylphthalic anhydride | ≥50%–≤100% 1-methylimidazole |
| Mixing ratio, parts by weights | 100 | 90 | 2 |
| Type of Properties | Standard | Value | |
|---|---|---|---|
| Tensile strength | ISO 527 | 78 | MPa |
| Tensile E-modulus | ISO 527 | 3.2 | MPa |
| Elongation at break | ISO 527 | 3.3 | % |
| Flexural strength | ISO 178 | 145 | MPa |
| Flexural E-Modulus | ISO 178 | 3.1 | MPa |
| Density | ISO 1183 | 1.2 | g/cm3 |
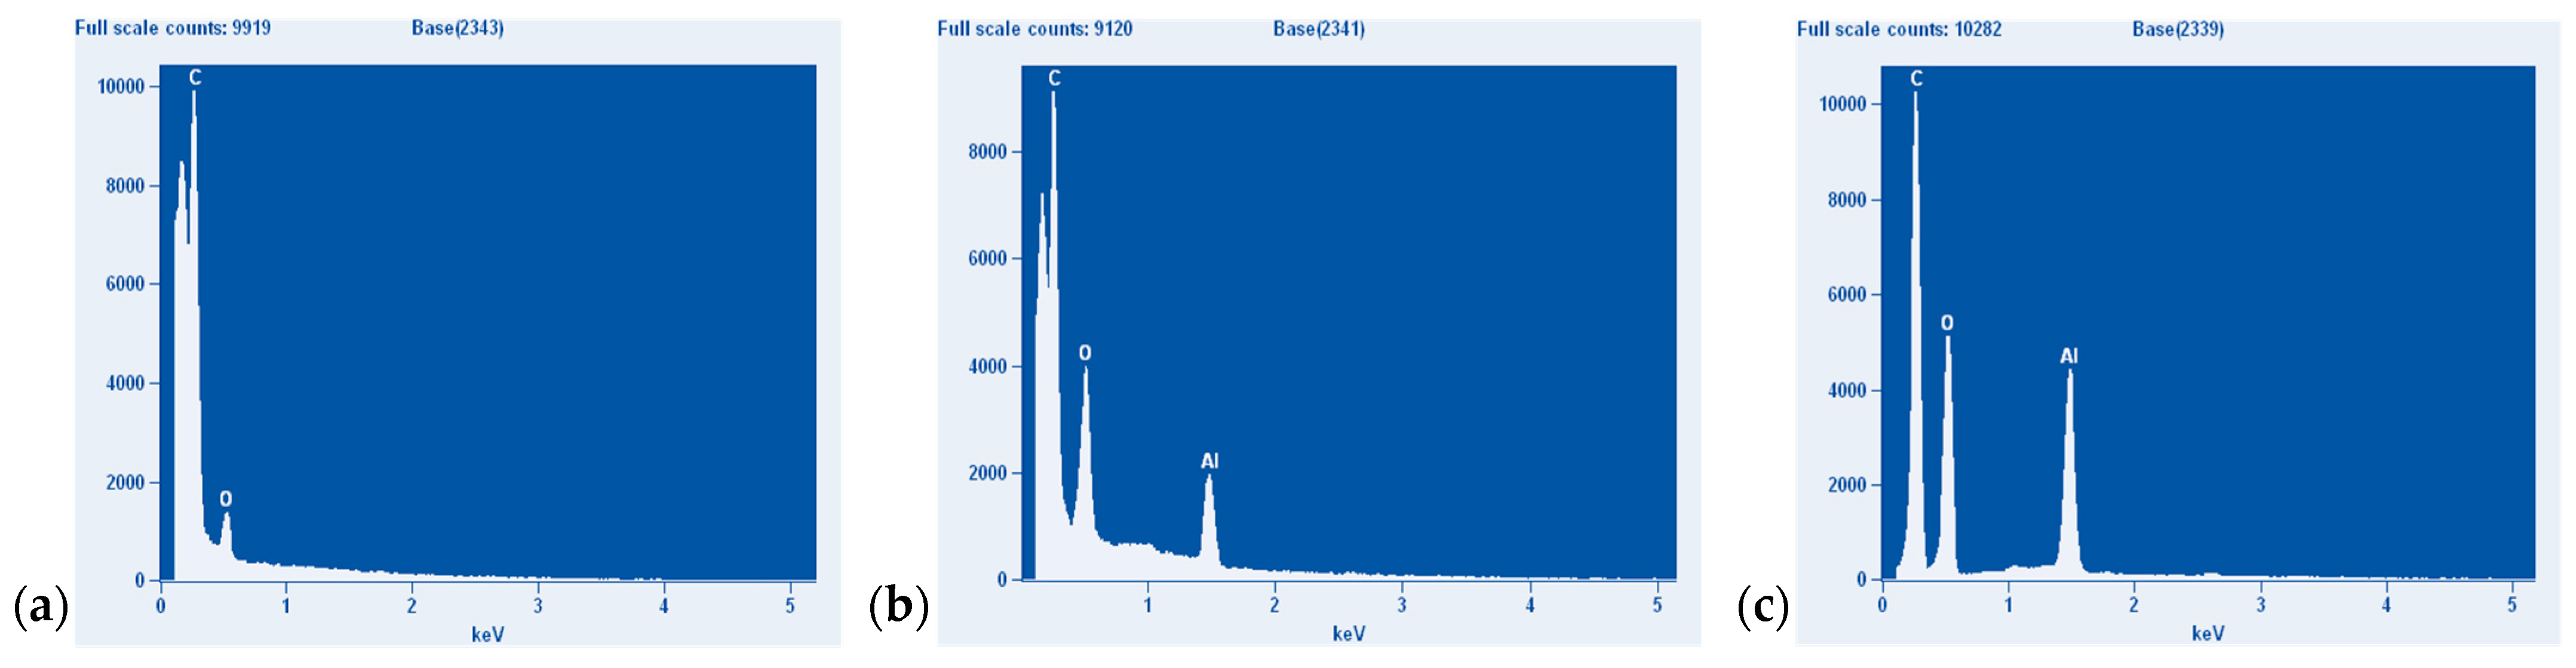
| Element (wt%) | Pure Resin | 30 phr Al(OH)3 | 50 phr Al(OH)3 |
|---|---|---|---|
| C | 79.54 | 48.56 | 50.54 |
| O | 20.46 | 45.59 | 41.78 |
| Al | 0 | 5.84 | 7.68 |
Publisher’s Note: MDPI stays neutral with regard to jurisdictional claims in published maps and institutional affiliations. |
© 2022 by the authors. Licensee MDPI, Basel, Switzerland. This article is an open access article distributed under the terms and conditions of the Creative Commons Attribution (CC BY) license (https://creativecommons.org/licenses/by/4.0/).
Share and Cite
Zielonka, P.; Duda, S.; Lesiuk, G.; Błażejewski, W.; Wiśniewska, M.; Warycha, J.; Stabla, P.; Smolnicki, M.; Babiarczuk, B. The Effect of Flame Retardant—Aluminum Trihydroxide on Mixed Mode I/II Fracture Toughness of Epoxy Resin. Polymers 2022, 14, 4386. https://doi.org/10.3390/polym14204386
Zielonka P, Duda S, Lesiuk G, Błażejewski W, Wiśniewska M, Warycha J, Stabla P, Smolnicki M, Babiarczuk B. The Effect of Flame Retardant—Aluminum Trihydroxide on Mixed Mode I/II Fracture Toughness of Epoxy Resin. Polymers. 2022; 14(20):4386. https://doi.org/10.3390/polym14204386
Chicago/Turabian StyleZielonka, Paweł, Szymon Duda, Grzegorz Lesiuk, Wojciech Błażejewski, Magdalena Wiśniewska, Joanna Warycha, Paweł Stabla, Michał Smolnicki, and Bartosz Babiarczuk. 2022. "The Effect of Flame Retardant—Aluminum Trihydroxide on Mixed Mode I/II Fracture Toughness of Epoxy Resin" Polymers 14, no. 20: 4386. https://doi.org/10.3390/polym14204386
APA StyleZielonka, P., Duda, S., Lesiuk, G., Błażejewski, W., Wiśniewska, M., Warycha, J., Stabla, P., Smolnicki, M., & Babiarczuk, B. (2022). The Effect of Flame Retardant—Aluminum Trihydroxide on Mixed Mode I/II Fracture Toughness of Epoxy Resin. Polymers, 14(20), 4386. https://doi.org/10.3390/polym14204386