
Manufacture and Characterization of Recycled Polypropylene and Olive Pits Biocomposites

 , ,
, ,  and
and 
Abstract
1. Introduction
2. Materials and Methods
2.1. Conditioning and Characterization of Olive Pits
2.2. Preparation of Biocomposite
2.3. Fabrication of Biocomposites Specimens
2.4. Characterization of the Resulting Polymer Biocomposites
3. Results and Discussion
3.1. Olive Pit Characterization
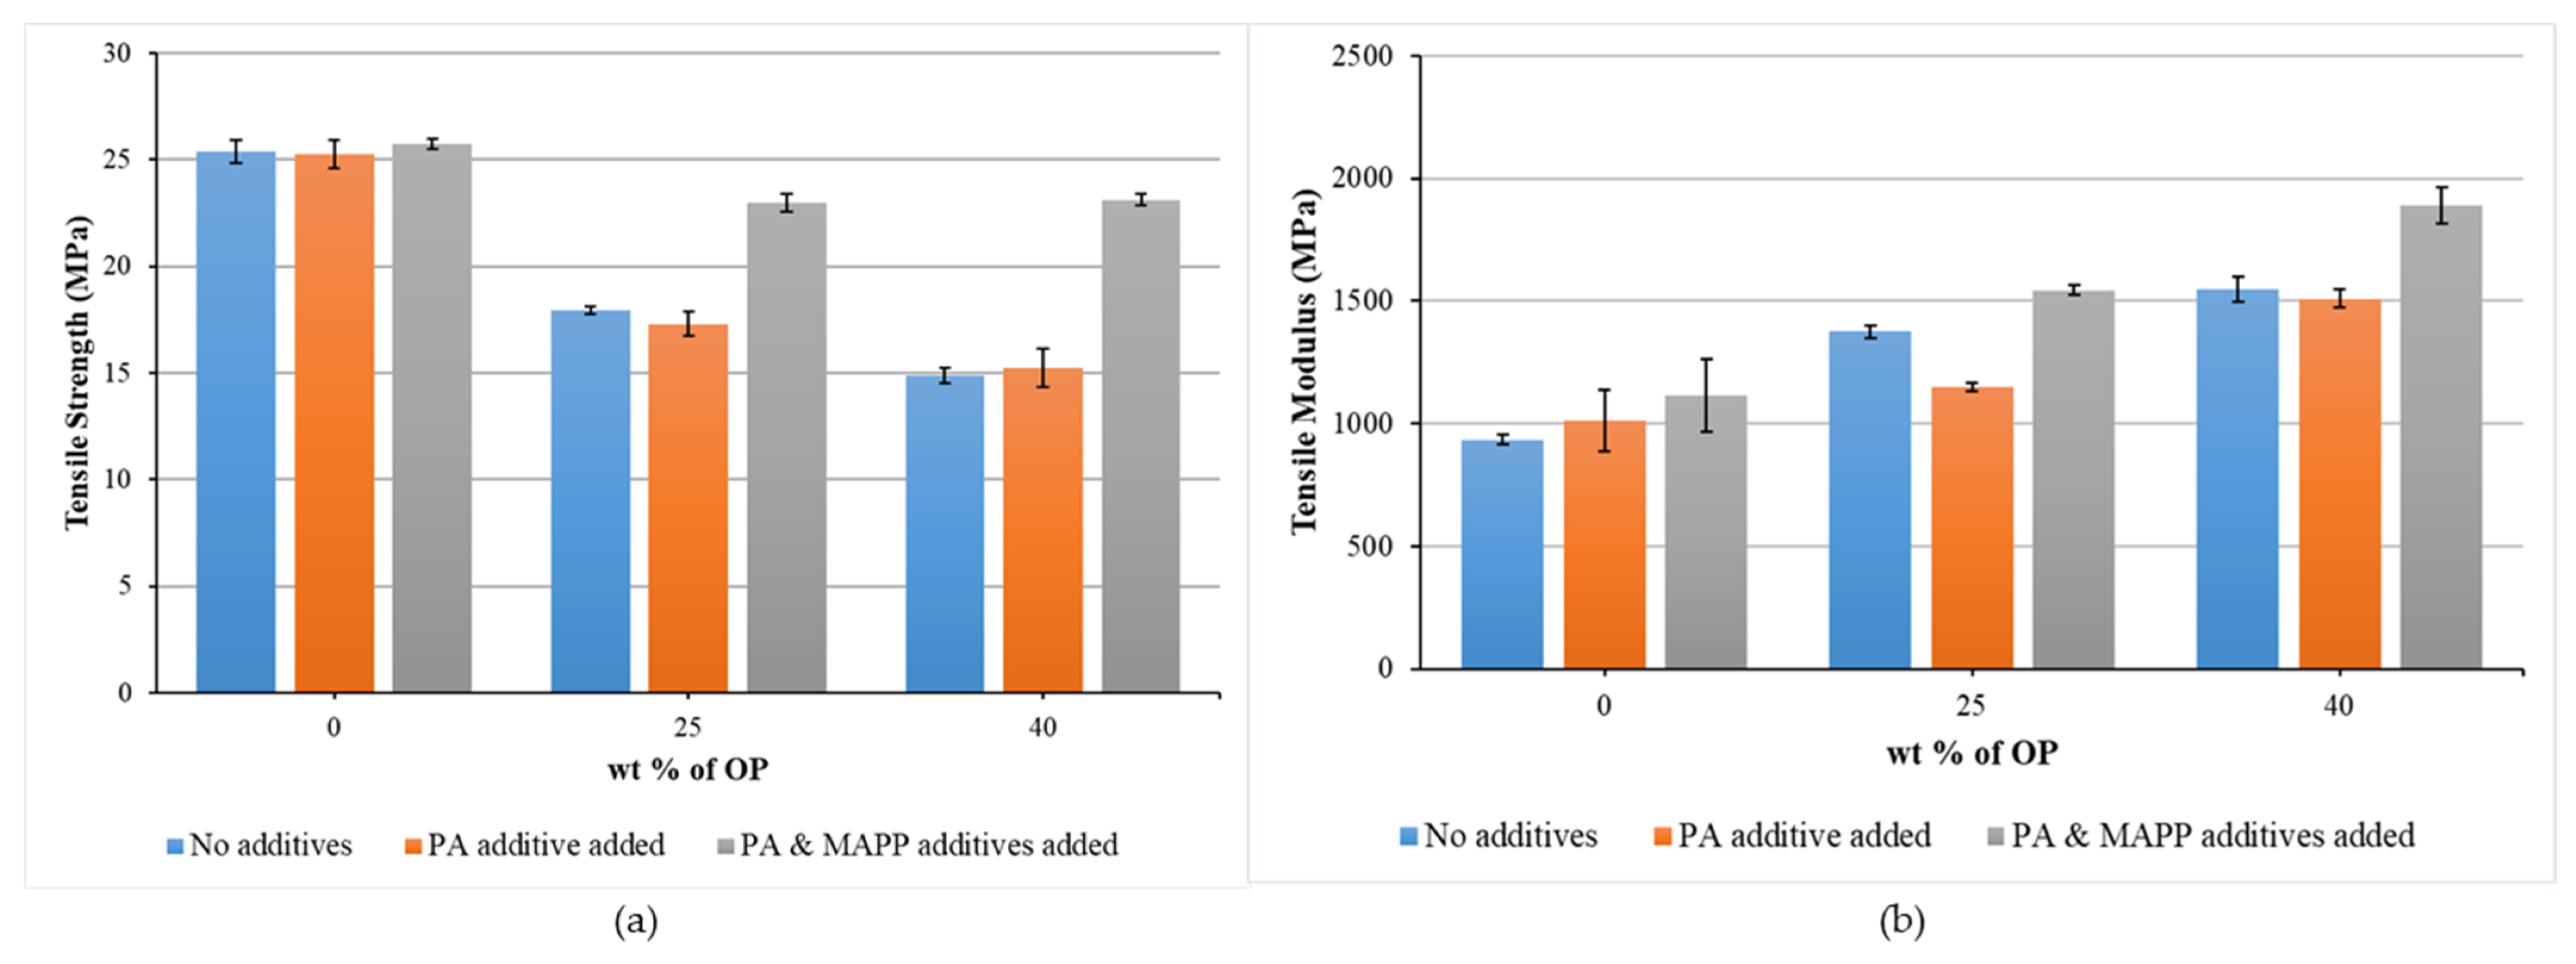
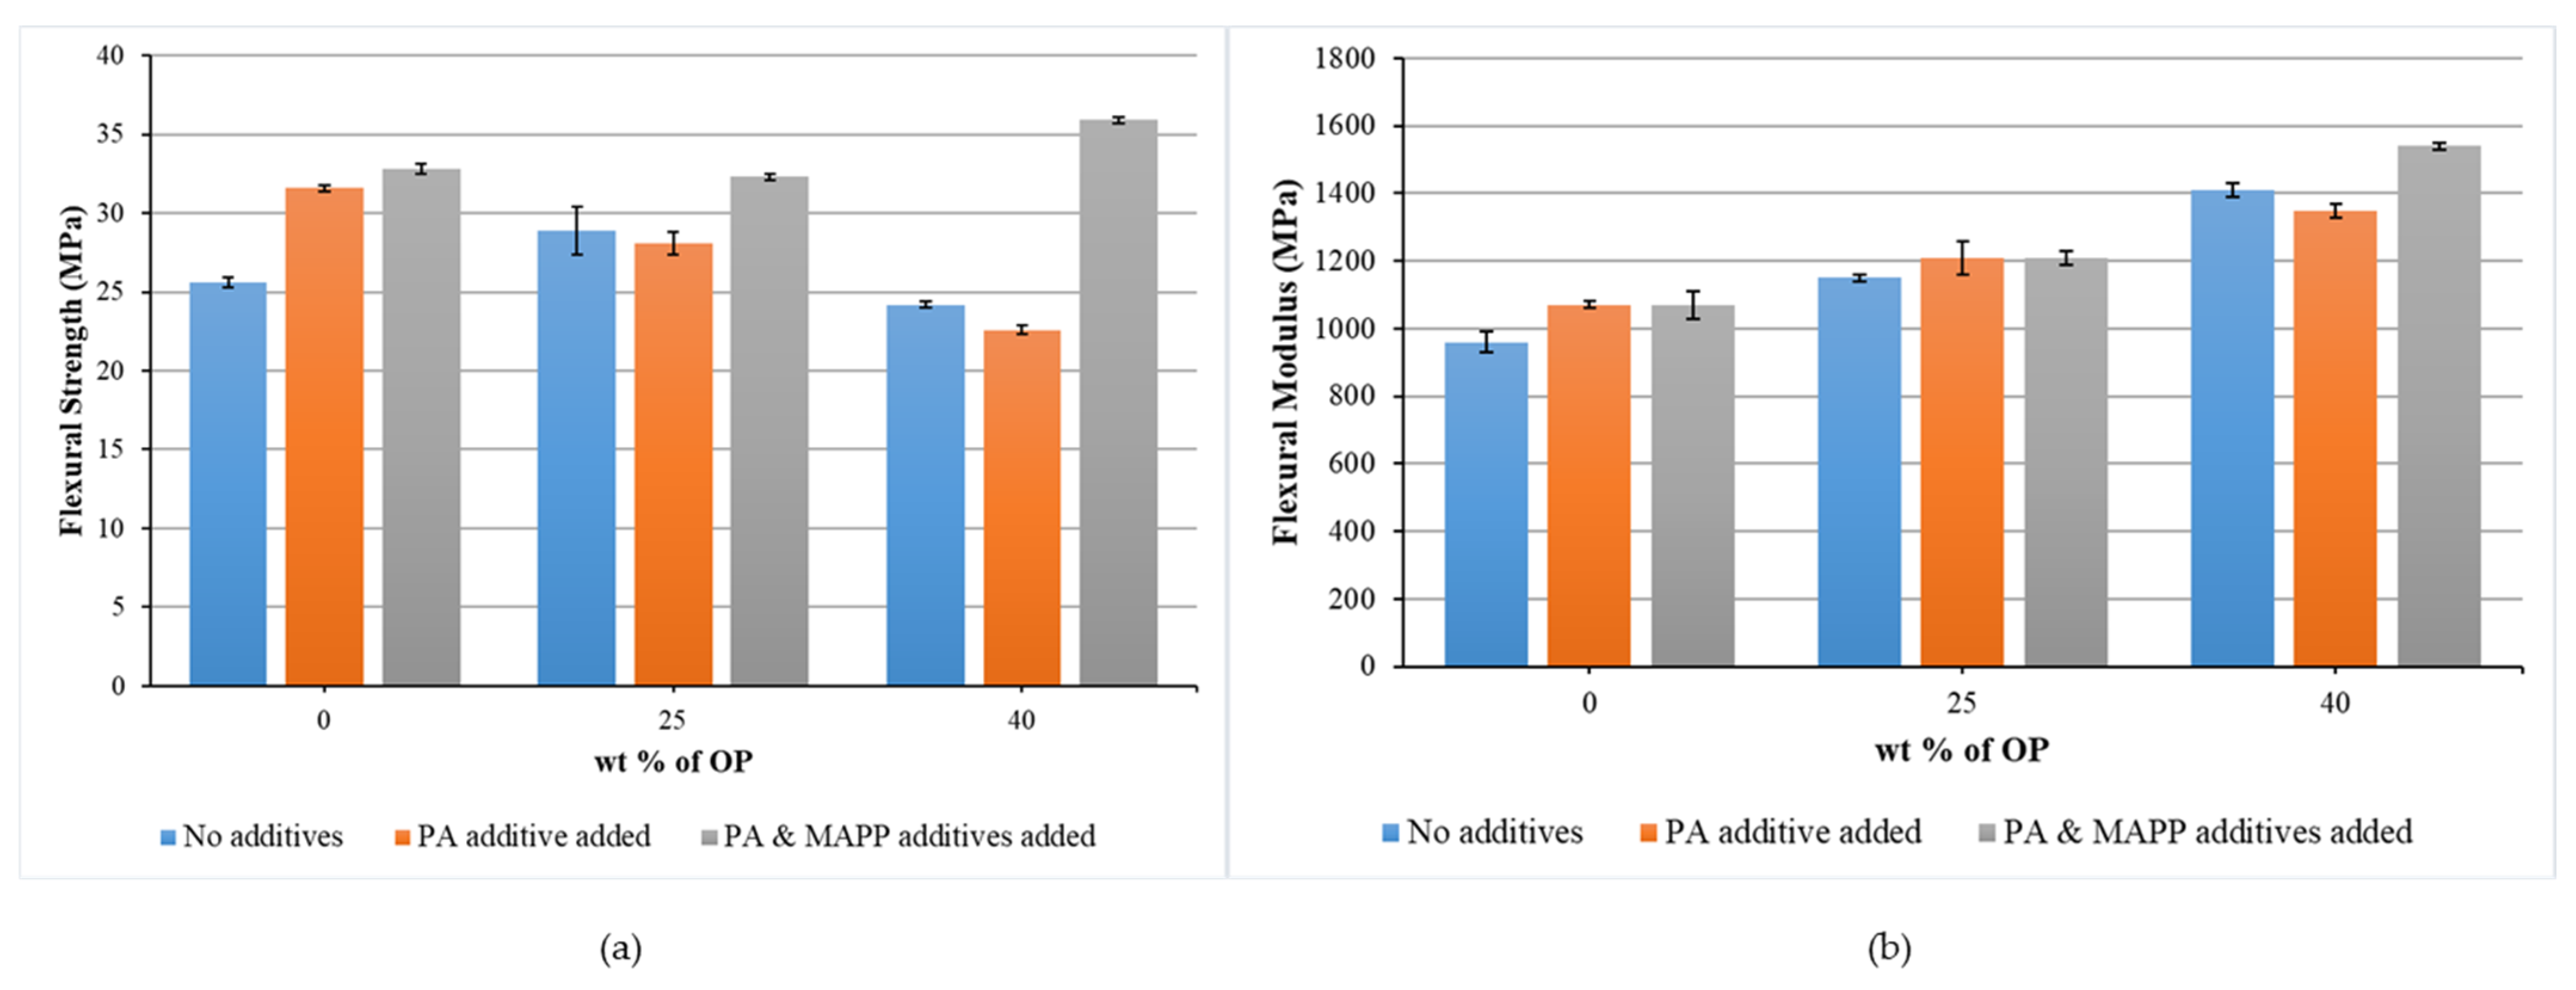
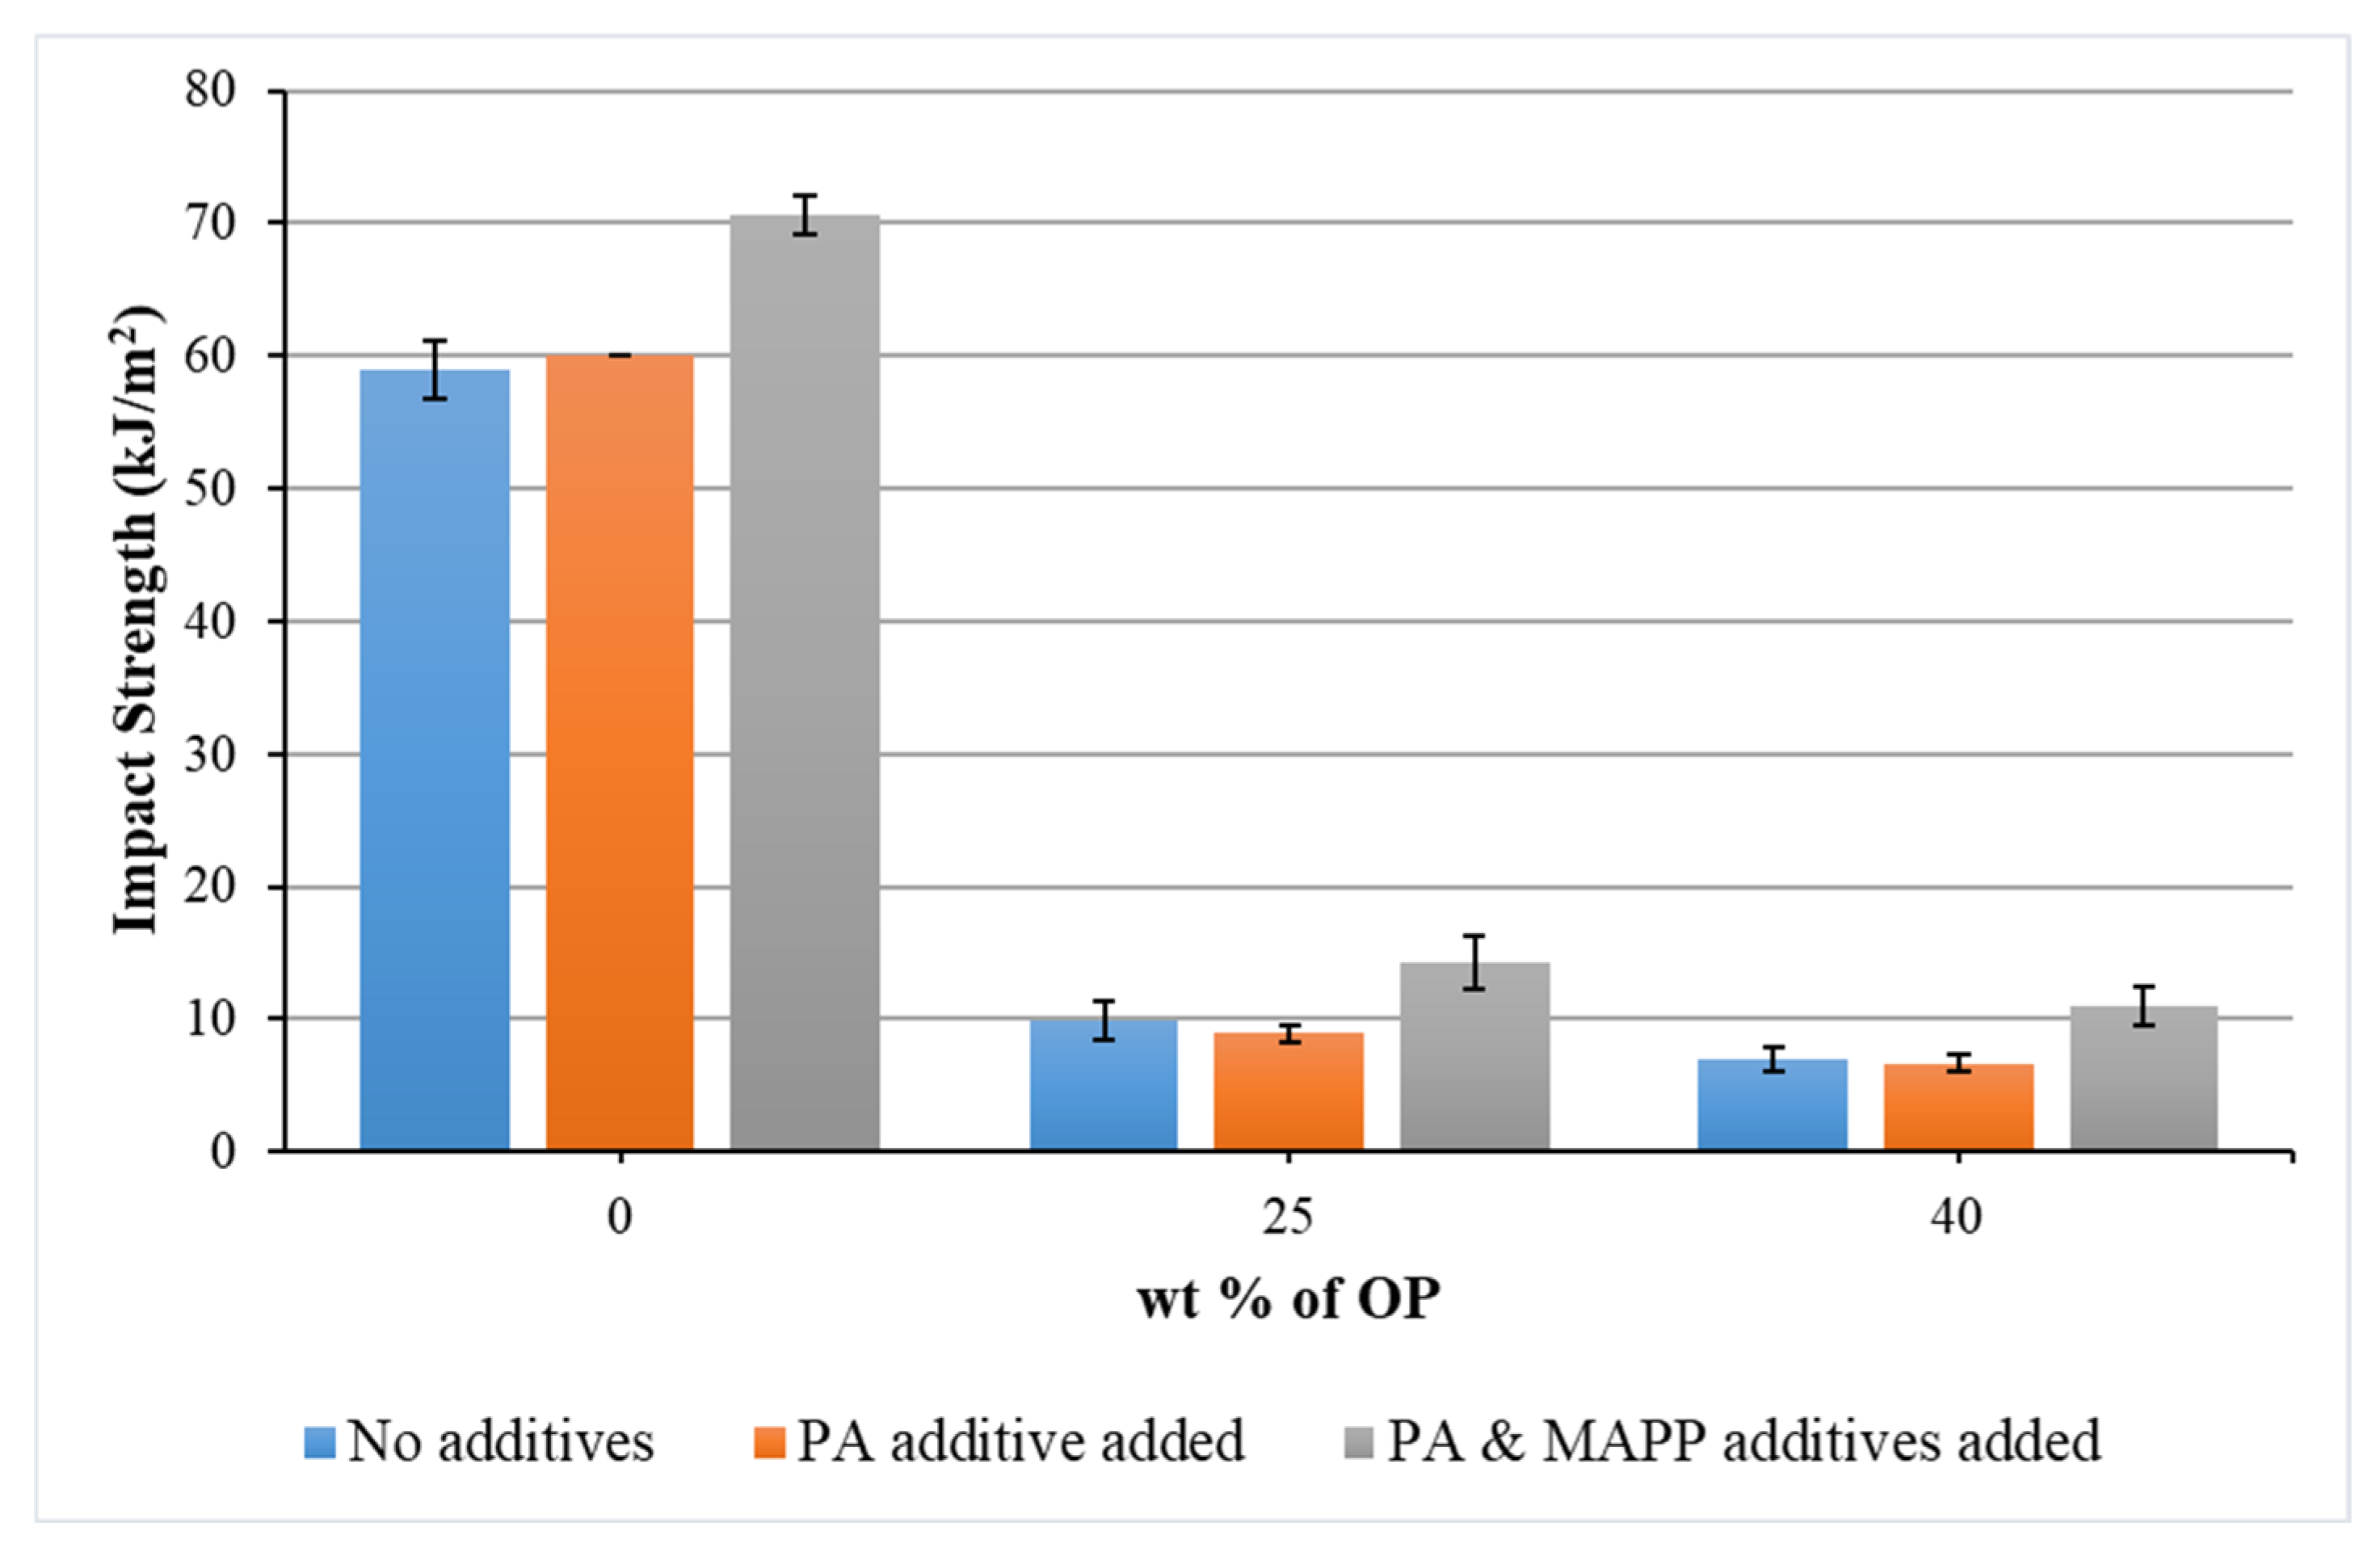
3.2. Mechanical Characterization of Biocomposites
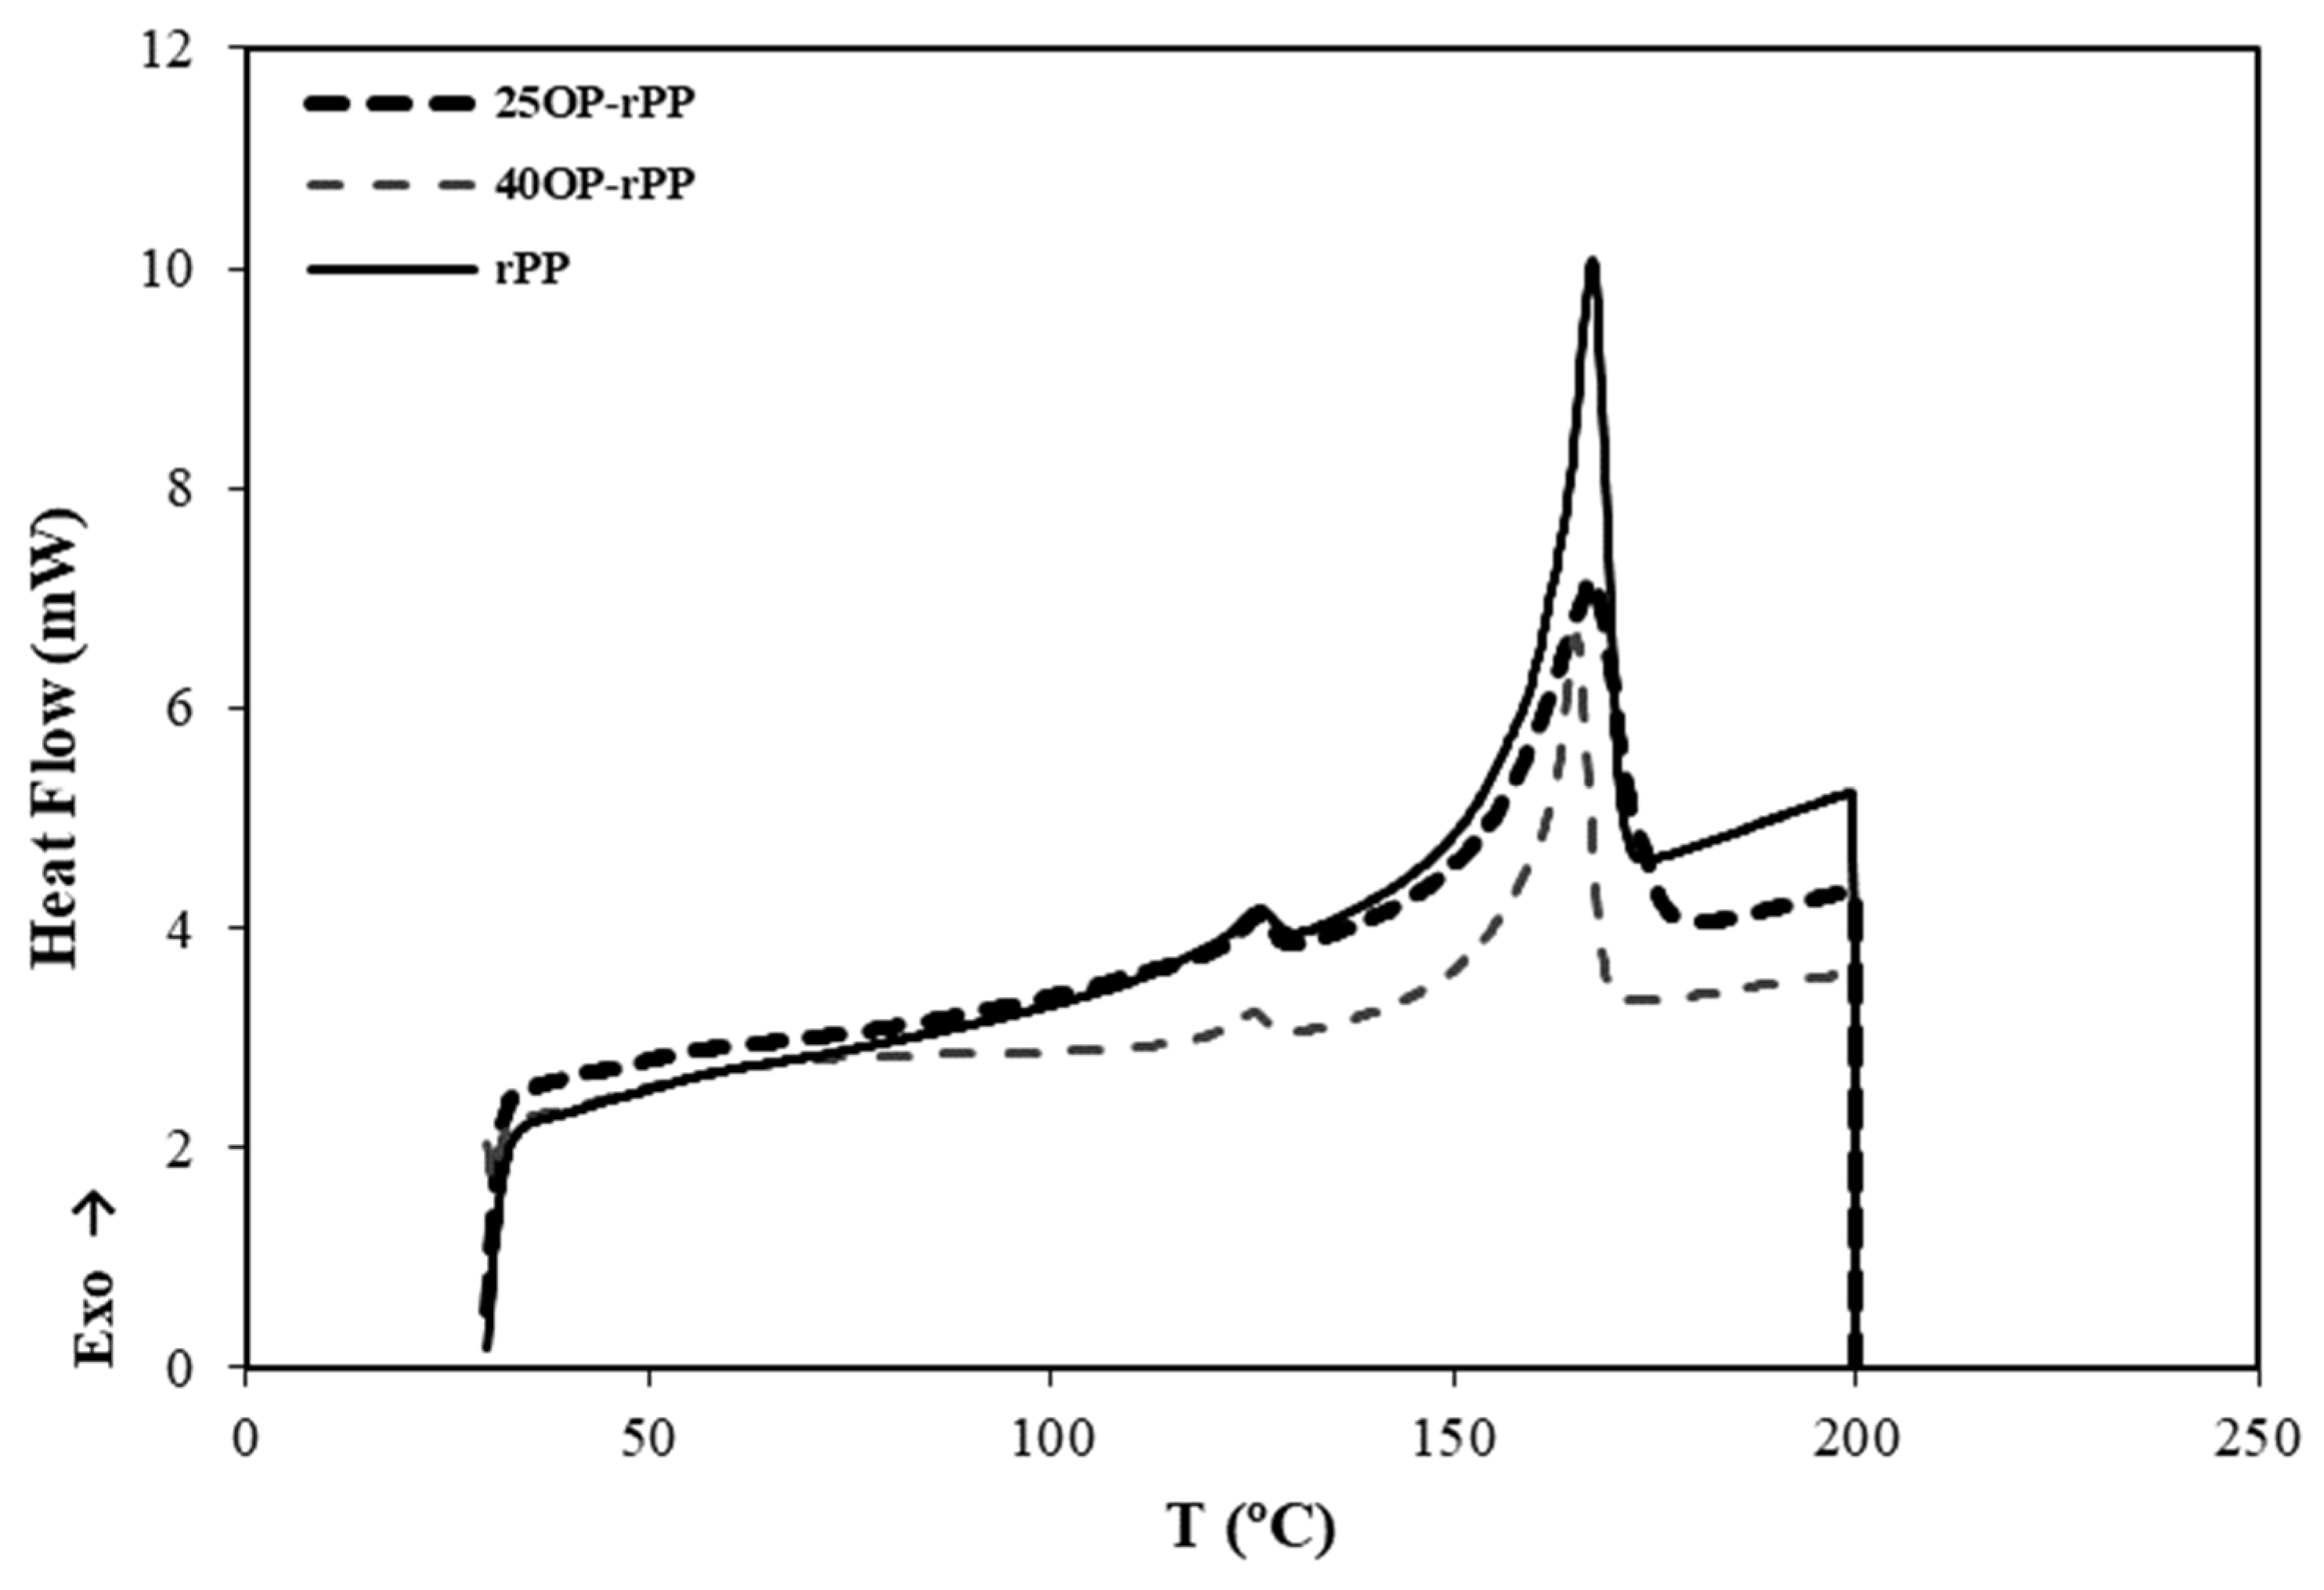
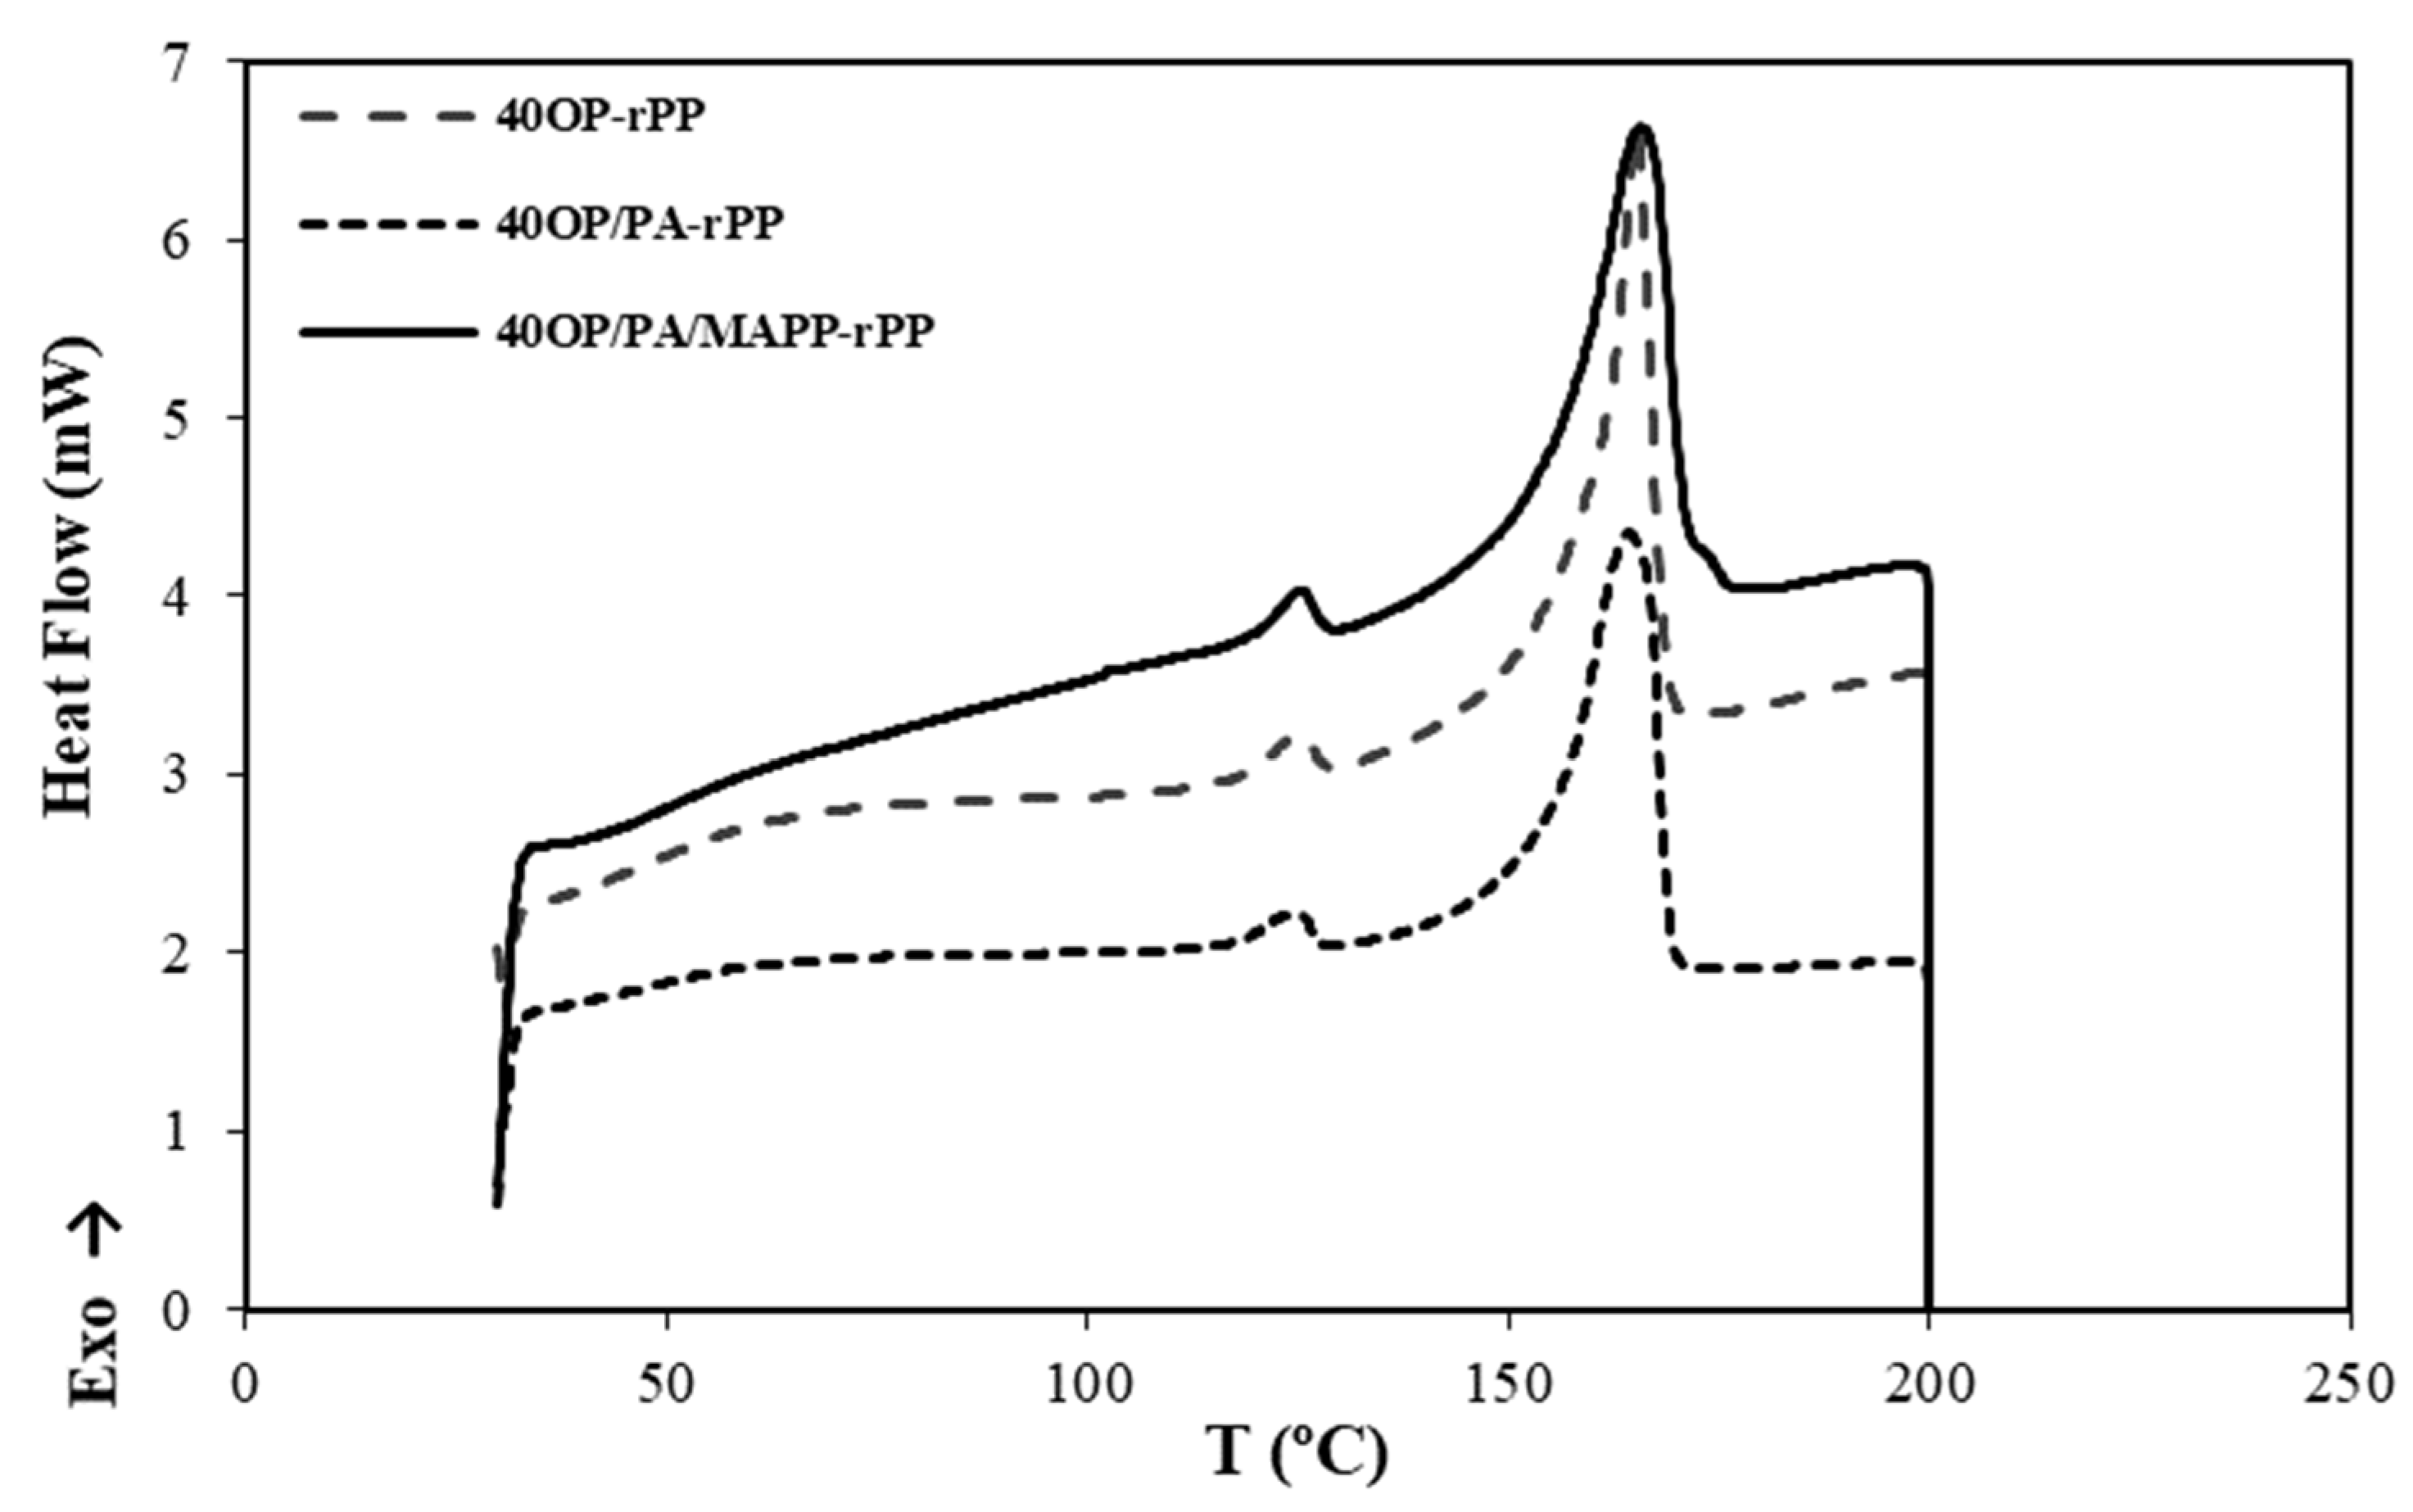
3.3. Thermal Properties of Biocomposites
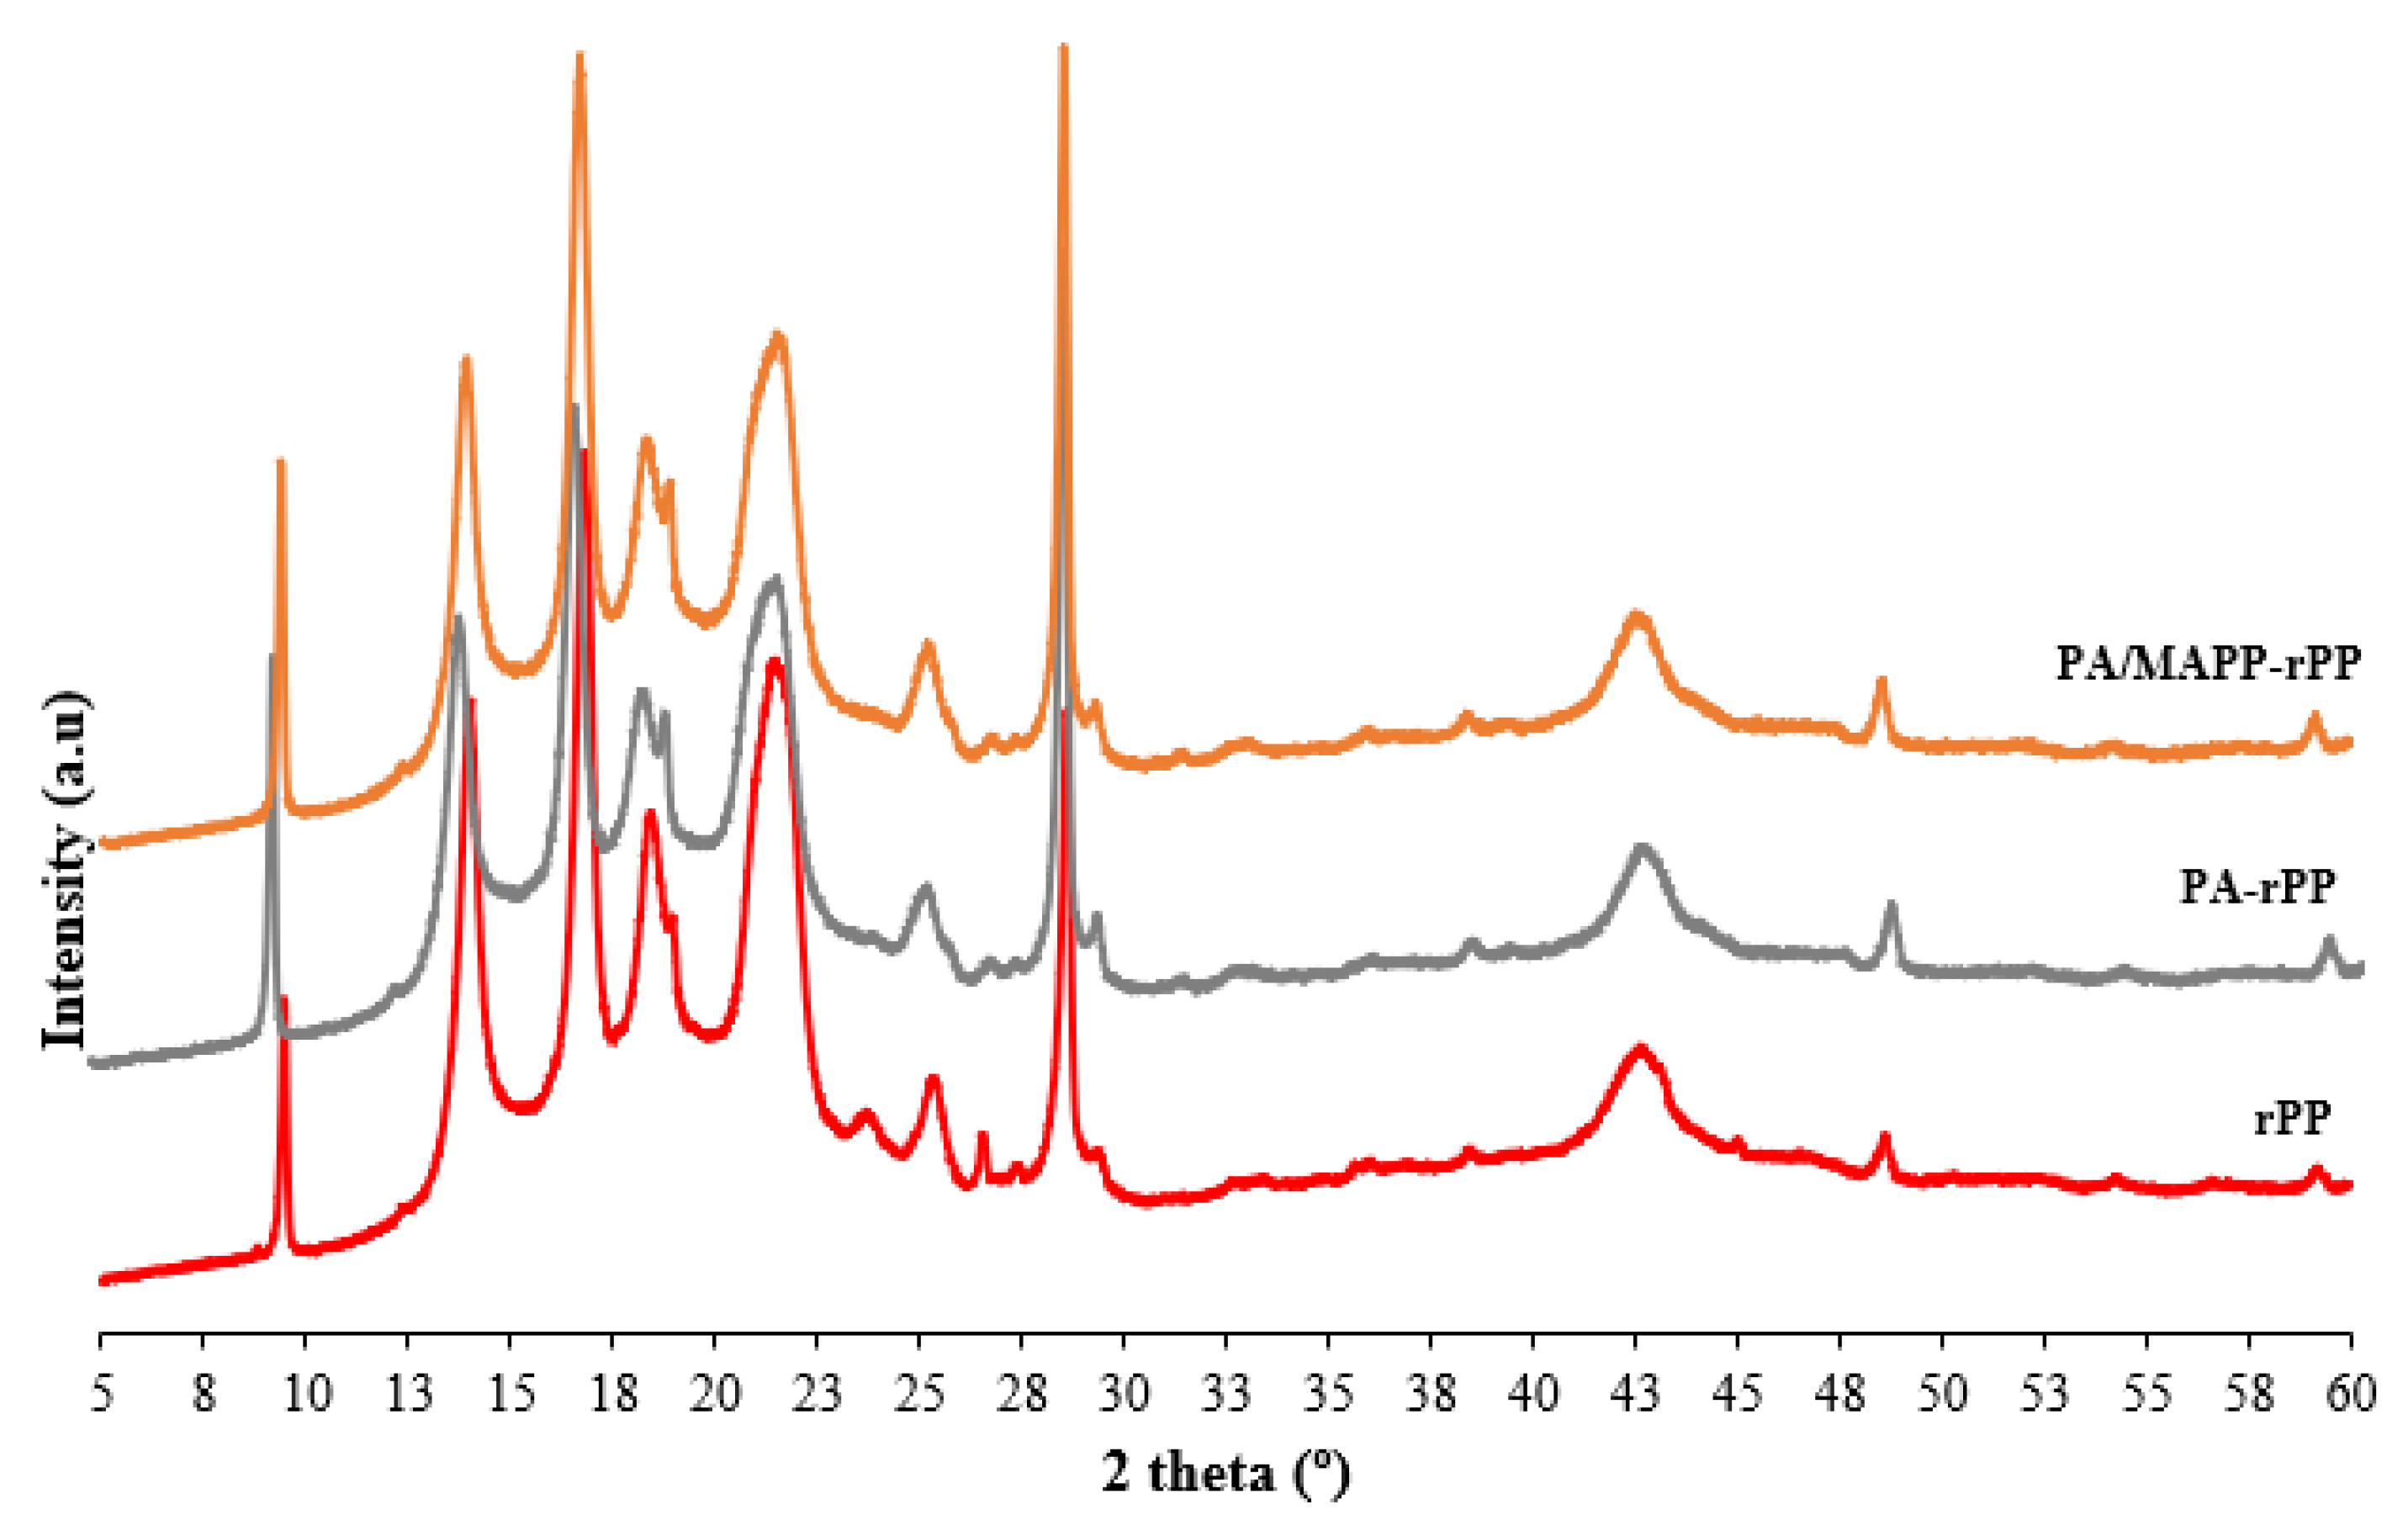
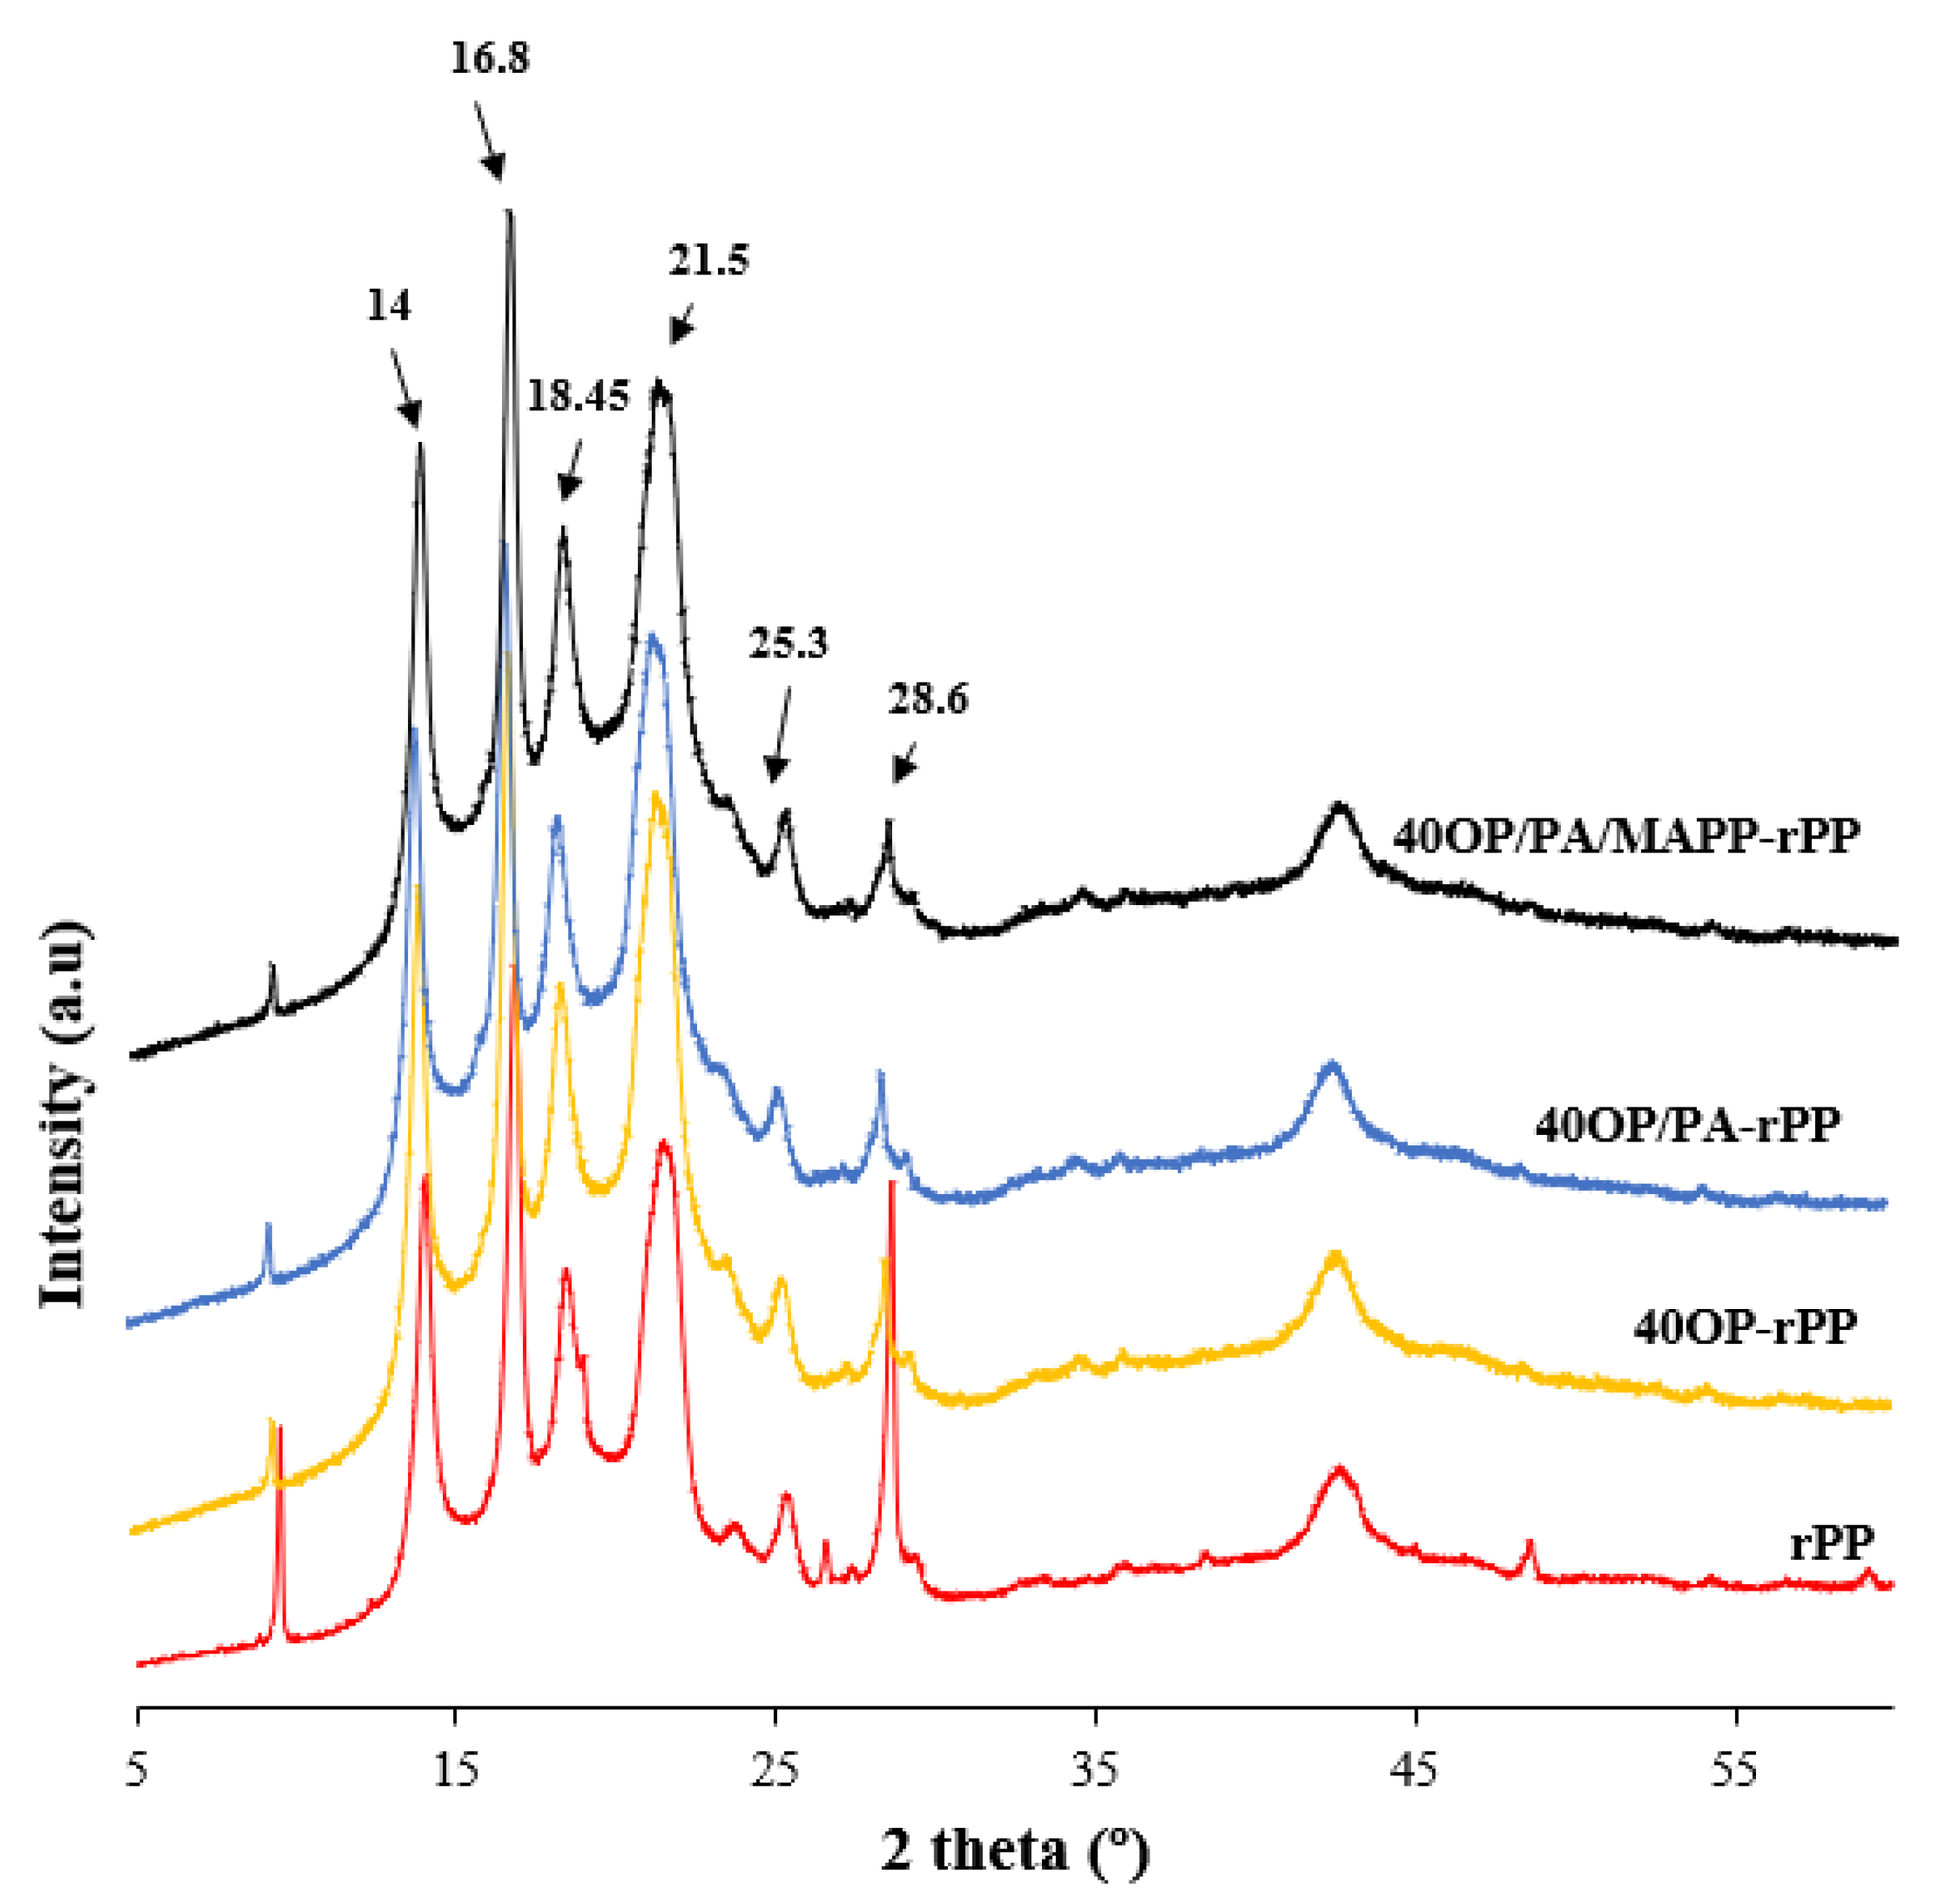
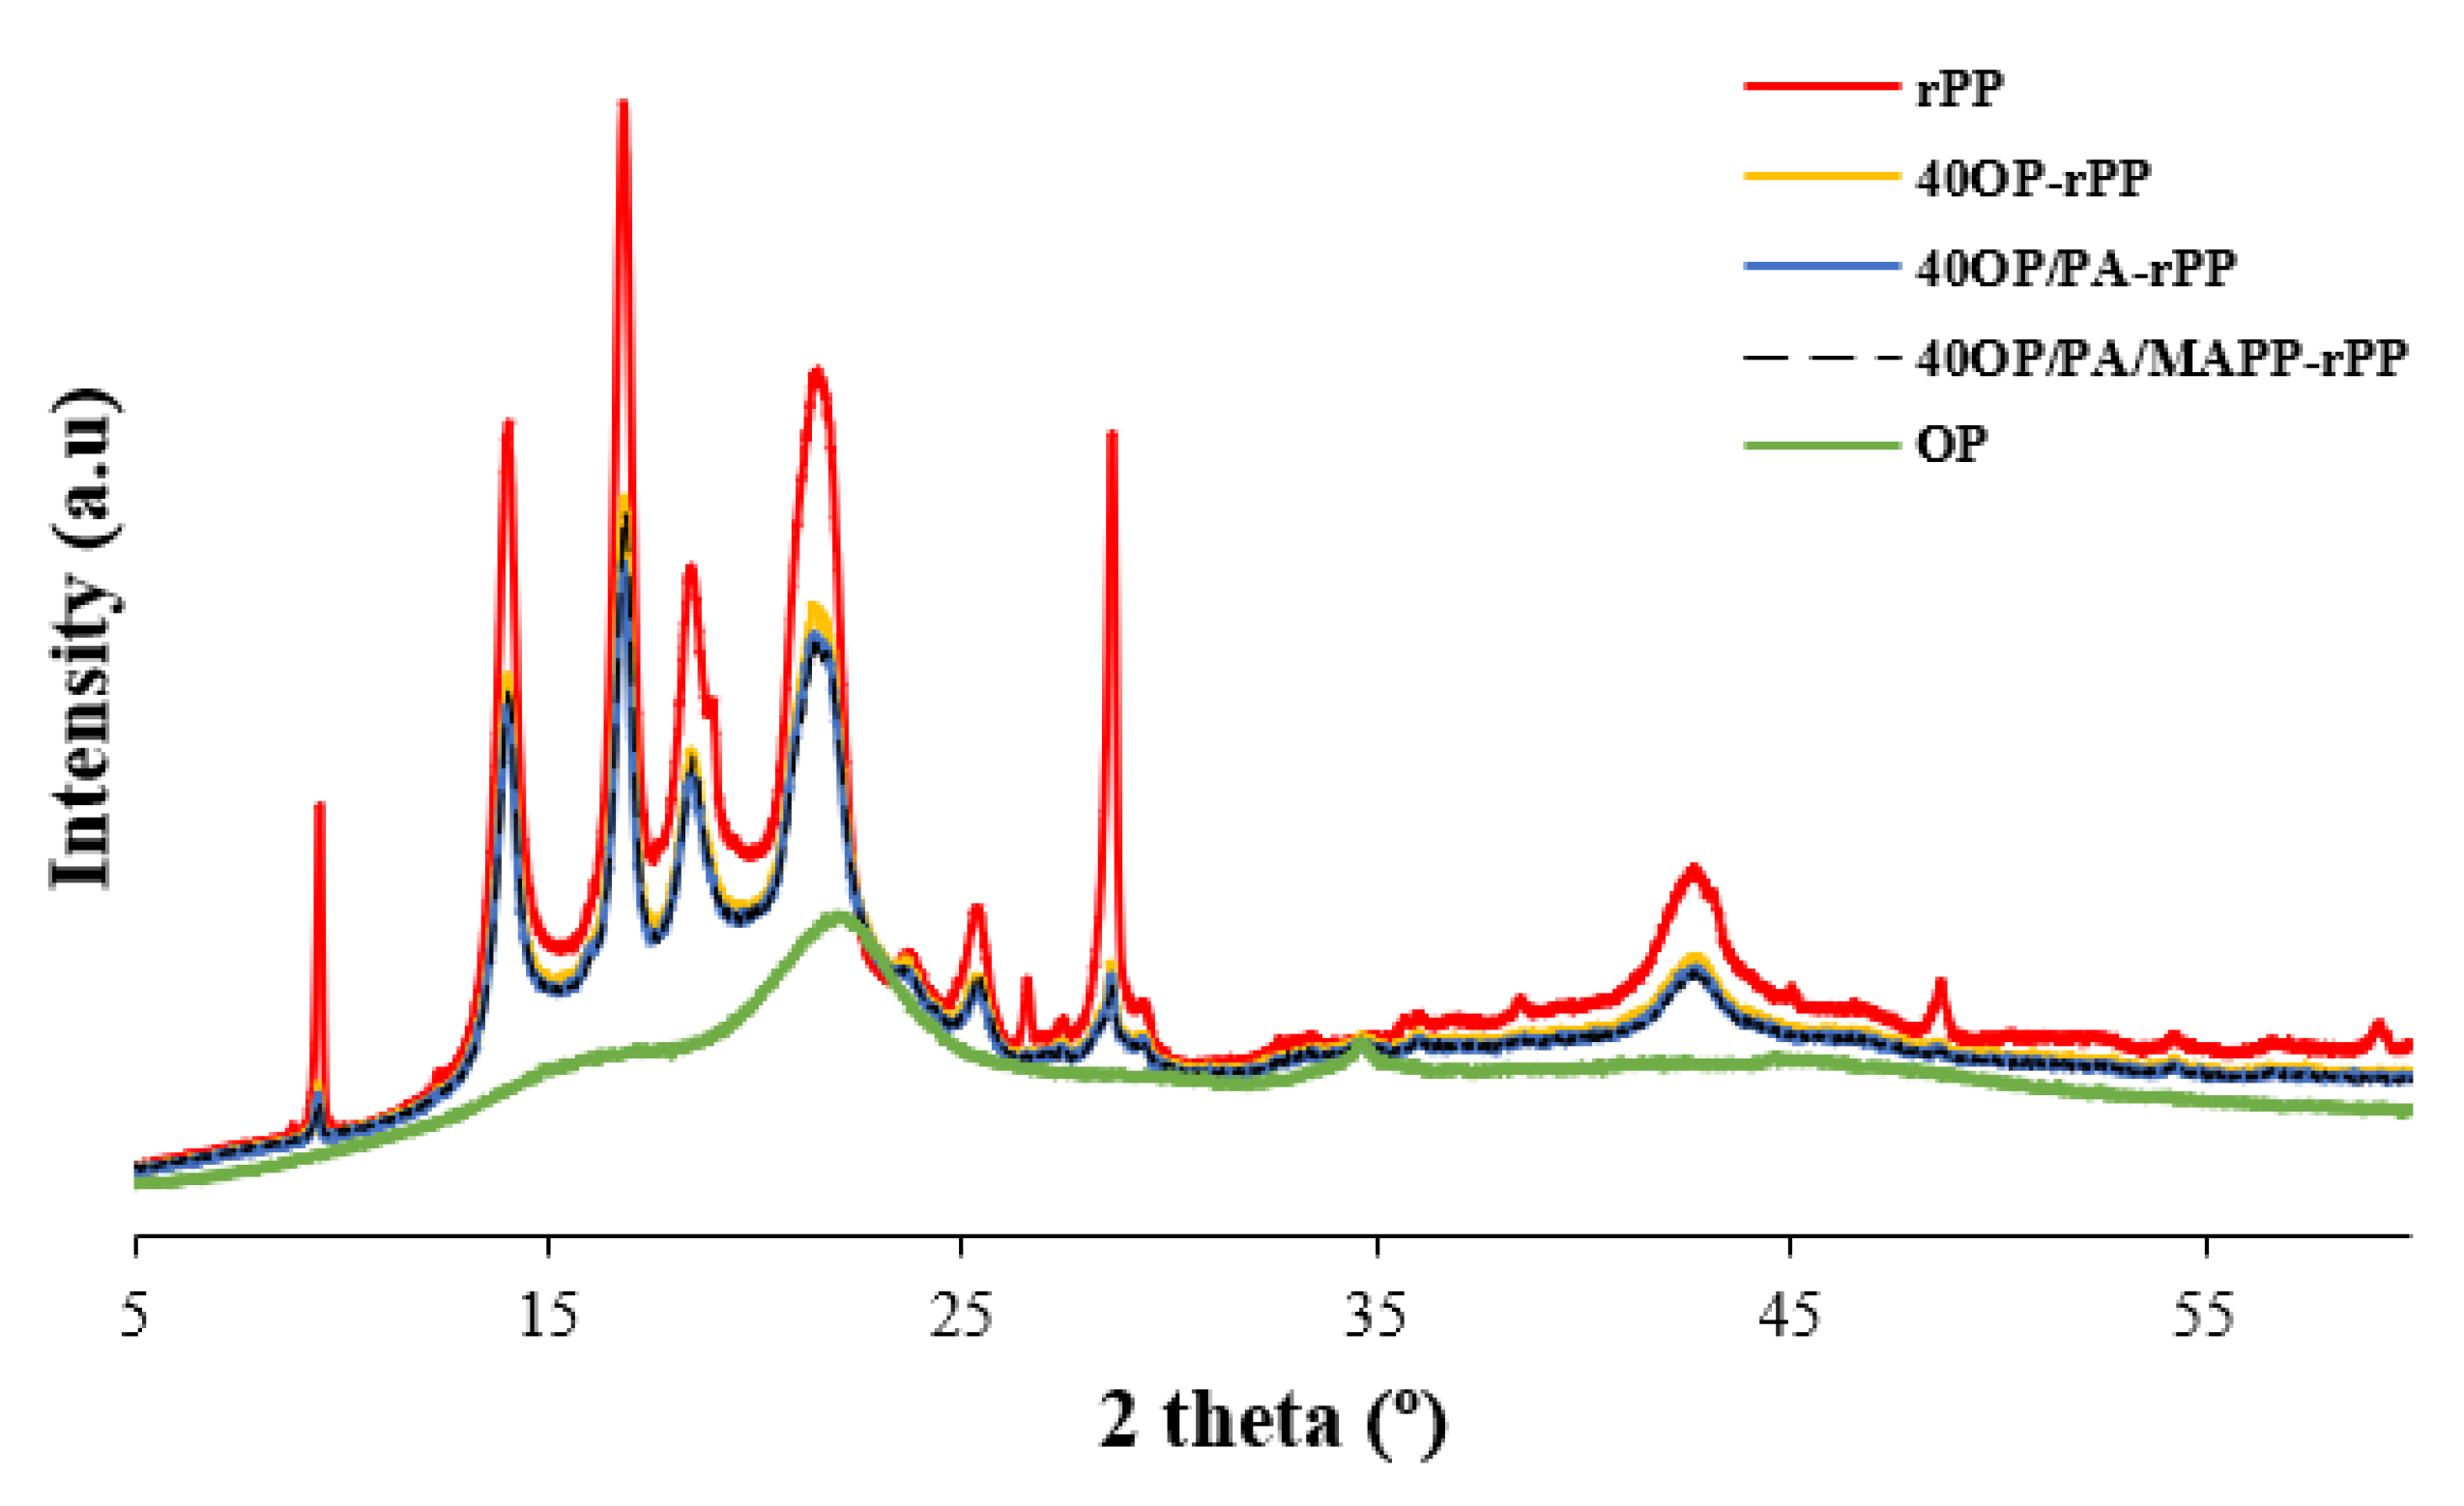
3.4. X-ray Diffraction Analysis
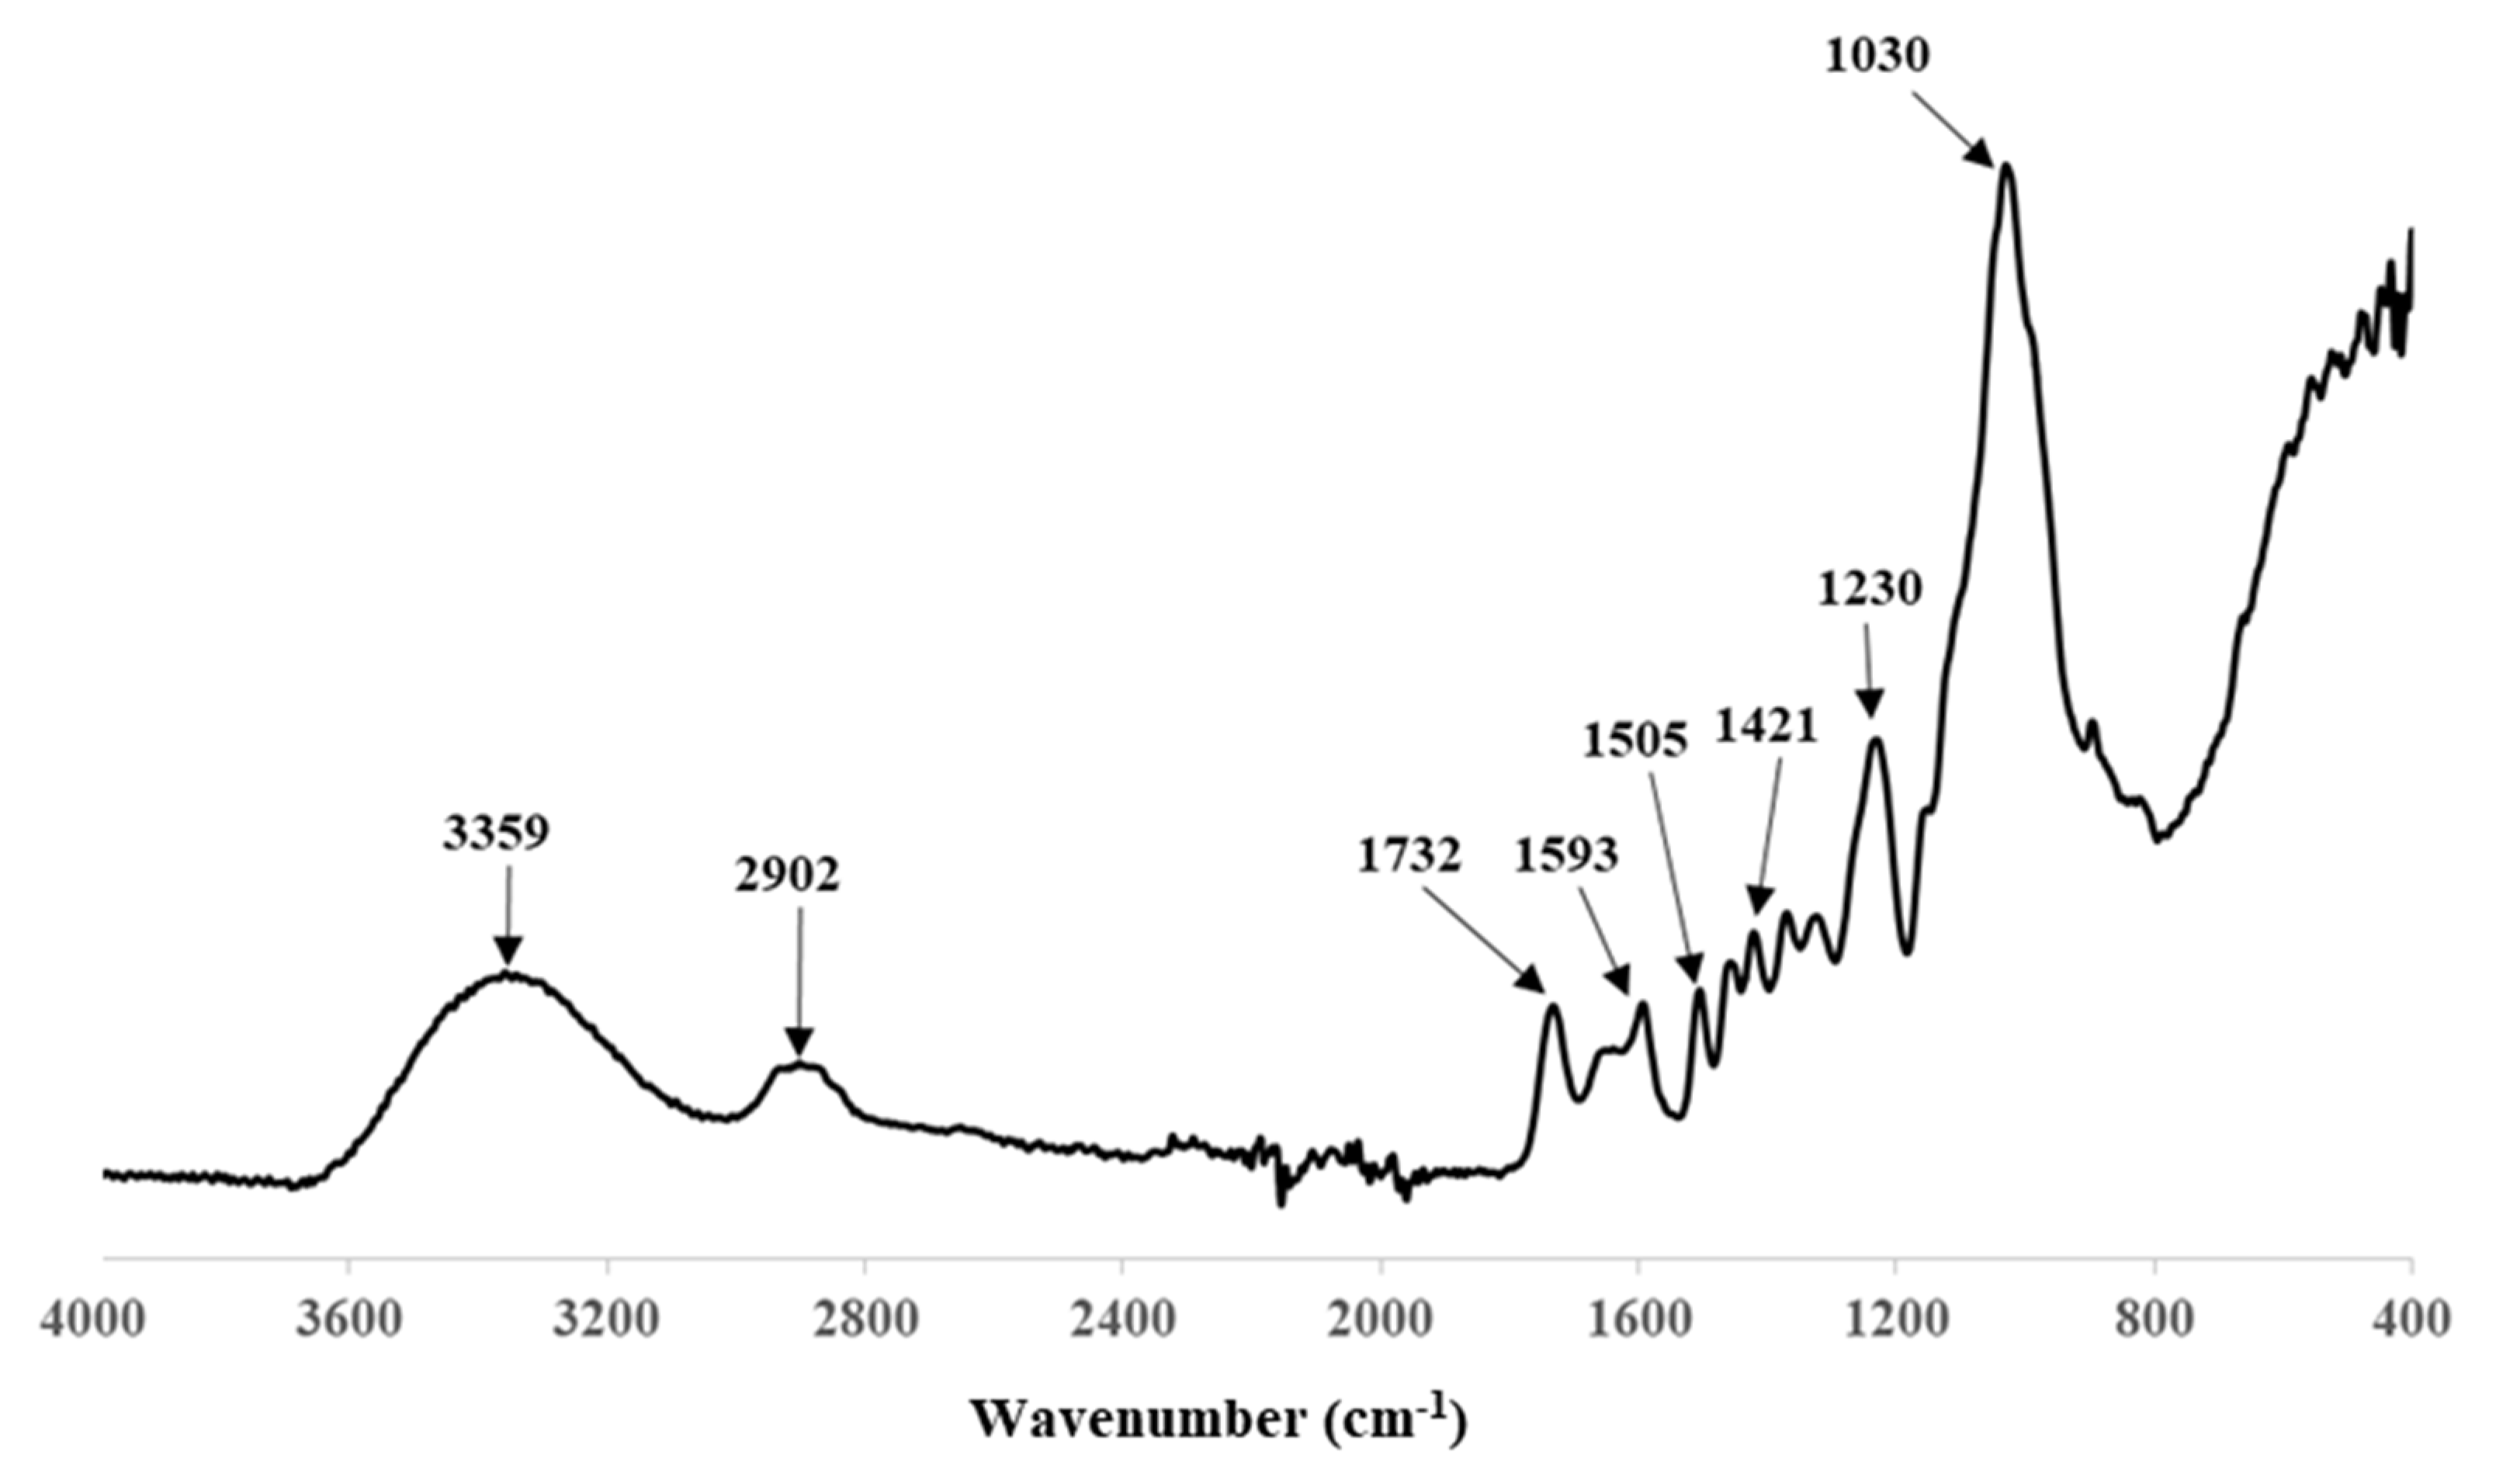
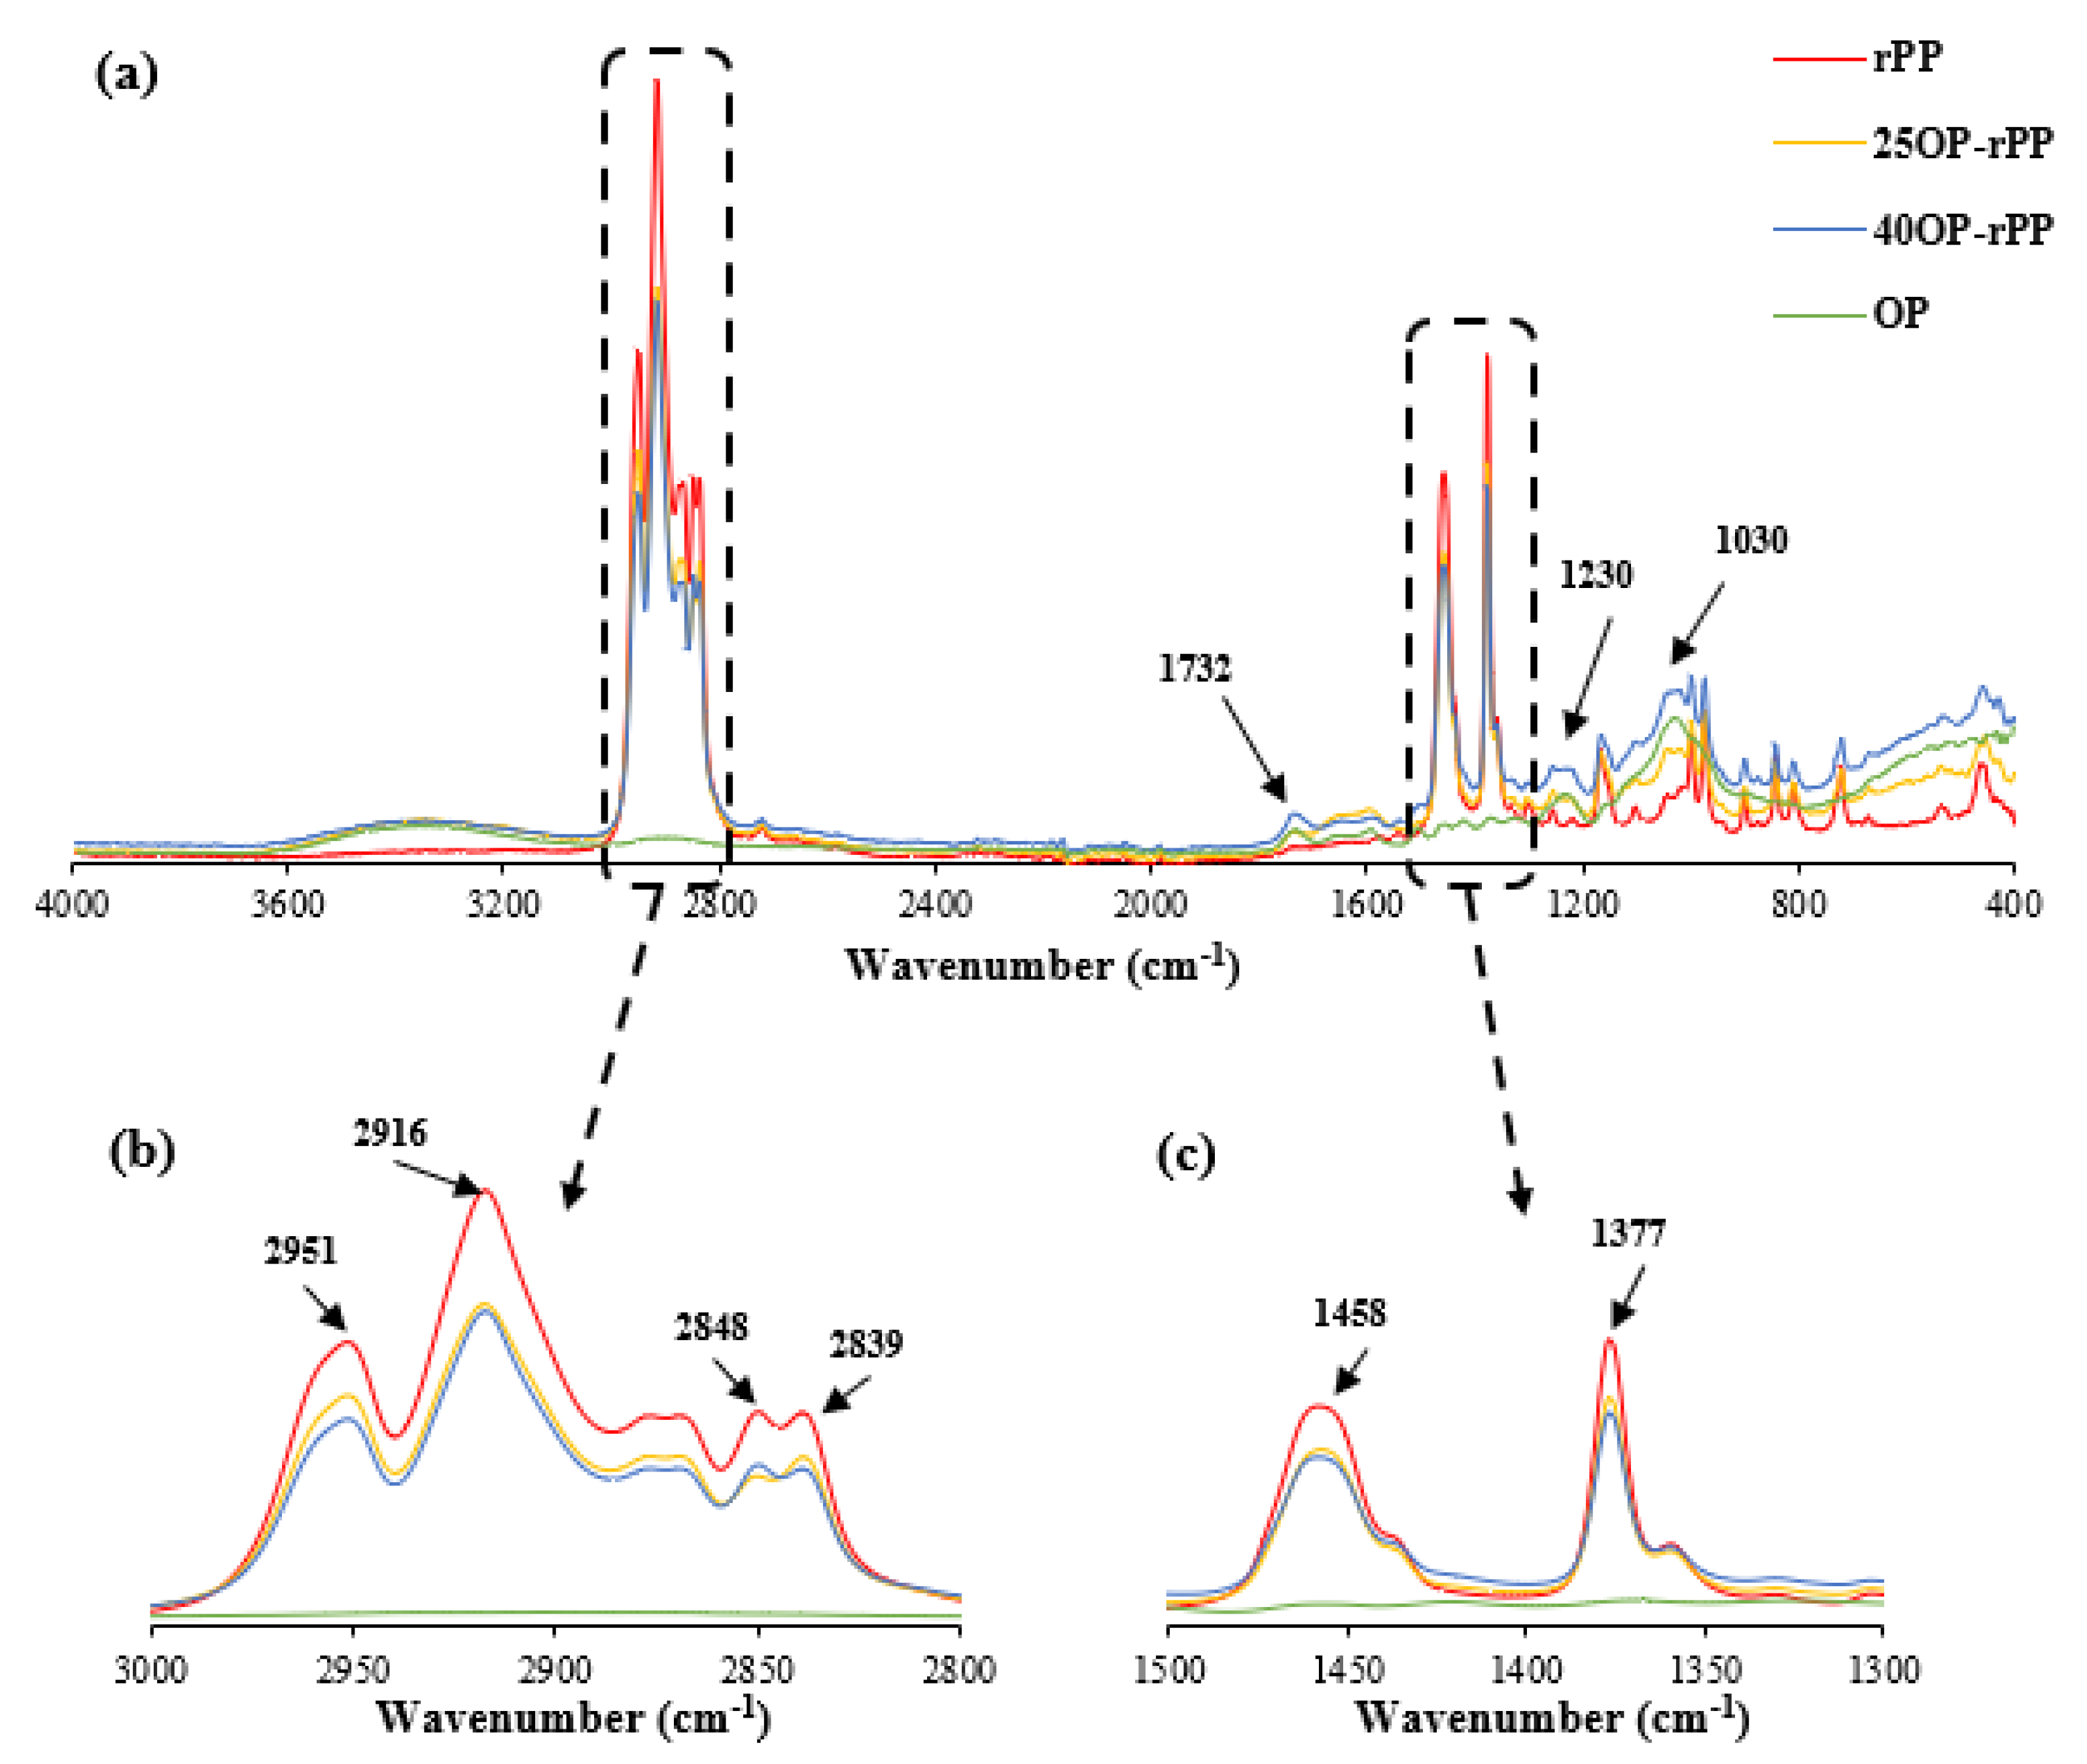
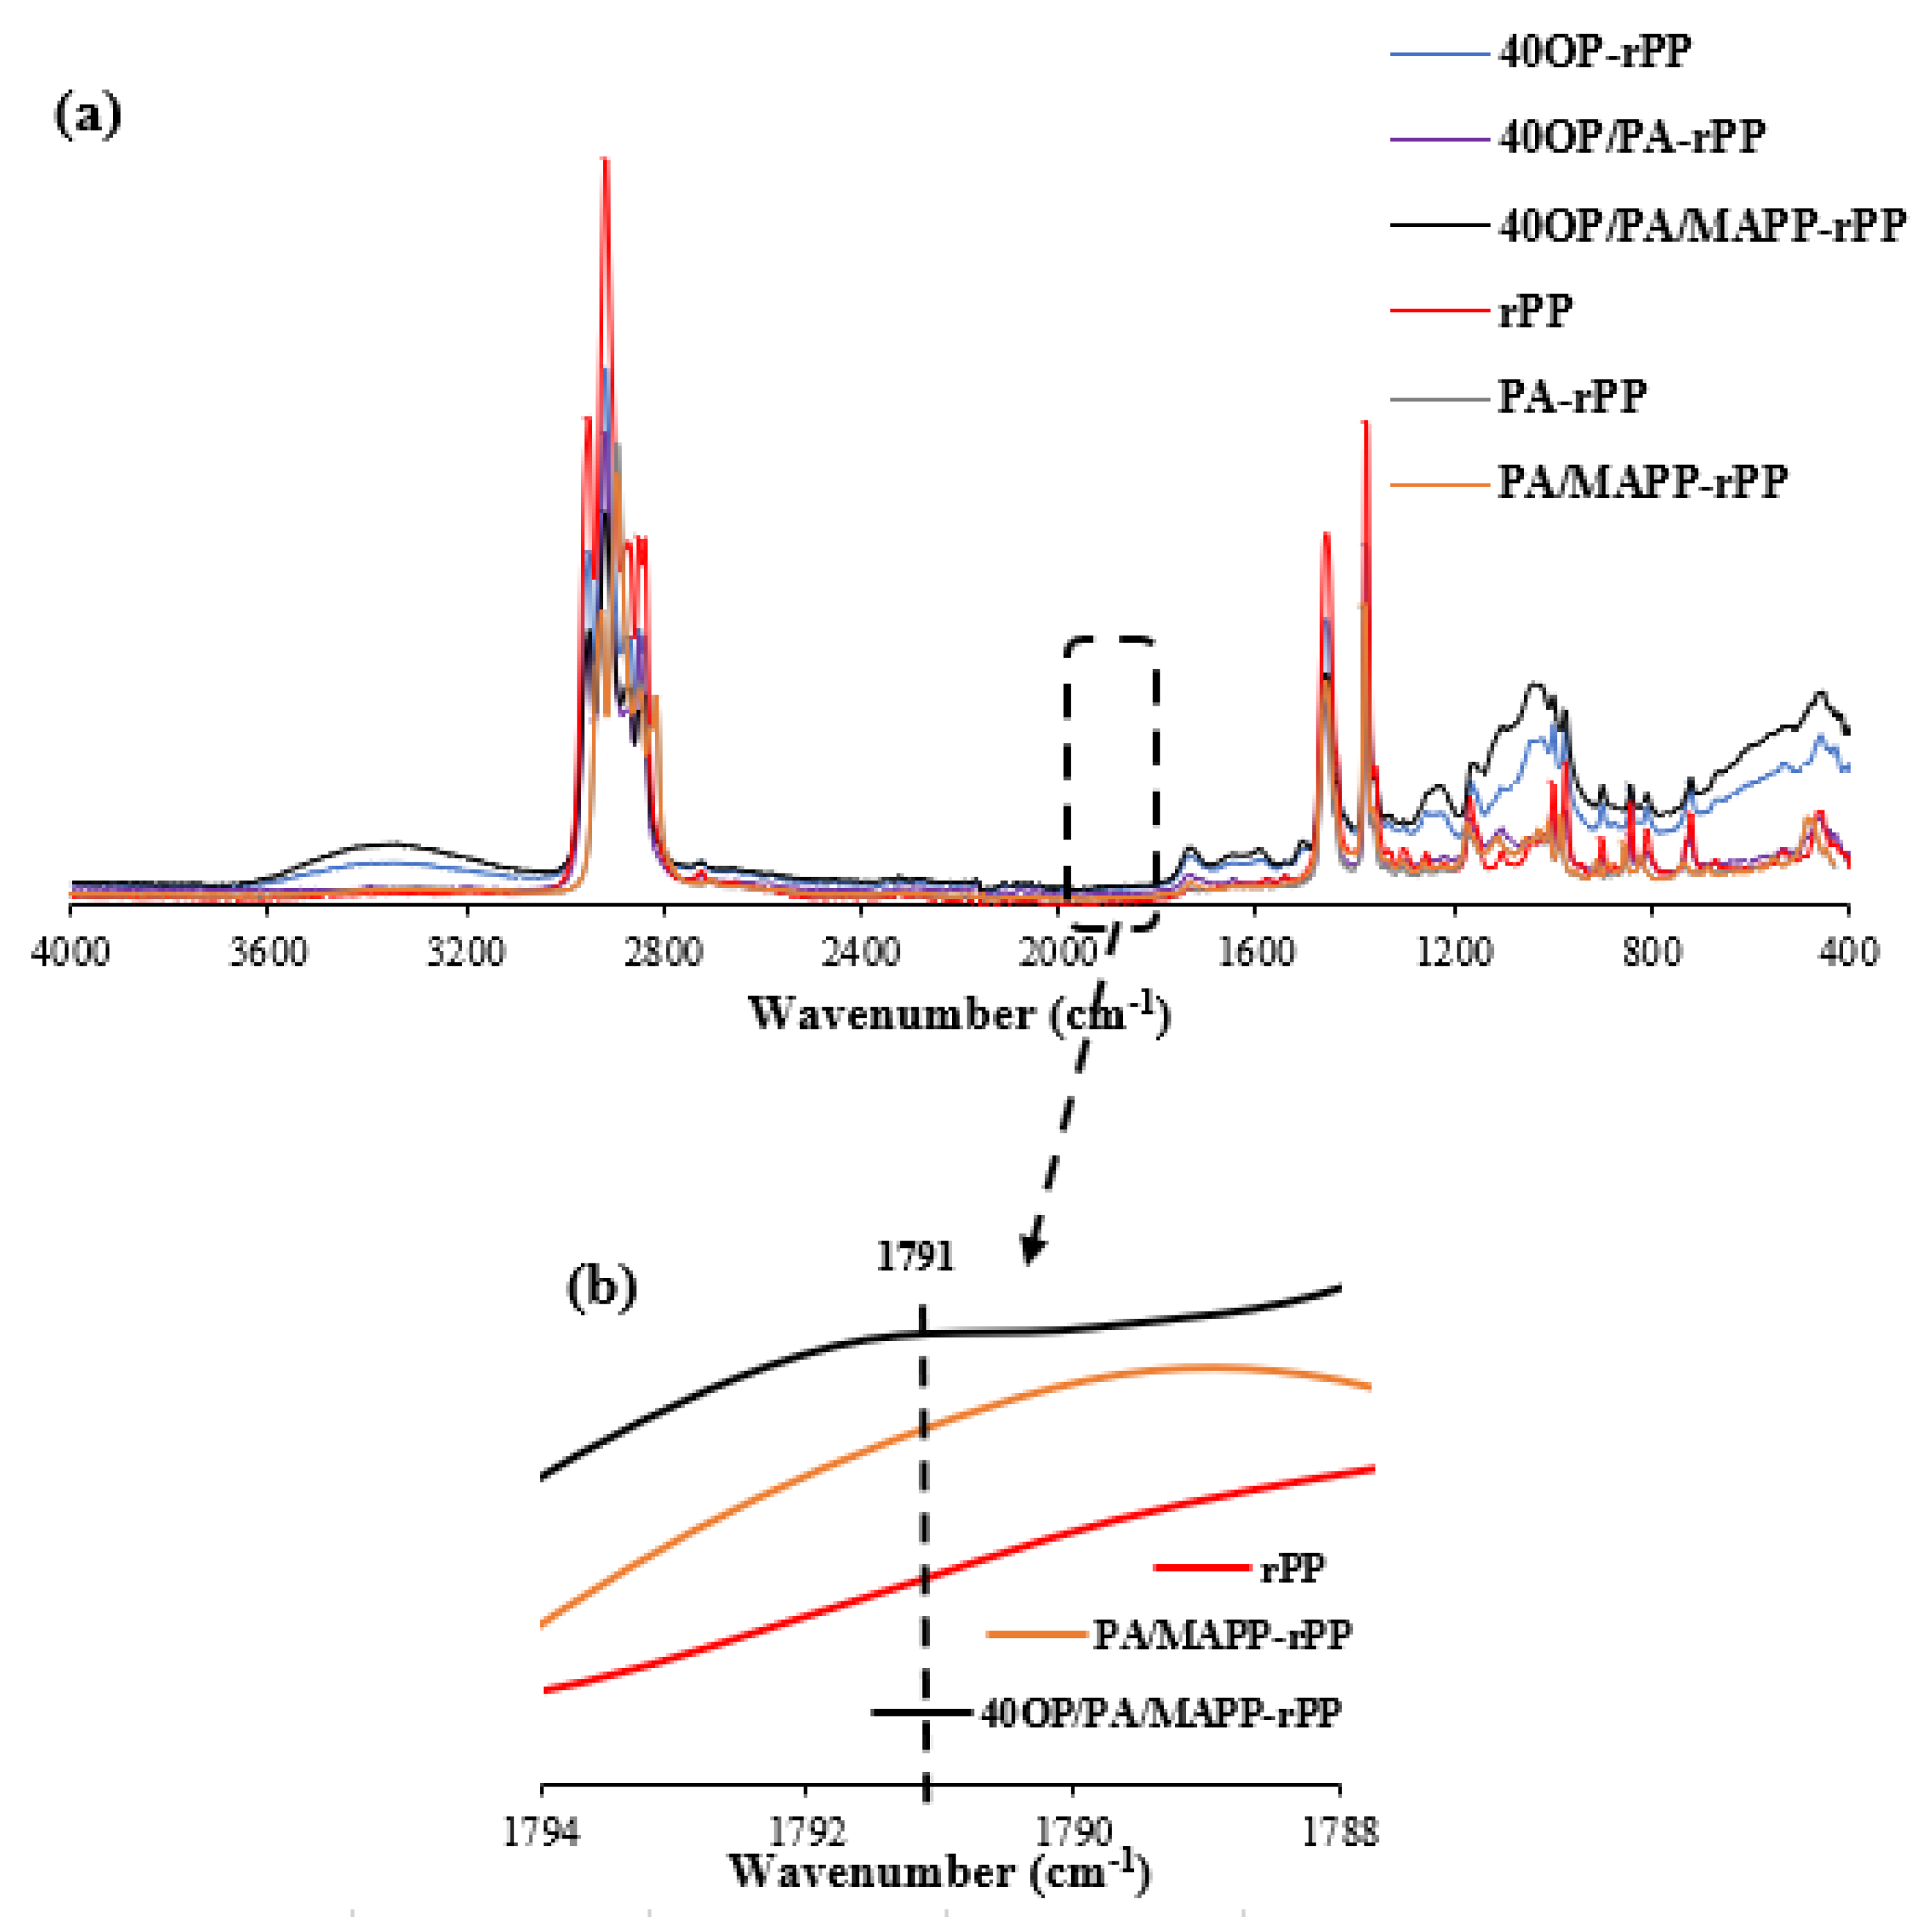
3.5. Fourier Transform Infrared Spectroscopy
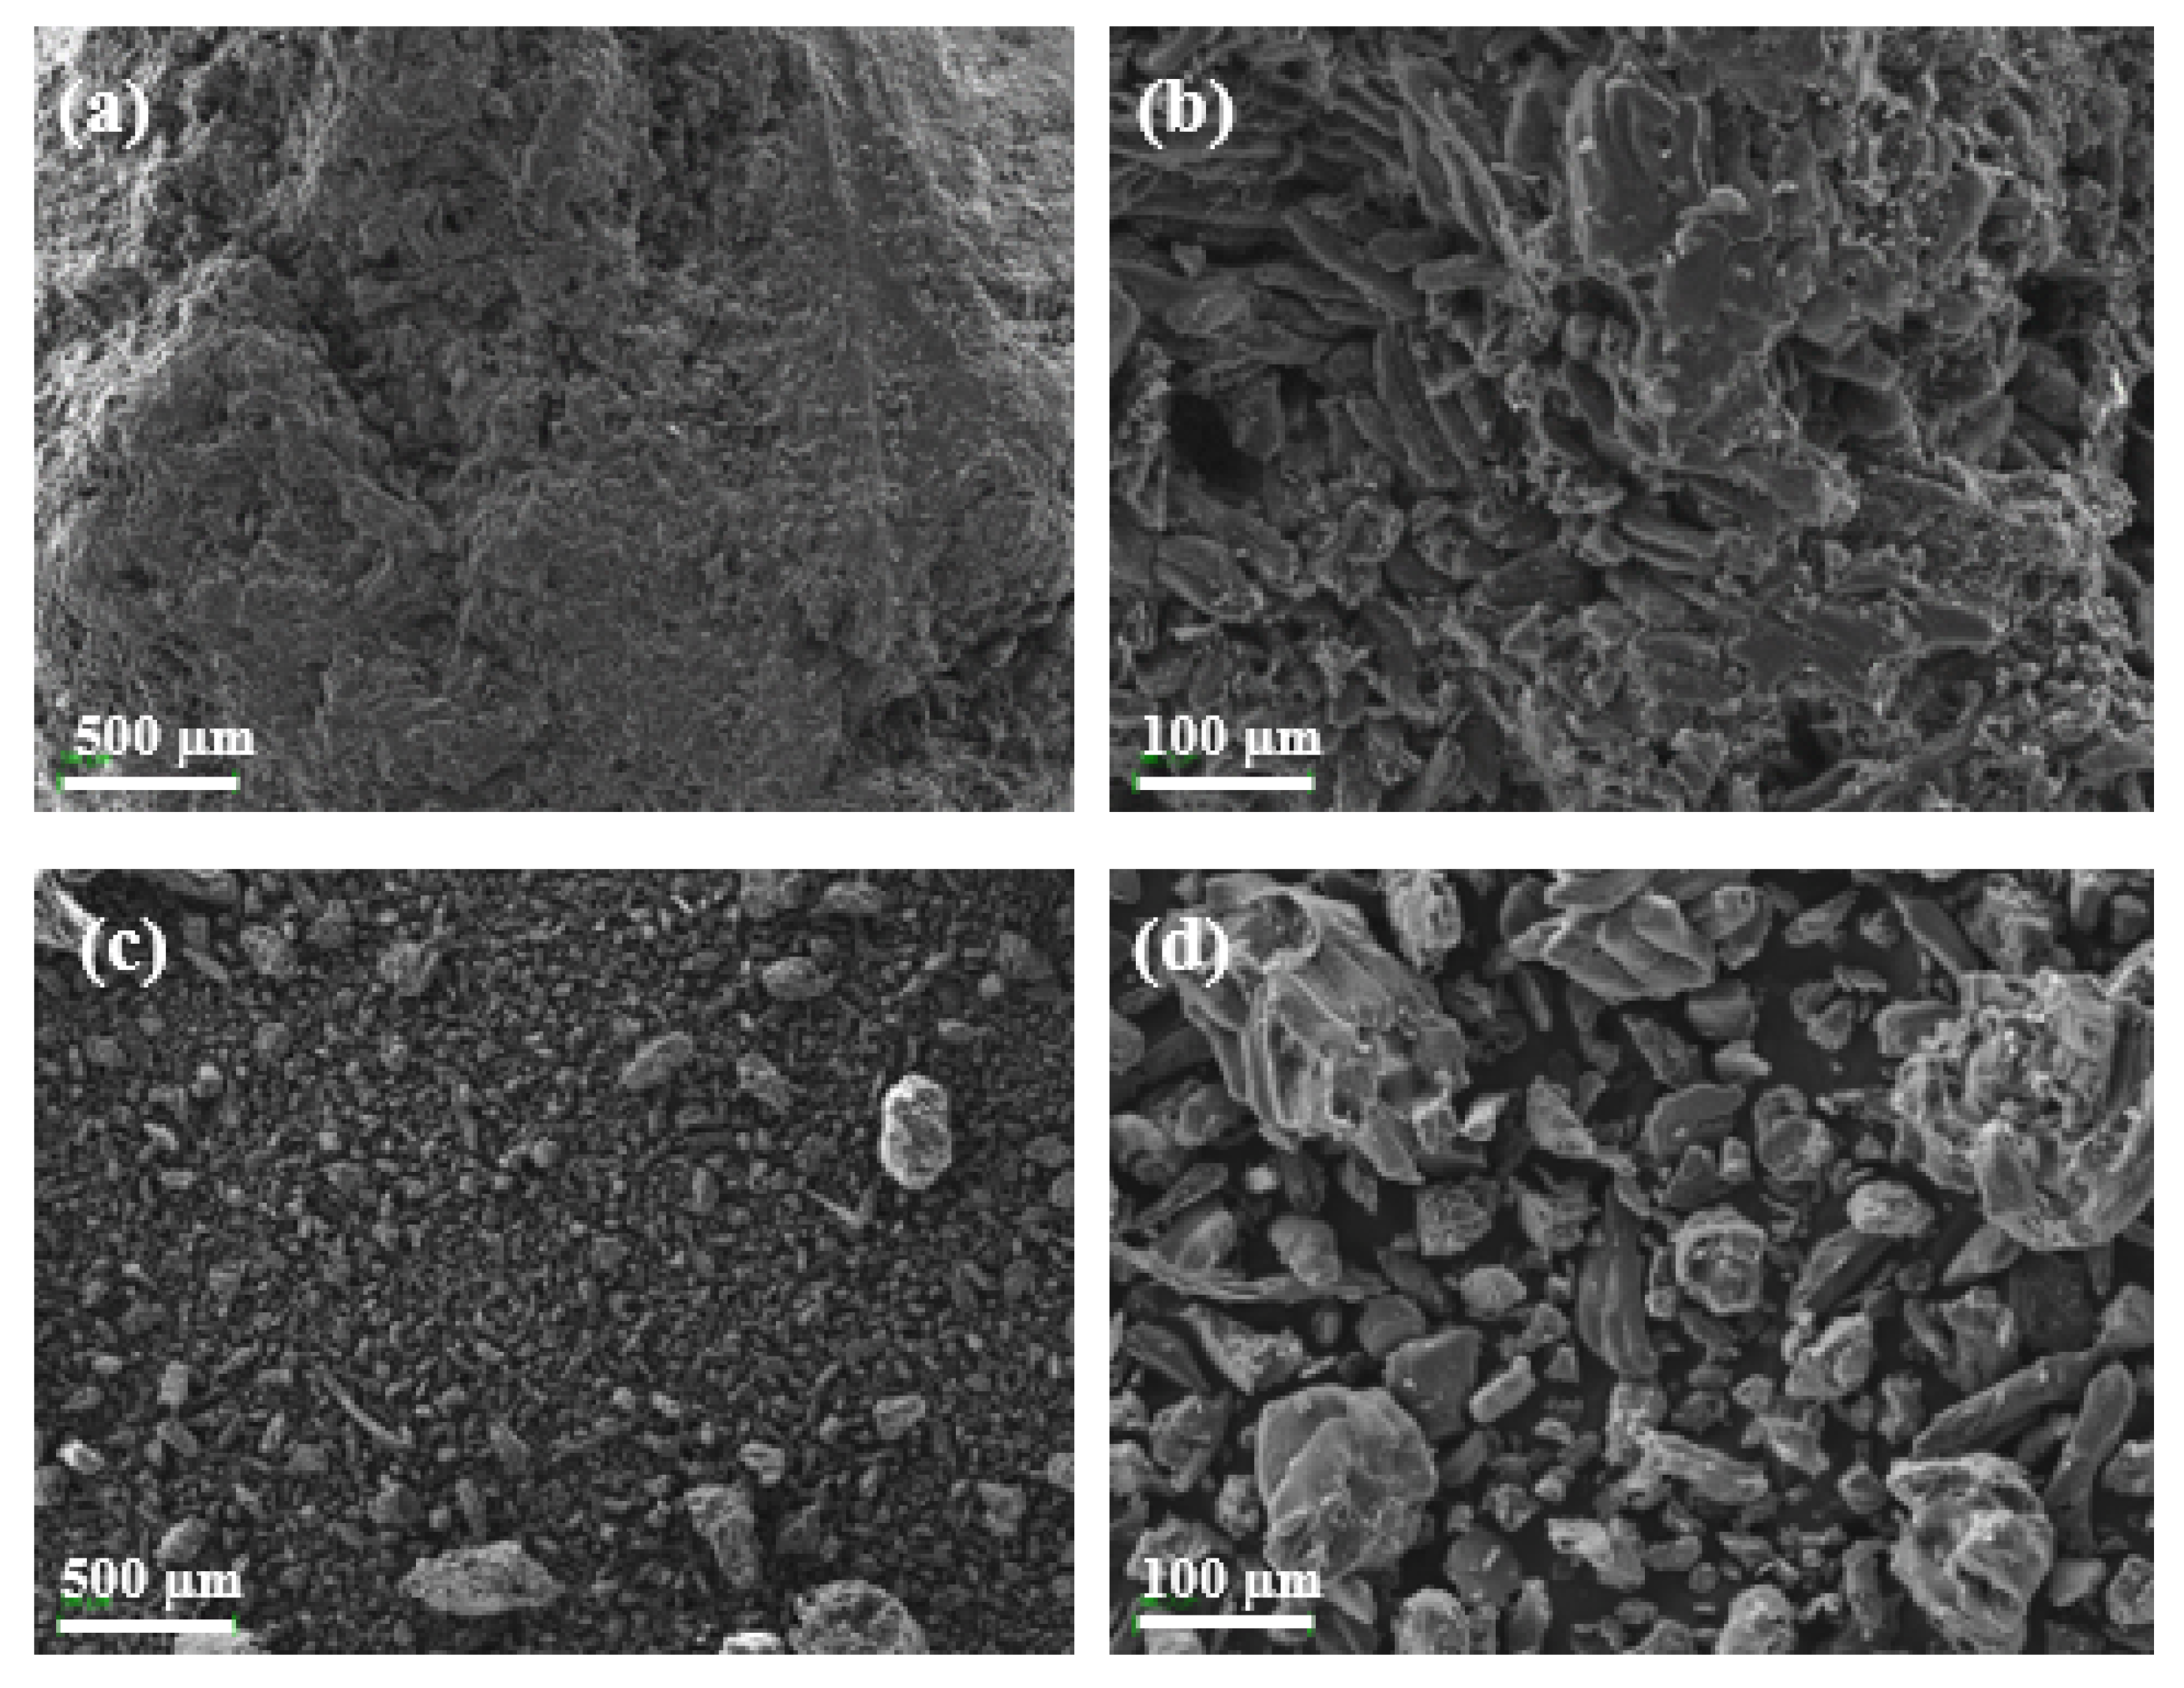
3.6. Morphological Analysis
4. Conclusions
Author Contributions
Funding
Informed Consent Statement
Data Availability Statement
Acknowledgments
Conflicts of Interest
References
- Bonnenfant, C.; Gontard, N.; Aouf, C. Biobased and Biodegradable Polymers in a Circular Economy Context: Understanding Quercetin and Gallic Acid Impacts on PHBV Thermal Properties. Polym. Degrad. Stab. 2022, 201, 109975. [Google Scholar] [CrossRef]
- Moriana, R. Development and Characterization of Fibered Biocomposites from Renewable Resources. Study of Its Degradation on Land. Ph.D. Thesis, University Politécnica de Valencia, Valencia, Spain, 2010. [Google Scholar] [CrossRef]
- European Commission. Communication from the Commission to the Council; The European Parliament; The European Economic and Social Committee and the Committee of the Regions COM/2020/98: Brussels, Belgium, 2020. [Google Scholar]
- Ferri, M.; Vannini, M.; Ehrnell, M.; Eliasson, L.; Xanthakis, E.; Monari, S.; Sisti, L.; Marchese, P.; Celli, A.; Tassoni, A. From Winery Waste to Bioactive Compounds and New Polymeric Biocomposites: A Contribution to the Circular Economy Concept. J. Adv. Res. 2020, 24, 1–11. [Google Scholar] [CrossRef]
- Arbelaiz, A.; Fernández, B.; Valea, A.; Mondragon, I. Mechanical Properties of Short Flax Fibre Bundle/Poly(Ε-Caprolactone) Composites: Influence of Matrix Modification and Fibre Content. Carbohydr. Polym. 2006, 64, 224–232. [Google Scholar] [CrossRef]
- Bhowmik, R.; Das, S.; Mallick, D.; Gautam, S.S. Predicting the Elastic Properties of Hemp Fiber—A Comparative Study on Different Polymer Composite. Mater. Today Proc. 2022, 50, 2510–2514. [Google Scholar] [CrossRef]
- Kumar, P.; Allamraju, K.V. Experimental Study and Characterization of Glass, Jute & Sisal Fiber Reinforced Polymer Matrix Composites. Mater. Today Proc. 2021, 44, 941–948. [Google Scholar] [CrossRef]
- Kumar, N.; Grewal, J.S.; Kumar, S.; Kumar, N.; Kashyap, K. Mechanical and Thermal Properties of Naoh Treated Sisal Natural Fiber Reinforced Polymer Composites: Barium Sulphate Used as Filler. Mater. Today Proc. 2021, 45, 5575–5578. [Google Scholar] [CrossRef]
- Badyankal, P.V.; Manjunatha, T.S.; Vaggar, G.B.; Praveen, K.C. Compression and Water Absorption Behaviour of Banana and Sisal Hybrid Fiber Polymer Composites. Mater. Today Proc. 2021, 35, 383–386. [Google Scholar] [CrossRef]
- Balart, J.F.; Fombuena, V.; Fenollar, O.; Boronat, T.; Sánchez-Nacher, L. Processing and Characterization of High Environmental Efficiency Composites Based on PLA and Hazelnut Shell Flour (HSF) with Biobased Plasticizers Derived from Epoxidized Linseed Oil (ELO). Compos. B Eng. 2016, 86, 168–177. [Google Scholar] [CrossRef]
- Pirayesh, H.; Khanjanzadeh, H.; Salari, A. Effect of Using Walnut/Almond Shells on the Physical, Mechanical Properties and Formaldehyde Emission of Particleboard. Compos. B Eng. 2013, 45, 858–863. [Google Scholar] [CrossRef]
- Güler, C.; Büyüksarı, Ü. Effect of Production Parameter on the Physical and Mechanical Properties of Particleboards Made from Peanut (Arachis hypogaea L.) Hull. BioResources 2011, 6, 5027–5036. [Google Scholar] [CrossRef]
- Núñez-Decap, M.; Wechsler-Pizarro, A.; Vidal-Vega, M. Mechanical, Physical, Thermal and Morphological Properties of Polypropylene Composite Materials Developed with Particles of Peach and Cherry Stones. Sustain. Mater. Technol. 2021, 29, e00300. [Google Scholar] [CrossRef]
- Wechsler, A.; Molina, J.; Cayumil, R.; Núñez-Decap, M.; Ballerini-Arroyo, A. Some Properties of Composite Panels Manufactured from Peach (Prunus persica) Pits and Polypropylene. Compos. B Eng. 2019, 175, 107152. [Google Scholar] [CrossRef]
- Marquina, J.; Colinet, M.J.; Pablo-Romero, M.P. The Economic Value of Olive Sector Biomass for Thermal and Electrical Uses in Andalusia (Spain). Renew. Sustain. Energy Rev. 2021, 148, 111278. [Google Scholar] [CrossRef]
- Espadas-Aldana, G.; Guaygua-Amaguaña, P.; Vialle, C.; Belaud, J.; Evon, P.; Sablayrolles, C. Life Cycle Assessment of Olive Pomace as a Reinforcement in Polypropylene and Polyethylene Biocomposite Materials: A New Perspective for the Valorization of this Agricultural By-Product. Coatings 2021, 11, 525. [Google Scholar] [CrossRef]
- González, J.F.; González-García, C.M.; Ramiro, A.; González, J.; Sabio, E.; Gañán, J.; Rodríguez, M.A. Combustion Optimisation of Biomass Residue Pellets for Domestic Heating with a Mural Boiler. Biomass Bioenergy 2004, 27, 145–154. [Google Scholar] [CrossRef]
- Mami, M.; Mätzing, H.; Gehrmann, H.; Stapf, D.; Bolduan, R.; Lajili, M. Investigation of the Olive Mill Solid Wastes Pellets Combustion in a Counter-Current Fixed Bed Reactor. Energies 2018, 11, 1965. [Google Scholar] [CrossRef]
- Calvano, C.; Tamborrino, A. Valorization of Olive By-Products: Innovative Strategies for Their Production, Treatment and Characterization. Foods 2022, 11, 768. [Google Scholar] [CrossRef] [PubMed]
- Elbir, M.; Moubarik, A.; Rakib, E.M.; Grimi, N.; Amhoud, A.; Miguel, G.; Hanine, H.; Artaud, J.; Vanloot, P.; Mbarki, M. Valorization of Moroccan Olive Stones by Using It in Particleboard Panels. Maderas Ciencia y Tecnología 2012, 14, 361–371. [Google Scholar] [CrossRef][Green Version]
- Hamida, B.; Ahmed, M.; Nadia, N.; Samira, M. Mechanical Properties of Polystyrene/Olive Stone Flour Composites. Res. J. Pharm. Biol. Chem. Sci. 2015, 6, 127–135. [Google Scholar]
- Koutsomitopoulou, A.F.; Bénézet, J.C.; Bergeret, A.; Papanicolaou, G.C. Preparation and Characterization of Olive Pit Powder as a Filler to PLA-Matrix Bio-Composites. Powder Technol. 2014, 255, 10–16. [Google Scholar] [CrossRef]
- Naghmouchi, I.; Mutjé, P.; Boufi, S. Olive Stones Flour as Reinforcement in Polypropylene Composites: A Step Forward in the Valorization of the Solid Waste from the Olive Oil Industry. Ind. Crops Prod. 2015, 72, 183–191. [Google Scholar] [CrossRef]
- Naghmouchi, I.; Espinach, F.X.; Mutjé, P.; Boufi, S. Polypropylene Composites Based on Lignocellulosic Fillers: How the Filler Morphology Affects the Composite Properties. Mater. Des. 2015, 65, 454–461. [Google Scholar] [CrossRef]
- Valvez, S.; Maceiras, A.; Santos, P.; Reis, P.N.B. Olive Stones as Filler for Polymer-Based Composites: A Review. Materials 2021, 14, 845. [Google Scholar] [CrossRef] [PubMed]
- La Mantia, F.; Dintcheva, N.T.; Morreale, M.; Vaca-Garcia, C. Green Composites of Organic Materials and Recycled Post-Consumer Polyethylene. Polym. Int. 2004, 53, 1888–1891. [Google Scholar] [CrossRef]
- Test Methods. Technical Associaton for the Pulp and Paper Industries; TAPPI Press: Atlanta, GA, USA, 2018.
- Browning, B.L. (Ed.) Determination of lignin. In Methods of Wood Chemistry; Wiley & Sons, Interscience Publishers: New York, NY, USA, 1967; Volume 1, pp. 785–823. [Google Scholar]
- UNE-EN ISO 527-2:2012; Plastics—Determination of Tensile Properties—Part 2: Test Conditions for Moulding and Extrusion Plastics (ISO 527-2:2012). ISO: Geneva, Switzerland, 2012.
- UNE-EN ISO 178:2020; Plastics—Determination of Flexural Properties (ISO 178:2019). ISO: Geneva, Switzerland, 2020.
- UNE-EN ISO 179-1:2011; Plastics—Determination of Charpy Impact Properties—Part 1: Non-Instrumented Impact Test (ISO 179-1:2000). ISO: Geneva, Switzerland, 2011.
- Panigrahi, H.; Sreenath, P.R.; Bhowmick, A.K.; Kumar, K.D. Unique Compatibilized Thermoplastic Elastomer from Polypropylene and Epichlorohydrin Rubber. Polymer 2019, 183, 121866. [Google Scholar] [CrossRef]
- Kilic, A.; Jones, K.; Shim, E.; Pourdeyhimi, B. Surface Crystallinity of Meltspun Isotactic Polypropylene Filaments. Macromol. Res. 2015, 24, 25–30. [Google Scholar] [CrossRef]
- Reichert, A.A.; Ribas, M.; Escobar, G.; Augusto, C.; Fajardo, A.R. Utilization of Pineapple Crown Fiber and Recycled Polypropylene for Production of Sustainable Composites. J. Renew. Mater. 2020, 8, 1327–1341. [Google Scholar] [CrossRef]
- Correia, C.; Oliveira, L.; Valera, T. The Influence of Bleached Jute Fiber Filler on the Properties of Vulcanized Natural Rubber. Mater. Res. 2017, 20, 466–471. [Google Scholar] [CrossRef]
- Benyahia, A.; Merrouche, A.; Rahmouni, Z.; Mansour, R.; Serge, W.; Kouadri, Z. Study of the Alkali Treatment Effect on the Mechanical Behavior of the Composite Unsaturated Polyester-Alfa Fibers. Mech. Ind. 2014, 15, 69. [Google Scholar] [CrossRef]
- Belalia, M.; Bendjelloul, M.; Aziz, A.; Elandaloussi, E. Surface Modification of Olive Stone Waste for Enhanced Sorption Properties of Cadmium and Lead Ions. Acta Chem. Iasi 2018, 26, 281. [Google Scholar] [CrossRef]
- Corzo, M. El Hueso de Cereza, un Residuo Agroindustrial Objeto de Estudio para El Aprovechamiento en la Obtención De Carbonizados y Carbones Activados. Rev. Estud. Extrem. 2004, 60, 1293. [Google Scholar]
- Hasanin, M.S.; Kassem, N.; Hassan, M.L. Preparation and Characterization of Microcrystalline Cellulose from Olive Stones. Biomass Convers. Biorefin. 2021, 1–8. [Google Scholar] [CrossRef]
- Tasdemir, M. Effects of Olive Pit and Almond Shell Powder on Polypropylene. Key Eng. Mater. 2017, 733, 65. [Google Scholar] [CrossRef]
- Woodhams, R.T.; Thomas, G.; Rodgers, D.K. Wood Fibers as Reinforcing Fillers for Polyolefins. Polym. Eng. Sci. 1984, 24, 1166. [Google Scholar] [CrossRef]
- Sanadi, A.R.; Young, R.A.; Clemons, C.; Rowell, R.M. Recycled Newspaper Fibers as Reinforcing Fillers in Thermoplastics: Part I-Analysis of Tensile and Impact Properties in Polypropylene. J. Reinf. Plast. Compos 1994, 13, 54–67. [Google Scholar] [CrossRef]
- Kishi, H.; Yoshioka, M.; Yamanoi, A.; Shiraishi, N. Composites of Wood and Polypropylene. Mokuzai Gakkaishi 1989, 34, 133. [Google Scholar]
- Felix, J.M.; Gatenholm, P. The Nature of Adhesion in Composites of Modified Cellulose Fibers and Polypropylene. J. Appl. Polym. Sci. 1991, 42, 609–620. [Google Scholar] [CrossRef]
- Kazayawoko, M.; Matuana, L.M.; Balatinecz, J.J. Surface Modification and Adhesion Mechanisms in Woodfiber-Polypropylene Composites. J. Mater. Sci. 1999, 34, 6189. [Google Scholar] [CrossRef]
- Essabir, H.; EL Achaby, M.; Hilali, E.M.; Bouhfid, R.; Qaiss, A.; Hilali, E.M. Morphological, Structural, Thermal and Tensile Properties of High Density Polyethylene Composites Reinforced with Treated Argan Nut Shell Particles. J. Bionic Eng. 2015, 12, 129–141. [Google Scholar] [CrossRef]
- Naghmouchi, I.; Mutjé, P.; Boufi, S. Polyvinyl Chloride Composites Filled with Olive Stone Flour: Mechanical, Thermal, and Water Absorption Properties. J. Appl. Polym. Sci. 2014, 131. [Google Scholar] [CrossRef]
- Khalid, M.S.; Ali, S.; Abdullah, L.C.; Ratnam, C.T.; Choong, S.Y.T. Effect of MAPP as Coupling Agent on the Mechanical Properties of Palm Fiber Empty Fruit Bunch and Cellulose Polypropylene Biocomposites. Int. J. Eng. Technol. 2006, 3, 79. [Google Scholar]
- Caldas, V.; Brown, G.R.; Nohr, R.S.; MacDonald, J.G.; Raboin, L.E. The Structure of the Mesomorphic Phase of Quenched Isotactic Polypropylene. Polymer 1994, 35, 899. [Google Scholar] [CrossRef]
- Techawinyutham, L.; Frick, A.; Siengchin, S. Polypropylene/Maleic Anhydride Grafted Polypropylene (MAgPP)/Coconut Fiber Composites. Adv. Mech. Eng. 2016, 8, 1. [Google Scholar] [CrossRef]
- Meng-Heng, W.; Cheng-Chien, W.; Chuh-Yung, C. Chemical Modification of Atactic Polypropylene and Its Applications as a Crystallinity Additive and Compatibility Agent. Polymer 2020, 194, 122386. [Google Scholar] [CrossRef]
- Mora, J.C.; Esquivel, M.; Durán, M.; Zamora, R. Obtaining and evaluation of polypropylene mixtures with banana rachis fibers (Musa AAA). Rev. Iberoam. Polím. 2015, 16, 91–111. [Google Scholar]
- Clack, E.S. Unit Cell Information on Some Important Polymers; Physical Properties of Polymers Handbook; Mark, J.E., Ed.; AIP Press: Woodburry, NY, USA, 1999. [Google Scholar] [CrossRef]
- Morales-Cepeda, A.B.; Ponce-Medina, M.E.; Salas-Papayanopolos, H.; Lozano, T.; Zamudio, M.; Lafleur, L.G. Preparation and Characterization of Candelilla Fiber (Euphorbia antisyphilitica) and Its Reinforcing Effect in Polypropylene Composites. Cellulose 2015, 22, 3839. [Google Scholar] [CrossRef]
- Panaitescu, D.M.; Vuluga, Z.; Ghiurea, M.; Iorga, M.; Nicolae, C.; Gabor, R. Influence of Compatibilizing System on Morphology, Thermal and Mechanical Properties of High Flow Polypropylene Reinforced with Short Hemp Fibers. Compos. B Eng. 2015, 69, 286. [Google Scholar] [CrossRef]
- Ryu, Y.S.; Lee, J.H.; Kim, S.H. Efficacy of Alkyl Ketene Dimer Modified Microcrystalline Cellulose in Polypropylene Matrix. Polymer 2020, 196, 122463. [Google Scholar] [CrossRef]
- Zhang, Y.-C.; Wu, H.-Y.; Qiu, Y.-P. Morphology and Properties of Hybrid Composites Based on Polypropylene/Polylactic Acid Blend and Bamboo Fiber. Bioresour. Technol. 2010, 101, 7944. [Google Scholar] [CrossRef]
- Jain, S.; Goossens, H.; van Duin, M.; Lemstra, P. Effect of in Situ Prepared Silica Nano-Particles on Non-Isothermal Crystallization of Polypropylene. Polymer 2005, 46, 8805. [Google Scholar] [CrossRef]
- Andreassen, E. Infrared and Raman Spectroscopy of Polypropylene; Springer: Berlin/Heidelberg, Germany, 1999. [Google Scholar] [CrossRef]
- Gümüş, B.E.; Yağci, Ö.; Erdoğan, D.C.; Tasdemir, M. Dynamical Mechanical Properties of Polypropylene Composites Filled with Olive Pit Particles. J. Test. Eval. 2019, 47, 4. [Google Scholar] [CrossRef]
- Anukam, A.I.; Mamphweli, S.N.; Reddy, P.; Okoh, O.O. Characterization and the Effect of Lignocellulosic Biomass Value Addition on Gasification Efficiency. Energy Explor. Exploit. 2016, 34, 865. [Google Scholar] [CrossRef]
- Sclavons, M.; Laurent, M.; Devaux, J.; Carlier, V. Maleic Anhydride-Grafted Polypropylene: FTIR Study of a Model Polymer Grafted by Ene-Reaction. Polymer 2005, 46, 8062. [Google Scholar] [CrossRef]
- Ragunathan, S.; Zainal, M.; Kamarudin, H.; Sam, S.T.; Ismail, H. The Effect of Polypropylene Maleic Anhydride on Polypropylene/(Recycled Acrylonitrile Butadiene Rubber)/(Sugarcane Bagasse) Composite. J. Vinyl Addit. Technol. 2017, 23, 228. [Google Scholar] [CrossRef]
- Ndiaye, D.; Diop, B.; Thiandoume, C.; Fall, P.A.; Farota, A.K.; Tidjani. Morphology and Thermo Mechanical properties of wood polypropylene composites. In Polypropylen; Dogan, F., Ed.; Intech Open Access: London, UK, 2012; pp. 415–428. [Google Scholar]
- Minggang, L.; Xin, W.; Jie, L.; Tao, T. Synergetic Effect of Epoxy Resin and Maleic Anhydride Grafted Polypropylene on Improving Mechanical Properties of Polypropylene/Short Carbon Fiber Composites. Compos. Part A Appl. Sci. Manuf. 2014, 67, 212–220. [Google Scholar] [CrossRef]
- Arráez, F.J.; Ávila, M.; Arnal, M.L.; Müller, A.J. Study of the Influence of Pro-Oxidant Additives During the Oxodegradation of Polypropylene and High Impact Polystyrene Films. Revista Latinoamericana de Metalurgia y Materiales 2018, 38, 31–42. [Google Scholar]
- Zainal, M.; Aihsan, M.Z.; Mustafa, W.A.; Santiagoo, R. Experimental Study on Thermal and Tensile Properties on Polypropylene Maleic Anhydride as a Compatibilizer in Polypropylene/Sugarcane Bagasse Composite. J. Adv. Res. Fluid Mech. Therm. Sci. 2018, 43, 141–148. [Google Scholar]
- Laske, S.; Kracalik, M.; Gschweitl, M.; Feuchter, M.; Maier, G.; Pinter, G.; Thomann, R.; Friesenbichler, W.; Langecker, R. Estimation of Reinforcement in Compatibilized Polypropylene Nanocomposites by Extensional Rheology. J. Appl. Polym. Sci. 2009, 111, 2253–2259. [Google Scholar] [CrossRef]
- Nosova, N.; Roiter, Y.; Samaryk, V.; Varvarenko, S.; Stetsyshyn, Y.; Minko, S.; Stamm, M.; Voronov, S. Polypropylene Surface Peroxidation with Heterofunctional Polyperoxides. Macromol. Symp. 2004, 210, 229–348. [Google Scholar] [CrossRef]


| Reference | rPP (wt%) | OP (wt%) | PA (wt%) | MAPP (wt%) |
|---|---|---|---|---|
| rPP | 100.0 | - | - | - |
| 25OP-rPP | 75.0 | 25.0 | - | - |
| 40OP-rPP | 60.0 | 40.0 | - | - |
| PA-rPP | 100.0 | - | 1.5 | - |
| 25OP/PA-rPP | 73.5 | 25.0 | 1.5 | - |
| 40OP/PA-rPP | 58.5 | 40.0 | 1.5 | - |
| PA/MAPP-rPP | 100.0 | - | 1.5 | 4.0 |
| 25OP/PA/MAPP-rPP | 69.5 | 25.0 | 1.5 | 4.0 |
| 40OP/PA/MAPP-rPP | 54.5 | 40.0 | 1.5 | 4.0 |
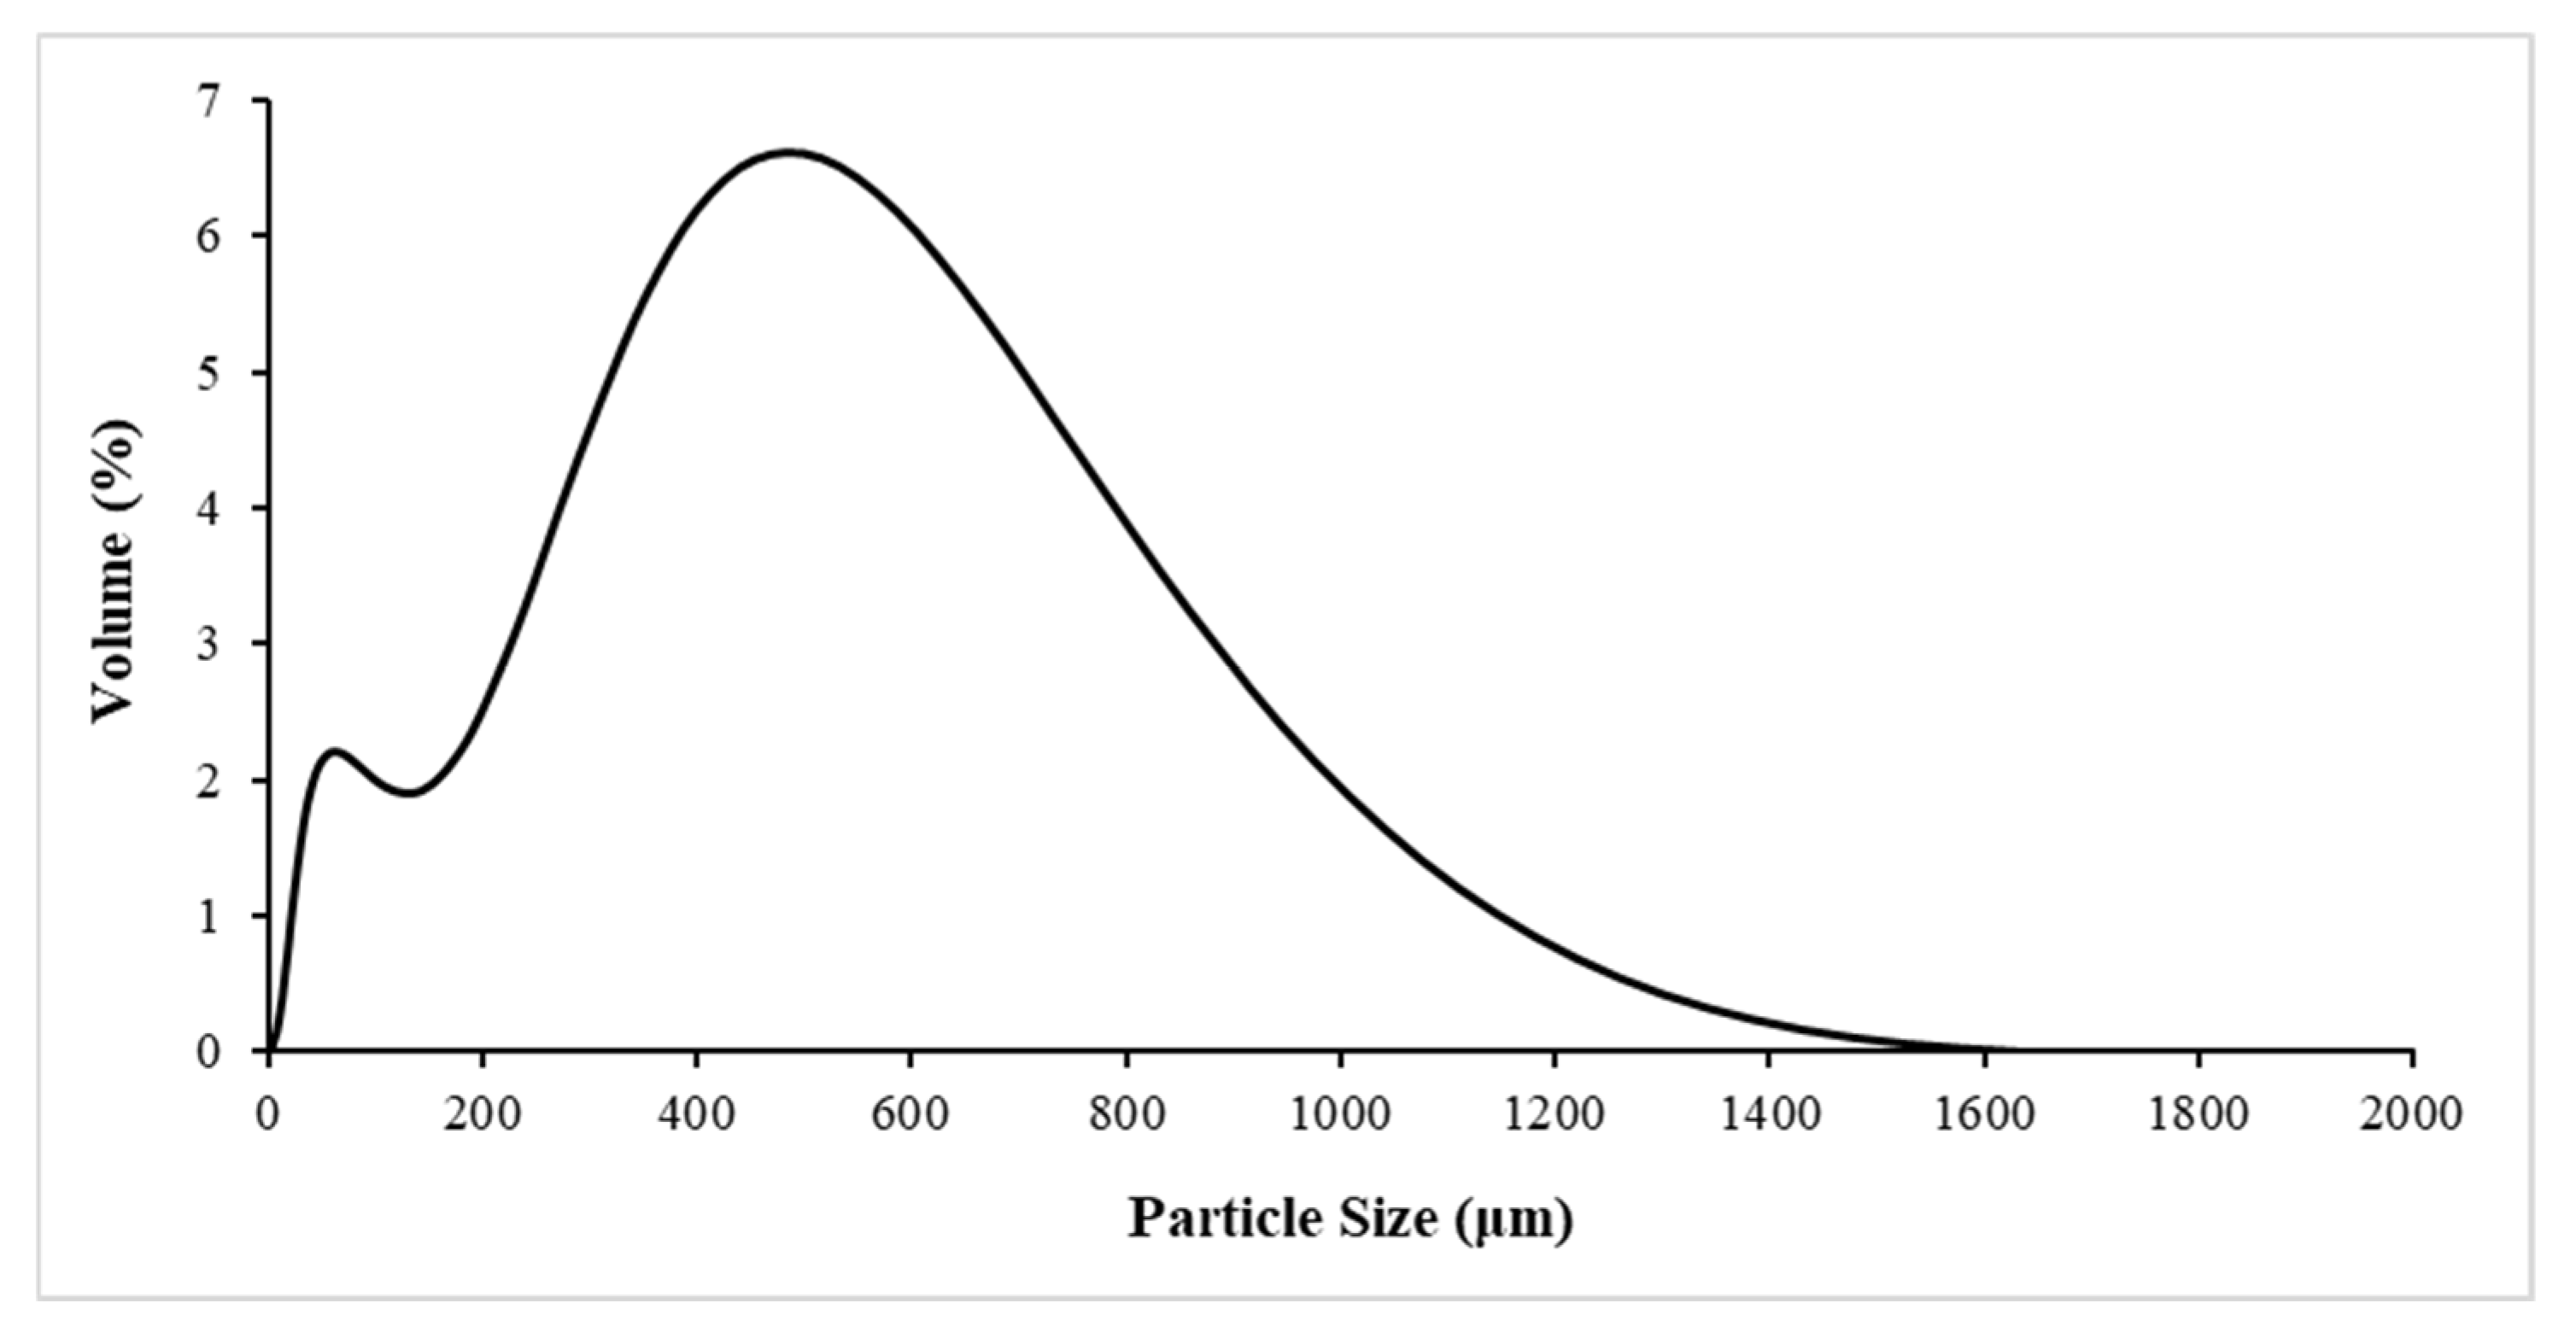
| Raw Materials | d10 (µm) | d50 (µm) | d90 (µm) |
|---|---|---|---|
| OP | 40.3 | 336 | 795 |
| Raw Materials | Moisture (wt%) | Ash (wt%) | Cellulose (wt%) | Hemicellulose (wt%) | Lignin (wt%) |
|---|---|---|---|---|---|
| OP | 5.11 | 0.00 | 21.79 | 23.60 | 33.78 |
| Reference | σm (MPa) | σb (Mpa) | εm (%) | εb (%) | Et (Mpa) |
|---|---|---|---|---|---|
| rPP | 25.39 ± 0.56 | 18.87 ± 1.32 | 10.10 ± 0.40 | 17.25 ± 1.57 | 935.09 ± 18.77 |
| 25OP-rPP | 17.95 ± 0.16 | 16.97 ± 0.34 | 6.32 ± 0.24 | 7.56 ± 0.19 | 1375.99 ± 26.35 |
| 40OP-rPP | 14.88 ± 0.36 | 13.92 ± 0.33 | 4.95 ± 0.36 | 6.34 ± 0.49 | 1547.03 ± 50.02 |
| PA-rPP | 25.28 ± 0.65 | 19.72 ± 0.68 | 8.30 ± 0.15 | 30.86 ± 5.99 | 1012.54 ± 126.01 |
| 25OP/PA-rPP | 17.31 ± 0.57 | 16.34 ± 0.52 | 6.24 ± 0.67 | 7.82 ± 0.75 | 1147.38 ± 16.62 |
| 40OP/PA-rPP | 15.25 ± 0.91 | 14.63 ± 1.09 | 4.65 ± 0.16 | 5.42 ± 0.44 | 1508.91 ± 36.88 |
| PA/MAPP-rPP | 26.07 ± 0.25 | 20.70 ± 0.31 | 8.32 ± 0.28 | 24.36 ± 2.37 | 1115.53 ± 150.14 |
| 25OP/PA/MAPP-rPP | 22.98 ± 0.41 | 22.43 ± 0.44 | 7.37 ± 0.28 | 8.18 ± 0.36 | 1542.78 ± 20.45 |
| 40OP/PA/MAPP-rPP | 23.13 ± 0.28 | 22.72 ± 0.34 | 6.70 ± 0.20 | 7.55 ± 0.33 | 1890.81 ± 72.62 |
| Reference | σfm (MPa) | σfb (MPa) | εfm (%) | εfb (%) | Ef (MPa) |
|---|---|---|---|---|---|
| rPP | 29.50 ± 0.30 | 25.60 ± 0.30 | 5.00 ± 0.00 | 5.00 ± 0.00 | 960.00 ± 30.00 |
| 25OP-rPP | 28.90 ± 1.50 | 28.90 ± 1.50 | 5.00 ± 0.00 | 5.00 ± 0.00 | 1150.00 ± 10.00 |
| 40OP-rPP | 25.20 ± 0.20 | 24.20 ± 0.20 | 4.00 ± 0.10 | 4.90 ± 0.10 | 1410.00 ± 20.00 |
| PA-rPP | 31.60 ± 0.20 | 31.60 ± 0.20 | 4.90 ± 0.00 | 5.00 ± 0.10 | 1070.00 ± 40.00 |
| 25OP/PA-rPP | 28.10 ± 0.70 | 28.10 ± 0.70 | 5.00 ± 0.00 | 5.00 ± 0.00 | 1210.00 ± 50.00 |
| 40OP/PA-rPP | 22.90 ± 0.20 | 22.60 ± 0.30 | 4.20 ± 0.10 | 5.00 ± 0.00 | 1350.00 ± 20.00 |
| PA/MAPP-rPP | 32.90 ± 0.20 | 33.00 ± 0.30 | 4.90 ± 0.00 | 5.00 ± 0.10 | 1110.00 ± 40.00 |
| 25OP/PA/MAPP-rPP | 32.30 ± 0.20 | 32.30 ± 0.20 | 5.00 ± 0.00 | 5.00 ± 0.00 | 1210.00 ± 20.00 |
| 40OP/PA/MAPP-rPP | 35.90 ± 0.20 | 35.90 ± 0.20 | 5.00 ± 0.00 | 5.00 ± 0.00 | 1540.00 ± 10.00 |
| Reference | Wc (%) | Tr (°C) | Tm (°C) | ΔHm (J/g) |
|---|---|---|---|---|
| rPP | 22.72 ± 0.07 | 126.22 ± 0.23 | 168.41 ± 1.22 | 47.18 ± 0.15 |
| 25OP-rPP | 27.92 ± 0.37 | 125.92 ± 0.09 | 167.74 ± 0.57 | 43.93 ± 0.57 |
| 40OP-rPP | 26.20 ± 2.42 | 125.13 ± 0.07 | 165.44 ± 0.25 | 35.55 ± 3.00 |
| PA-rPP | 26.08 ± 0.91 | 125.68 ± 0.15 | 170.46 ± 0.73 | 55.87 ± 1.88 |
| 25OP/PA-rPP | 26.73 ± 2.66 | 125.32 ± 0.02 | 166.69 ± 0.92 | 36.62 ± 4.06 |
| 40OP/PA-rPP | 24.22 ± 0.09 | 125.29 ± 0.38 | 166.21 ± 1.75 | 29.44 ± 0.10 |
| PA/MAPP-rPP | 24.20 ± 0.76 | 125.80 ± 0.39 | 171.03 ± 1.06 | 48.54 ± 1.57 |
| 25OP/PA/MAPP-rPP | 24.76 ± 0.36 | 126.21 ± 0.45 | 167.44 ± 0.17 | 36.14 ± 0.52 |
| 40OP/PA/MAPP-rPP | 27.10 ± 1.84 | 125.98 ± 0.82 | 166.81 ± 0.94 | 28.5 ± 0.28 |
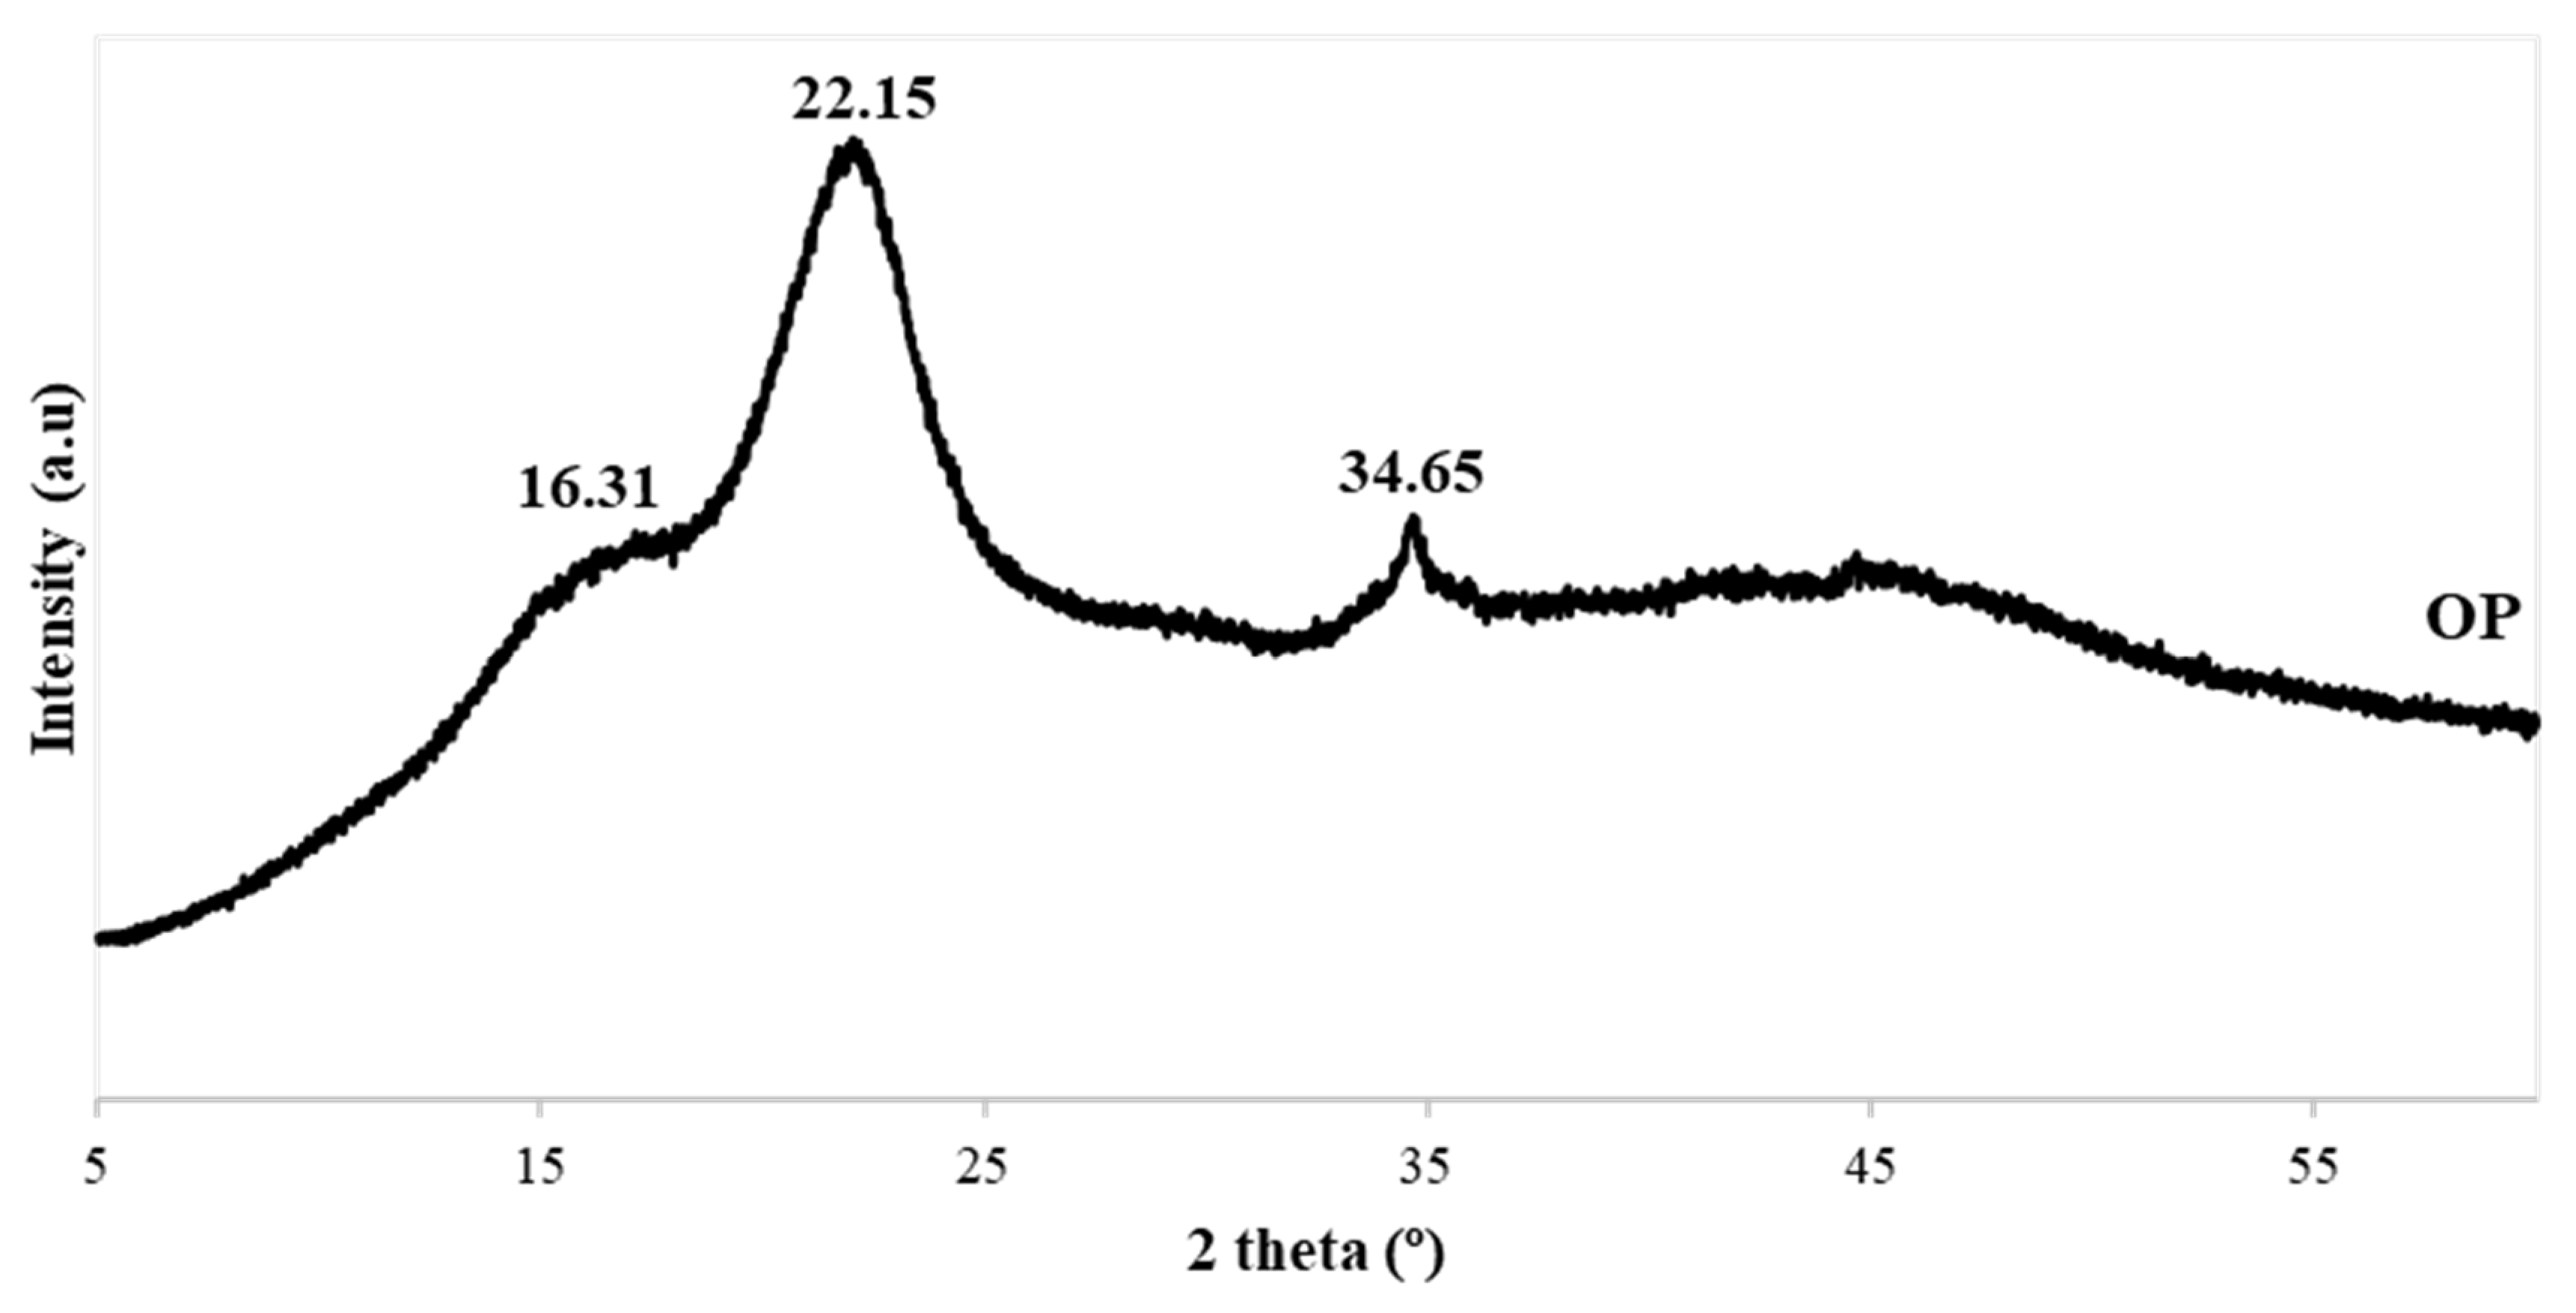
| Reference | 14° | 17° | 18.5° | 21° |
|---|---|---|---|---|
| rPP | 0.4952 | 0.4439 | 0.6860 | 1.1869 |
| 40OP-rPP | 0.5084 | 0.4478 | 0.6440 | 1.2946 |
| 40OP/PA-rPP | 0.4685 | 0.4414 | 0.6013 | 1.2167 |
| 40OP/PA/MAPP-rPP | 0.4496 | 0.4293 | 0.5750 | 1.2678 |
Publisher’s Note: MDPI stays neutral with regard to jurisdictional claims in published maps and institutional affiliations. |
© 2022 by the authors. Licensee MDPI, Basel, Switzerland. This article is an open access article distributed under the terms and conditions of the Creative Commons Attribution (CC BY) license (https://creativecommons.org/licenses/by/4.0/).
Share and Cite
Jurado-Contreras, S.; Navas-Martos, F.J.; Rodríguez-Liébana, J.A.; Moya, A.J.; La Rubia, M.D. Manufacture and Characterization of Recycled Polypropylene and Olive Pits Biocomposites. Polymers 2022, 14, 4206. https://doi.org/10.3390/polym14194206
Jurado-Contreras S, Navas-Martos FJ, Rodríguez-Liébana JA, Moya AJ, La Rubia MD. Manufacture and Characterization of Recycled Polypropylene and Olive Pits Biocomposites. Polymers. 2022; 14(19):4206. https://doi.org/10.3390/polym14194206
Chicago/Turabian StyleJurado-Contreras, Sofía, Francisco J. Navas-Martos, José A. Rodríguez-Liébana, Alberto J. Moya, and M. Dolores La Rubia. 2022. "Manufacture and Characterization of Recycled Polypropylene and Olive Pits Biocomposites" Polymers 14, no. 19: 4206. https://doi.org/10.3390/polym14194206
APA StyleJurado-Contreras, S., Navas-Martos, F. J., Rodríguez-Liébana, J. A., Moya, A. J., & La Rubia, M. D. (2022). Manufacture and Characterization of Recycled Polypropylene and Olive Pits Biocomposites. Polymers, 14(19), 4206. https://doi.org/10.3390/polym14194206