
Molecular Dynamics Investigation of Hyaluronan in Biolubrication


Abstract
1. Introduction
2. Systems and Methods
2.1. Molecular Models
2.2. Simulation Method and Conditions
- Step 1:
- A given number of solute molecules (HA or PD) and an appropriate number of water molecules are randomly placed in a rectangular simulation cell of 10.0 nm × 2.0 nm × 5.0 nm. The number of water molecules was chosen so that the total mass density was about 1.0 g/cm3.
- Step 2:
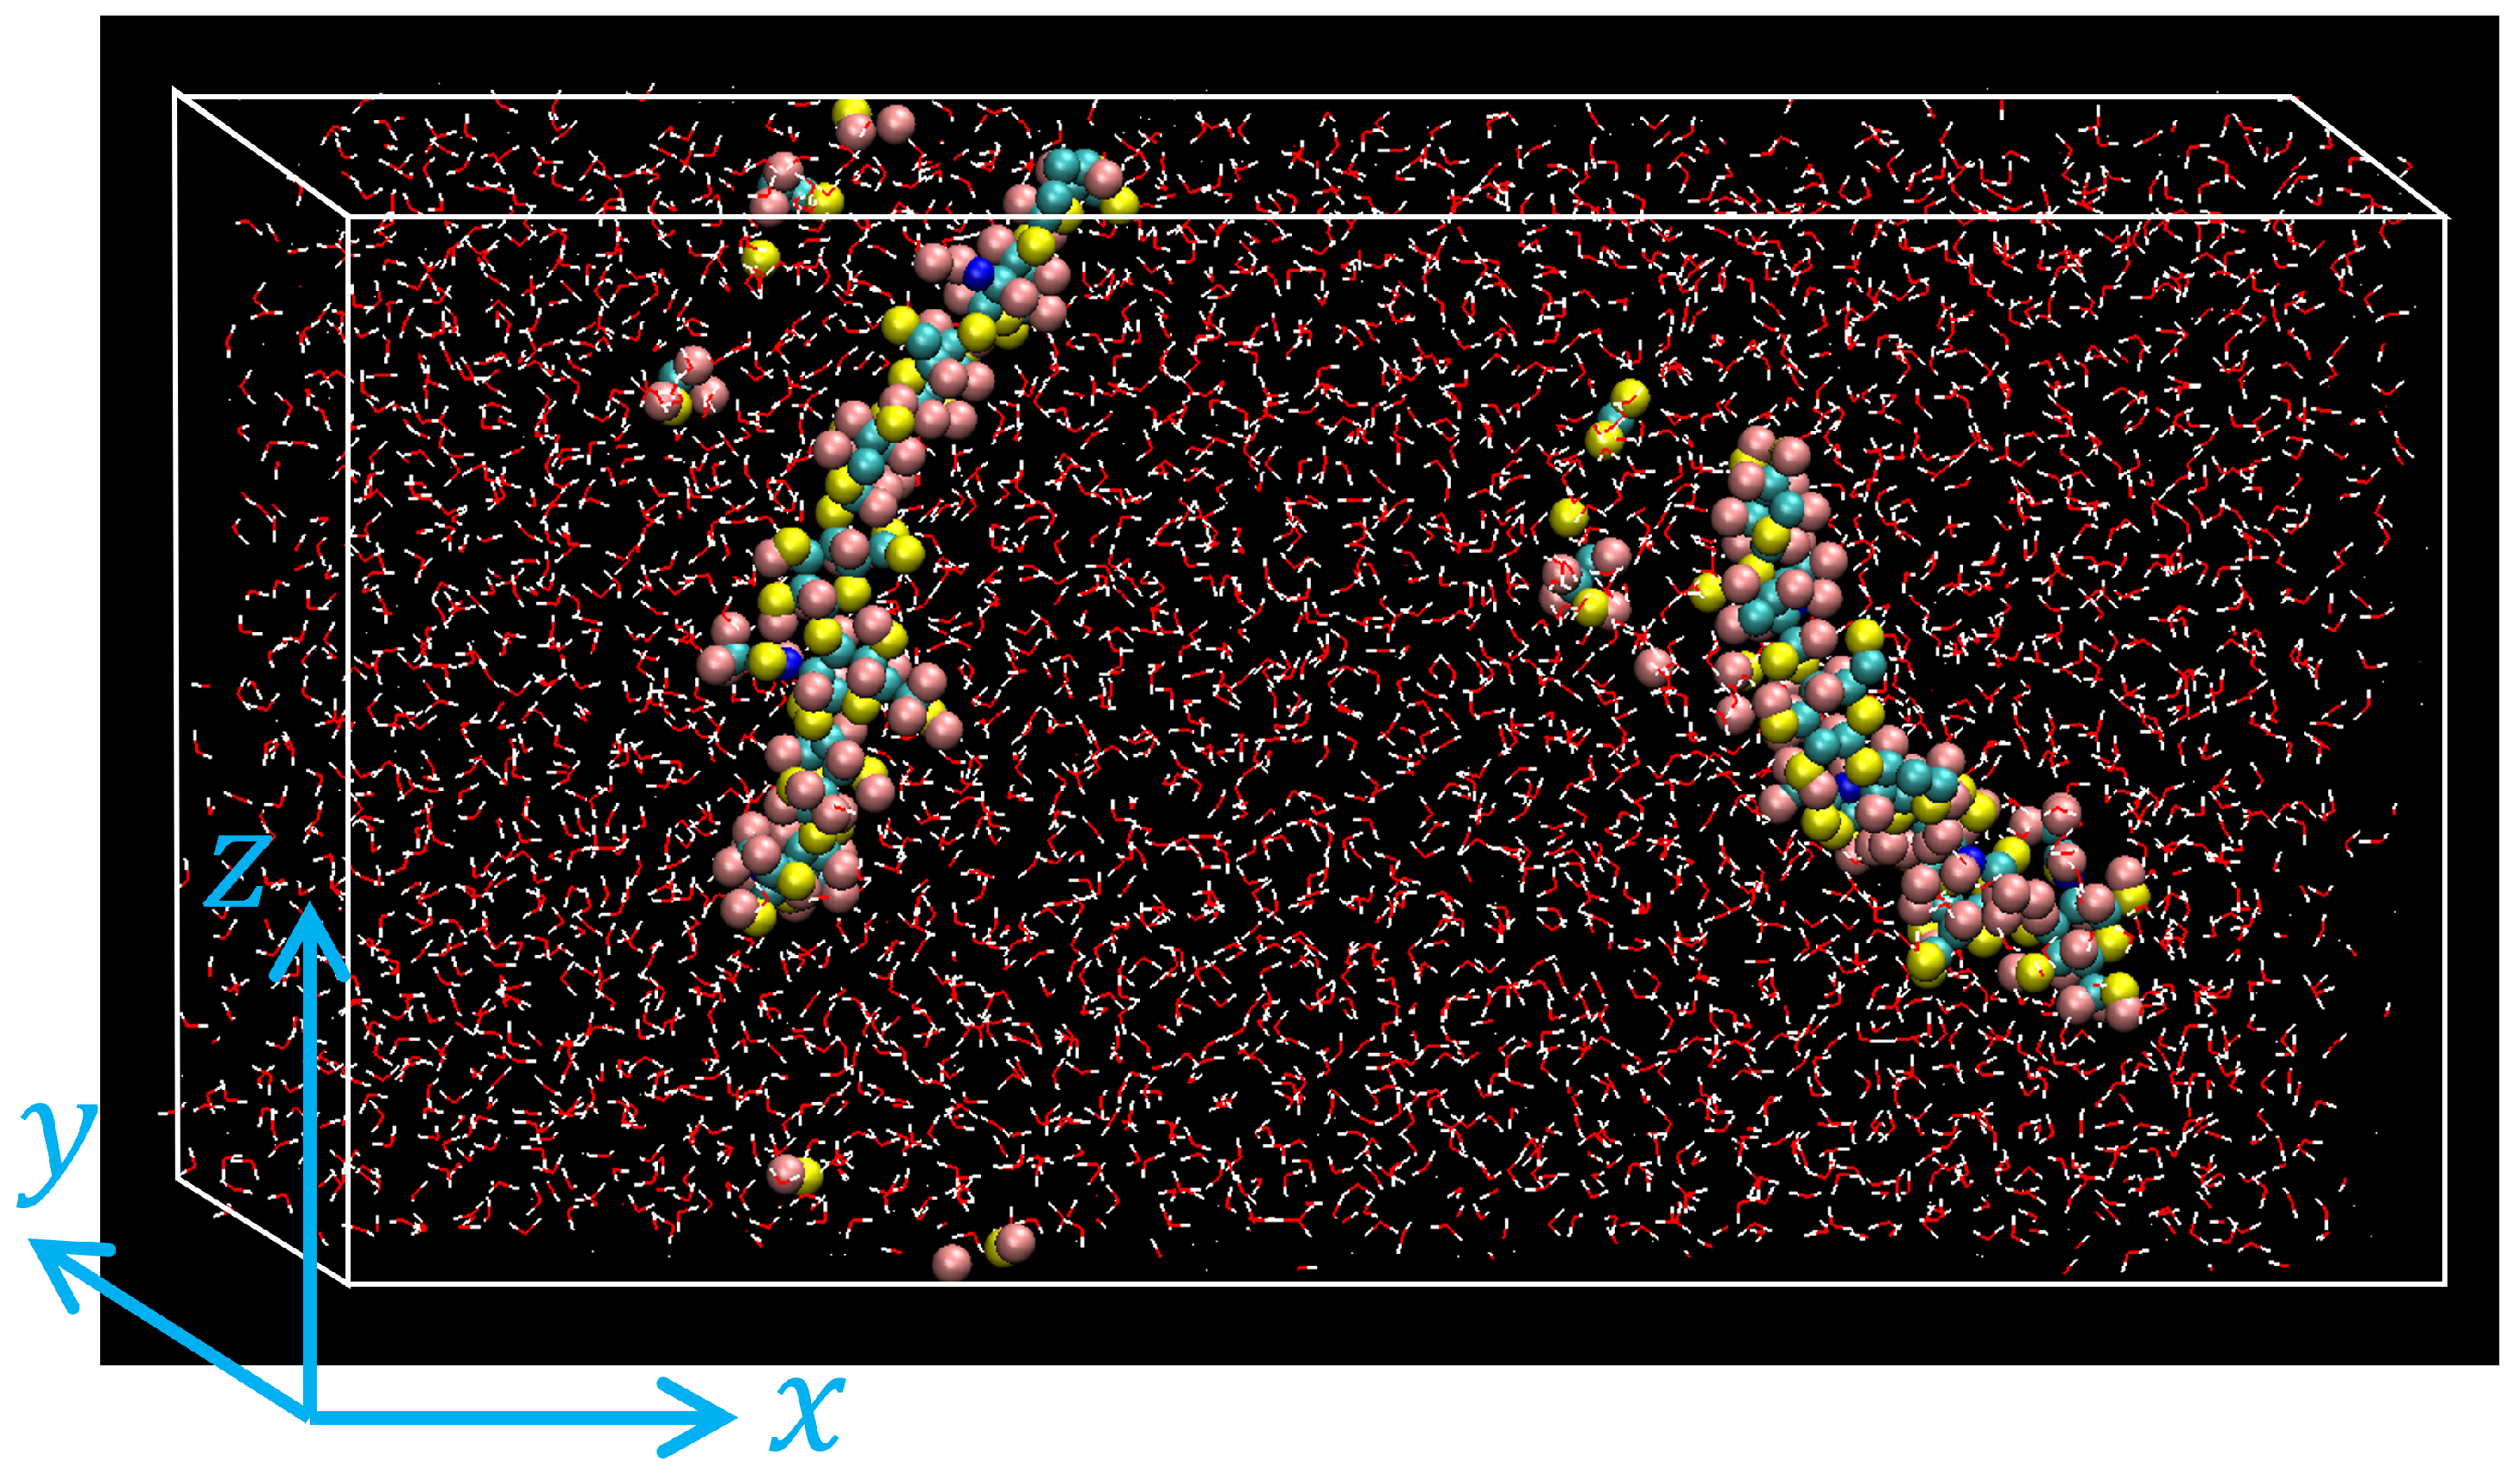
- By executing an MD simulation for 0.25 ns, each system was equilibrated with temperature controlled at K and pressure at atm using the Nosé-Hoover type thermostat/barostat [37]. Periodic boundary conditions were applied along all directions. An example of atomic configurations of the equilibrated HA solution is shown in Figure 2.
- Step 3:
- The main MD simulation with the shear flow was conducted by adopting the Lees-Edwards (LE) boundary condition [38] along z direction, which would realize uniform shear flow along x direction in the steady state. During the shear flow simulation, the temperature was still controlled to be K to suppress the viscous heating. The local temperature was evaluated from the mean kinetic energy of atoms after subtracting the local shear flow speed.
3. Results and Discussion
3.1. Steady State
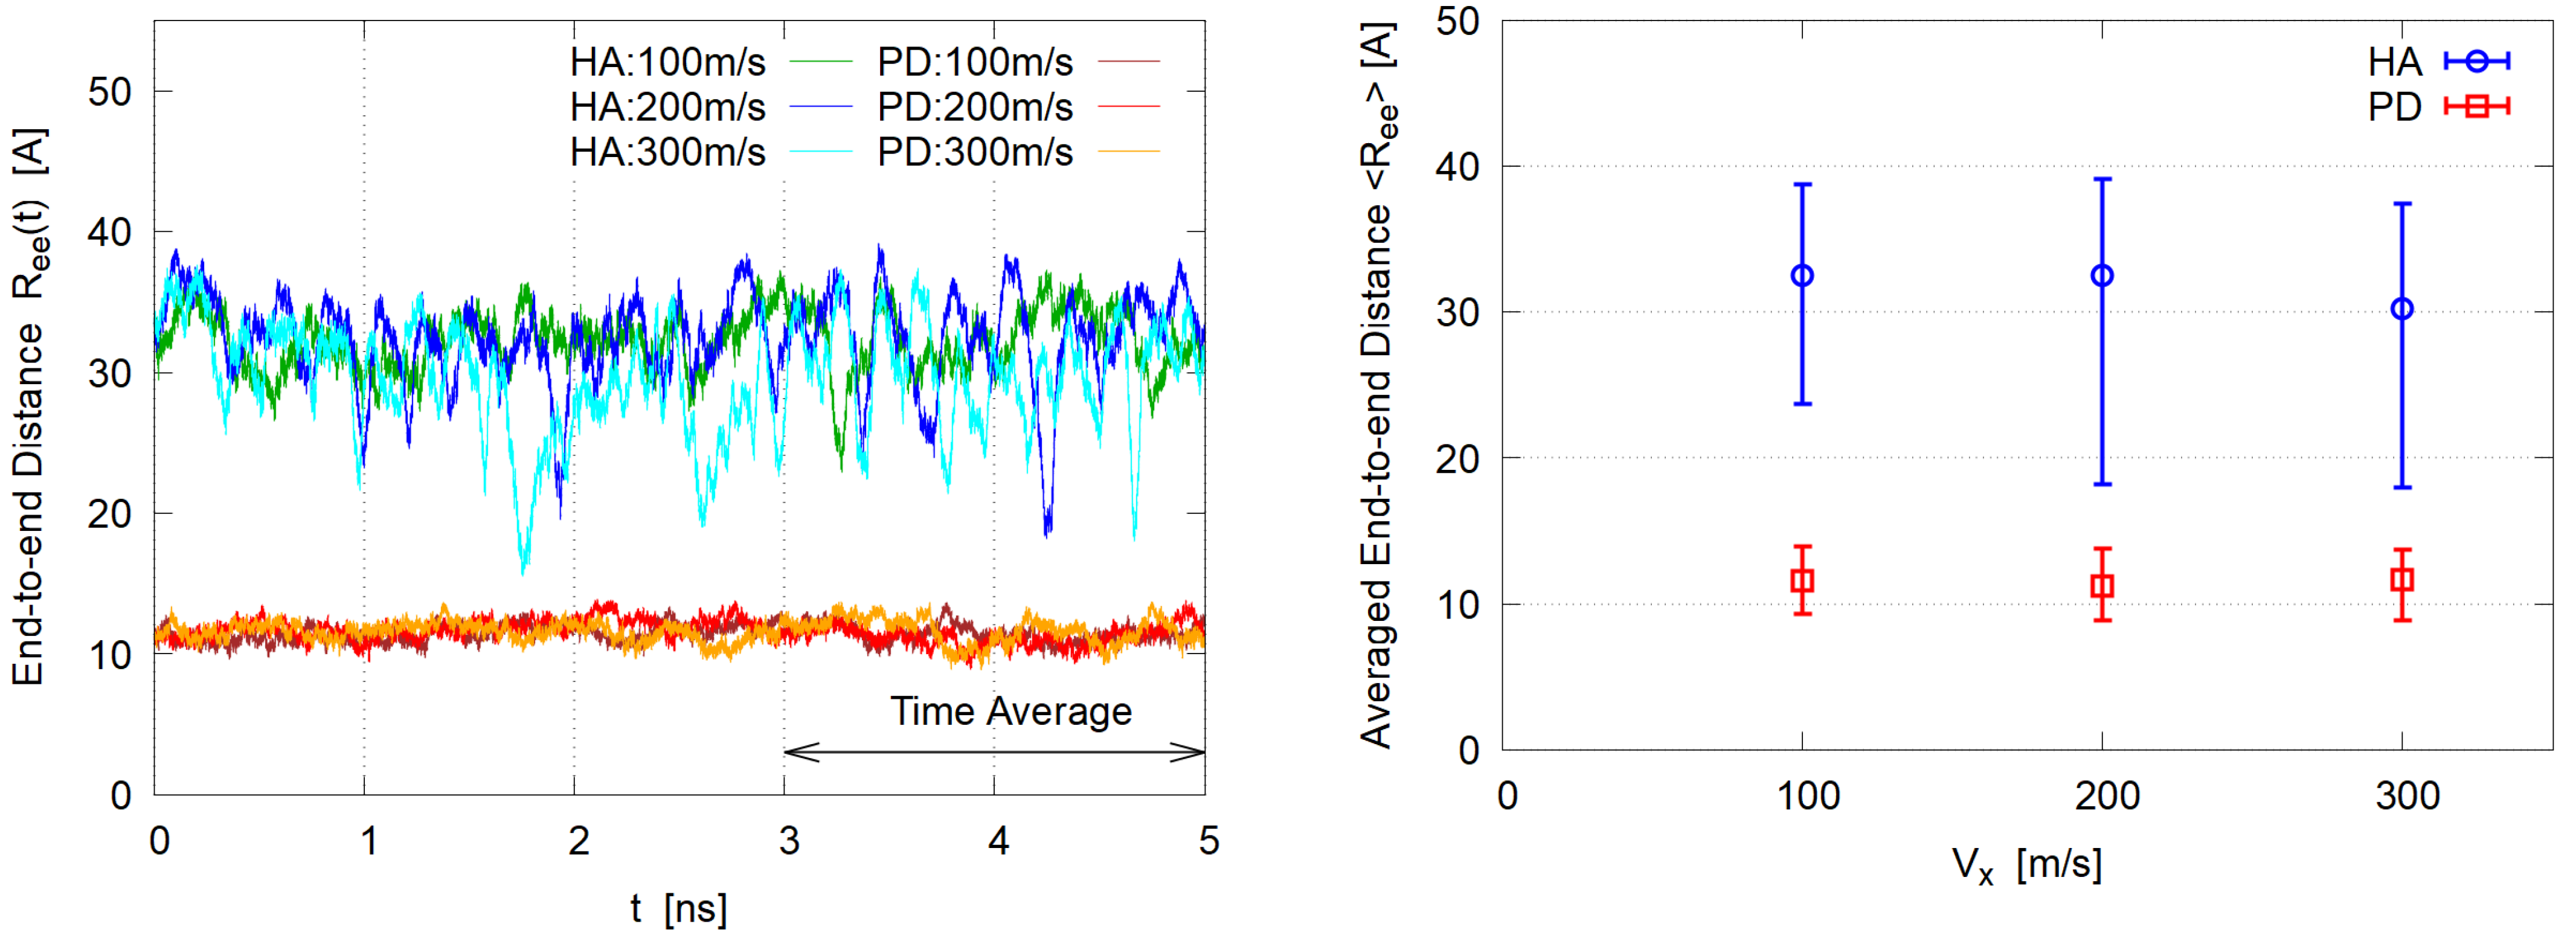
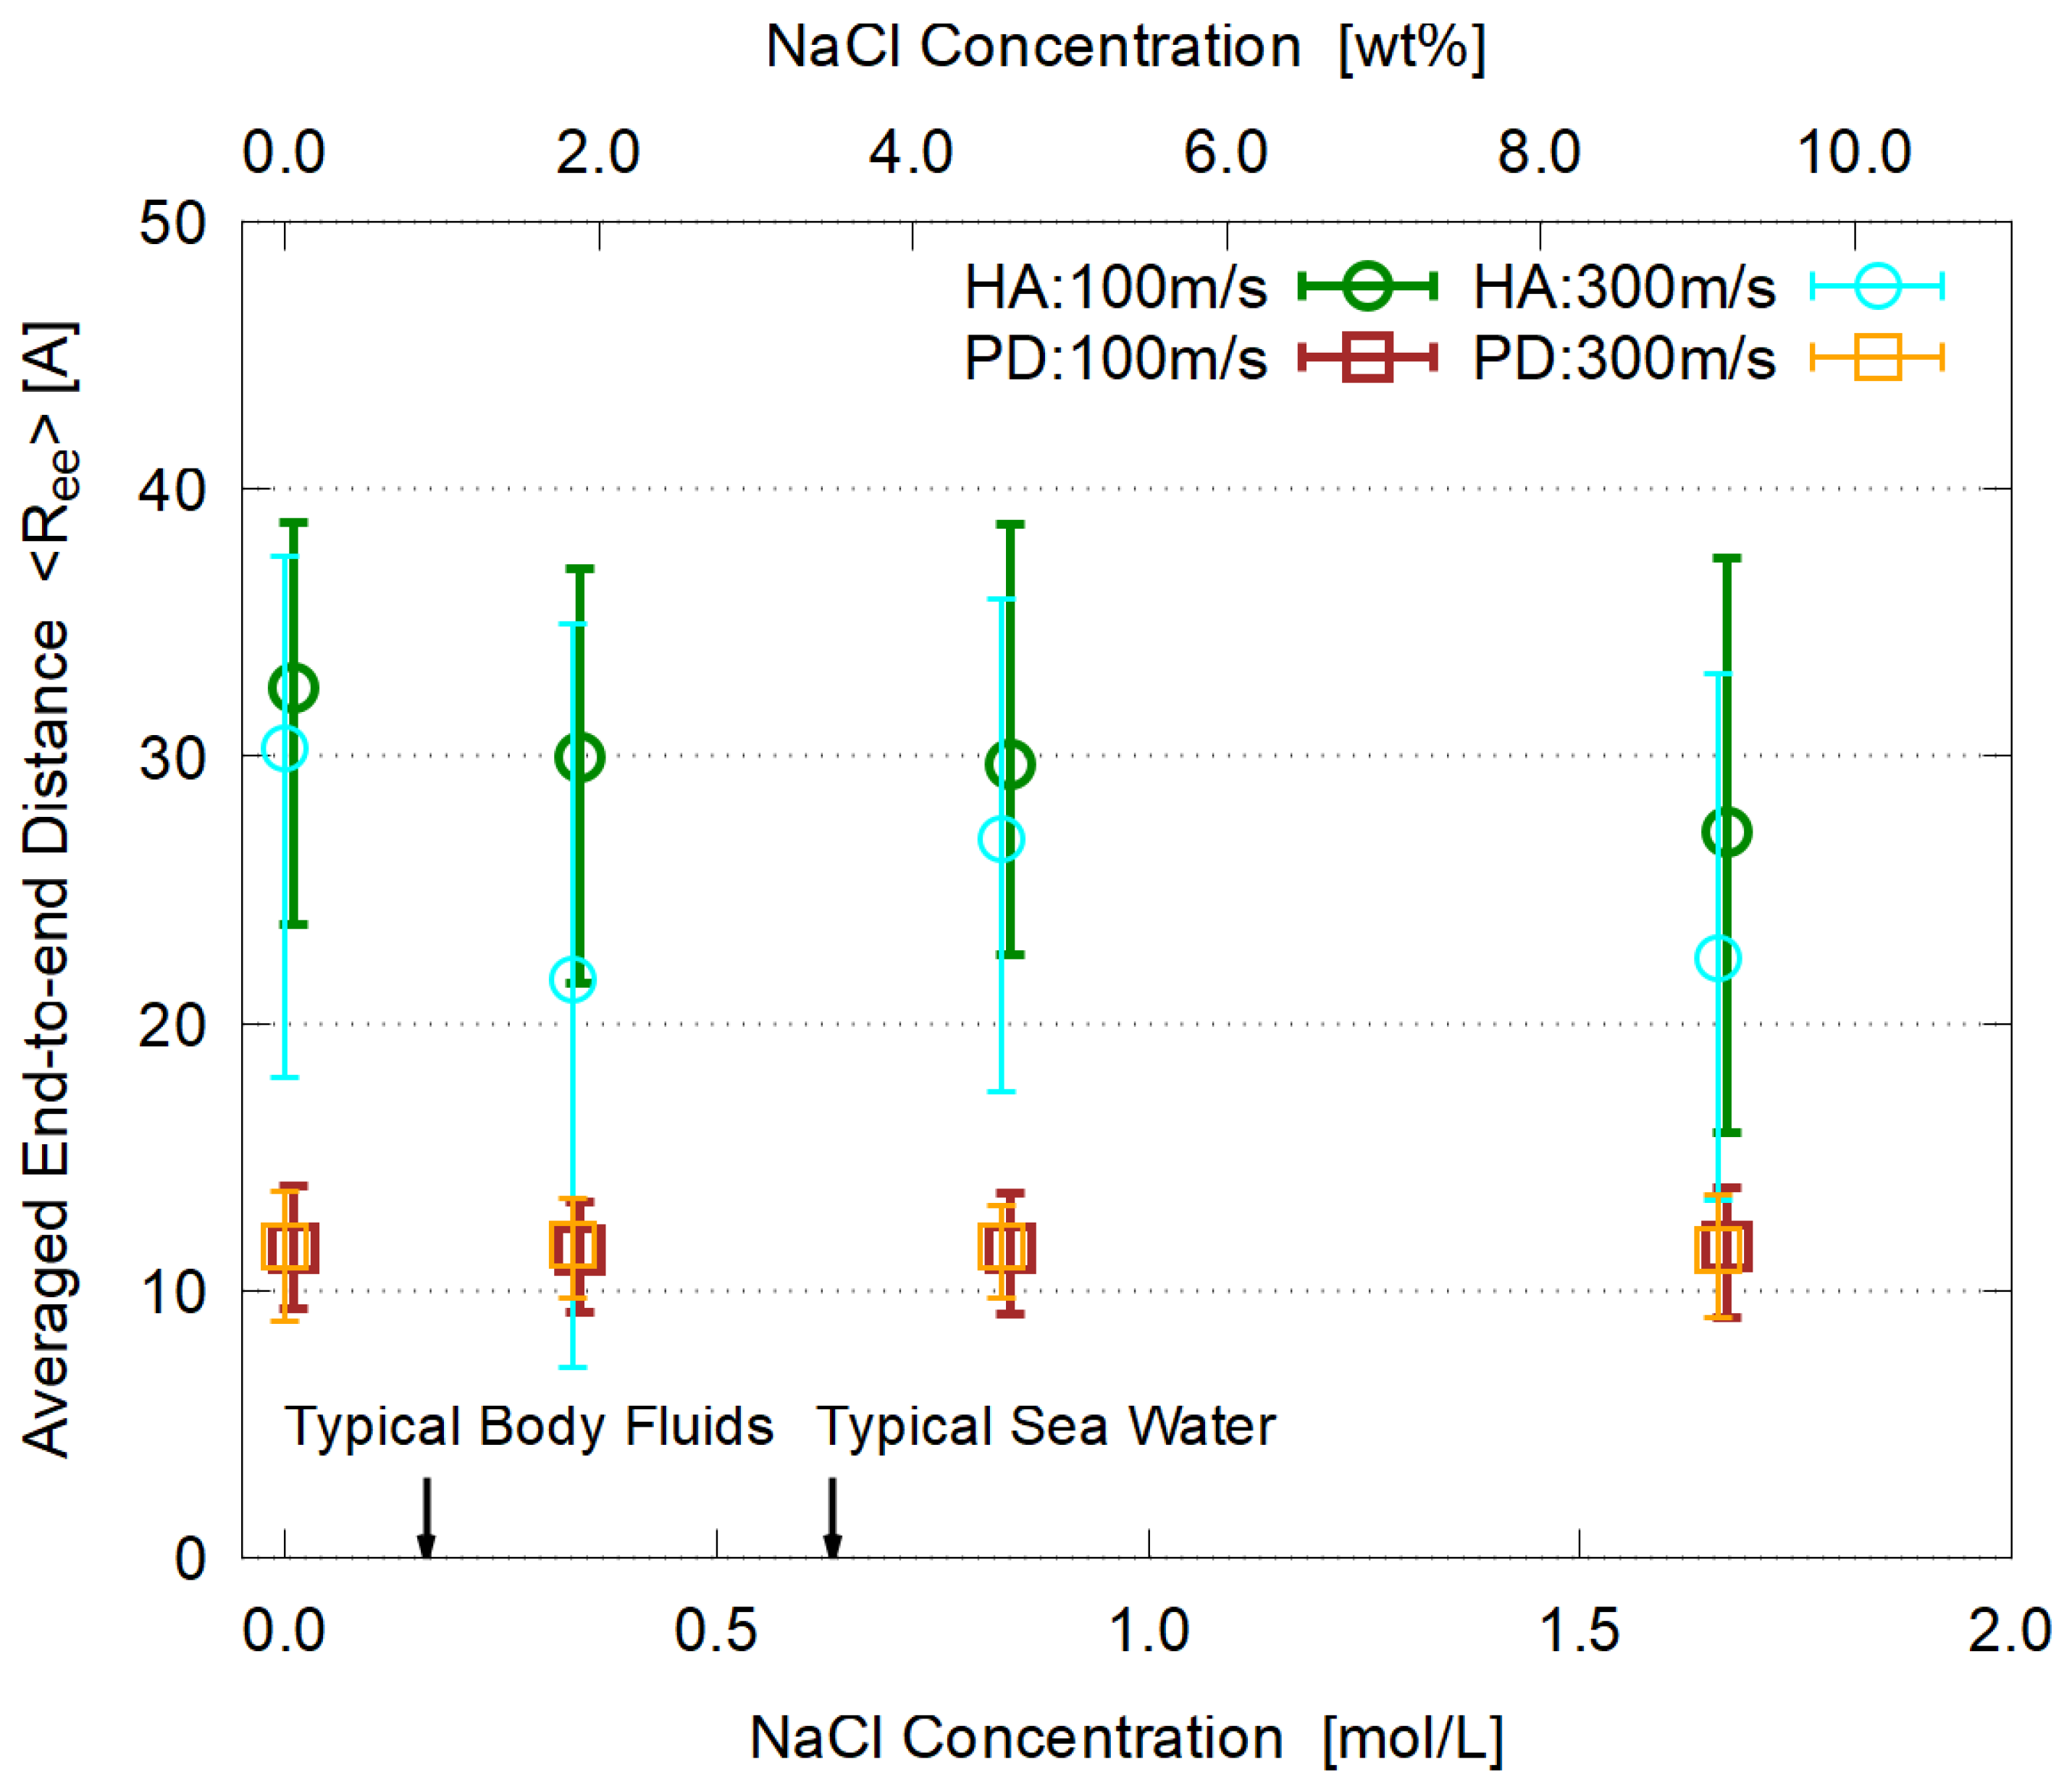
3.2. Polymer Shape
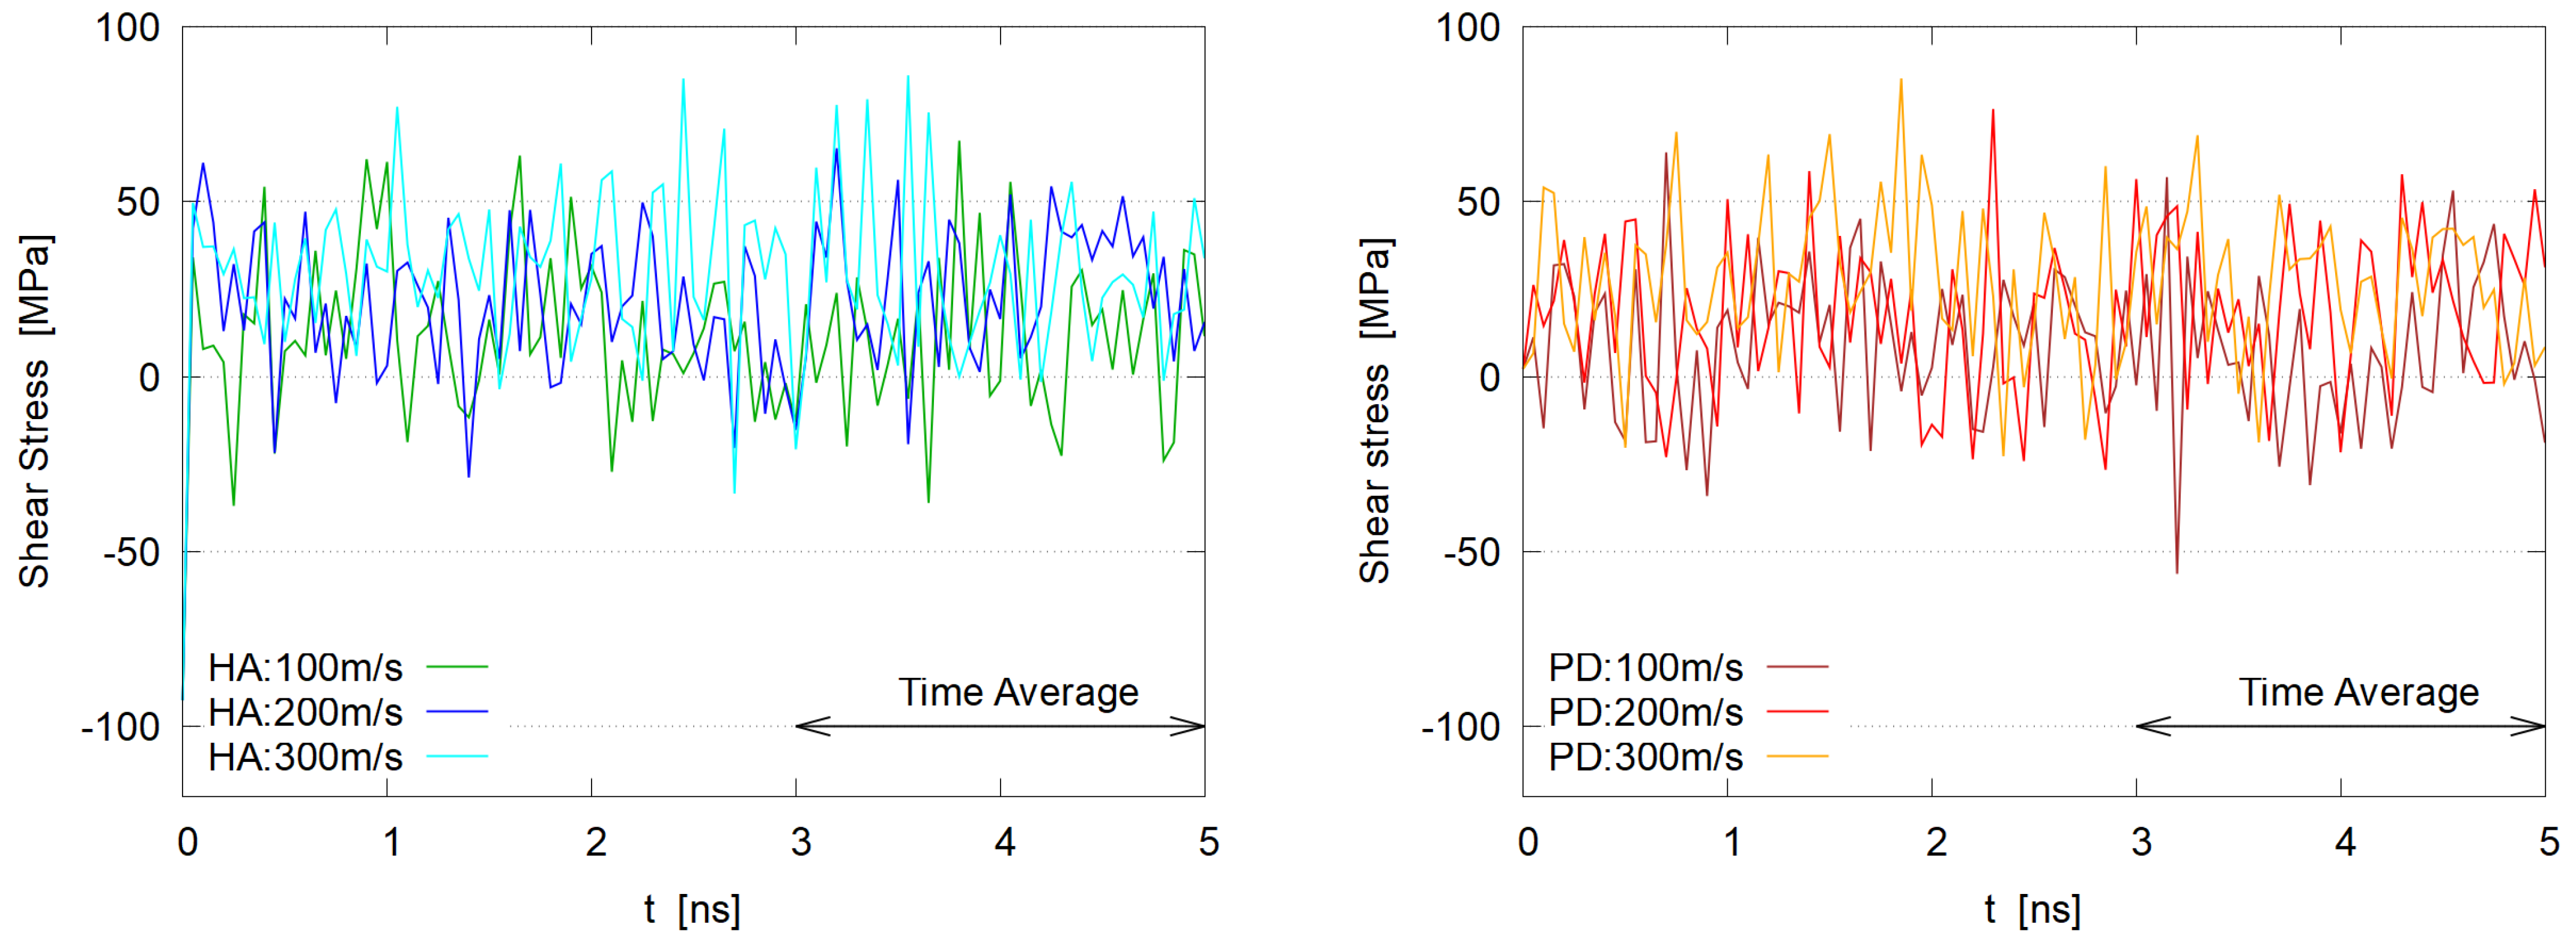
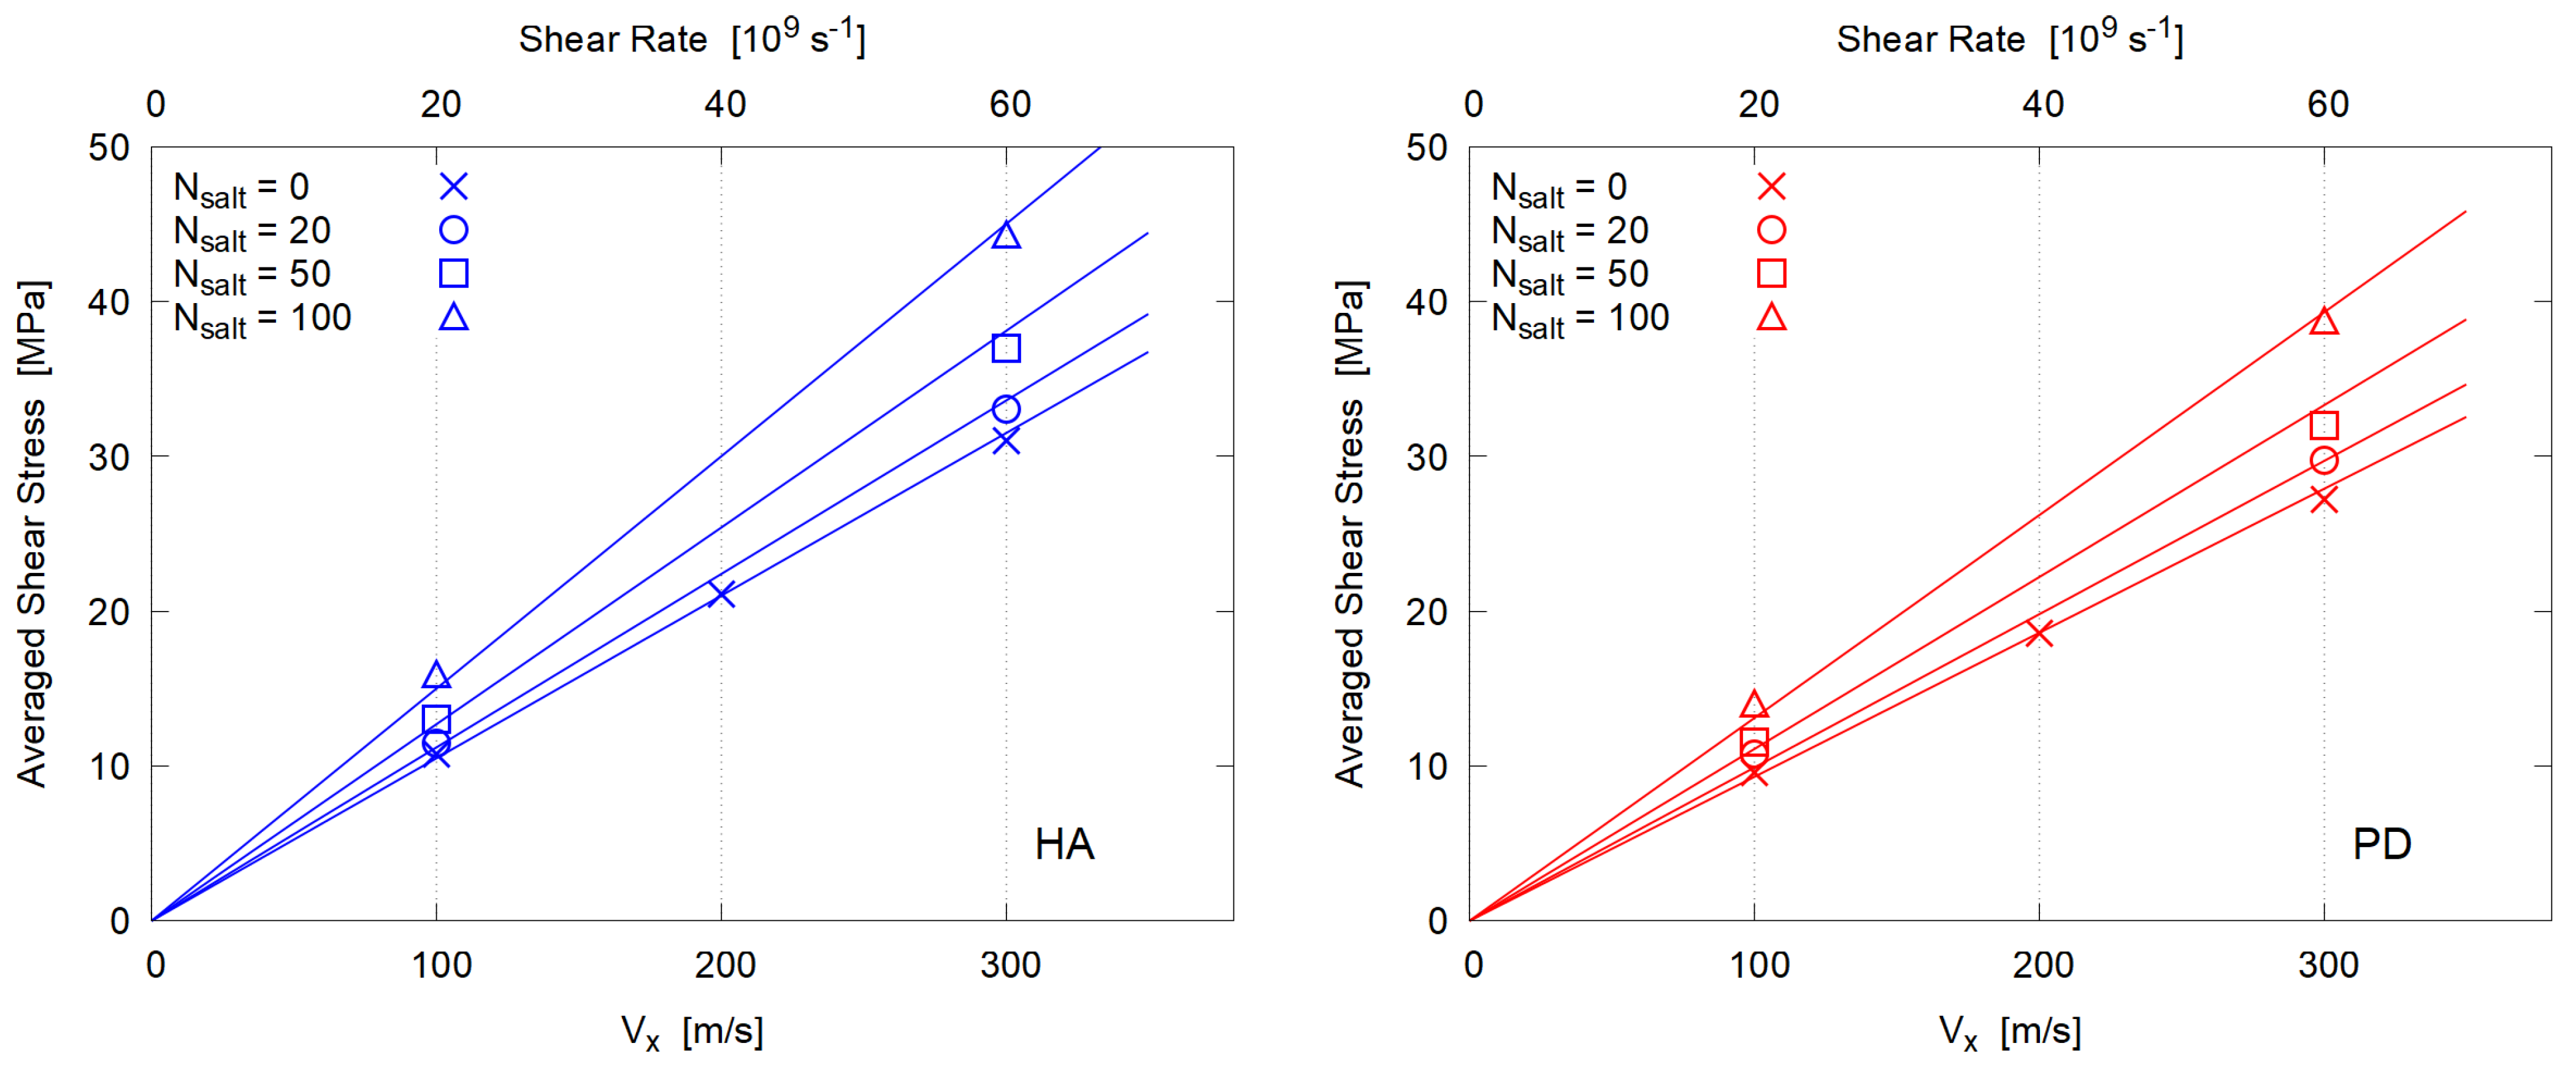
3.3. Viscosity
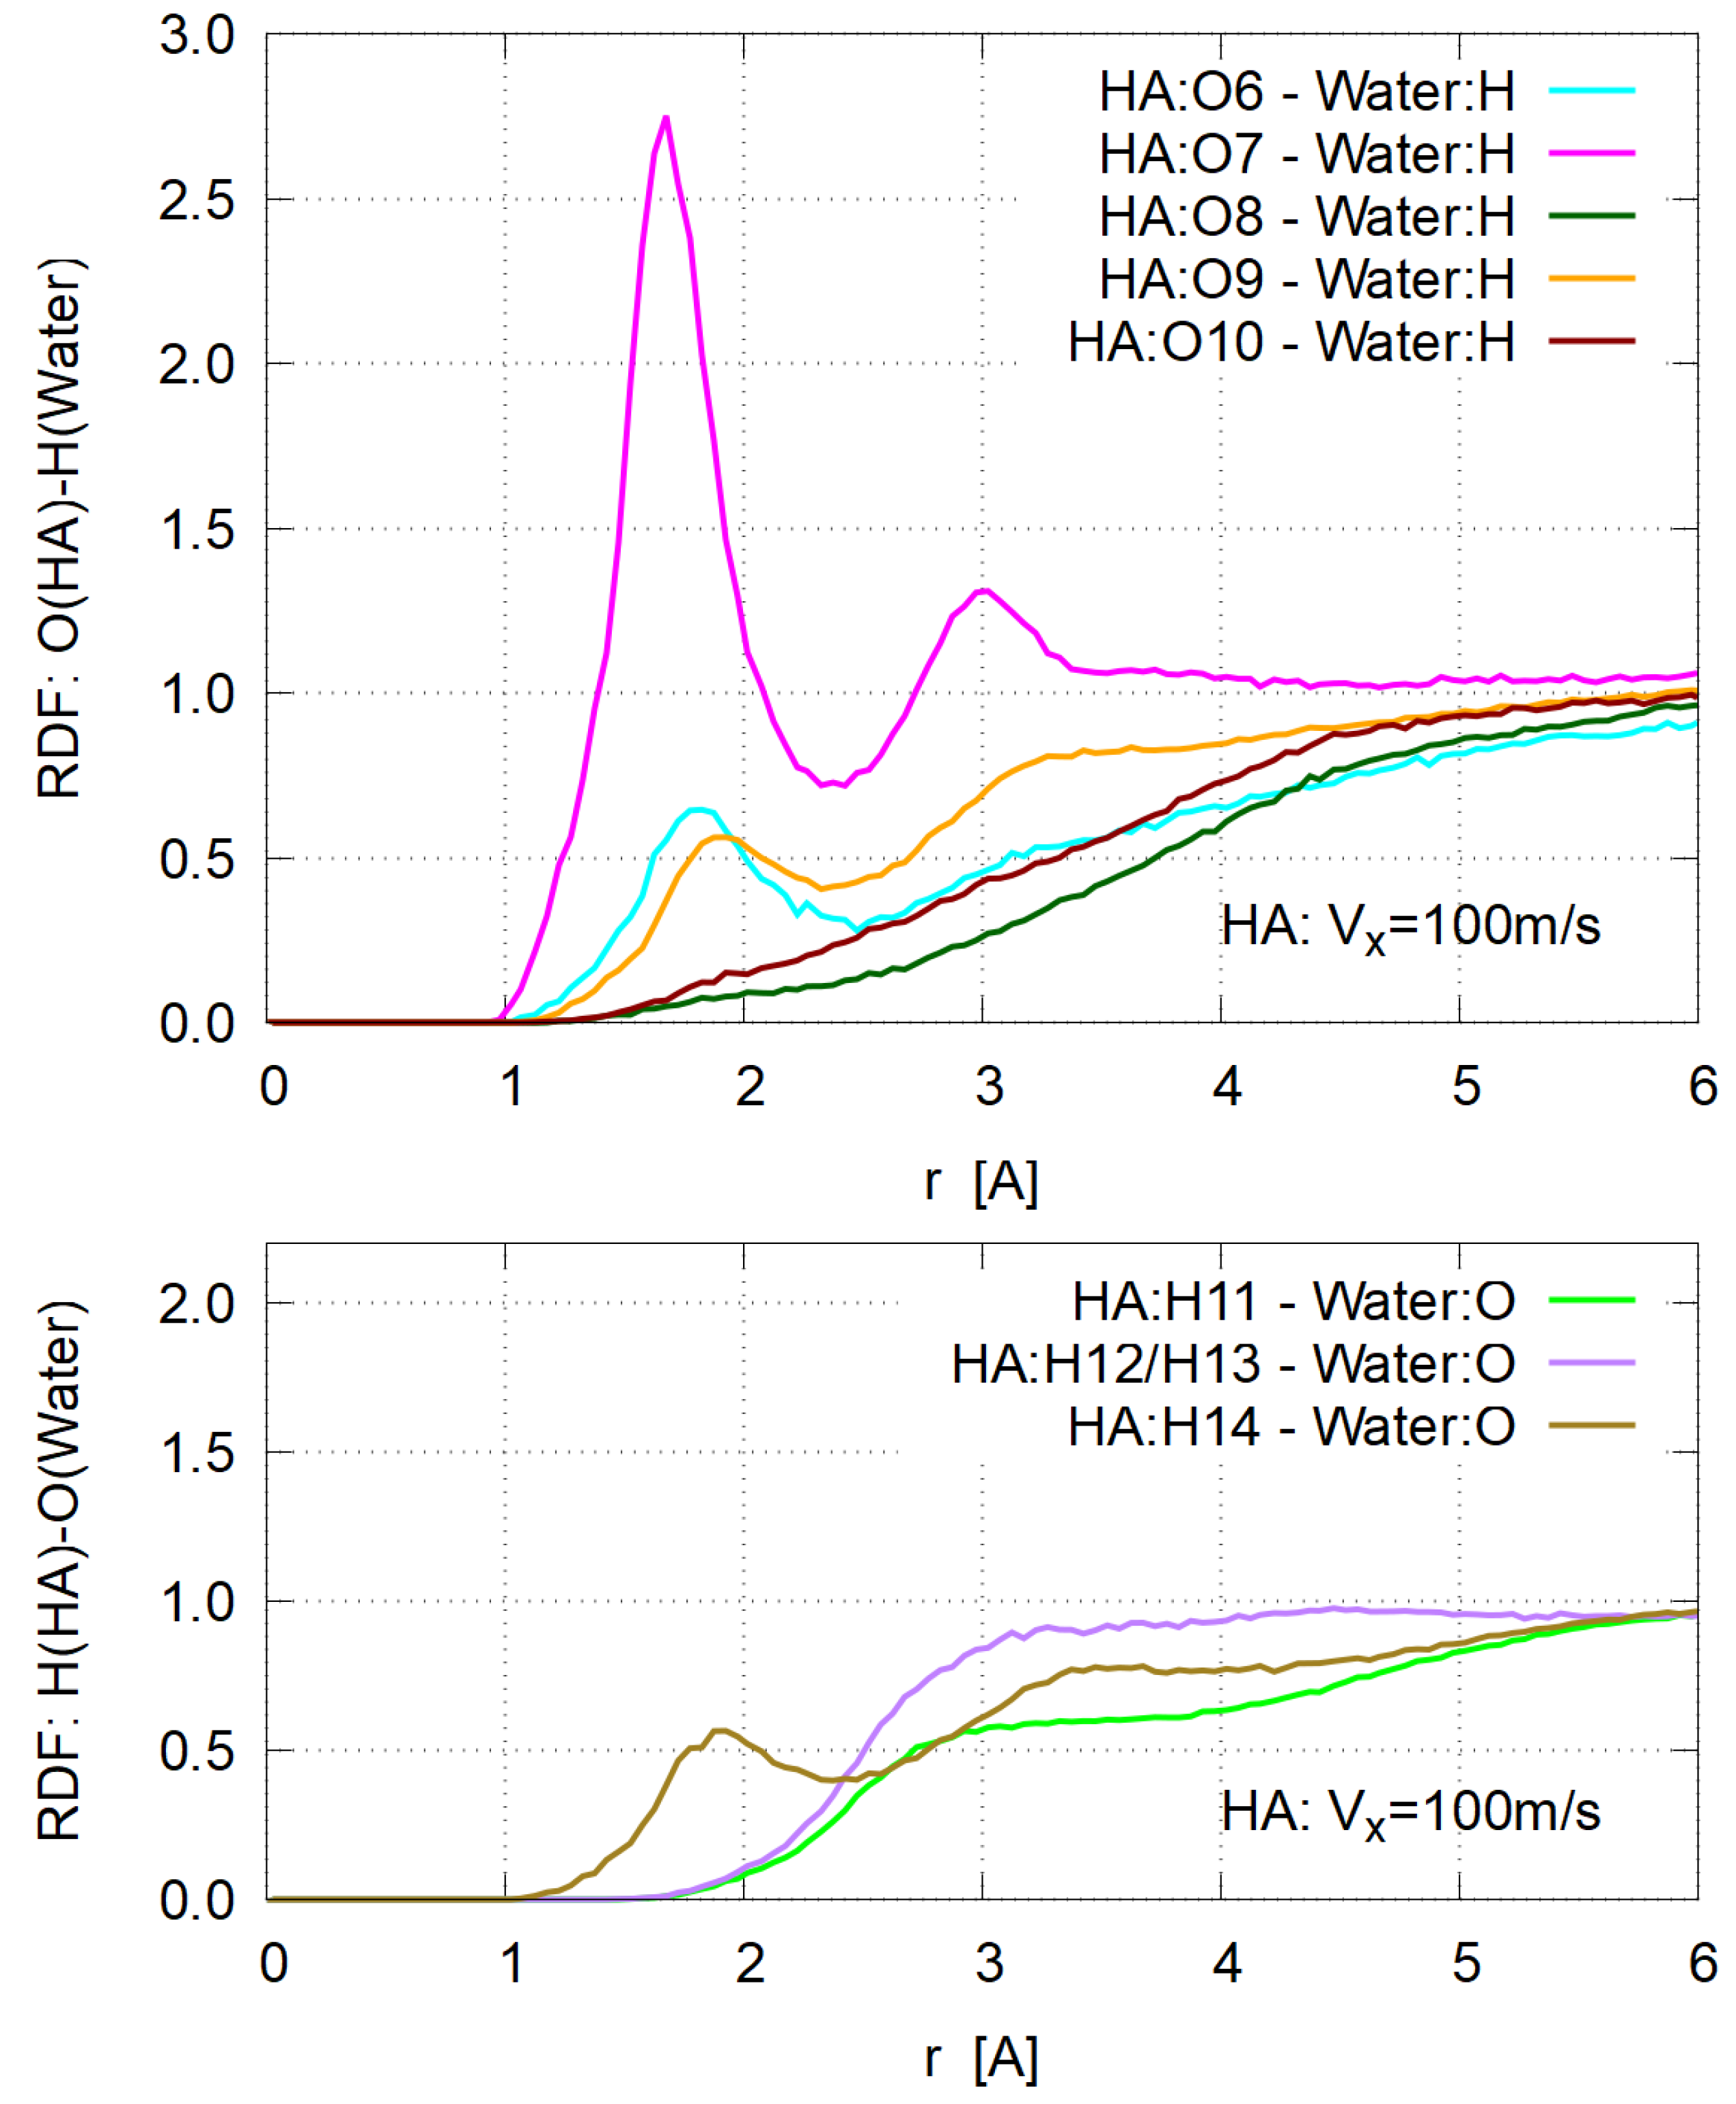
3.4. Hydration
3.5. Dependence on Salt Concentration
4. Conclusions
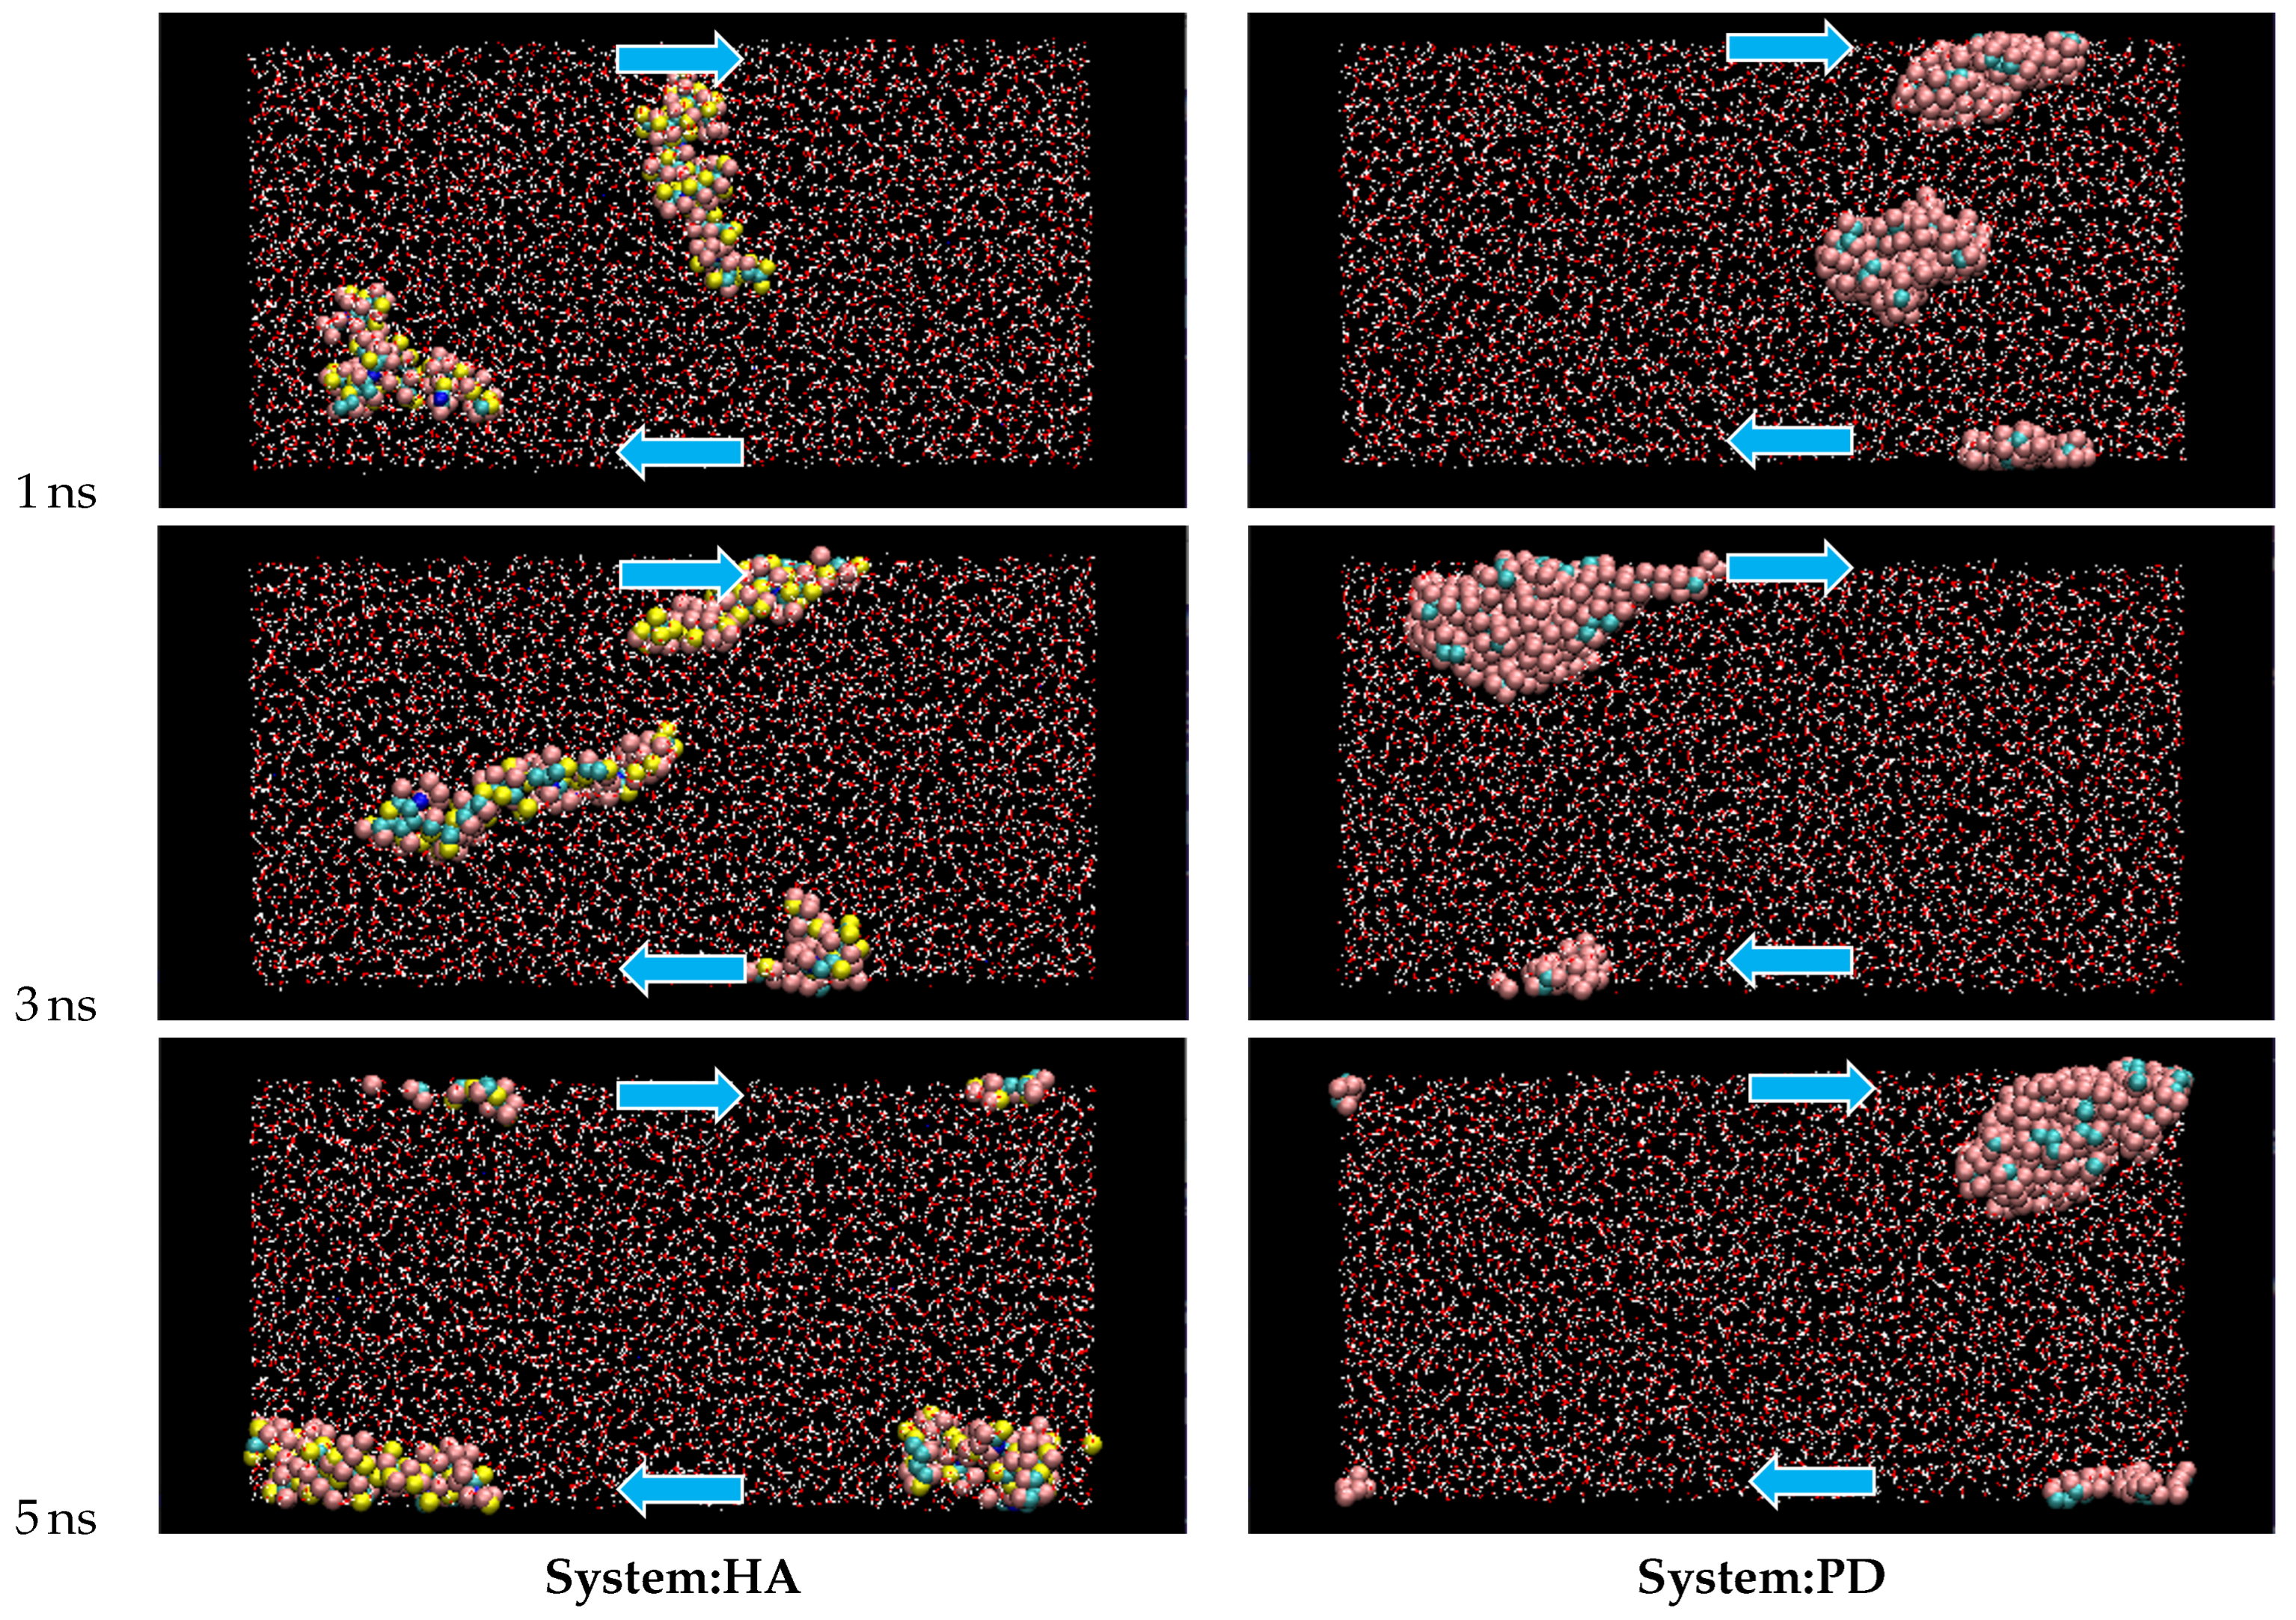
- HA exhibits large shape fluctuations of elongation and contraction during the shear flow.
- PD molecules aggregate and form a single cluster soon after shear is imposed while the dispersion of HA is maintained during the simulation.
- In the steady state, both mixtures of HA and PD essentially behave as Newtonian fluid, i.e., the shear stress is proportional to the shear rate. This is probably due to their low molecular weight and no entanglement.
- The estimated dynamic viscosity of HA is slightly larger than that of PD, due to the strong hydration of HA molecules.
- As for the conventional concept of “hydration” in intrinsic viscosity of biopolymers, its significant (if not all) part can be assigned to water molecules bound to the dissociated groups, such as carboxyl ones.
- The viscosity is enhanced by adding electrolyte (NaCl). Its concentration dependence is similar for HA and PD, supporting the conventional explanation in terms of strong hydration around Na and Cl ions.
Author Contributions
Funding
Institutional Review Board Statement
Informed Consent Statement
Data Availability Statement
Acknowledgments
Conflicts of Interest
References
- Mow, V.C.; Lai, W.M. Mechanics of animal joints. Annu. Rev. Fluid Mech. 1979, 11, 247–288. [Google Scholar] [CrossRef]
- Dowson, D. Bio-tribology. Faraday Discuss. 2012, 156, 9–30. [Google Scholar] [CrossRef] [PubMed]
- Cohen, N.P.; Foster, R.J.; Mow, V.C. Composition and dynamics of articular cartilage: Structure, function, and maintaining healthy state. J. Orthop. Sports Phys. Ther. 1998, 28, 203–215. [Google Scholar] [CrossRef] [PubMed]
- Jay, G.D. Characterization of a bovine synovial fluid lubricating factor. I. Chemical, surface activity and lubricating properties. Connective Tissue Res. 1992, 28, 71–88. [Google Scholar] [CrossRef] [PubMed]
- Murakami, T.; Higaki, H.; Sawae, Y.; Ohtsuki, N.; Moriyama, S.; Nakanishi, Y. Adaptive multimode lubrication in natural synovial joints and artificial joints. Proc. Inst. Mech. Eng. Part H 1998, 212, 23–35. [Google Scholar] [CrossRef] [PubMed]
- Schmidt, T.A.; Gastelum, N.S.; Nguyen, T.; Schumacher, B.L.; Sah, R.L. Boundary lubrication of articular cartilage. Arthritis Rheum. 2007, 56, 882–891. [Google Scholar] [CrossRef] [PubMed]
- Gleghorn, J.P.; Bonassar, L.J. Lubrication mode analysis of articular cartilage using Stribeck surfaces. J. Biomech. 2008, 41, 1910–1918. [Google Scholar] [CrossRef]
- Greene, G.W.; Banquy, X.; Lee, D.W.; Lowrey, D.D.; Yu, J.; Israelachvili, J.N. Adaptive mechanically controlled lubrication mechanism found in articular joints. Proc. Nat. Acad. Sci. USA 2011, 108, 5255–5259. [Google Scholar] [CrossRef]
- Ateshian, G. The role of interstitial fluid pressurization in articular cartilage lubrication. J. Biomech. 2009, 42, 1163–1176. [Google Scholar] [CrossRef]
- Klein, J. Hydration lubrication. Friction 2013, 1, 1–23. [Google Scholar] [CrossRef]
- Schurz, J.; Ribitsch, V. Rheology of synovial fluid. Biorhelogy 1987, 24, 385–399. [Google Scholar] [CrossRef] [PubMed]
- Fam, H.; Bryant, J.T.; Kontopoulou, M. Rheological properties of synovial fluids. Biorheology 2007, 44, 59–74. [Google Scholar] [PubMed]
- Fam, H.; Kontopoulou, M.; Bryant, J.T. Effect of concentration and molecular weight on the rheology of hyaluronic acid/bovine calf serum solutions. Biorheology 2009, 46, 31–43. [Google Scholar] [CrossRef] [PubMed]
- Burris, D.L.; Moore, A.C. Cartilage and joint lubrication: New insights into the role of hydrodynamics. Biotribology 2017, 12, 8–14. [Google Scholar] [CrossRef]
- Jay, G.D.; Lane, B.P.; Sokoloff, L. Characterization of a bovine synovial fluid lubricating factor. III. The interaction with hyaluronic acid. Connective Tissue Res. 1992, 28, 245–255. [Google Scholar] [CrossRef]
- Schurz, J. Rheology of synovial fluids and substitute. J. Macromol. Sci. 1996, A33, 1249–1262. [Google Scholar] [CrossRef]
- Kogan, G.; Šoltés, L.; Stern, R.; Gemeiner, P. Hyaluronic acid: A natural biopolymer with a broad range of biomedical and industrial applications. Biotechnol. Lett. 2007, 29, 17–25. [Google Scholar] [CrossRef]
- Fakhari, A.; Berkland, C. Applications and emerging trends of hyaluronic acid in tissue engineering, as a dermal filler, and in osteoarthritis treatment. Acta Biomater. 2013, 9, 7081–7092. [Google Scholar] [CrossRef]
- Dicker, K.T.; Gurski, L.A.; Pradhan-Bhatt, S.; Witt, R.L.; Farach-Carson, M.C.; Jia, X. Hyaluronan: A simple polysaccharide with diverse biological functions. Acta Biomater. 2014, 10, 1558–1570. [Google Scholar] [CrossRef] [PubMed]
- Maheu, E.; Bannuru, R.R.; Herrero-Beaumont, G.; Allali, F.; Bard, H.; Migliore, A. Why we should definitely include intra-articular hyaluronic acid as a therapeutic option in the management of knee osteoarthritis: Results of an extensive critical literature review. Semin. Arthritis Rheum. 2019, 48, 563–572. [Google Scholar] [CrossRef]
- Snetkov, P.; Zakharova, K.; Morozkinia, S.; Olekhnovich, R.; Uspenskaya, M. Hyaluronic acid: The influence of molecular weight on structural, physical, physico-chemical, and degradable properties of biopolymer. Polymers 2020, 12, 1800. [Google Scholar] [CrossRef] [PubMed]
- Kienle, S.; Boettcher, K.; Wiegleb, L.; Urban, J.; Burgkart, R.; Lieleg, O.; Hugel, T. Comparison of friction and wear of articular cartilage on different length scales. J. Biomech. 2015, 48, 3052–3058. [Google Scholar] [CrossRef] [PubMed]
- Matsumoto, M.; Sano, K.; Inoue, K. Mesoscale Modelling for Lubrication Mechanism of Human Joints. Computer Design for New Drugs and Materials ed. by K. Kholmurodov (Nova Science Pub., U.S.A., 2017) Chapter 3. Available online: https://novapublishers.com/shop/computer-design-for-new-drugs-and-materials-molecular-dynamics-of-nanoscale-phenomena/ (accessed on 16 July 2022).
- Ide, M.; Matsumoto, M. Tribology of polymer brush: Microscale modelling and simulation. Mol. Simul. 2015, 41, 942–947. [Google Scholar] [CrossRef]
- Kajinami, N.; Matsumoto, M. Polymer brush in articular cartilage lubrication: Nanoscale modelling and simulation. Biophys. Physicobiol. 2019, 16, 466–472. [Google Scholar] [CrossRef]
- Siódmiak, J.; Bełdowski, P.; Augé, W.K., II; Ledziński, D.; Śmigiel, S.; Gadomski, A. Molecular dynamic analysis of hyaluronic acid and phospholipid interaction in tribological surgical adjuvant design for osteoarthritis. Molecules 2017, 22, 1436. [Google Scholar] [CrossRef]
- LAMMPS Webpage. Available online: https://www.lammps.org/ (accessed on 21 July 2022).
- VMD Webpage. Available online: https://www.ks.uiuc.edu/Research/vmd/ (accessed on 21 July 2022).
- CGenFF Webpage. Available online: https://cgenff.umaryland.edu/ (accessed on 8 March 2022).
- Vanommeslaeghe, K.; Hatcher, E.; Acharya, C.; Kundu, S.; Zhong, S.; Shim, J.; Darian, E.; Guvench, O.; Lopes, P.; Vorobyov, I.; et al. CHARMM general force field: A force field for drug-like molecules compatible with the CHARMM all-atom additive biological force fields. J. Comput. Chem. 2009, 31, 671–690. [Google Scholar] [CrossRef]
- Yu, W.; He, X.; Vanommeslaeghe, K.; MacKerell, A.D., Jr. Extension of the CHARMM general force field to sulfonyl-containing compounds and its utility in biomolecular simulations. J. Comput. Chem. 2012, 33, 2451–2468. [Google Scholar] [CrossRef]
- Vanommeslaeghe, K.; MacKerell, A.D., Jr. Automation of the CHARMM general force field (CGenFF) I: Bond perception and atom typing. J. Chem. Inf. Model. 2012, 52, 3144–3154. [Google Scholar] [CrossRef]
- Vanommeslaeghe, K.; Prabhu Raman, E.; MacKerell, A.D., Jr. Automation of the CHARMM general force field (CGenFF) II: Assignment of bonded parameters and partial atomic charges. J. Chem. Inf. Model. 2012, 52, 3155–3168. [Google Scholar] [CrossRef]
- Joung, I.S.; Cheatham, T.E., III. Determination of alkali and halide monovalent ion parameters for use in explicitly solvated biomolecular simulations. J. Phys. Chem. B 2008, 112, 9020–9041. [Google Scholar] [CrossRef]
- Vorobyov, I.; Anisimov, V.M.; Greene, S.; Venable, R.M.; Moser, A.; Pastor, R.W.; MacKerell, A.D., Jr. Additive and classical Drude polarizable force fields for linear and cyclic ethers. J. Chem. Theory Comput. 2007, 3, 1120–1133. [Google Scholar] [CrossRef] [PubMed]
- Jorgensen, W.L.; Chandrasekhar, J.; Madura, J.D.; Impey, R.W.; Klein, M.L. Comparison of simple potential functions for simulating liquid water. J. Chem. Phys. 1983, 79, 926–935. [Google Scholar] [CrossRef]
- Martyna, G.J.; Tuckerman, M.E.; Tobias, D.J.; Klein, M.L. Explicit reversible integrators for extended systems dynamics. Mol. Phys. 1996, 87, 1117–1157. [Google Scholar] [CrossRef]
- Lees, A.W.; Edwards, S.F. The computer study of transport processes under extreme conditions. J. Phys. C Solid State Phys. 1972, 5, 1921–1929. [Google Scholar] [CrossRef]
- Mizukoshi, N.; Norisuye, T. Small-angle X-ray scattering from sodium hyaluronate in aqueous sodium chloride. Polym. Bull. 1998, 40, 555–562. [Google Scholar] [CrossRef]
- Kestin, J.; Sokolov, M.; Wakeham, W.A. Viscosity of liquid water in the range −8 °C to 150 °C. J. Phys. Chem. Ref. Data 1978, 7, 941–948. [Google Scholar] [CrossRef]
- Huber, M.L.; Perkins, R.A.; Laesecke, A.; Friend, D.G.; Sengers, J.V.; Assael, M.J.; Metaxa, I.N.; Vogel, E.; Mares, R.; Miyagawa, K. New international formulation for the viscosity of H2O. J. Phys. Chem. Ref. Data 2009, 38, 101–125. [Google Scholar] [CrossRef]
- González, M.A.; Abascal, J.L.F. The shear viscosity of rigid water models. J. Chem. Phys. 2010, 132, 096101. [Google Scholar] [CrossRef]
- Dahl, L.B.; Dahl, M.; Engström-Laurent, A.; Granath, K. Concentration and molecular weight of sodium hyaluronate in synovial fluid from patients with rheumatoid arthritis and other arthropathies. Ann. Rheum. Dis. 1985, 44, 817–822. [Google Scholar] [CrossRef]
- Cressely, R.; Hartmann, V. Rheological behaviour and shear thickening exhibited by aqueous CTAB micellar solution. Eur. Phys. J. B 1998, 6, 57–62. [Google Scholar] [CrossRef]
- Harding, S.E. The intrinsic viscosity of biological macromolecules. Progress in measurement, interpretation and application to structure in dilute solution. Prog. Biophys. Mol. Biol. 1997, 68, 207–262. [Google Scholar] [CrossRef]
- Lee, J.; Tripathi, A. Intrinsic viscosity of polymers and biopolymers measured by microchip. Anal. Chem. 2005, 77, 7137–7147. [Google Scholar] [CrossRef] [PubMed]
- Tsortos, A.; Papadakis, G.; Gizeli, E. The intrinsic viscosity of linear DNA. Biopolymers 2011, 95, 824–832. [Google Scholar] [CrossRef] [PubMed]
- Yang, J.T. The viscosity of macromolecules in relation to molecular conformation. Adv. Protein Chem. 1961, 16, 323–400. [Google Scholar] [CrossRef] [PubMed]
- García de la Torre, J. Hydration from hydrodynamics. General considerations and applications of bead modelling to globular proteins. Biophys. Chem. 2001, 93, 159–170. [Google Scholar] [CrossRef]
- Durchschlag, H.; Zipper, P. Modeling the hydration of proteins: Prediction of structural and hydrodynamic parameters from X-ray diffraction and scattering data. Eur. Biophys. J. 2003, 32, 487–502. [Google Scholar] [CrossRef]
- Zhang, H.-L.; Han, S.-J. Viscosity and density of water + sodium chloride + potassium chloride solutions at 298.15 K. J. Chem. Eng. Data 1996, 41, 516–520. [Google Scholar] [CrossRef]
- Dordick, R.; Korson, L.; Drost-Hansesn, W. High-precision viscosity measurements I. Aqueous solutions of alkali chlorides. J. Colloid Interface Sci. 1979, 72, 206–214. [Google Scholar] [CrossRef]
- Horkay, F.; Hecht, A.M.; Rochas, C.; Basser, P.J.; Geissler, E. Anomalous small angle x-ray scattering determination of ion distribution around a polyelectrolyte biopolymer in salt solution. J. Chem. Phys. 2006, 125, 234904. [Google Scholar] [CrossRef]
- Horkay, F.; Basser, P.J.; Londono, D.J.; Hecht, A.M.; Geissler, E. Ions in hyaluronic acid solutions. J. Chem. Phys. 2009, 131, 184902. [Google Scholar] [CrossRef]
- Wieland, D.C.F.; Degen, P.; Zander, T.; Gayer, S.; Raj, A.; An, J.; Dėdinaitė, A.; Claesson, P.; Willumeit-Römer, R. Structure of DPPC-hyaluronan interfacial layers—Effects of molecular weight and ion composition. Soft Matter 2016, 12, 729–740. [Google Scholar] [CrossRef] [PubMed]
- Zander, T.; Wieland, D.C.F.; Raj, A.; Salmen, P.; Dogan, S.; Dėdinaitė, A.; Garamus, V.M.; Schreyer, A.; Claesson, P.M.; Willumeit-Römer, R. Influence of high hydrostatic pressure on solid supported DPPC bilayers with hyaluronan in the presence of Ca2+ ions. Soft Matter 2019, 15, 7295–7304. [Google Scholar] [CrossRef] [PubMed]


| Element | Atom Type | Charge [e] | Element | Atom Type | Charge [e] |
|---|---|---|---|---|---|
| Carbon | C1 | 0.545 | Hydrogen | H11 | 0.090 |
| C2 | 0.579 | H12 | 0.090 | ||
| C3 (*) | −0.046∼0.291 | H13 | 0.090 | ||
| C4 | 0.100 | H14 (*) | 0.244∼0.419 | ||
| C5 | −0.269 | H15 | 0.090 | ||
| Oxygen | O6 | −0.507 | Nitrogen | N16 | −0.405 |
| O7 | −0.760 | ||||
| O8 (*) | −0.313∼−0.307 | ||||
| O9 (*) | −0.670∼−0.647 | ||||
| O10 (*) | −0.320∼−0.284 |
| System:HA | System:PD | ||
|---|---|---|---|
| Solute | Molecular formula | ||
| Number of atoms | 187 | 47 | |
| Molecular weight | 1515.3 | 212.4 | |
| Number of molecules | 2 | 14 | |
| Counter ion | Number of | 8 | – |
| Solvent | Number of | 3332 | 3332 |
| Total number of atoms | 10,376 | 10,654 | |
| Initial cell size [Å] | 100.0 × 20.0 × 50.0 | ||
| Cell size after equilibration [Å] | 101.6 × 20.3 × 50.0 | 103.4 × 20.6 × 50.0 | |
| Density after equilibration [g/cm3] | 1.02 | 0.98 | |
| Time step [fs] | 0.5 | ||
| Pure Water | System:HA | System:PD | |
|---|---|---|---|
| [ Pa·s] | 0.44 | 0.53 | 0.47 |
| Concentration c [g/cm3] | − | 0.0490 | 0.0464 |
| [cm3/g] | − | 4.2 | 1.5 |
| Number of Added NaCl Pairs | Concentration | |
|---|---|---|
| [mol/L] | [wt%] | |
| 0 | 0 | 0 |
| 20 | 0.321 | 1.82 |
| 50 | 0.802 | 4.42 |
| 100 | 1.588 | 8.55 |
Publisher’s Note: MDPI stays neutral with regard to jurisdictional claims in published maps and institutional affiliations. |
© 2022 by the authors. Licensee MDPI, Basel, Switzerland. This article is an open access article distributed under the terms and conditions of the Creative Commons Attribution (CC BY) license (https://creativecommons.org/licenses/by/4.0/).
Share and Cite
Susaki, M.; Matsumoto, M. Molecular Dynamics Investigation of Hyaluronan in Biolubrication. Polymers 2022, 14, 4031. https://doi.org/10.3390/polym14194031
Susaki M, Matsumoto M. Molecular Dynamics Investigation of Hyaluronan in Biolubrication. Polymers. 2022; 14(19):4031. https://doi.org/10.3390/polym14194031
Chicago/Turabian StyleSusaki, Masahiro, and Mitsuhiro Matsumoto. 2022. "Molecular Dynamics Investigation of Hyaluronan in Biolubrication" Polymers 14, no. 19: 4031. https://doi.org/10.3390/polym14194031
APA StyleSusaki, M., & Matsumoto, M. (2022). Molecular Dynamics Investigation of Hyaluronan in Biolubrication. Polymers, 14(19), 4031. https://doi.org/10.3390/polym14194031