
Comprehensive Investigation of Stoichiometry–Structure–Performance Relationships in Flexible Polyurethane Foams

 ,
, 
 , ,
, ,  ,
, 
Abstract
:1. Introduction
2. Materials and Methods
2.1. Materials
2.2. Preparation of Flexible Polyurethane Foams
2.3. Measurements
3. Results and Discussion
4. Conclusions
Supplementary Materials
Author Contributions
Funding
Institutional Review Board Statement
Informed Consent Statement
Data Availability Statement
Conflicts of Interest
References
- Hejna, A. Clays as Inhibitors of Polyurethane Foams’ Flammability. Materials 2021, 14, 4826. [Google Scholar] [CrossRef] [PubMed]
- Das, A.; Mahanwar, P. A Brief Discussion on Advances in Polyurethane Applications. Adv. Ind. Eng. Polym. Res. 2020, 3, 93–101. [Google Scholar] [CrossRef]
- Peyrton, J.; Avérous, L. Structure-Properties Relationships of Cellular Materials from Biobased Polyurethane Foams. Mater. Sci. Eng. R Rep. 2021, 145, 100608. [Google Scholar] [CrossRef]
- Smoleń, J.; Olszowska, K.; Godzierz, M. Composites of Rigid Polyurethane Foam and Shredded Car Window Glass Particles—Structure and Mechanical Properties. Compos. Theory Pract. 2021, 21, 135–140. [Google Scholar]
- Kausar, A. Polyurethane Composite Foams in High-Performance Applications: A Review. Polym. Plast. Technol. Eng. 2018, 57, 346–369. [Google Scholar] [CrossRef]
- Gama, N.; Ferreira, A.; Barros-Timmons, A. Polyurethane Foams: Past, Present, and Future. Materials 2018, 11, 1841. [Google Scholar] [CrossRef]
- Hejna, A.; Haponiuk, J.; Piszczyk, Ł.; Klein, M.; Formela, K. Performance Properties of Rigid Polyurethane-Polyisocyanurate/Brewers’ Spent Grain Foamed Composites as Function of Isocyanate Index. e-Polymers 2017, 17, 427–437. [Google Scholar] [CrossRef]
- Amran, U.A.; Salleh, K.M.; Zakaria, S.; Roslan, R.; Chia, C.H.; Jaafar, S.N.S.; Sajab, M.S.; Mostapha, M. Production of Rigid Polyurethane Foams Using Polyol from Liquefied Oil Palm Biomass: Variation of Isocyanate Indexes. Polymers 2021, 13, 3072. [Google Scholar] [CrossRef]
- Fink, J.K. Poly(Urethane)s. In Reactive Polymers: Fundamentals and Applications; Elsevier: Amsterdam, The Netherlands, 2018; pp. 71–138. [Google Scholar]
- Jin, F.-L.; Zhao, M.; Park, M.; Park, S.-J. Recent Trends of Foaming in Polymer Processing: A Review. Polymers 2019, 11, 953. [Google Scholar] [CrossRef]
- Lapprand, A.; Boisson, F.; Delolme, F.; Méchin, F.; Pascault, J.-P. Reactivity of Isocyanates with Urethanes: Conditions for Allophanate Formation. Polym. Degrad. Stab. 2005, 90, 363–373. [Google Scholar] [CrossRef]
- Dušek, K.; Špírková, M.; Ilavský, M. Network Formation in Polyurethanes Due to Allophanate and Biuret Formation: Gel Fraction and Equilibrium Modulus. Makromol. Chemie. Macromol. Symp. 1991, 45, 87–95. [Google Scholar] [CrossRef]
- Petrovic, Z. Polyurethanes from Vegetable Oils. Polym. Rev. 2008, 48, 109–155. [Google Scholar] [CrossRef]
- Ivdre, A.; Abolins, A.; Sevastyanova, I.; Kirpluks, M.; Cabulis, U.; Merijs-Meri, R. Rigid Polyurethane Foams with Various Isocyanate Indices Based on Polyols from Rapeseed Oil and Waste PET. Polymers 2020, 12, 738. [Google Scholar] [CrossRef] [PubMed]
- Kozioł, M.; Nowacki, K.; Wieczorek, J.; Małysa, T. Evaluation of Mechanical Properties of Polymer Sandwich Systems Used for Noise Reduction Purposes. Compos. Theory Pract. 2015, 15, 158–162. [Google Scholar]
- Hejna, A.; Kopczyńska, M.; Kozłowska, U.; Klein, M.; Kosmela, P.; Piszczyk, Ł. Foamed Polyurethane Composites with Different Types of Ash—Morphological, Mechanical and Thermal Behavior Assessments. Cell. Polym. 2016, 35, 287–308. [Google Scholar] [CrossRef]
- Zhang, C.; Li, J.; Hu, Z.; Zhu, F.; Huang, Y. Correlation between the Acoustic and Porous Cell Morphology of Polyurethane Foam: Effect of Interconnected Porosity. Mater. Des. 2012, 41, 319–325. [Google Scholar] [CrossRef]
- Baghban, S.A.; Khorasani, M.; Sadeghi, G.M.M. Acoustic Damping Flexible Polyurethane Foams: Effect of Isocyanate Index and Water Content on the Soundproofing. J. Appl. Polym. Sci. 2019, 136, 47363. [Google Scholar] [CrossRef]
- Soto, G.; Castro, A.; Vechiatti, N.; Iasi, F.; Armas, A.; Marcovich, N.E.; Mosiewicki, M.A. Biobased Porous Acoustical Absorbers Made from Polyurethane and Waste Tire Particles. Polym. Test. 2017, 57, 42–51. [Google Scholar] [CrossRef]
- Bernardini, J.; Licursi, D.; Anguillesi, I.; Cinelli, P.; Coltelli, M.-B.; Antonetti, C.; Raspolli Galletti, A.M.; Lazzeri, A. Exploitation of Arundo Donax L. Hydrolysis Residue for the Green Synthesis of Flexible Polyurethane Foams. Bioresources 2017, 12, 3630–3655. [Google Scholar] [CrossRef]
- Lee, C.S.; Ooi, T.L.; Chuah, C.H.; Ahmad, S. Effect of Isocyanate Index on Physical Properties of Flexible Polyurethane Foams. Malays. J. Sci. 2007, 26, 91–98. [Google Scholar]
- Prociak, A.; Malewska, E.; Bąk, S. Influence of Isocyanate Index on Selected Properties of Flexible Polyurethane Foams Modified with Various Bio-Components. J. Renew. Mater. 2016, 4, 78–85. [Google Scholar] [CrossRef]
- ISO 10534-2; Acoustics—Determination of Sound Absorption Coefficient and Impedance in Impedance Tubes—Part 2: Transfer-Function Method. International Organization for Standardization: Geneva, Switzerland, 2003.
- ASTM E1050-08; Standard Test Method for Impedance and Absorption of Acoustical Material Using a Tube, Two Microphones and a Digital Frequency Analysis System. ASTM International: West Conshohocken, PA, USA, 2008.
- Tang, Q.; Gao, K. Structure Analysis of Polyether-Based Thermoplastic Polyurethane Elastomers by FTIR, 1 H NMR and 13 C NMR. Int. J. Polym. Anal. Charact. 2017, 22, 569–574. [Google Scholar] [CrossRef]
- Trovati, G.; Sanches, E.A.; Neto, S.C.; Mascarenhas, Y.P.; Chierice, G.O. Characterization of Polyurethane Resins by FTIR, TGA, and XRD. J. Appl. Polym. Sci. 2010, 115, 263–268. [Google Scholar] [CrossRef]
- Kosmela, P.; Hejna, A.; Formela, K.; Haponiuk, J.; Piszczyk, Ł. The Study on Application of Biopolyols Obtained by Cellulose Biomass Liquefaction Performed with Crude Glycerol for the Synthesis of Rigid Polyurethane Foams. J. Polym. Env. 2018, 26, 2546–2554. [Google Scholar] [CrossRef]
- Kosmela, P.; Hejna, A.; Suchorzewski, J.; Piszczyk, Ł.; Haponiuk, J.T. Study on the Structure-Property Dependences of Rigid PUR-PIR Foams Obtained from Marine Biomass-Based Biopolyol. Materials 2020, 13, 1257. [Google Scholar] [CrossRef]
- Hejna, A.; Kosmela, P.; Klein, M.; Formela, K.; Kopczyńska, M.; Haponiuk, J.; Piszczyk, Ł. Two-Step Conversion of Crude Glycerol Generated by Biodiesel Production into Biopolyols: Synthesis, Structural and Physical Chemical Characterization. J. Polym. Environ. 2018, 26, 3334–3344. [Google Scholar] [CrossRef]
- Kosmela, P.; Gosz, K.; Kazimierski, P.; Hejna, A.; Haponiuk, J.T.; Piszczyk, Ł. Chemical Structures, Rheological and Physical Properties of Biopolyols Prepared via Solvothermal Liquefaction of Enteromorpha and Zostera Marina Biomass. Cellulose 2019, 26, 5893–5912. [Google Scholar] [CrossRef]
- Behera, P.K.; Mondal, P.; Singha, N.K. Polyurethane with an Ionic Liquid Crosslinker: A New Class of Super Shape Memory-like Polymers. Polym. Chem. 2018, 9, 4205–4217. [Google Scholar] [CrossRef]
- Wang, K.; Peng, Y.; Tong, R.; Wang, Y.; Wu, Z. The Effects of Isocyanate Index on the Properties of Aliphatic Waterborne Polyurethaneureas. J. Appl. Polym. Sci. 2010, 118, 920–927. [Google Scholar] [CrossRef]
- Mattia, J.; Painter, P. A Comparison of Hydrogen Bonding and Order in a Polyurethane and Poly(Urethane−urea) and Their Blends with Poly(Ethylene Glycol). Macromolecules 2007, 40, 1546–1554. [Google Scholar] [CrossRef]
- Thomas, O.; Priester, R.D., Jr.; Hinze, K.J.; Latham, D.D. Effect of Cross-Link Density on the Morphology, Thermal and Mechanical Properties of Flexible Molded Polyurea/Urethane Foams and Films. J. Polym. Sci. B Polym. Phys. 1994, 32, 2155–2169. [Google Scholar] [CrossRef]
- Dounis, D.V.; Wilkes, G.L. Structure-Property Relationships of Flexible Polyurethane Foams. Polymer 1997, 38, 2819–2828. [Google Scholar] [CrossRef]
- Wang, G.H.; Zhou, A.N. Soy Protein Based Biodegradable Flexible Polyurethane Foam. Adv. Mater. Res. 2010, 152–153, 1862–1865. [Google Scholar] [CrossRef]
- Rojek, P.; Prociak, A. Effect of Different Rapeseed-Oil-Based Polyols on Mechanical Properties of Flexible Polyurethane Foams. J. Appl. Polym. Sci. 2012, 125, 2936–2945. [Google Scholar] [CrossRef]
- Xiang, A.; Li, Y.; Fu, L.; Chen, Y.; Tian, H.; Rajulu, A.V. Thermal Degradation and Flame Retardant Properties of Isocyanate-Based Flexible Polyimide Foams with Different Isocyanate Indices. Thermochim. Acta 2017, 652, 160–165. [Google Scholar] [CrossRef]
- Cimavilla-Román, P.; Pérez-Tamarit, S.; Santiago-Calvo, M.; Rodríguez-Pérez, M.Á. Influence of Silica Aerogel Particles on the Foaming Process and Cellular Structure of Rigid Polyurethane Foams. Eur. Polym. J. 2020, 135, 109884. [Google Scholar] [CrossRef]
- Mizera, K.; Ryszkowska, J. Thermal Properties of Polyurethane Elastomers from Soybean Oil-Based Polyol with a Different Isocyanate Index. J. Elastomers Plast. 2019, 51, 157–174. [Google Scholar] [CrossRef]
- Petrović, Z.S.; Zhang, W.; Zlatanić, A.; Lava, C.C.; Ilavskyý, M. Effect of OH/NCO Molar Ratio on Properties of Soy-Based Polyurethane Networks. J. Polym. Environ. 2002, 10, 5–12. [Google Scholar] [CrossRef]
- Abu-Jdayil, B.; Mourad, A.-H.; Hittini, W.; Hassan, M.; Hameedi, S. Traditional, State-of-the-Art and Renewable Thermal Building Insulation Materials: An Overview. Constr. Build. Mater. 2019, 214, 709–735. [Google Scholar] [CrossRef]
- Kosmela, P.; Olszewski, A.; Zedler, Ł.; Burger, P.; Piasecki, A.; Formela, K.; Hejna, A. Ground Tire Rubber Filled Flexible Polyurethane Foam—Effect of Waste Rubber Treatment on Composite Performance. Materials 2021, 14, 3807. [Google Scholar] [CrossRef]
- Żukowska, W.; Kosmela, P.; Wojtasz, P.; Szczepański, M.; Piasecki, A.; Barczewski, R.; Barczewski, M.; Hejna, A. Comprehensive Enhancement of Prepolymer-Based Flexible Polyurethane Foams’ Performance by Introduction of Cost-Effective Waste-Based Ground Tire Rubber Particles. Materials 2022, 15, 5728. [Google Scholar] [CrossRef] [PubMed]
- Kurańska, M.; Prociak, A.; Kirpluks, M.; Cabulis, U. Polyurethane–Polyisocyanurate Foams Modified with Hydroxyl Derivatives of Rapeseed Oil. Ind. Crops Prod. 2015, 74, 849–857. [Google Scholar] [CrossRef]
- Biesmans, G.; de Vos, R.; Rosbotham, I.D. Use of Alternative Blowing Agents in Polyurethane Foams-A Comparison Between Experimental and Predicted Ageing. J. Cell. Plast. 1994, 30, 539–553. [Google Scholar] [CrossRef]
- Chu, R.K.M.; Naguib, H.E.; Atalla, N. Synthesis and Characterization of Open-Cell Foams for Sound Absorption with Rotational Molding Method. Polym. Eng. Sci. 2009, 49, 1744–1754. [Google Scholar] [CrossRef]
- Park, J.H.; Yang, S.H.; Lee, H.R.; Bin Yu, C.; Pak, S.Y.; Oh, C.S.; Kang, Y.J.; Youn, J.R. Optimization of Low Frequency Sound Absorption by Cell Size Control and Multiscale Poroacoustics Modeling. J. Sound. Vib. 2017, 397, 17–30. [Google Scholar] [CrossRef]
- Małysa, T.; Nowacki, K.; Wieczorek, J. Assessment of Sound Absorbing Properties of Polyurethane Sandwich System. Compos. Theory Pract. 2016, 16, 244–248. [Google Scholar]
- Abdollahi Baghban, S.; Khorasani, M.; Sadeghi, G.M.M. Soundproofing Flexible Polyurethane Foams: The Impact of Polyester Chemical Structure on the Microphase Separation and Acoustic Damping. J. Appl. Polym. Sci. 2018, 135, 46744. [Google Scholar] [CrossRef]
- Cao, L.; Fu, Q.; Si, Y.; Ding, B.; Yu, J. Porous Materials for Sound Absorption. Compos. Commun. 2018, 10, 25–35. [Google Scholar] [CrossRef]
- Fu, Y.; Kabir, I.I.; Yeoh, G.H.; Peng, Z. A Review on Polymer-Based Materials for Underwater Sound Absorption. Polym. Test. 2021, 96, 107115. [Google Scholar] [CrossRef]
- Kurańska, M.; Barczewski, R.; Barczewski, M.; Prociak, A.; Polaczek, K. Thermal Insulation and Sound Absorption Properties of Open-Cell Polyurethane Foams Modified with Bio-Polyol Based on Used Cooking Oil. Materials 2020, 13, 5673. [Google Scholar] [CrossRef]
- Shen, J.; Lin, X.; Liu, J.; Li, X. Effects of Cross-Link Density and Distribution on Static and Dynamic Properties of Chemically Cross-Linked Polymers. Macromolecules 2019, 52, 121–134. [Google Scholar] [CrossRef]
- Lind-Nordgren, E.; Göransson, P. Optimising Open Porous Foam for Acoustical and Vibrational Performance. J. Sound. Vib. 2010, 329, 753–767. [Google Scholar] [CrossRef]
- Chen, S.; Wang, Q.; Wang, T. Preparation, Tensile, Damping and Thermal Properties of Polyurethanes Based on Various Structural Polymer Polyols: Effects of Composition and Isocyanate Index. J. Polym. Res. 2012, 19, 9994. [Google Scholar] [CrossRef]
- Olszewski, A.; Kosmela, P.; Zedler, Ł.; Formela, K.; Hejna, A. Optimization of Foamed Polyurethane/Ground Tire Rubber Composites Manufacturing. In Proceedings of the 2nd International Online Conference on Polymer Science—Polymers and Nanotechnology for Industry 4.0, Online, 1–15 November 2021; p. 12. [Google Scholar]
- Brostow, W.; Hagg Lobland, H.E.; Narkis, M. Sliding Wear, Viscoelasticity, and Brittleness of Polymers. J. Mater. Res. 2006, 21, 2422–2428. [Google Scholar] [CrossRef] [Green Version]
- Brostow, W.; Hagg Lobland, H.E.; Khoja, S. Brittleness and Toughness of Polymers and Other Materials. Mater. Lett. 2015, 159, 478–480. [Google Scholar] [CrossRef]
- Galeja, M.; Hejna, A.; Kosmela, P.; Kulawik, A. Static and Dynamic Mechanical Properties of 3D Printed ABS as a Function of Raster Angle. Materials 2020, 13, 297. [Google Scholar] [CrossRef]
- Hejna, A. Poly(ε-Caprolactone)/Brewers’ Spent Grain Composites—The Impact of Filler Treatment on the Mechanical Performance. J. Compos. Sci. 2020, 4, 167. [Google Scholar] [CrossRef]
- Hejna, A.; Barczewski, M.; Kosmela, P.; Mysiukiewicz, O.; Kuzmin, A. Coffee Silverskin as a Multifunctional Waste Filler for High-Density Polyethylene Green Composites. J. Compos. Sci. 2021, 5, 44. [Google Scholar] [CrossRef]
- Hejna, A.; Kosmela, P.; Barczewski, M.; Mysiukiewicz, O.; Piascki, A. Copper Slag as a Potential Waste Filler for Polyethylene-Based Composites Manufacturing. Tanzan. J. Sci. 2021, 47, 405–420. [Google Scholar] [CrossRef]
- Bashir, M.A. Use of Dynamic Mechanical Analysis (DMA) for Characterizing Interfacial Interactions in Filled Polymers. Solids 2021, 2, 108–120. [Google Scholar] [CrossRef]
- Hejna, A.; Olszewski, A.; Zedler, Ł.; Kosmela, P.; Formela, K. The Impact of Ground Tire Rubber Oxidation with H2O2 and KMnO4 on the Structure and Performance of Flexible Polyurethane/Ground Tire Rubber Composite Foams. Materials 2021, 14, 499. [Google Scholar] [CrossRef] [PubMed]
- Levchik, S.V.; Weil, E.D. Thermal Decomposition, Combustion and Fire-Retardancy of Polyurethanes—A Review of the Recent Literature. Polym Int 2004, 53, 1585–1610. [Google Scholar] [CrossRef]
- Allan, D.; Daly, J.; Liggat, J.J. Thermal Volatilisation Analysis of TDI-Based Flexible Polyurethane Foam. Polym. Degrad. Stab. 2013, 98, 535–541. [Google Scholar] [CrossRef] [Green Version]


| Material | Producer | Properties/Additional Information |
|---|---|---|
| Rokopol® F3000 | PCC Group (Brzeg Dolny, Poland) | Polyether polyol, hydroxyl value—53–59 mg KOH/g |
| Rokopol® V700 | PCC Group (Brzeg Dolny, Poland) | Polyether polyol, hydroxyl value—225–250 mg KOH/g |
| Glycerol | Sigma Aldrich (Poznań, Poland) | Hydroxyl value—1800 mg KOH/g |
| SPECFLEX NF 434 | M. B. Market Ltd. (Baniocha, Poland) | Polymeric methylenediphenyl-4,4′-diisocyanate, free isocyanate content—29.5% |
| PC CAT® TKA30 | Performance Chemicals (Belvedere, UK) | Potassium acetate catalyst |
| Dabco 33LV | Air Products (Allentown, USA) | Catalyst, 33 wt% solution of 1,4-diazabicyclo [2.2.2] octane in dipropylene glycol |
| Dibutyltin dilaurate | Sigma Aldrich (Poznań, Poland) | Organic tin catalyst |
| Distilled water | - | Chemical blowing agent |
| Component | Isocyanate Index | ||||||
| 0.80 | 0.90 | 0.95 | 1.00 | 1.05 | 1.10 | 1.20 | |
| Content, wt% | |||||||
| F3000 | 35.36 | 34.23 | 33.69 | 33.16 | 32.65 | 32.16 | 31.22 |
| V700 | 35.36 | 34.23 | 33.69 | 33.16 | 32.65 | 32.16 | 31.22 |
| Glycerol | 0.85 | 0.82 | 0.81 | 0.80 | 0.79 | 0.78 | 0.75 |
| DBTDL | 0.64 | 0.62 | 0.62 | 0.60 | 0.59 | 0.58 | 0.56 |
| 33LV | 0.42 | 0.41 | 0.41 | 0.40 | 0.39 | 0.39 | 0.38 |
| TKA30 | 0.42 | 0.41 | 0.41 | 0.40 | 0.39 | 0.39 | 0.38 |
| Water | 0.36 | 0.35 | 0.35 | 0.34 | 0.34 | 0.33 | 0.32 |
| pMDI | 26.56 | 28.92 | 30.05 | 31.14 | 32.19 | 33.22 | 35.17 |
| Parameter | Isocyanate Index | ||||||
| 0.80 | 0.90 | 0.95 | 1.00 | 1.05 | 1.10 | 1.20 | |
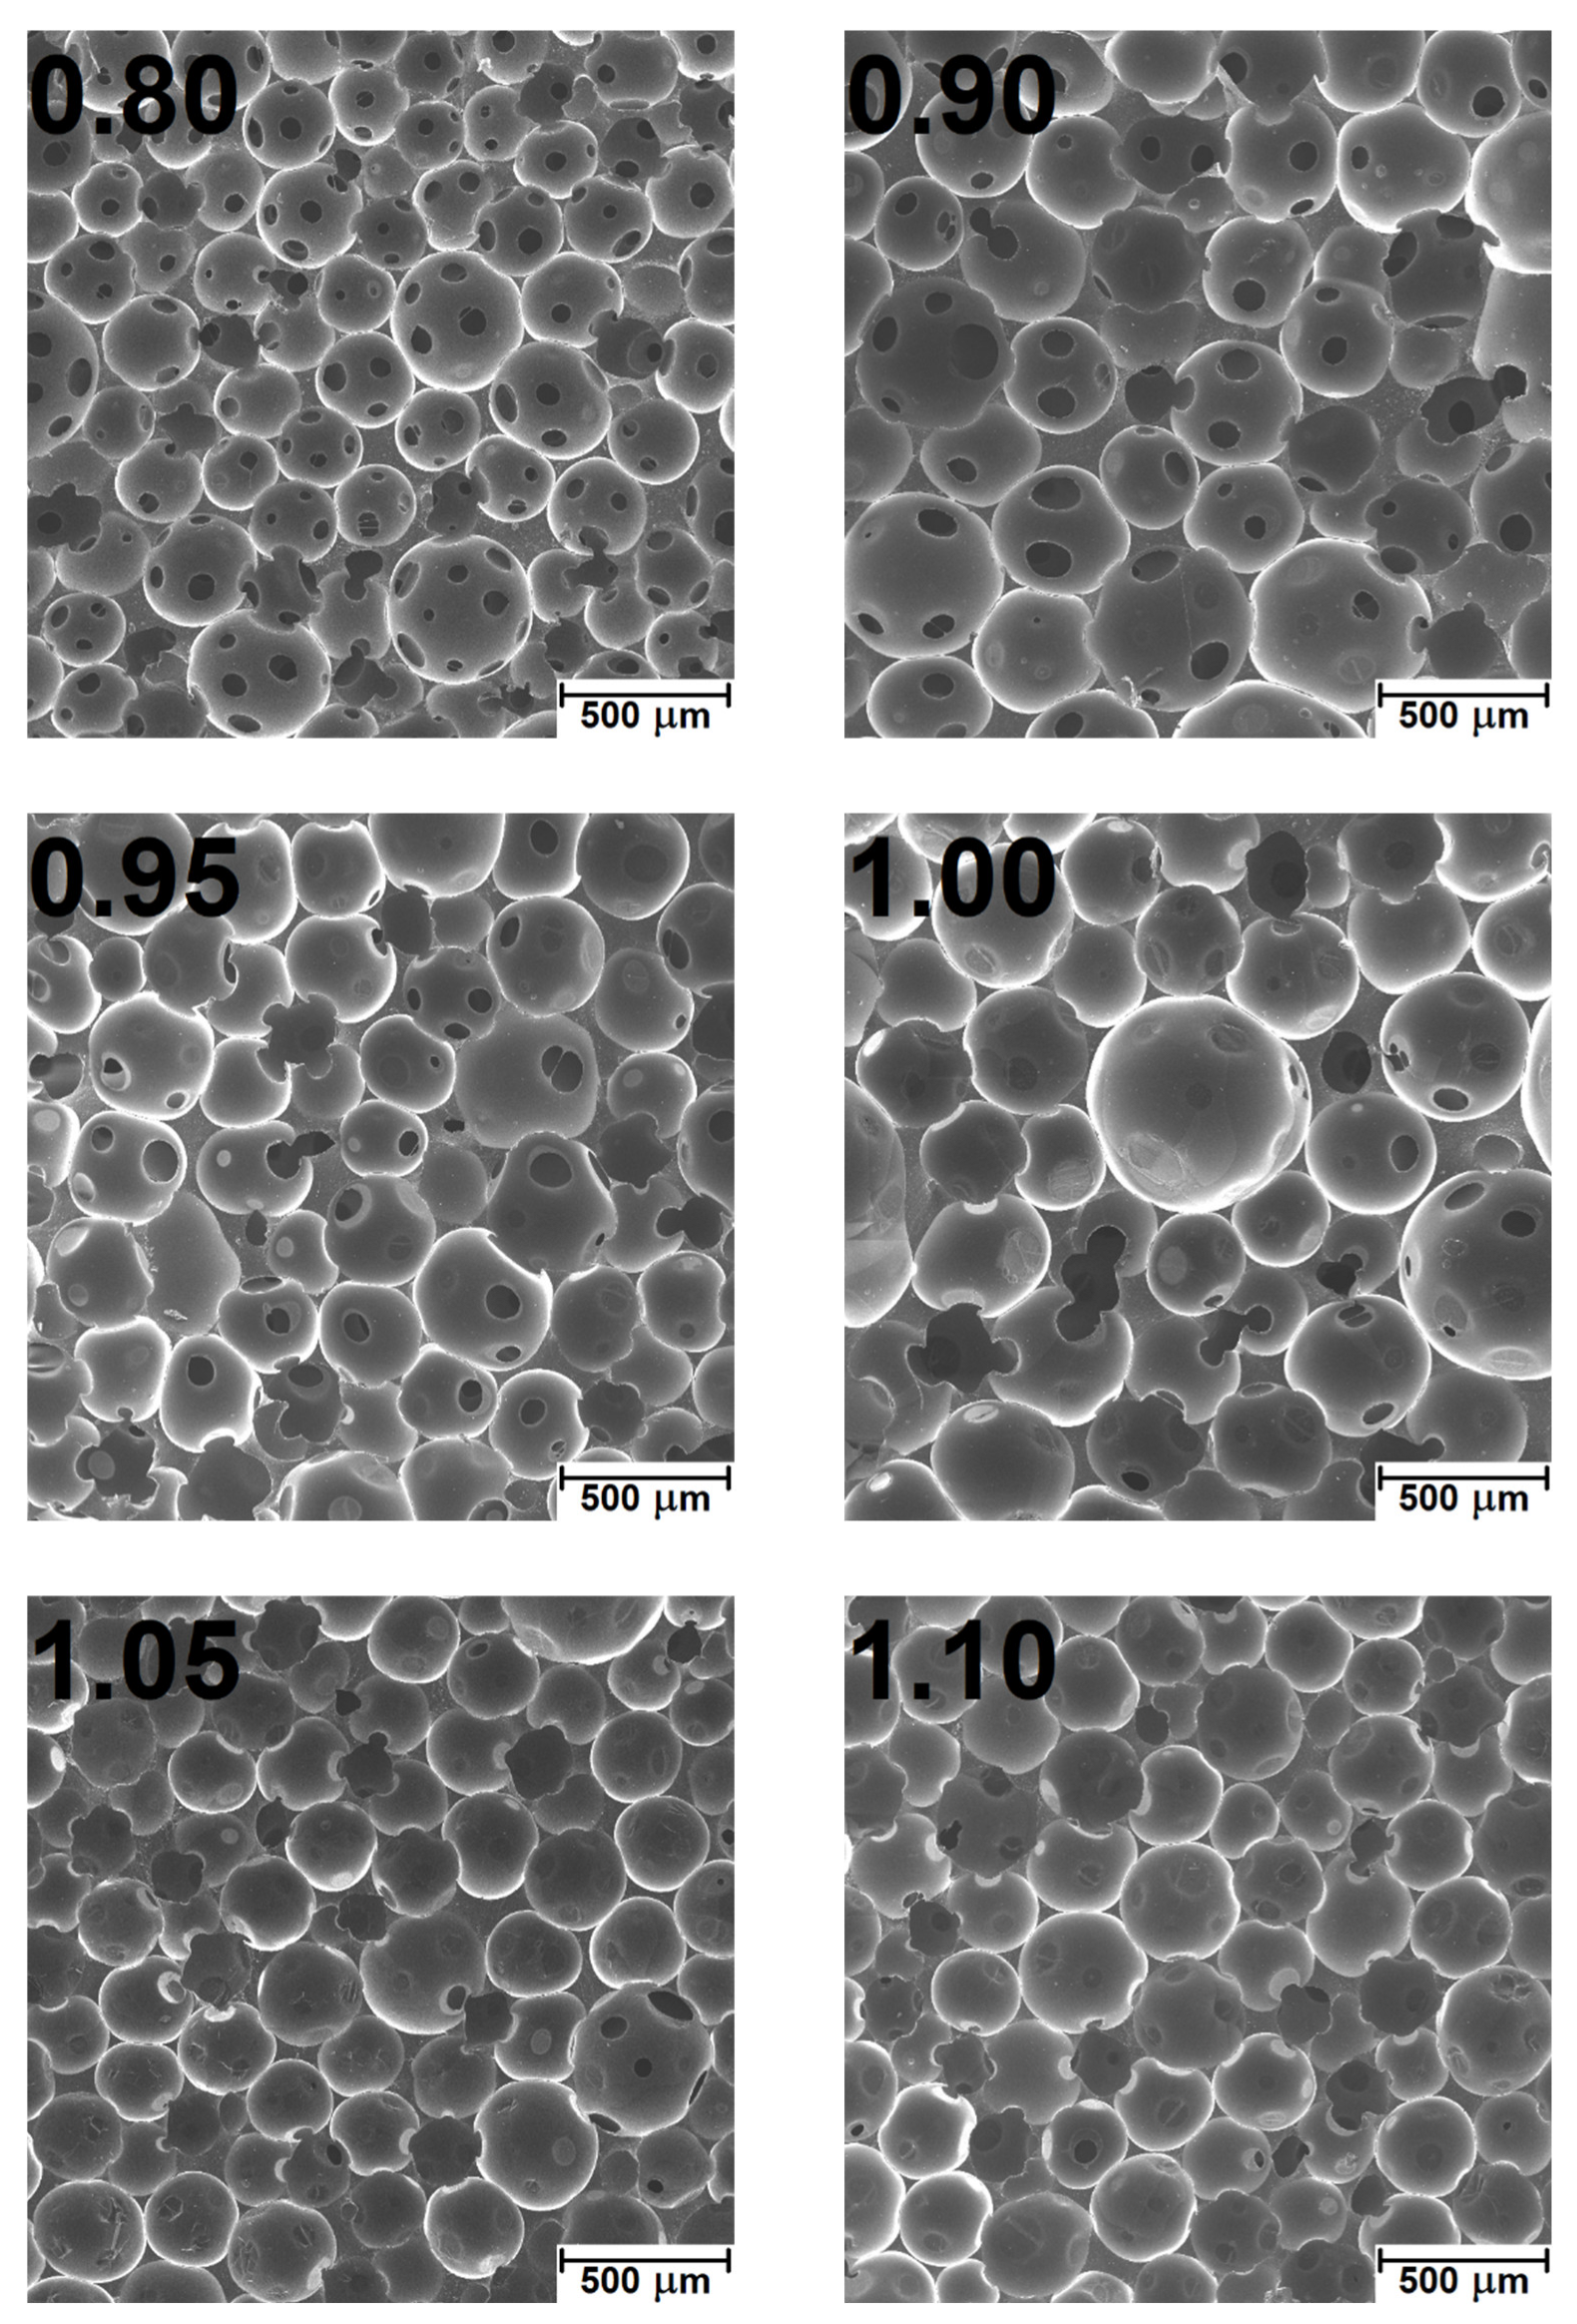
| Average particle size, mm | 225 ± 85 | 252 ± 73 | 261 ± 79 | 274 ± 75 | 223 ± 62 | 226 ± 73 | 218 ± 65 |
| Circularity | 0.31 ± 0.13 | 0.30 ± 0.11 | 0.27 ± 0.13 | 0.31 ± 0.13 | 0.27 ± 0.10 | 0.31 ± 0.11 | 0.25 ± 0.08 |
| Aspect ratio | 1.30 ± 0.26 | 1.35 ± 0.29 | 1.34 ± 0.26 | 1.30 ± 0.24 | 1.30 ± 0.25 | 1.27 ± 0.24 | 1.25 ± 0.20 |
| Roundness | 0.80 ± 0.13 | 0.77 ± 0.14 | 0.77 ± 0.13 | 0.79 ± 0.13 | 0.80 ± 0.13 | 0.81 ± 0.13 | 0.82 ± 0.11 |
| Open cell content, % | 83.1 ± 3.6 | 74.3 ± 3.3 | 71.2 ± 3.2 | 59.9 ± 5.2 | 44.8 ± 1.5 | 33.3 ± 4.8 | 22.4 ± 2.5 |
| Apparent density, kg/m3 | 185.3 ± 0.9 | 187.0 ± 2.0 | 188.8 ± 1.5 | 188.1 ± 0.9 | 188.1 ± 0.8 | 189.9 ± 1.6 | 186.5 ± 1.9 |
| Porosity, % | 83.13 ± 0.07 | 82.82 ± 0.24 | 82.99 ± 0.12 | 82.96 ± 0.07 | 83.01 ± 0.06 | 82.99 ± 0.21 | 83.24 ± 0.15 |
| Thermal conductivity coefficient, mW/(m·K) | 66.73 ± 0.84 | 66.80 ± 1.66 | 66.06 ± 1.10 | 67.42 ± 1.07 | 67.13 ± 0.80 | 70.12 ± 0.34 | 68.87 ± 0.54 |
| Isocyanate Index | ||||||||
|---|---|---|---|---|---|---|---|---|
| 0.80 | 0.90 | 0.95 | 1.00 | 1.05 | 1.10 | 1.20 | ||
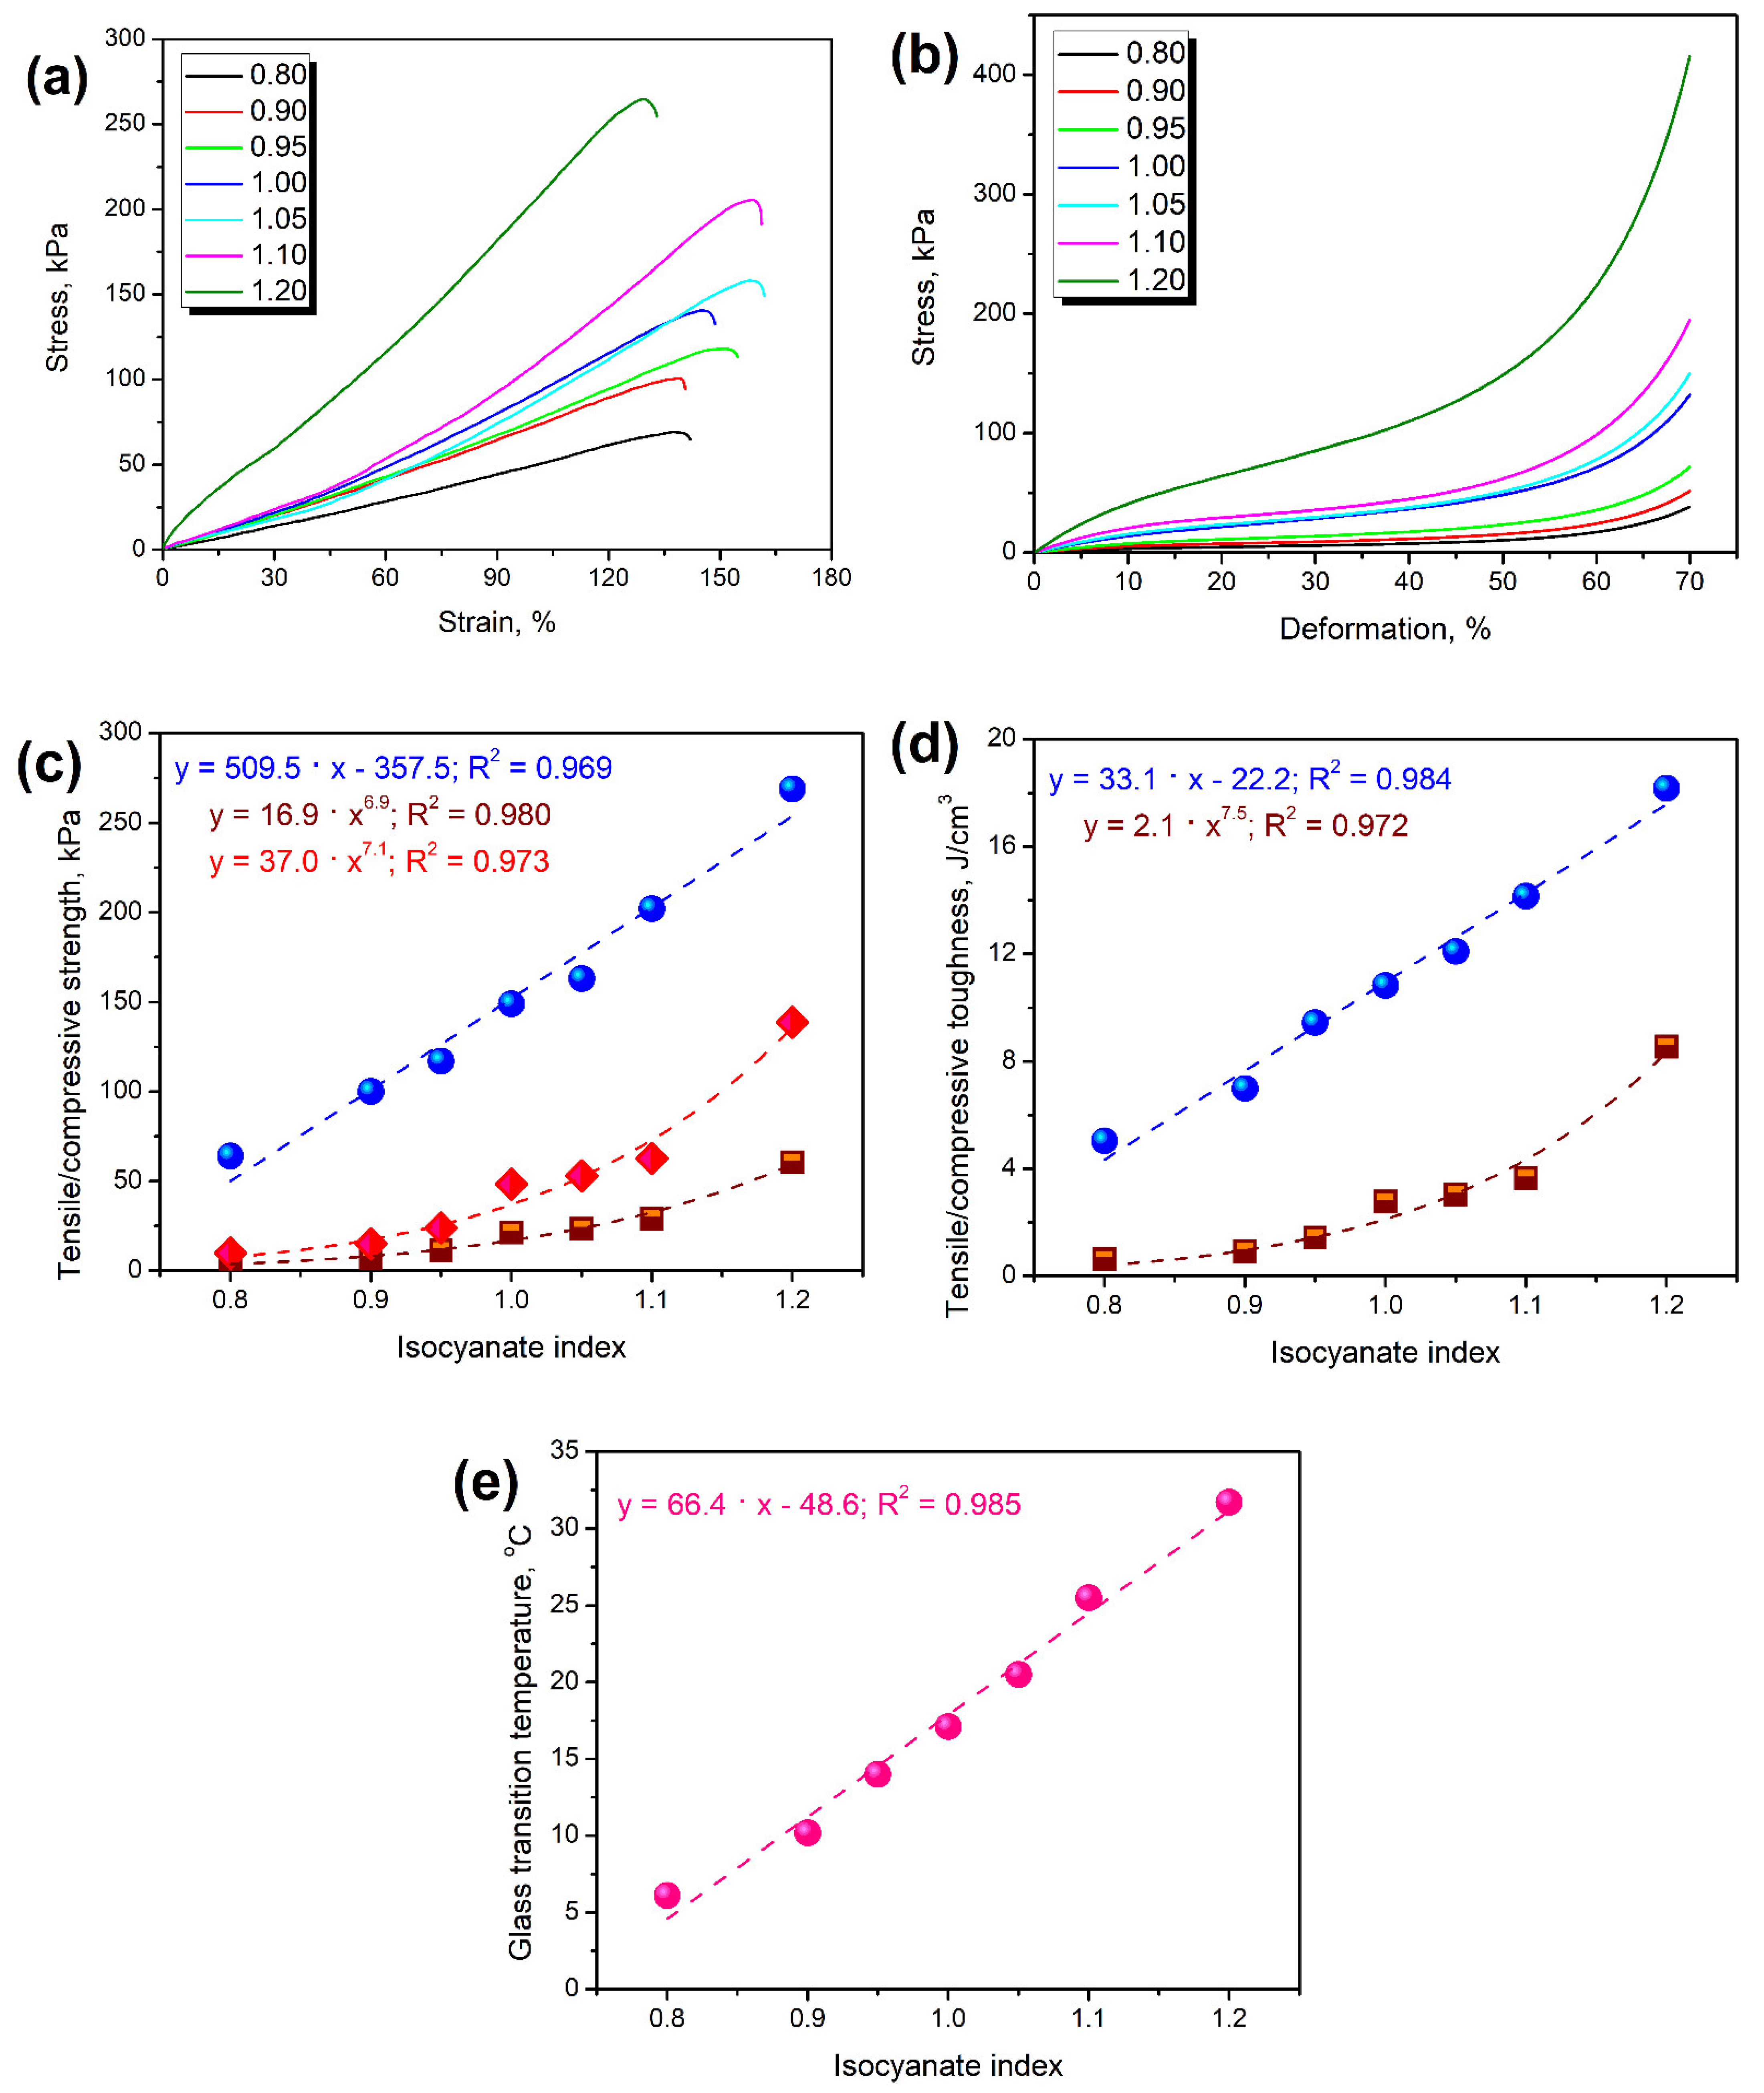
| Tensile strength, kPa | 64 + 5 | 100 + 4 | 117 + 2 | 149 + 13 | 163 + 12 | 202 + 63 | 269 + 15 | |
| Elongation at break, % | 138 + 6 | 140 + 1 | 154 + 13 | 159 + 15 | 160 + 12 | 159 + 6 | 131 + 2 | |
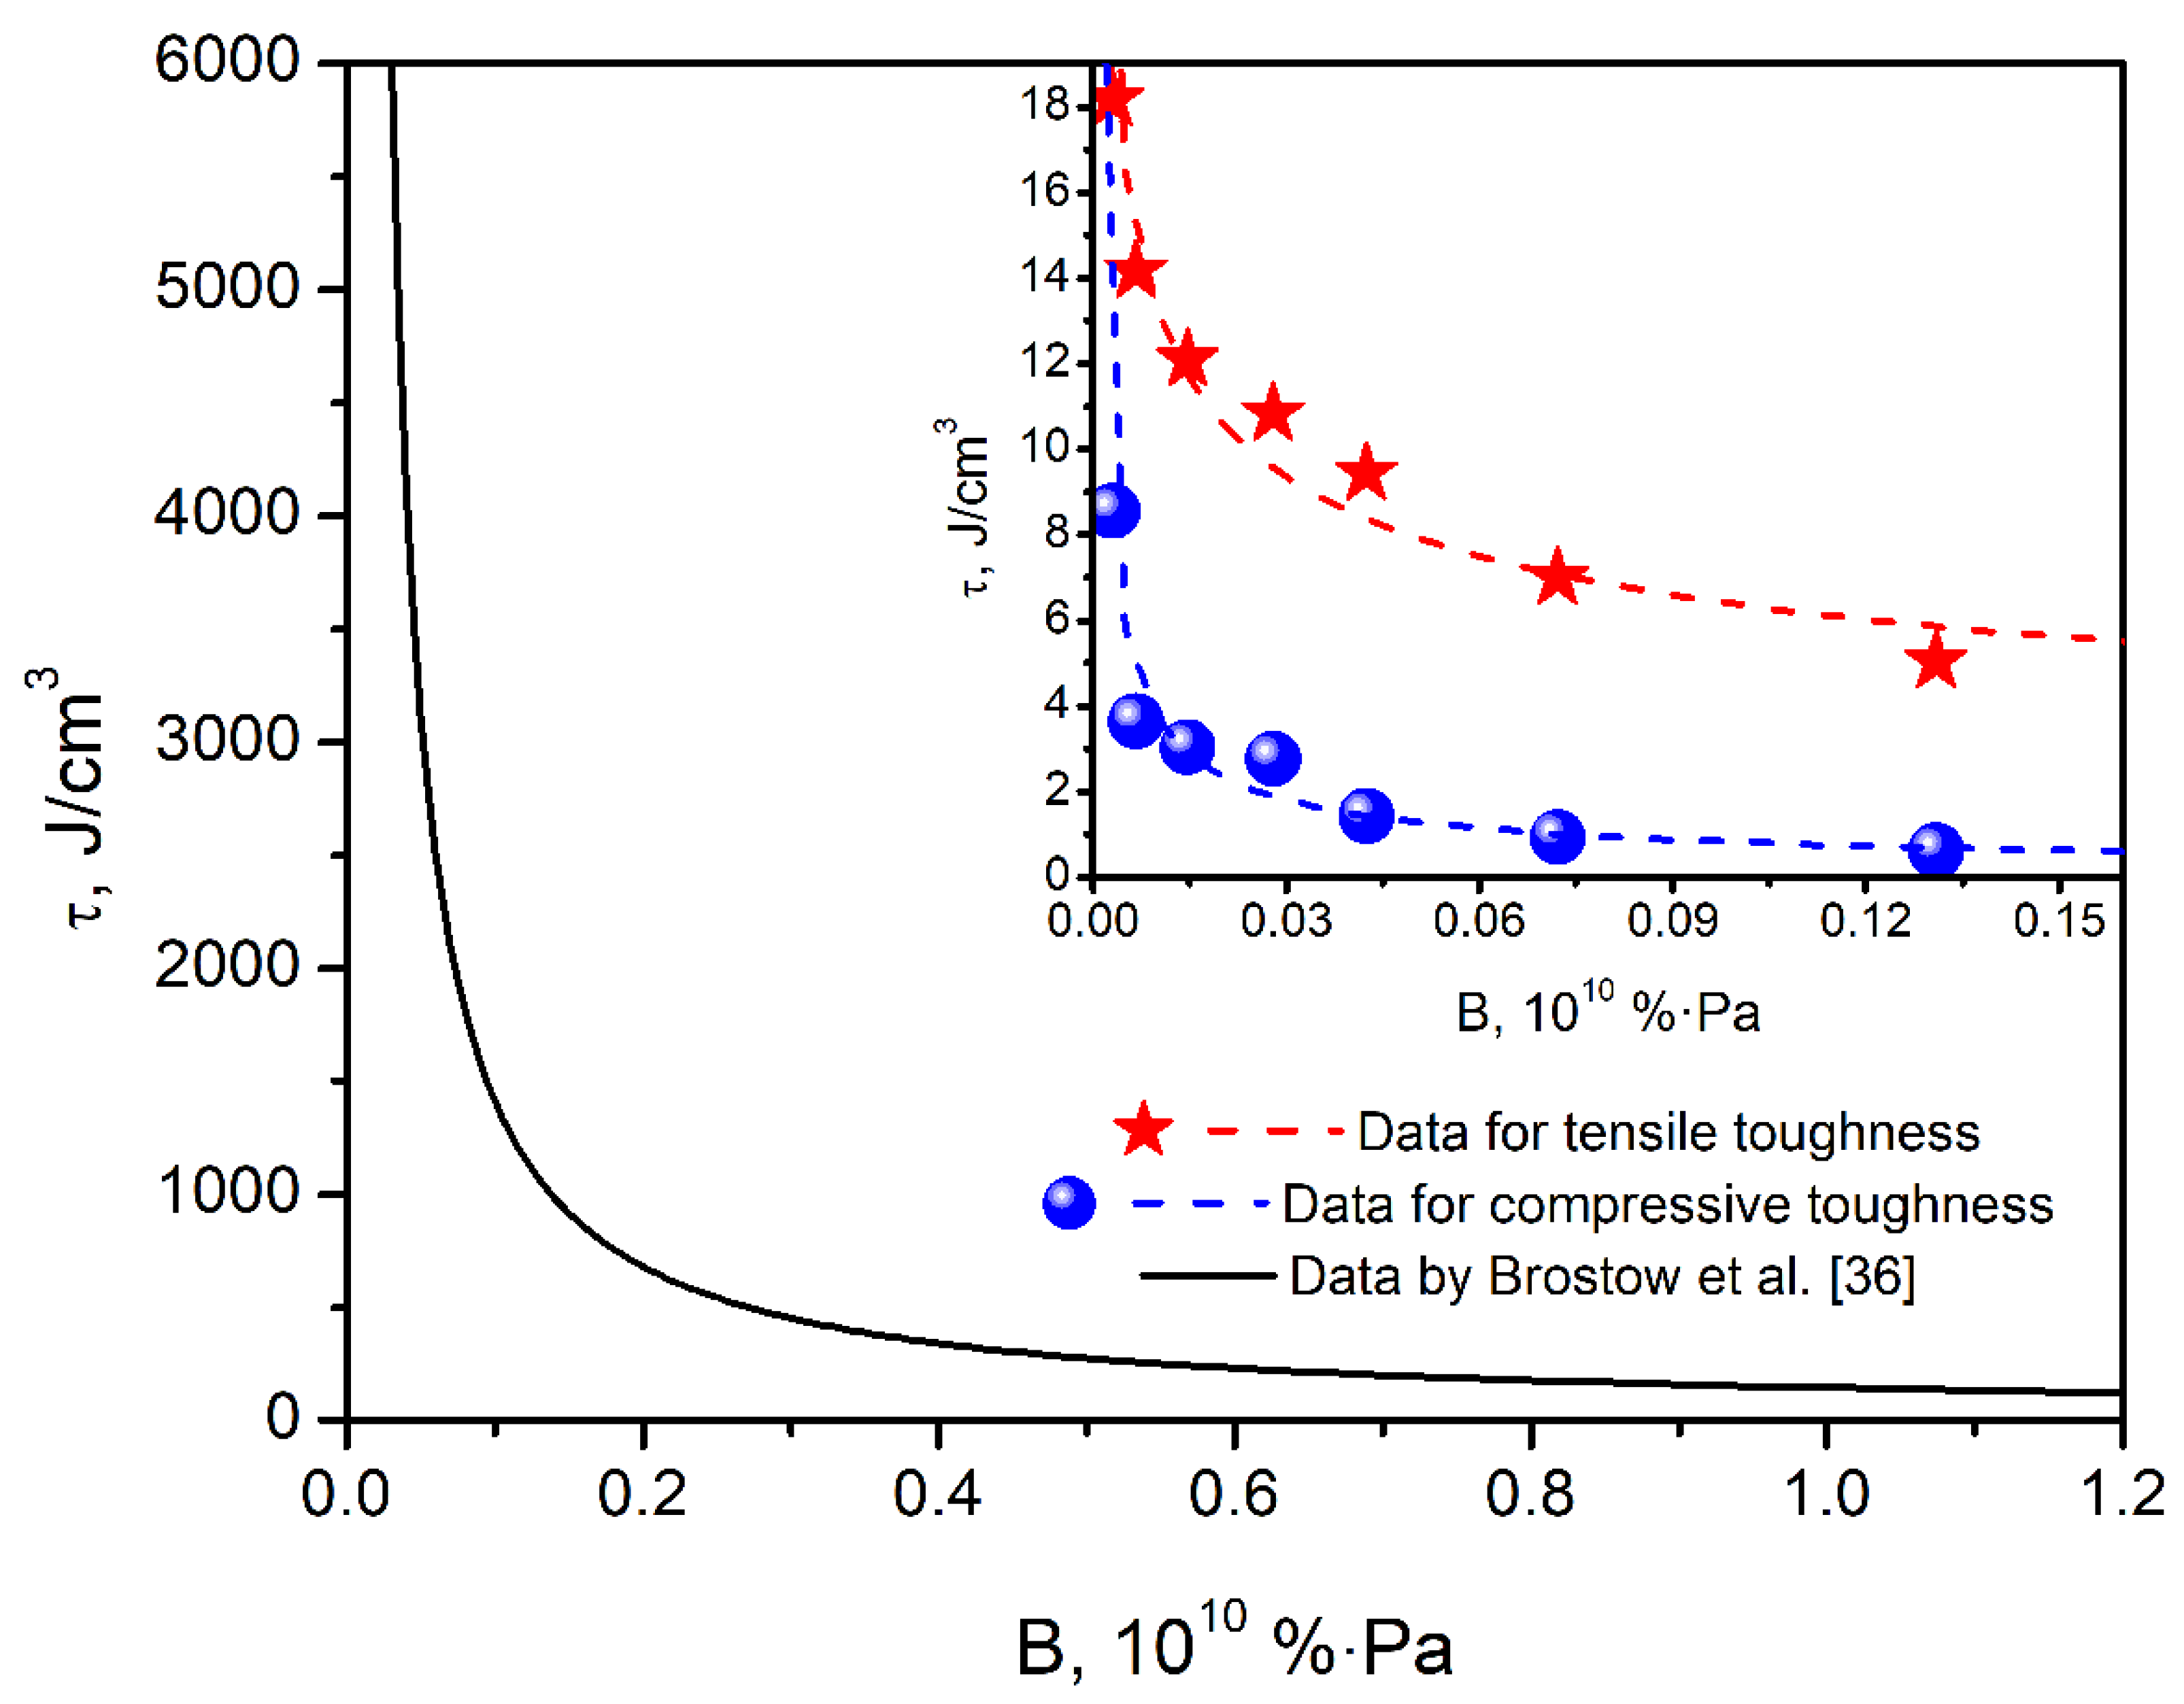
| Tensile toughness, J/cm3 | 5.036 | 6.993 | 9.437 | 10.823 | 12.101 | 14.156 | 18.172 | |
| Compressive strength, kPa | at 20% deformation | 4.5 + 0.5 | 7.1 + 0.5 | 11.3 + 1.3 | 21.4 + 0.2 | 23.4 + 0.7 | 29.1 + 0.1 | 60.5 + 4.8 |
| at 50% deformation | 9.9 + 0.9 | 15.0 + 0.2 | 24.0 + 2.7 | 48.4 + 1.1 | 53.1 + 2.9 | 62.5 + 1.2 | 138.9 + 13.7 | |
| Compressive toughness, J/cm3 | 0.628 | 0.927 | 1.436 | 2.774 | 3.033 | 3.637 | 8.549 | |
| E’ at 25 °C, kPa | 63 | 114 | 187 | 270 | 502 | 1144 | 2787 | |
| Brittleness, 1010 %Pa | 0.1309 | 0.0722 | 0.0425 | 0.0280 | 0.0147 | 0.0067 | 0.0030 | |
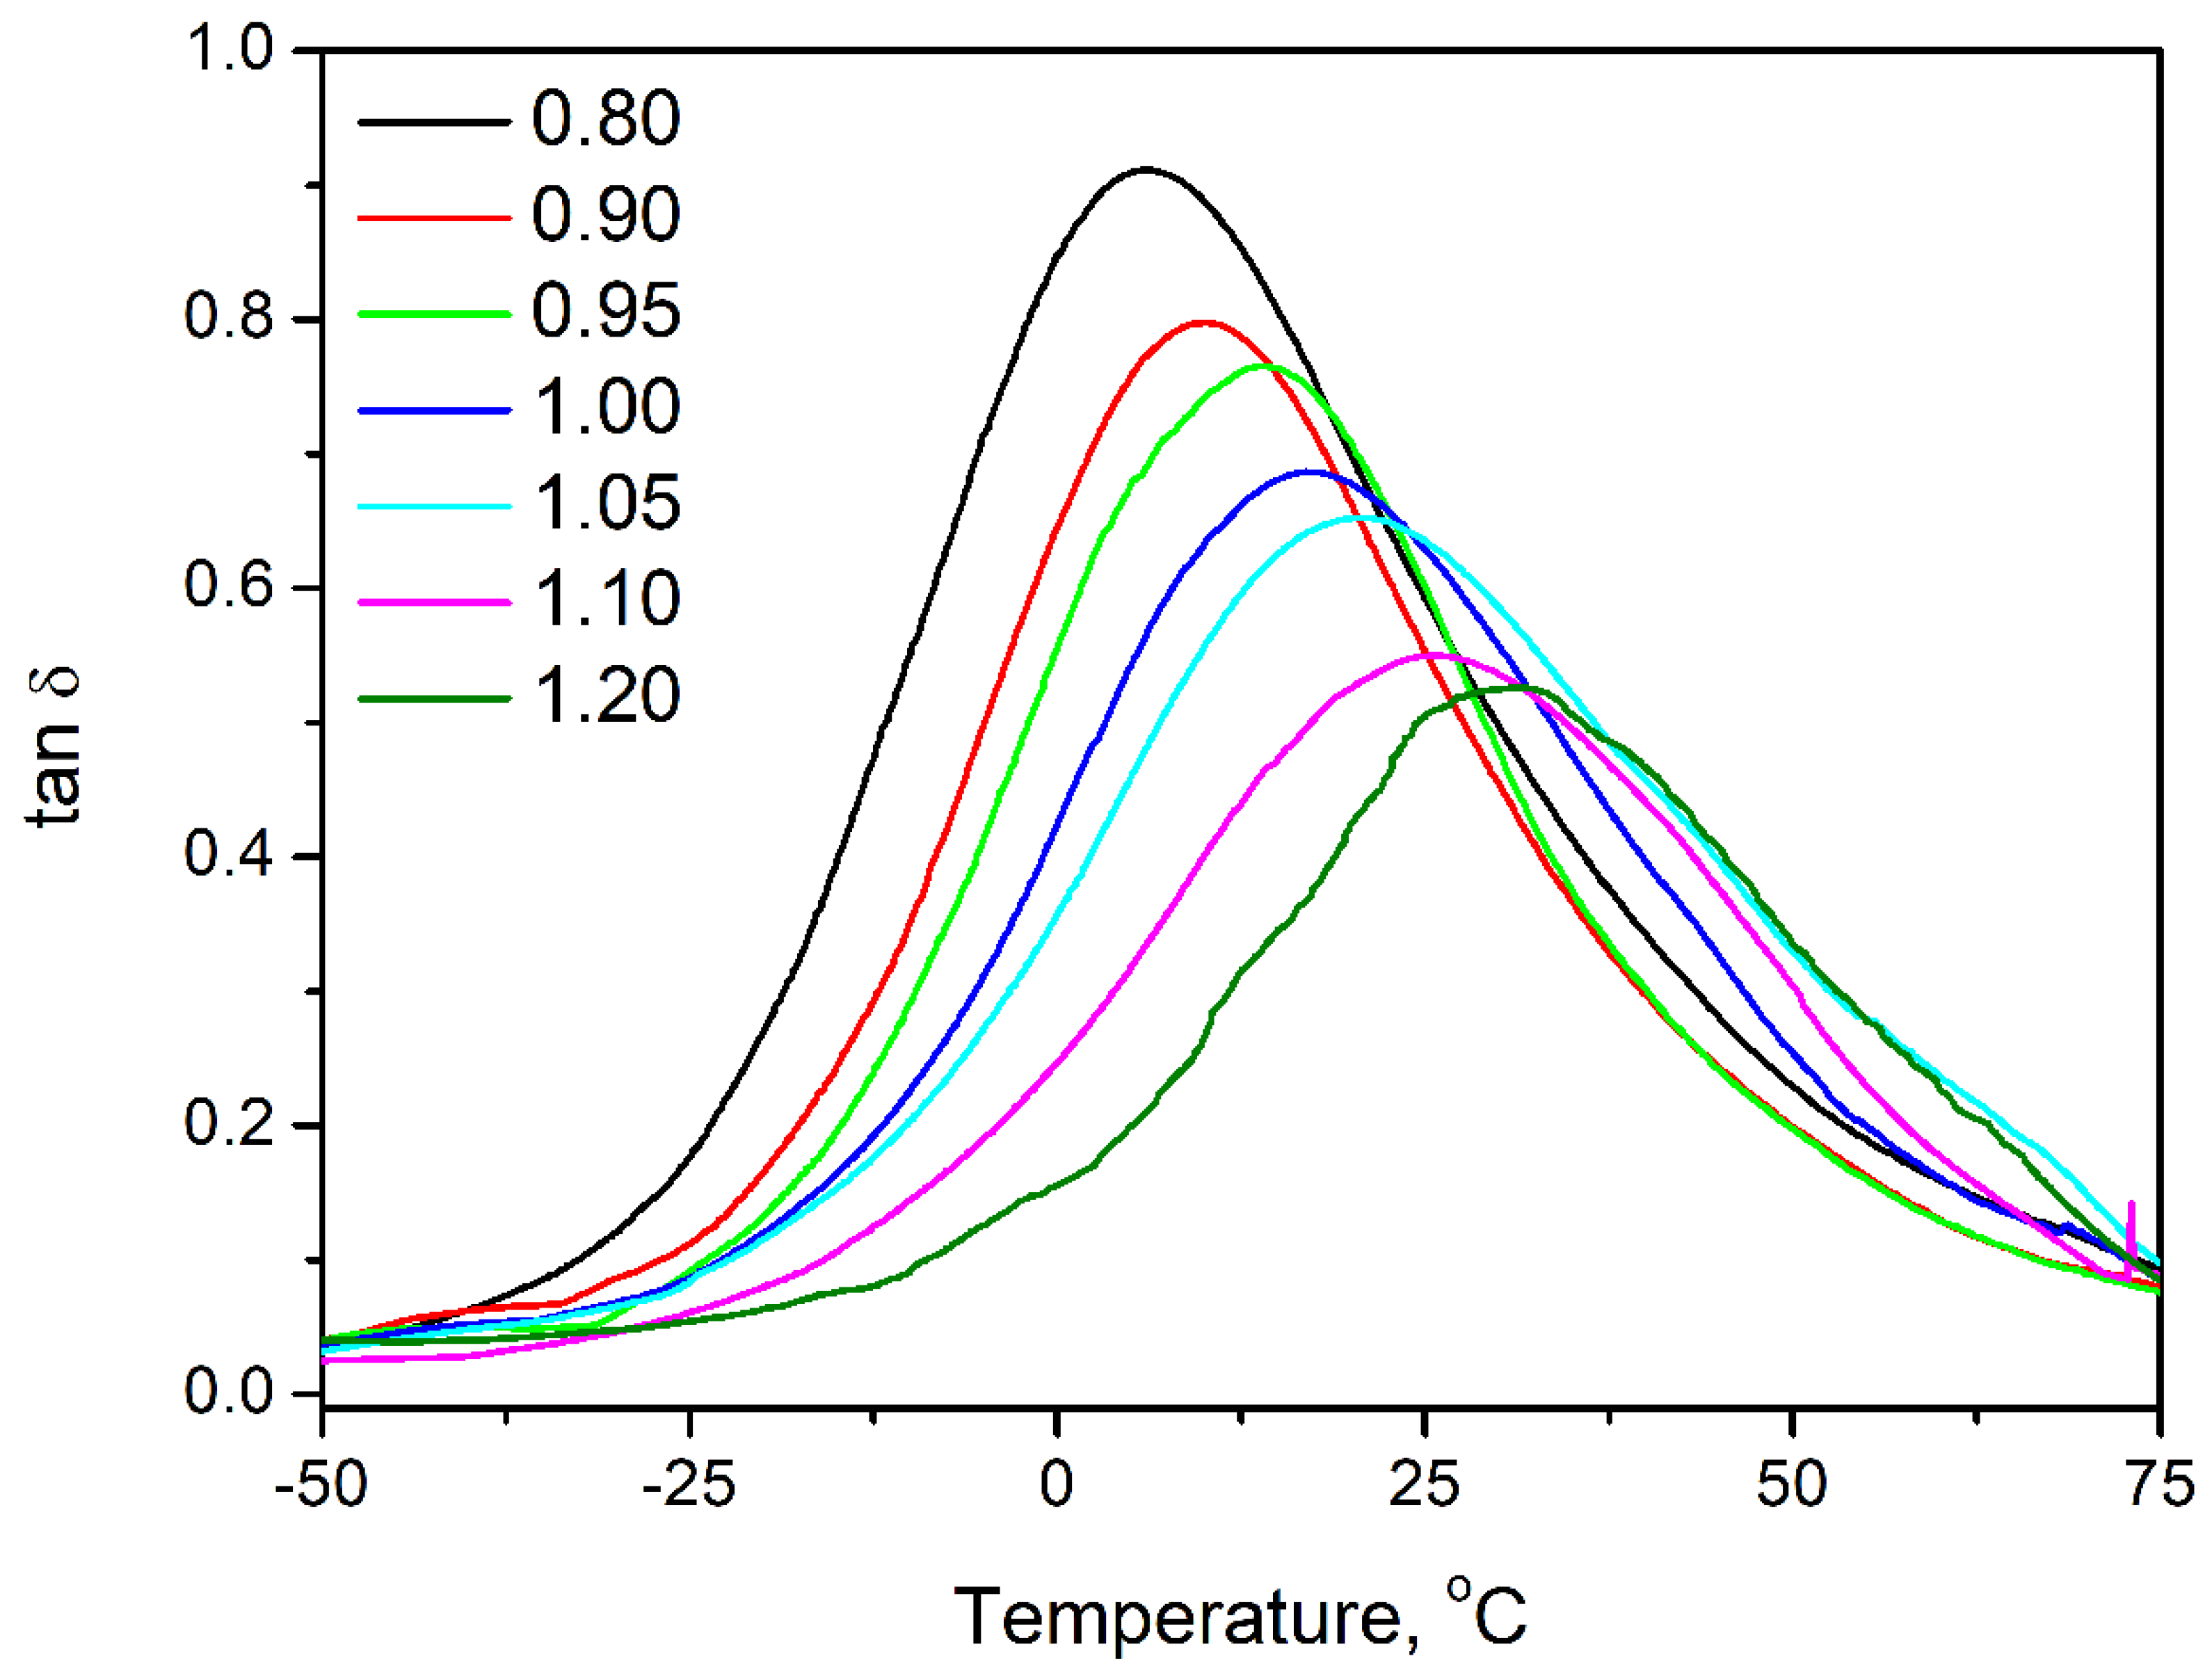
| Tg, °C | 6.1 | 10.2 | 14.0 | 17.1 | 20.5 | 25.5 | 31.7 | |
| tan δ at Tg | 0.912 | 0.799 | 0.766 | 0.689 | 0.653 | 0.555 | 0.532 | |
| Area under tan δ peak, °C | 47.952 | 39.641 | 37.579 | 37.024 | 37.126 | 32.615 | 27.984 | |
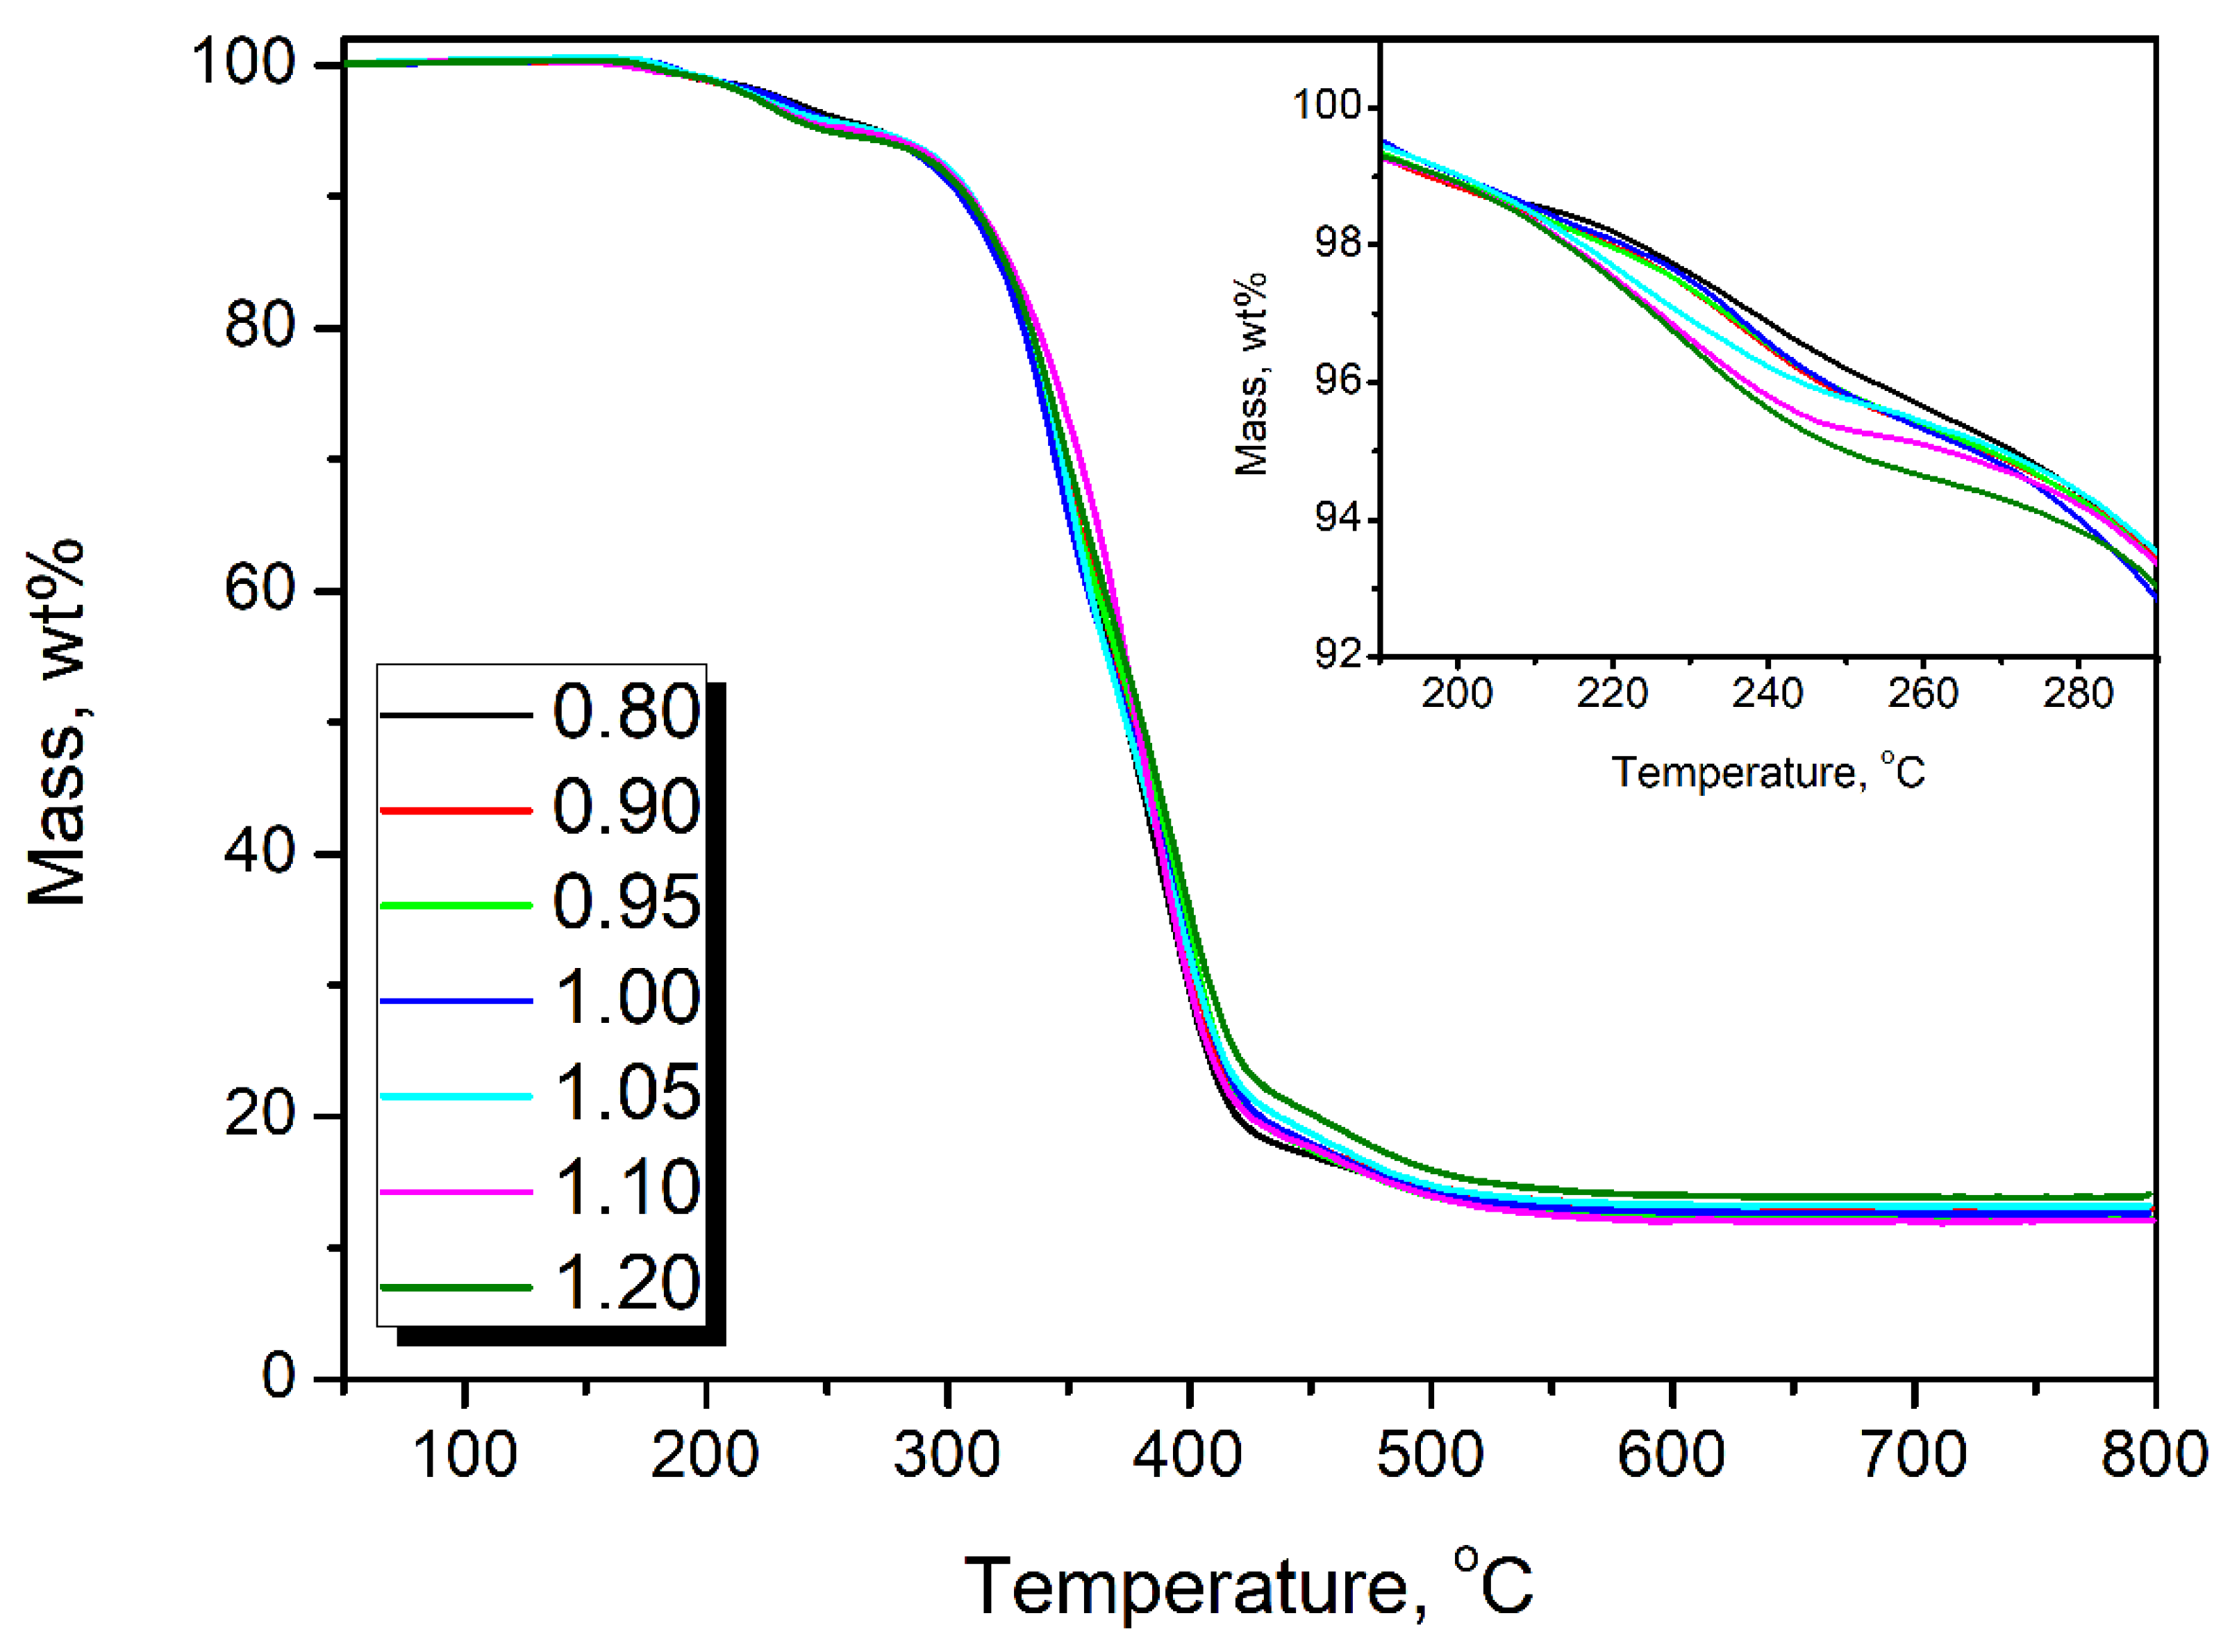
| Isocyanate Index | T−2%, °C | T−5%, °C | T−10%, °C | T−50%, °C | Char residue, wt% |
|---|---|---|---|---|---|
| 0.80 | 223.5 | 271.4 | 309.2 | 373.8 | 12.51 |
| 0.90 | 219.9 | 267.9 | 308.8 | 377.0 | 13.07 |
| 0.95 | 219.2 | 268.2 | 308.9 | 378.2 | 12.18 |
| 1.00 | 221.6 | 266.6 | 305.5 | 374.9 | 12.62 |
| 1.05 | 216.1 | 270.1 | 309.9 | 373.8 | 13.21 |
| 1.10 | 214.4 | 262.8 | 309.2 | 378.3 | 12.11 |
| 1.20 | 214.0 | 250.0 | 308.1 | 380.3 | 14.12 |
Publisher’s Note: MDPI stays neutral with regard to jurisdictional claims in published maps and institutional affiliations. |
© 2022 by the authors. Licensee MDPI, Basel, Switzerland. This article is an open access article distributed under the terms and conditions of the Creative Commons Attribution (CC BY) license (https://creativecommons.org/licenses/by/4.0/).
Share and Cite
Olszewski, A.; Kosmela, P.; Piasecki, A.; Żukowska, W.; Szczepański, M.; Wojtasz, P.; Barczewski, M.; Barczewski, R.; Hejna, A. Comprehensive Investigation of Stoichiometry–Structure–Performance Relationships in Flexible Polyurethane Foams. Polymers 2022, 14, 3813. https://doi.org/10.3390/polym14183813
Olszewski A, Kosmela P, Piasecki A, Żukowska W, Szczepański M, Wojtasz P, Barczewski M, Barczewski R, Hejna A. Comprehensive Investigation of Stoichiometry–Structure–Performance Relationships in Flexible Polyurethane Foams. Polymers. 2022; 14(18):3813. https://doi.org/10.3390/polym14183813
Chicago/Turabian StyleOlszewski, Adam, Paulina Kosmela, Adam Piasecki, Wiktoria Żukowska, Mariusz Szczepański, Paweł Wojtasz, Mateusz Barczewski, Roman Barczewski, and Aleksander Hejna. 2022. "Comprehensive Investigation of Stoichiometry–Structure–Performance Relationships in Flexible Polyurethane Foams" Polymers 14, no. 18: 3813. https://doi.org/10.3390/polym14183813
APA StyleOlszewski, A., Kosmela, P., Piasecki, A., Żukowska, W., Szczepański, M., Wojtasz, P., Barczewski, M., Barczewski, R., & Hejna, A. (2022). Comprehensive Investigation of Stoichiometry–Structure–Performance Relationships in Flexible Polyurethane Foams. Polymers, 14(18), 3813. https://doi.org/10.3390/polym14183813