Article

Research on Friction and Wear Properties of Rubber Composites by Adding Glass Fiber during Mixing

1
College of Electromechanical Engineering, Qingdao University of Science and Technology, Qingdao 266061, China
2
Shandong Provincial Key Laboratory of Polymer Material Advanced Manufactorings Technology, Qingdao University of Science and Technology, Qingdao 266061, China
*
Author to whom correspondence should be addressed.
Polymers 2022, 14(14), 2849; https://doi.org/10.3390/polym14142849
Submission received: 23 June 2022 / Revised: 4 July 2022 / Accepted: 11 July 2022 / Published: 13 July 2022
(This article belongs to the Section Polymer Composites and Nanocomposites)

Abstract

:
GF/rubber composites have sound insulation characteristics, heat resistance, good corrosion resistance, and high mechanical strength. The compounding machine’s long working hours will inevitably wear the metal on the end face of the compounding machine. The wear of the end face metal will increase the gap between the chamber and the end face, which will lead to material leakage, reduce the mixing effect, and eventually affect the performance of GF/rubber composites. To ensure the implementation of GF/rubber composites, it is necessary to study the frictional wear behavior of GF/rubber composites on metals. In this paper, the effect of blending rubber with different amounts of GF on the frictional wear of metal on the end face was analyzed from the perspective of the formulation process, and the ratio of corrosion wear and abrasive wear was calculated for the first time.

1. Introduction

Glass fiber is a kind of material with excellent performance, which has many types, low price, and high mechanical strength. It is widely used in the reinforcement of polymer materials. The composites obtained by adding glass fibers have excellent properties. It has been reported that the composite material of glass fiber and rubber has good comprehensive properties and can improve its anti-skid performance [1,2,3,4,5]. As it is widely used in many fields, glass fiber is increasingly valued. Glass fibers are commonly used as reinforcement materials in composite materials, electrical insulation materials, thermal insulation materials, circuit substrates, etc. An overview diagram of GF is shown in Figure 1.
Li Hong [6] reviewed the development of continuous glass fibers in recent years, focusing on high-performance glass fibers. In particular, the article presents recent advances in the characterization of glass structures using NMR spectroscopy, Raman spectroscopy, and molecular dynamics simulation techniques.
Yang Chuanqi [7] used the mechanical blending method to prepare glass fiber (GF)/natural rubber (NR)/butadiene rubber (BR) composites and studied the influence of glass fiber partially replacing silica on the vulcanization properties, mechanical properties, wear resistance, and skid resistance of composites. The performance of the filler was compared with that of silica and nanometer attapulgite. The results show that adding glass fiber can shorten the curing time and increase the compound’s hardness, tear strength, and wet friction coefficient. When the amount of glass fiber is 6 phr, the comprehensive performance of the binder is higher than that of silica and nanometer attapulgite filler.
Wang Wenjie [8] used glass fiber (GF) as a filler and nitrile butadiene rubber (NBR) as a matrix to prepare NBR/GF composites by the mechanical blending method and studied the effect of the amount of glass fiber on the properties of the composites. It was found that with the increase of the glass fiber dosage, the vulcanization rate of the compound decreased gradually, and the tensile strength and 100% fixed elongation stress of the vulcanized compound increased first and then decreased. The maximum tensile strength and 100% fixed elongation stress were increased by 33% and 550%, respectively.
Chen Jiabin [9] prepared glass fiber/silicon rubber composite materials, studied the failure characteristics of glass fiber/silicon rubber composite materials by the tensile test, analyzed the stress/strain curve of the composite material, and used the finite element method to numerically simulate the composite material. The study found that the glass fiber/silicone rubber composite specimen mainly manifested as a fiber debonding fracture with fiber pulling out under the action of tensile load.
Lv Fuling [10] prepared nano-magnesium hydroxide/glass fiber/silicon rubber composites by mechanical blending. The dispersion state of nano-fillers in the silicone rubber matrix was investigated, and the changing laws of physical and mechanical properties, heat resistance, and flame-retardant properties of composites with different filler dosages were compared. The results show that additional magnesium hydroxide and glass fiber dosage ratios can improve silicone rubber’s physical and mechanical properties. Among them, tensile strength, tear strength, compression set, and hardness have been enhanced. Combining the two fillers improves the composite’s thermal stability and flame retardant properties to a certain extent.
Hao Qiangqiang [11] prepared glass fiber/nitrile rubber composites by the mechanical blending method, studied the effect of glass fiber content and length on the wear resistance and mechanical properties of the composites, and observed the wear surface of the composites with a scanning electron microscope. The results show that the optimum addition mass of chopped glass fibers in the nitrile rubber matrix is 3 phr, and the length is 6 mm. Under these conditions, the prepared composites have the best wear resistance and comprehensive mechanical properties, and the wear surface is the flattest and is smooth.
The preparation of GF/rubber composites is carried out in the compounding machine. With the development of GF/rubber composites, the use time of the compounding machine, which is the equipment for preparing GF/rubber composites, has increased dramatically, bringing about the wear and tear of the compounding machine. This paper studies the frictional behavior of GF/rubber composites with different ratios and end metals during the mixing process.

2. Experiment

2.1. Instruments

The experimental equipment used in this experiment is shown in Table 1.

2.2. Formulation

Table 2 shows the formulae. To calculate the silylation reaction index, adding the C1 group without TESPT as a control is necessary.
The following were used: Butadiene Rubber 9000 (BR9000), China Hainan Natural Rubber Industry Group Co., Ltd., (Haikou, China); Polymeric Styrene Butadiene Rubber (RC2557S), Dongguan Futai Rubber Trading Co., Ltd., (Dongguan, China); Natural Rubber (TSR20), China Hainan Natural Rubber Industry Group Co., Ltd., (Haikou, China); Bis-[γ-(triethoxysilyl)propyl]tetrasulfide (TESPT), Antioxidant 4020, Zinc Oxide ZnO, Stearic Acid SAD, 1,3-Diphenylguanidine (DPG), accelerator CZ, and sulfur S, products of China Henan Longji Chemical Co., Ltd., (Puyang, Chian); Glass Fiber (GF), Wanlong Composite Materials Co., Ltd., (Qingdao, Chian); Silica115MP has a specific surface area of 115 m2/g, 7–40 nm particle size, and solid powder, Solvay Silica Co., Ltd., (Brussels, Belgium); GF diameter is 12–23 μm, length is 0.2–0.6 mm, and the surface is not treated.

2.3. Mixing Procedure

The GF/rubber composites were obtained after 5 min by mixing according to the mechanical compounding process in Table 3. The obtained GF/rubber composite was over-rolled in the BL-6157 double-roller mill, and the setting was set to a width of the double-roller of 8 mm, and the GF/rubber composite specimens with a thickness of 8 mm were obtained. The obtained GF/rubber composite specimens were cut according to the die of CSM to obtain friction specimens with a diameter of 100 mm and a thickness of 8 mm.

2.4. Test Methods

2.4.1. Rubber Processing Properties

This test was performed on the RPA 2000, and the test conditions were set as follows. The silica Durocher Stabilized Cool Down scan test conditions were 0.01 Hz scan frequency, 0.28–40% scan strain range, and 60 °C temperature, and the dynamic modulus G’ curve with strain was obtained [12,13,14,15,16,17].
(1) Payne effect: The phenomenon in which the elastic modulus of a filler compound decreases as the strain amplitude decreases [18,19,20].
(2) Silanization reaction index: Characterize the extent to which the silanization reaction proceeds. The calculation method is shown in Table 4. The test principle of the degree of silanization reaction is shown in Figure 2.
X = Area   of   silylation   zoon Area   of   the   largest   silylation   region = G R E F ( 05 ) G S ( 05 ) G R E F ( 05 ) G S ( 06 )

2.4.2. Friction Test

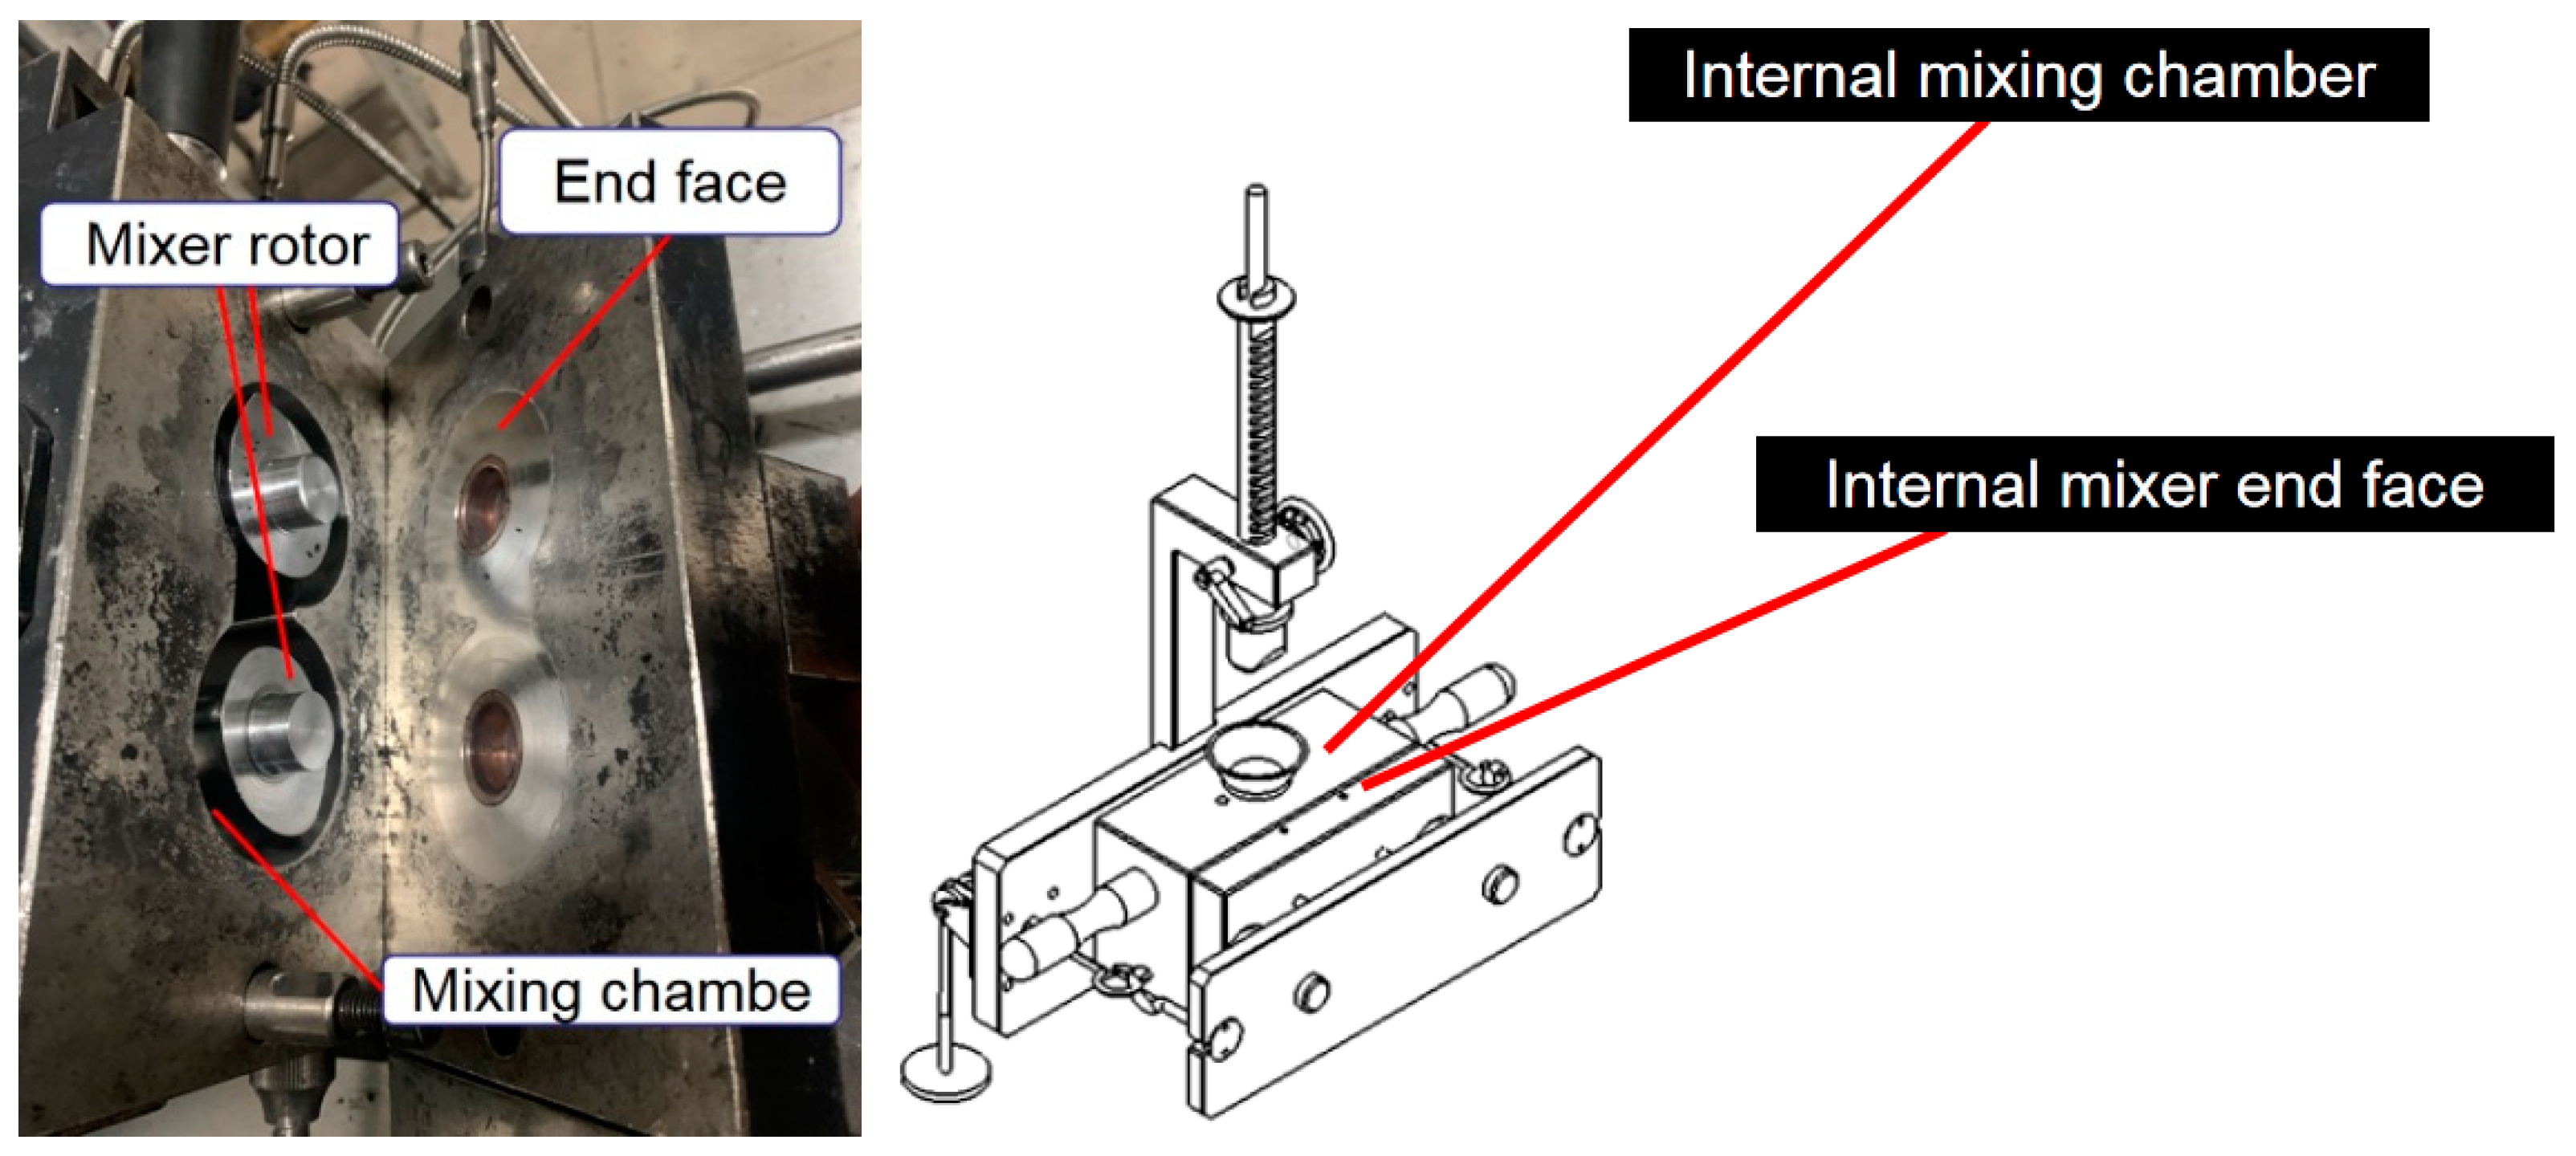
The Hake mixer is shown in Figure 3. The CSM friction and wear testing machine was used to conduct friction experiments.
The CSM was parameterized before the experiment. The rotation speed of the CSM was the same as that of the Hake mixer, which was set to 70 r/min, the pressure was set to 5 N, and the friction time of the CSM was set to 30 min. Previous studies have shown that the most severe wear occurs at the end of the experiment, so the CSM temperature was set to 150 °C. The CSM friction and wear tester is shown in Figure 4 [21,22,23,24,25].
(3) Metal surface observation: The metal grinding head was placed on the stage and the LEXT OLS5000 3D microscope was used to emit a laser to scan the metal surface to obtain metal surface data [26,27,28].
(4) Dispersion: The rubber sample was tested with a DisperGRADER disperser, and the dispersion value was obtained through equipment analysis.

3. Mechanistic Study

3.1. Silylation Reaction Mechanism

The silanization reaction is divided into two steps, as shown in Figure 5 and Figure 6.
Figure 5 and Figure 6 show the silanization process. Due to limited technical conditions, the quality of ethanol and water produced during blending cannot be measured. To ensure the reliability of the test results, friction and wear experiments were carried out on CSM. According to the proportion of the silanization reaction, the high-temperature ethanol–water mixed vapor was sprayed onto the metal surface. The mixing conditions of the mixer were qualitatively simulated [29,30,31,32,33,34,35,36,37].

3.2. Friction Mechanism between GF/Rubber Composite and Metal

The forms of friction between GF/rubber composites and metals are mainly classified as abrasive and corrosive wear, and this study focuses on these two aspects:
(1) SiO2 particles have the characteristics of extremely easy agglomeration, while SiO2 particles are complex and irregular surfaces, so SiO2 particle aggregates are the leading cause of abrasive metal wear [38,39,40,41,42,43,44].
(2) The high-temperature ethanol–water mixed vapor will cause corrosion wear to the metal.

4. Experimental Results

4.1. Dispersion Analysis

4.1.1. Payne Effect

The stress–strain curves of GF/rubber composites with different ratios are shown in Figure 7, and the Payne effects of GF/rubber composites with different ratios are shown in Table 5.
The data from Figure 7 were extracted in Table 5. From Table 5, it can be seen that the Payne effect of GF/rubber composites without TESPT addition was more significant. With the increase of GF content in the rubber matrix, the Payne effect of the composites first decreased and then increased. When the GF content was 3 phr, the Payne effect of the composite was the lowest. The Payne effect of the GF/rubber composite increased sharply when the added GF exceeded 3 phr.
GF has a unique spatial structure, and its surface can adsorb SiO2 particles in the rubber matrix. This promotes the dispersion of SiO2 particles in the rubber matrix and reduces the number of SiO2 particle agglomerates. Therefore, the Payne effect of GF/rubber composites decreases with GF addition. GF is a spatial filamentous structure, which is easy to agglomerate with each other in the rubber matrix, which hinders the dispersion of SiO2 particles. Meanwhile, the total surface area decreases after GF accumulation, and the adsorption of SiO2 particles is weakened. All of this leads to an ever-increasing Payne effect.

4.1.2. Dispersion Degree of GF/Rubber Composite

From Figure 8 and Table 6, it can be seen that the GF/rubber composite had the lowest dispersion and the best dispersion when the content of GF was 3 phr. Adding too much or too little GF will increase the distribution of GF/rubber composites. This corresponds to the Payne effect of GF/rubber composites.

4.2. Silylation Reaction Index

The silylation reaction indices of GF/rubber composites with different ratios are shown in Figure 9. The silanization index is in Table 7.
It can be seen from Figure 9 that when the amount of GF added is 3 phr, the silanization index of the composite material is close to 1, and the silanization reaction is most advanced at this time. The silanization reaction of the composites with the remaining amount of GF was decreased. This is consistent with the previous analysis of the Payne effect.

4.3. Different Ratios of GF/Rubber Composite with Metal Friction and Wear

4.3.1. Friction Coefficient

It can be seen from Figure 10 that the friction coefficient when the composite material rubs against the metal first decreased and then increased. The friction coefficient of GF/rubber composites was the smallest when the GF addition was 3 phr. It can be seen from Figure 10 that the friction coefficients of the experimental groups added with 0, 1, 5, and 7 phr GF increased by 22.4%, 18.5%, 20.8%, and 29.1%, respectively, relative to the experimental group with 3 phr of GF added. With the increase of GF content in the rubber matrix, SiO2 particles are continuously adsorbed on the surface of GF, which promotes the dispersion of SiO2 particles and reduces the number of SiO2 particle agglomerates in the rubber matrix. SiO2 particles have high physical hardness. The SiO2 particle aggregates have complex and irregular shapes, making the composite material have serious friction against the metal during the friction process, and the friction coefficient is significant. When the content of GF in the rubber matrix exceeded 3 phr, the aggregates of SiO2 particles in the rubber matrix continued to increase, which made the friction between the composite material and the metal intensify during the friction process and the friction coefficient increased.

4.3.2. Metal Surface Topography

Figure 11 shows the height profile of the metal grinding head before and after sanding.
It can be seen from Figure 11 that a large number of contour peaks were ground after the metal surface of the C2 group was rubbed. There were many pits on the metal surface, and the wear was more serious. A part of the height profile peaks of the metal surface before and after friction in the C3 group was smoothed, which was reduced compared to the C2 group. After the metal surface of the C4 group was rubbed, a few height peaks were filed, the number of pits appeared less, and the wear was lighter. The metal surface of group C4 had more height peaks being ground after friction, the metal surface profile changed significantly, and the wear was more serious. The height profile of the metal surface before and after friction in the C6 group changed significantly, and a large number of height peaks were filed.

4.3.3. Metal Wear

From Figure 12, it can be seen that with the increase of GF addition, the wear amount of GF/rubber composites on metal decreased and then increased, and the GF/rubber composite with a 3 phr GF addition had minor wear on metal. There was no adsorption of GF on SiO2 particles in the composite material without GF added, and the dispersion of SiO2 particles could not be promoted, so the metal wear was severe.
During the mixing process of the composites with 1 part of GF added, some SiO2 particles were adsorbed on the surface of GF, which reduced the number of SiO2 particle agglomerates in the composites. The SiO2 particle aggregates have complex and irregular shapes, making the composites produce severe friction with the metal during the friction process. With the reduction of SiO2 particle agglomerates in the composites, the abrasive wear of the composites to metals was gradually weakened. With the increase of the degree of the silanization reaction, the amount of high-temperature ethanol–water vapor increased, which increased the proportion of corrosion wear.
When 3 phr of GF was added, the surface area of GF that could adsorb SiO2 particles increased, and GF could adsorb more SiO2 particles, which better promoted the dispersion of SiO2 particles and further reduced the number of silica aggregates. Therefore, the GF/rubber composite with 1 phr of GF and the GF/rubber composite with 3 phr of GF had minor wear on the metal. As can be seen from Figure 12, the experimental group added 3 phr of GF, relatively. The wear amount of the experimental groups with 0, 1, 5, and 7 phr of GF added increased by 60%, 38.7%, 116%, and 146.7%, respectively.

4.3.4. Wear Ratio

The abrasive wear amount of the metal grinding head is shown in Figure 13.
No high-temperature steam was sprayed during this experiment, and there was no corrosion and wear of metal, so the data measured in this experiment were the amount of abrasive wear. As can be seen from Figure 13, the experimental group added 3 phr of GF, relatively. The abrasive wear of the experimental groups with 0, 1, 5, and 7 phr of GF increased by 66.7%, 42%, 124.6%, and 165.2%, respectively. Compared with the above experiment, the wear ratio was obtained, and the wear ratio image is shown in Figure 14.
The increase in the degree of silanization reaction increased the amount of high-temperature ethanol–water mixed vapor, which increased the proportion of corrosive wear. When the GF addition amount was 3 phr, the contact area between GF and SiO2 particles reached the maximum, and the SiO2 particles were best dispersed. Therefore, the GF/rubber composite with a 3 phr GF addition had the most significant degree of silanization reaction and the highest percentage of corrosion and wear. Compared with the experimental groups with 0, 1, 5, and 7 phr of GF added, the corrosion wear rate with 3 phr of GF increased by 115.2%, 56.4%, 116.8%, and 748%, respectively.

4.3.5. Roughness

From Figure 15, it can be seen that the amount of roughness change on the metal surface decreased and then increased with the increase of GF addition, which is related to the adsorption of GF to SiO2 particles. As can be seen from Figure 15, the experimental group added 3 phr of GF, relatively. The roughness variation of the experimental groups with 0, 1, 5, and 7 phr of GF increased by 191.8%, 97.4%, 103%, and 232%, respectively. With the increase of GF addition, the number of silica aggregates decreased. Silica is more complex and wears seriously on metal, so the surface roughness of metal gradually decreased. When the content of GF in the composite matrix exceeded 3 phr, the agglomeration of SiO2 particles in the composite material increased continuously, and the wear of the composite material to the metal increased. This resulted in severe wear on the metal surface and increasing roughness variation.

5. Conclusions

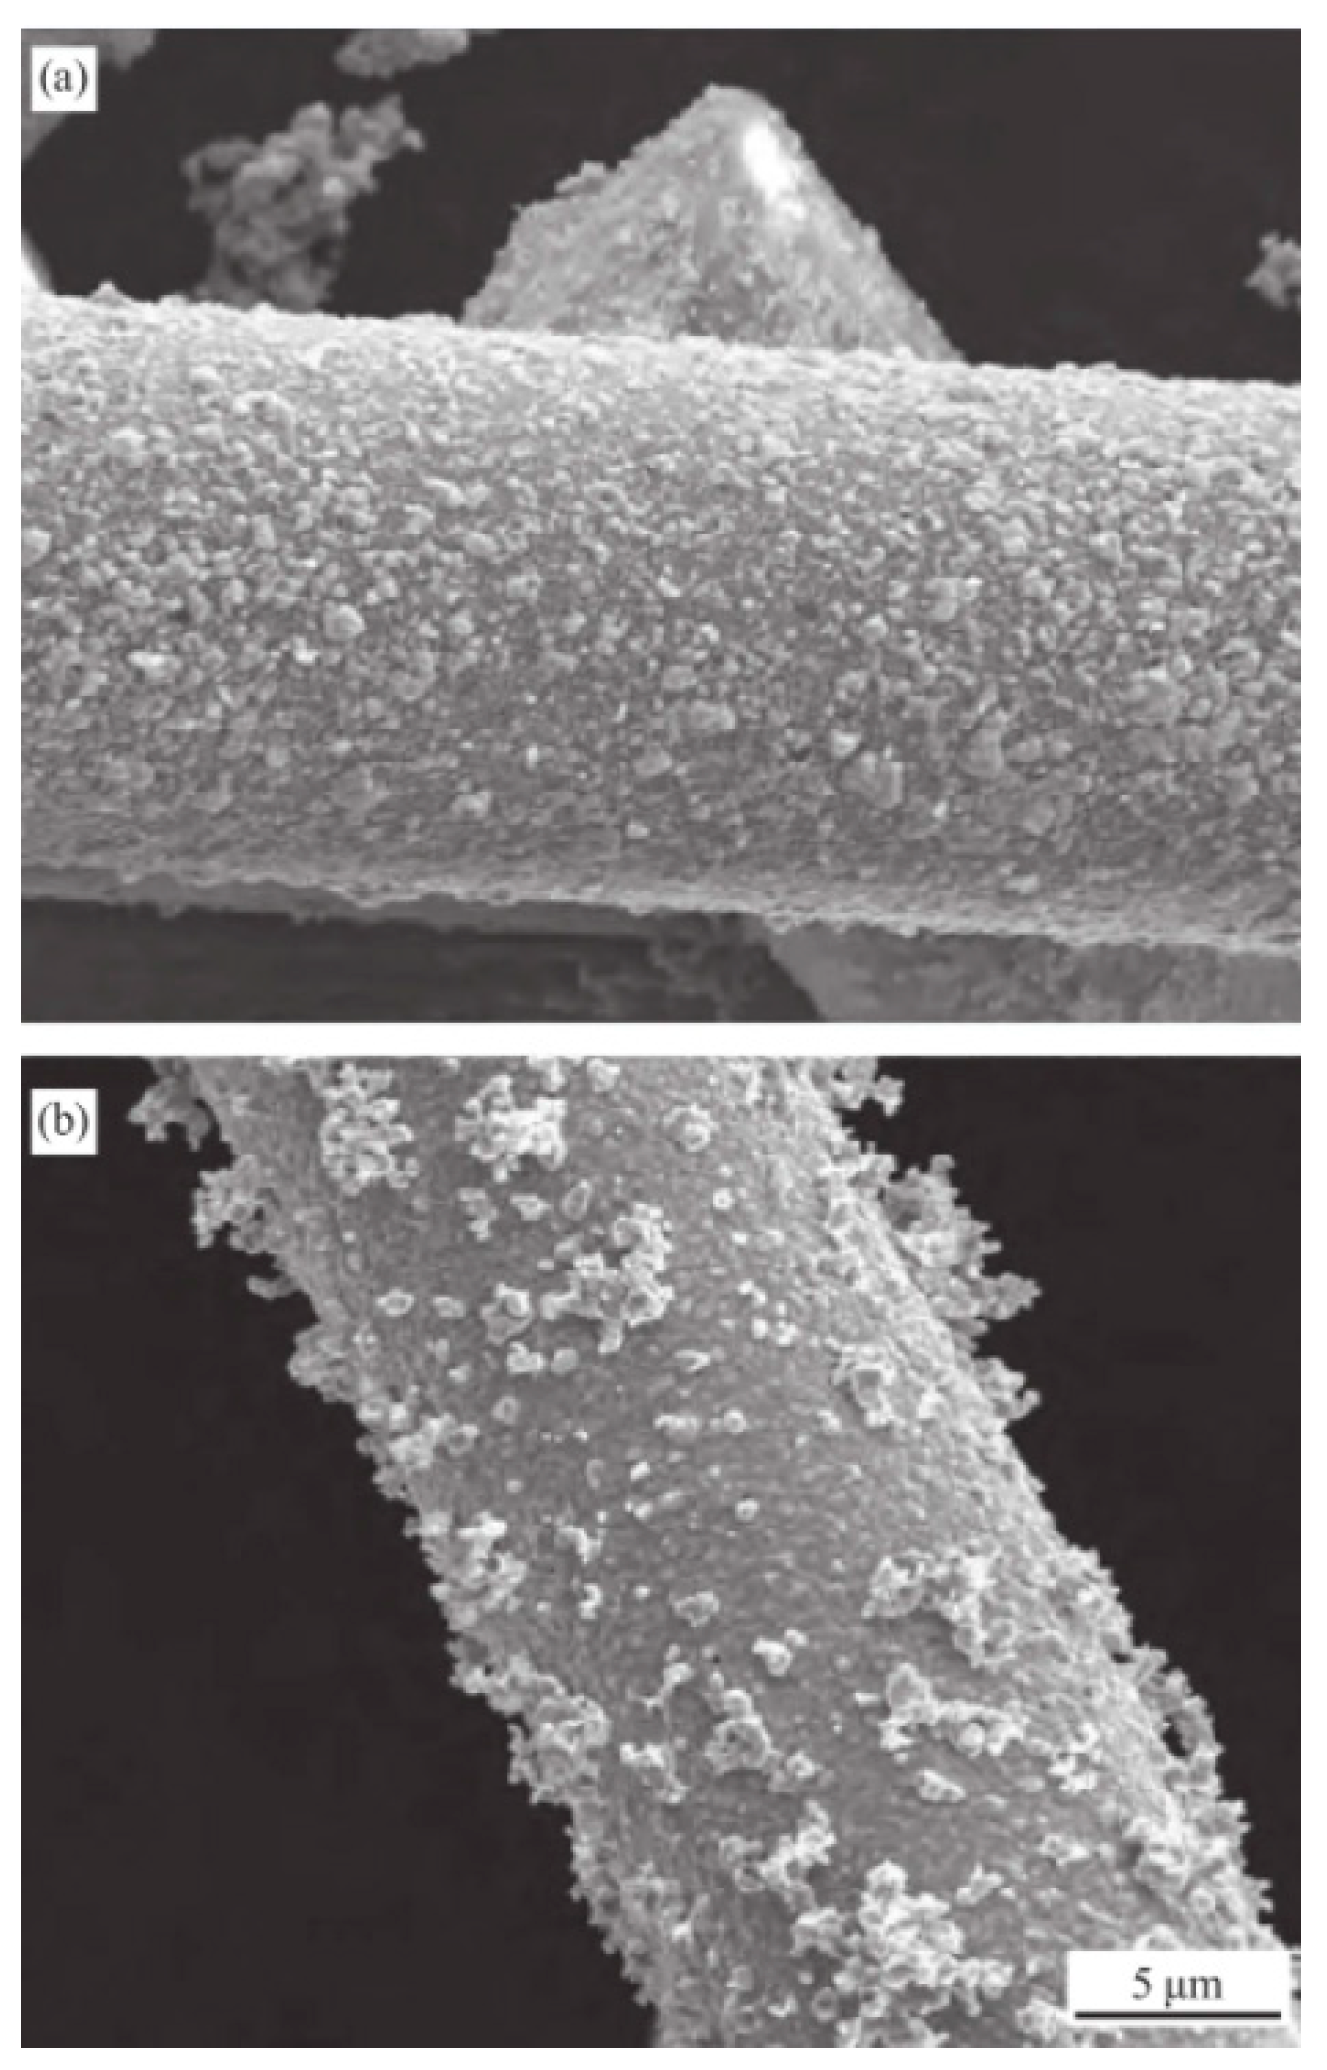
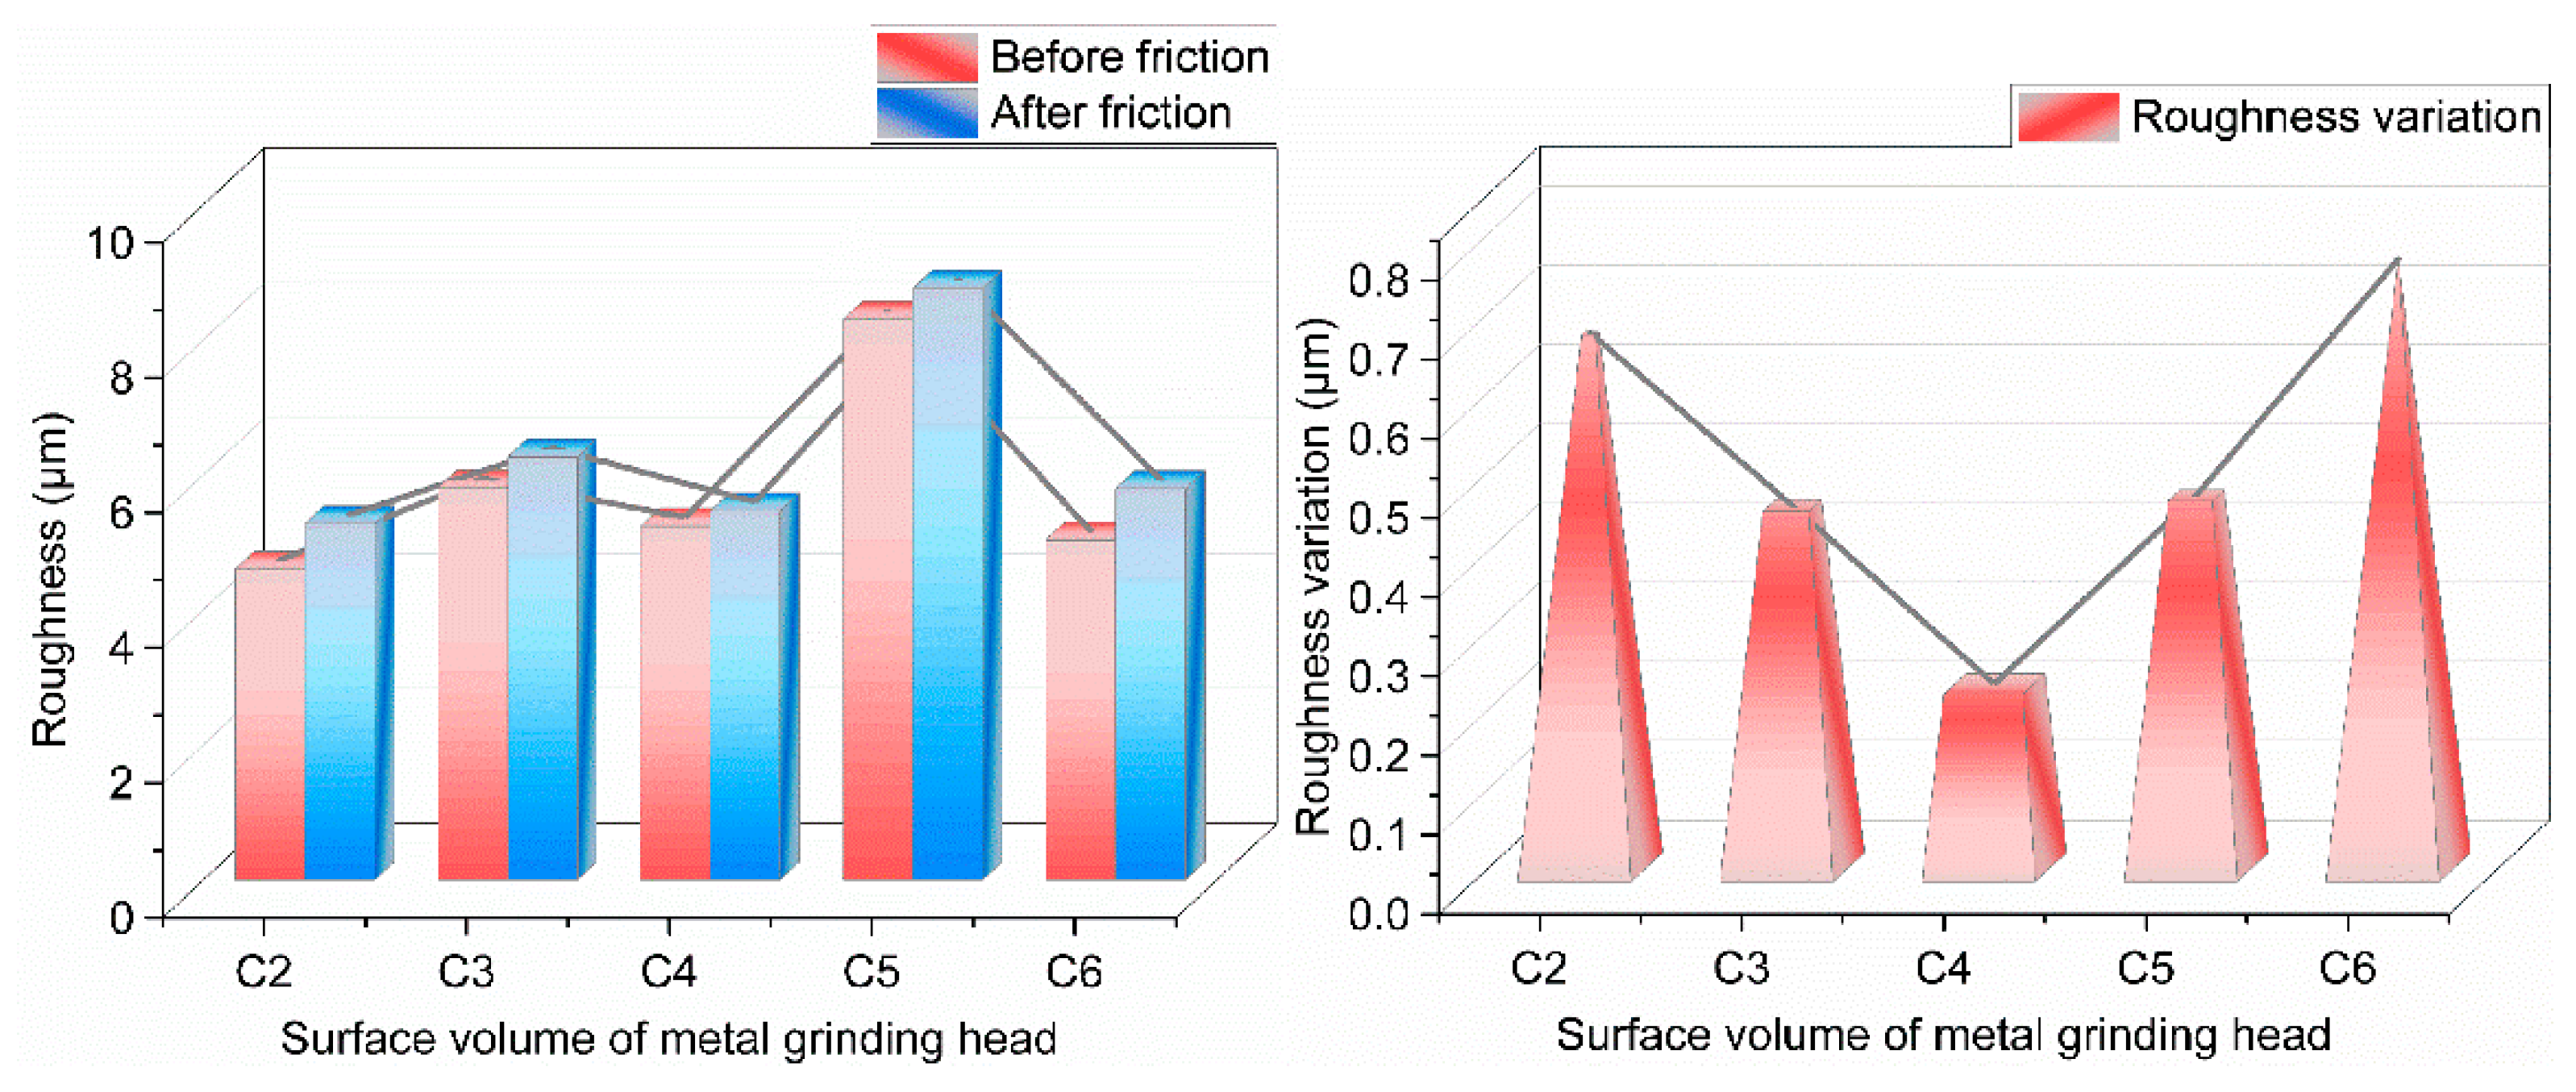
This study found that GF has a large surface area, and its surface can adsorb nano-SiO2 particles. With the increase of GF content in the composite matrix, the degree of the silanization reaction of the composite material first increased and then decreased. The amount of high-temperature ethanol–water mixed vapor corresponds to the degree of the silanization reaction. The proportion of abrasive wear of GF/rubber composites to metals decreased and then increased, and the proportion of corrosive wear increased and then decreased. With the increase of GF addition, the contact area between GF and SiO2 particles gradually increased, the dispersion of SiO2 particles was enhanced, the number of silica aggregates decreased, and the amount of GF/rubber composites to metal wear decreased. When the addition amount of GF was 3 phr, the GF/rubber composite had the lowest wear on metal. When the addition amount of GF exceeded 3 phr, there was a large amount of accumulation between GF, the contact area between GF and SiO2 particles gradually decreased, the dispersion of SiO2 particles decreased, the number of silica aggregates increased, and the wear amount of GF/rubber composites on metal increased. In the long run, the strengthening and transforming infrastructure in the Middle East and Asia-Pacific will increase the demand for GF. This study plays a vital role in reducing the wear of the internal mixer, improving the life of the internal mixer, and ensuring the performance of GF-modified rubber.

Author Contributions

Conceptualization, D.H. and Y.C.; methodology, D.H.; software, D.H.; validating, Y.C., D.H. and Y.C.; formal analysis, D.Z.; investigation, D.H.; resources, C.W.; data curation, C.W.; writing—original draft preparation, Y.P.; writing—review and editing, D.Z.; visualization, Y.P.; supervision, D.Z.; project administration, D.Z.; funding acquisition, D.Z. All authors have read and agreed to the published version of the manuscript.

Funding

This research was funded by the National Natural Science Foundation of China [52173101] and the Natural Science Foundation of Shandong Province [ZR2020KE037]. And The APC was funded by [Dewei Zhang].

Institutional Review Board Statement

Not applicable.

Informed Consent Statement

Not applicable.

Data Availability Statement

The data presented in this study are available on request from the corresponding author.

Conflicts of Interest

The authors declare no conflict of interest.

References

  1. Rathinasamy, P.; Balamurugan, P.; Balu, S.; Subrahmanian, V. Effect of adhesive-coated glass fiber in natural rubber (NR), acrylonitrile rubber (NBR), and ethylene–propylene–diene rubber (EPDM) formulations. Effect of adhesive-coated glass fiber on the curing and tensile properties of NR, NBR, and EPDM formulations. J. Appl. Polym. Sci. 2004, 91, 1111–1123. [Google Scholar] [CrossRef]
  2. Brown, R.P. Physical Testing of Rubber; Applied Science: London, UK, 2006; pp. 1–387. [Google Scholar]
  3. Moreno, M.S.; Cela, J.J.L. Failure envelope under biaxial tensile loading for chopped glass-reinforced polyester composites. Compos. Sci. Technol. 2011, 72, 91–96. [Google Scholar] [CrossRef]
  4. Han, D.; Wang, K.; Wang, C.; Han, W. The Effect of Different Dosages of TESPT on Metal Friction and Metal Wear in the Mixing Process. Polymers 2022, 14, 2314. [Google Scholar] [CrossRef]
  5. Hashemi, S.J.; Sadooghi, A.; Rahmani, K.; Nokhbehroosta, S. Experimental determining the mechanical and stiffness properties of natural rubber FRT triangle elastic joint composite reinforcement by glass fibers and micro/nano particles. Polym. Test. 2020, 85, 106461. [Google Scholar] [CrossRef]
  6. Li, H.; Charpentier, T.; Du, J.; Vennam, S. Composite reinforcement: Recent development of continuous glass fibers. Int. J. Appl. Glass Sci. 2017, 8, 23–36. [Google Scholar] [CrossRef]
  7. Yang, C.; Wang, Z.; Wang, L.; Zhai, D. Preparation and Properties of Glass Fiber/NR/BR Composites. Chem. Times 2017, 31, 4–6, 26. [Google Scholar]
  8. Wang, W.; Ni, Z.; Yang, S.; Gu, H.; Shi, D.; Chen, M. Preparation and properties of nitrile rubber/glass fiber anti-slip material. Plast. Ind. 2021, 49, 131–136. [Google Scholar]
  9. Chen, J. Research and finite element analysis of mechanical properties of glass fiber-rubber composites. Value Eng. 2016, 35, 118–120. [Google Scholar]
  10. Lv, F.; Liu, J.; Wang, Q.; Jia, C.; Li, Y.; Wang, Y. Physical and mechanical properties and synergistic flame retardant properties of nano-magnesium hydroxide/glass fiber/silicon rubber composite cable materials. Synth. Rubber Ind. 2018, 41, 56–60. [Google Scholar]
  11. Hao, Q.; Shao, S.; Liang, J.; Zhang, Y. Wear resistance of chopped glass fiber/nitrile rubber composites. Synth. Rubber Ind. 2017, 40, 311–314. [Google Scholar]
  12. Shakery, A.; Alizadeh, M. Mechanical properties and strength prediction of Al/E-glass fiber composites fabricated by cross accumulative roll bonding process. J. Manuf. Process. 2021, 69, 165–172. [Google Scholar] [CrossRef]
  13. Bandaru, A.K.; Kadiyala, A.K.; Weaver, P.M.; Higgins, R.M.O. Mechanical and abrasive wear response of PTFE coated glass fabric composites. Wear 2020, 450–451, 203267. [Google Scholar] [CrossRef]
  14. Reihanian, M.; Dashtbozorg, M.; Baghal, S.L. Fabrication of glass/carbon fiber-reinforced Al-based composites through deformation bonding. J. Compos. Mater. 2019, 53, 2531–2543. [Google Scholar] [CrossRef]
  15. Hausberger, A.; Stiller, T.; Kappl, C.; Hensgen, L.; Grün, F. Improving the Tribological Properties of Technical Polymers with Metal Sulphide Compounds. Lubricants 2021, 9, 91. [Google Scholar] [CrossRef]
  16. Abbas, Z.M.; Tawfilas, M.; Khani, M.M.; Golian, K.; Marsh, Z.M.; Jhalaria, M.; Simonutti, R.; Stefik, M.; Kumar, S.K.; Benicewicz, B.C. Reinforcement of polychloroprene by grafted silica nanoparticles. Polymer 2019, 171, 96–105. [Google Scholar] [CrossRef]
  17. Pal, P.K.; De, S.K. Studies of Polymer-Filler Interaction, Network Structure, Physical Properties, and Fracture of Silica-and Clay-Filled EPDM Rubber in the Presence of a Silane Coupling Agent. Rubber Chem. Technol. 1983, 56, 737–773. [Google Scholar] [CrossRef]
  18. Ge, X.; Li, M.-C.; Li, X.X.; Cho, U.R. Effects of silane coupling agents on the properties of bentonite/nitrile butadiene rubber nanocomposites synthesized by a novel green method. Appl. Clay Sci. 2015, 118, 265–275. [Google Scholar] [CrossRef]
  19. Zhao, Y.; Qi, X.; Ma, J.; Song, L.; Yang, Y.; Yang, Q. Interface of polyimide-silica grafted with different silane coupling agents: Molecular dynamic simulation. J. Appl. Polym. Sci. 2017, 135, 45725. [Google Scholar] [CrossRef]
  20. Mohd Nor, N.; Muttalib, S.; Othman, N. Synthesis of natural rubber/palygorskite nanocomposites via silylation and cation exchange. In Nanoclay Reinforced Polymer Composites; Jawaid, M., el KacemQaiss, A., Bouhfid, R., Eds.; Springer: Cham, Switzerland, 2016; pp. 261–289. [Google Scholar]
  21. Vinogradov, G.; Mustafaev, V.; Podolsky, Y. A study of heavy metal-to-plastic friction duties and of the wear of hardened steel in the presence of polymers. Wear 1965, 8, 358–373. [Google Scholar] [CrossRef]
  22. Min, K.; Suh, K.G. Experiments and modeling of flow of elastomers in an internal mixer with intermeshing rotors. Polym. Eng. Sci. 1991, 31, 779–788. [Google Scholar] [CrossRef]
  23. Gorokhovskii, G.A.; Chernenko, P.A.; Smirnov, V.A. Effect of polymers on the abrasive dispersion of carbon steel. Mater. Sci. 1974, 8, 557–560. [Google Scholar] [CrossRef]
  24. Li, Z.H.; Zhang, J.; Chen, S.J. Effects of carbon blacks with various structures on vulcanization and reinforcement of filled ethylene-propylene-diene rubber. Express Polym. Lett. 2008, 2, 695–704. [Google Scholar] [CrossRef]
  25. Presti, D.L. Recycled Tyre Rubber Modified Bitumens for road asphalt mixtures: A literature review. Constr. Build. Mater. 2013, 49, 863–881. [Google Scholar] [CrossRef]
  26. Lopez, G.; Alvarez, J.; Amutio, M.; Mkhize, N.; Danon, B.; van der Gryp, P.; Görgens, J.; Bilbao, J.; Olazar, M. Waste truck-tyre processing by flash pyrolysis in a conical spouted bed reactor. Energy Convers. Manag. 2017, 142, 523–532. [Google Scholar] [CrossRef]
  27. Martinez, J.D.; Puy, N.; Murillo, R.; Garcia, T.; Navarro, M.V.; Mastral, A.M. Waste tyre pyrolysis—A review. Renew. Sustain. Energy Rev. 2013, 23, 179–213. [Google Scholar] [CrossRef]
  28. Békési, N.; Váradi, K.; Felhős, D. Wear Simulation of a Reciprocating Seal. J. Tribol. 2011, 133, 031601. [Google Scholar] [CrossRef]
  29. Blackford, J.R.; Skouvaklis, G.; Purser, M.; Koutsos, V. Friction on ice: Stick and slip. Faraday Discuss. 2012, 156, 243–254. [Google Scholar] [CrossRef]
  30. Caessa, J.; Vuchkov, T.; Yaqub, T.; Cavaleiro, A. On the Microstructural, Mechanical and Tribological Properties of Mo-Se-C Coatings and Their Potential for Friction Reduction against Rubber. Materials 2021, 14, 1336. [Google Scholar] [CrossRef]
  31. Cheng, H.M.; Chen, X.Y.; Chen, X.L.; Liu, H.C. Research on Key Factors of Sealing Performance of Combined Sealing Ring. Appl. Sci. 2022, 12, 714. [Google Scholar] [CrossRef]
  32. Dangnan, F.; Espejo, C.; Liskiewicz, T.; Gester, M.; Neville, A. Friction and wear of additive manufactured polymers in dry contact. J. Manuf. Process. 2020, 59, 238–247. [Google Scholar] [CrossRef]
  33. Dong, C.; Yuan, C.; Bai, X.; Li, J.; Qin, H.; Yan, X. Coupling mechanism between wear and oxidation processes of 304 stainless steel in hydrogen peroxide environments. Sci. Rep. 2017, 7, 2327. [Google Scholar] [CrossRef] [PubMed]
  34. Kim, H.; Park, K.; Lee, M.-Y. Biocompatible Dispersion Methods for Carbon Black. Toxicol. Res. 2012, 28, 209–216. [Google Scholar] [CrossRef] [PubMed] [Green Version]
  35. Fan, W.; Liu, Y.; Song, X.; Cheng, J.; Li, J. Influencing Mechanism of Rubber Wheel on Contact Pressure and Metal Removal in Corrugated Rail Grinding by Abrasive Belt. J. Manuf. Sci. Eng. 2018, 140, 124501. [Google Scholar] [CrossRef]
  36. Feng, D.; Shen, M.-X.; Peng, X.-D.; Meng, X.-K. Surface Roughness Effect on the Friction and Wear Behaviour of Acrylonitrile–Butadiene Rubber (NBR) Under Oil Lubrication. Tribol. Lett. 2016, 65, 10. [Google Scholar] [CrossRef]
  37. Han, D.; Li, S.; Xiao, X.; Xu, M.; Chen, Y.; Wang, C.; Bian, H. Effect of different dosages of carbon nanotube s on the metal friction and metal wear in the mixing process. Polym. Compos. 2021, 42, 6051–6064. [Google Scholar] [CrossRef]
  38. Han, D.; Pan, Y.; Xue, J.; Yu, B.; Yan, G.; Wang, C.; Wang, K.; Pan, Y. Effect of adding different silane coupling agents on metal friction and wear in mixing process. J. Appl. Polym. Sci. 2021, 138, 51408. [Google Scholar] [CrossRef]
  39. Han, D.; Wang, K.; Bian, H.; Yan, G.; Wang, C. Effect of different amounts of graphene on metal friction and wear during the mixing process. Polym. Compos. 2021, 42, 5075–5089. [Google Scholar] [CrossRef]
  40. Han, D.; Yan, G.; Li, S.; Pan, Y.; Chen, Y.; Wang, C.; Liu, H. Study on mechanical properties and antifriction of calcium powder filled rubber. Polym. Compos. 2021, 43, 874–888. [Google Scholar] [CrossRef]
  41. Han, D.; Zhang, S.; Wang, K.; Pan, Y.; Zhu, D.; Wang, C.; Pan, Y. A comparison of the effects of traditional and wet mixing processes of rubber on metal friction and wear. J. Appl. Polym. Sci. 2021, 138, 50761. [Google Scholar] [CrossRef]
  42. Han, D.; Wang, K.; Yan, G.; Pan, Y.; Xue, J.; Wang, C.; Bian, H. Effect of the ratio of graphene oxide(GO) and multi-walled carbon nanotubes(MWCNTs) on metal friction and wear during mixing. Polym. Test. 2021, 106, 107441. [Google Scholar] [CrossRef]
  43. Han, D.; Pan, Y.; Li, S.; Xu, M.; Xiao, X.; Hao, X.; Huang, E.; Wang, C.; Bian, H. Friction and wear of Stellite 6B during sliding against rubber compound with varied carbon fiber content. Polym. Test. 2021, 106, 107470. [Google Scholar] [CrossRef]
  44. Han, D.; Zhang, S.; Pan, Y.; Wang, C. Simulation and experimental research on the wear of synchronous quadruple rotor of an internal mixer during the mixing process. Eng. Fail. Anal. 2022, 139. [Google Scholar] [CrossRef]
Figure 1. SEM image of GF. ((a) magnification is 10 μm, (b) magnification is 5 μm).
Polymers 14 02849 g001
Figure 2. Distribution of silanization reaction degree.
Polymers 14 02849 g002
Figure 3. Hake internal mixer.
Polymers 14 02849 g003
Figure 4. CSM friction and wear tester.
Polymers 14 02849 g004
Figure 5. One-stage reactions.
Polymers 14 02849 g005
Figure 6. Two-stage reaction.
Polymers 14 02849 g006
Figure 7. Stress–strain curves of GF/rubber composites with different ratios.
Polymers 14 02849 g007
Figure 8. Dispersion images (the scale bar is 100:1).
Polymers 14 02849 g008
Figure 9. Silylation reaction image.
Polymers 14 02849 g009
Figure 10. The average coefficient of friction of GF/rubber composites with different ratios against metal.
Polymers 14 02849 g010
Figure 11. Height profile of metal grinding head before and after friction.
Polymers 14 02849 g011aPolymers 14 02849 g011b
Figure 12. Metal wear volume. ((A) is the volume of the metal before and after friction, and (B) is the volume change).
Polymers 14 02849 g012
Figure 13. Metal wear volume without spraying high-temperature ethanol–water vapor mixture.
Polymers 14 02849 g013
Figure 14. The proportion of abrasive wear and corrosion wear.
Polymers 14 02849 g014
Figure 15. Metal surface roughness.
Polymers 14 02849 g015
Table 1. Experimental instruments.
Experimental InstrumentsCountry of ProductionManufacturers
Hake mixerChinaQingdao University of Science and Technology
BL-6157 double-roll rolling millChinaDongguan Baolun Precision Testing Instrument Co.
DisperGRADER Dispersion MeterAmericaAlpha Corporation
LEXT OLS5000 3D laser measurement microscopeJapanProducts of Olympus Corporation
CSM-friction and abrasion testerSwitzerlandTribometer Corporation
RPA2000 Rubber Processability AnalyzerAmericaAlpha Corporation
ZT-2588S Steam GeneratorChinaZhiteng Company
Table 2. Formulation.
Raw MaterialC1C2C3C4C5C6
TSR20151515151515
BR900025.525.525.525.525.525.5
RC2557S828282828282
Silica115MP454545454545
GF001357
ZnO222222
TESPT066666
DPG0.80.80.80.80.80.8
SAD222222
4020222222
CZ1.81.81.81.81.81.8
S1.31.31.31.31.31.3
Table 3. Mechanical blending process.
Hake Mixer
Time (s)T (°C)Ingredients
070BR9000, RC2557S, TSR20
40 TESPT, GF, DPG, SAD, 4020, ZnO, 1/2 Silica
70 1/2 Silica
150120Sweep
240135Sweep, Sampleing
300145Discharge
Table 4. Testing method.
StageFrequency/HzT/°CStrainTest Items
10.1600.28% G’ (01)
21600.28–40% G’ (02)
31600.28–40% G’ (03)
40.1600.28% G’ (04)
51600.28–40% G’ (05)
61600.28–40% G’ (06)
Table 5. Payne effect.
FormulaC1C2C3C4C5C6
Payne effect939.19875.45700.99547.011099.811339.08
Table 6. Dispersion values.
Rubber CompoundsC1C2C3C4C5C6
Dispersion5.285.976.587.786.614.69
Table 7. Silylation reaction index.
Compounding RubberC2C3C4C5C6
Silylation reaction index0.3390.5320.8190.3310.081
Publisher’s Note: MDPI stays neutral with regard to jurisdictional claims in published maps and institutional affiliations.

