
An Investigation on the Hardness of Polylactic Acid Parts Fabricated via Fused Deposition Modeling


 , ,
, ,
Abstract
:1. Introduction
2. Experimental Campaign
3. Results
4. Conclusions
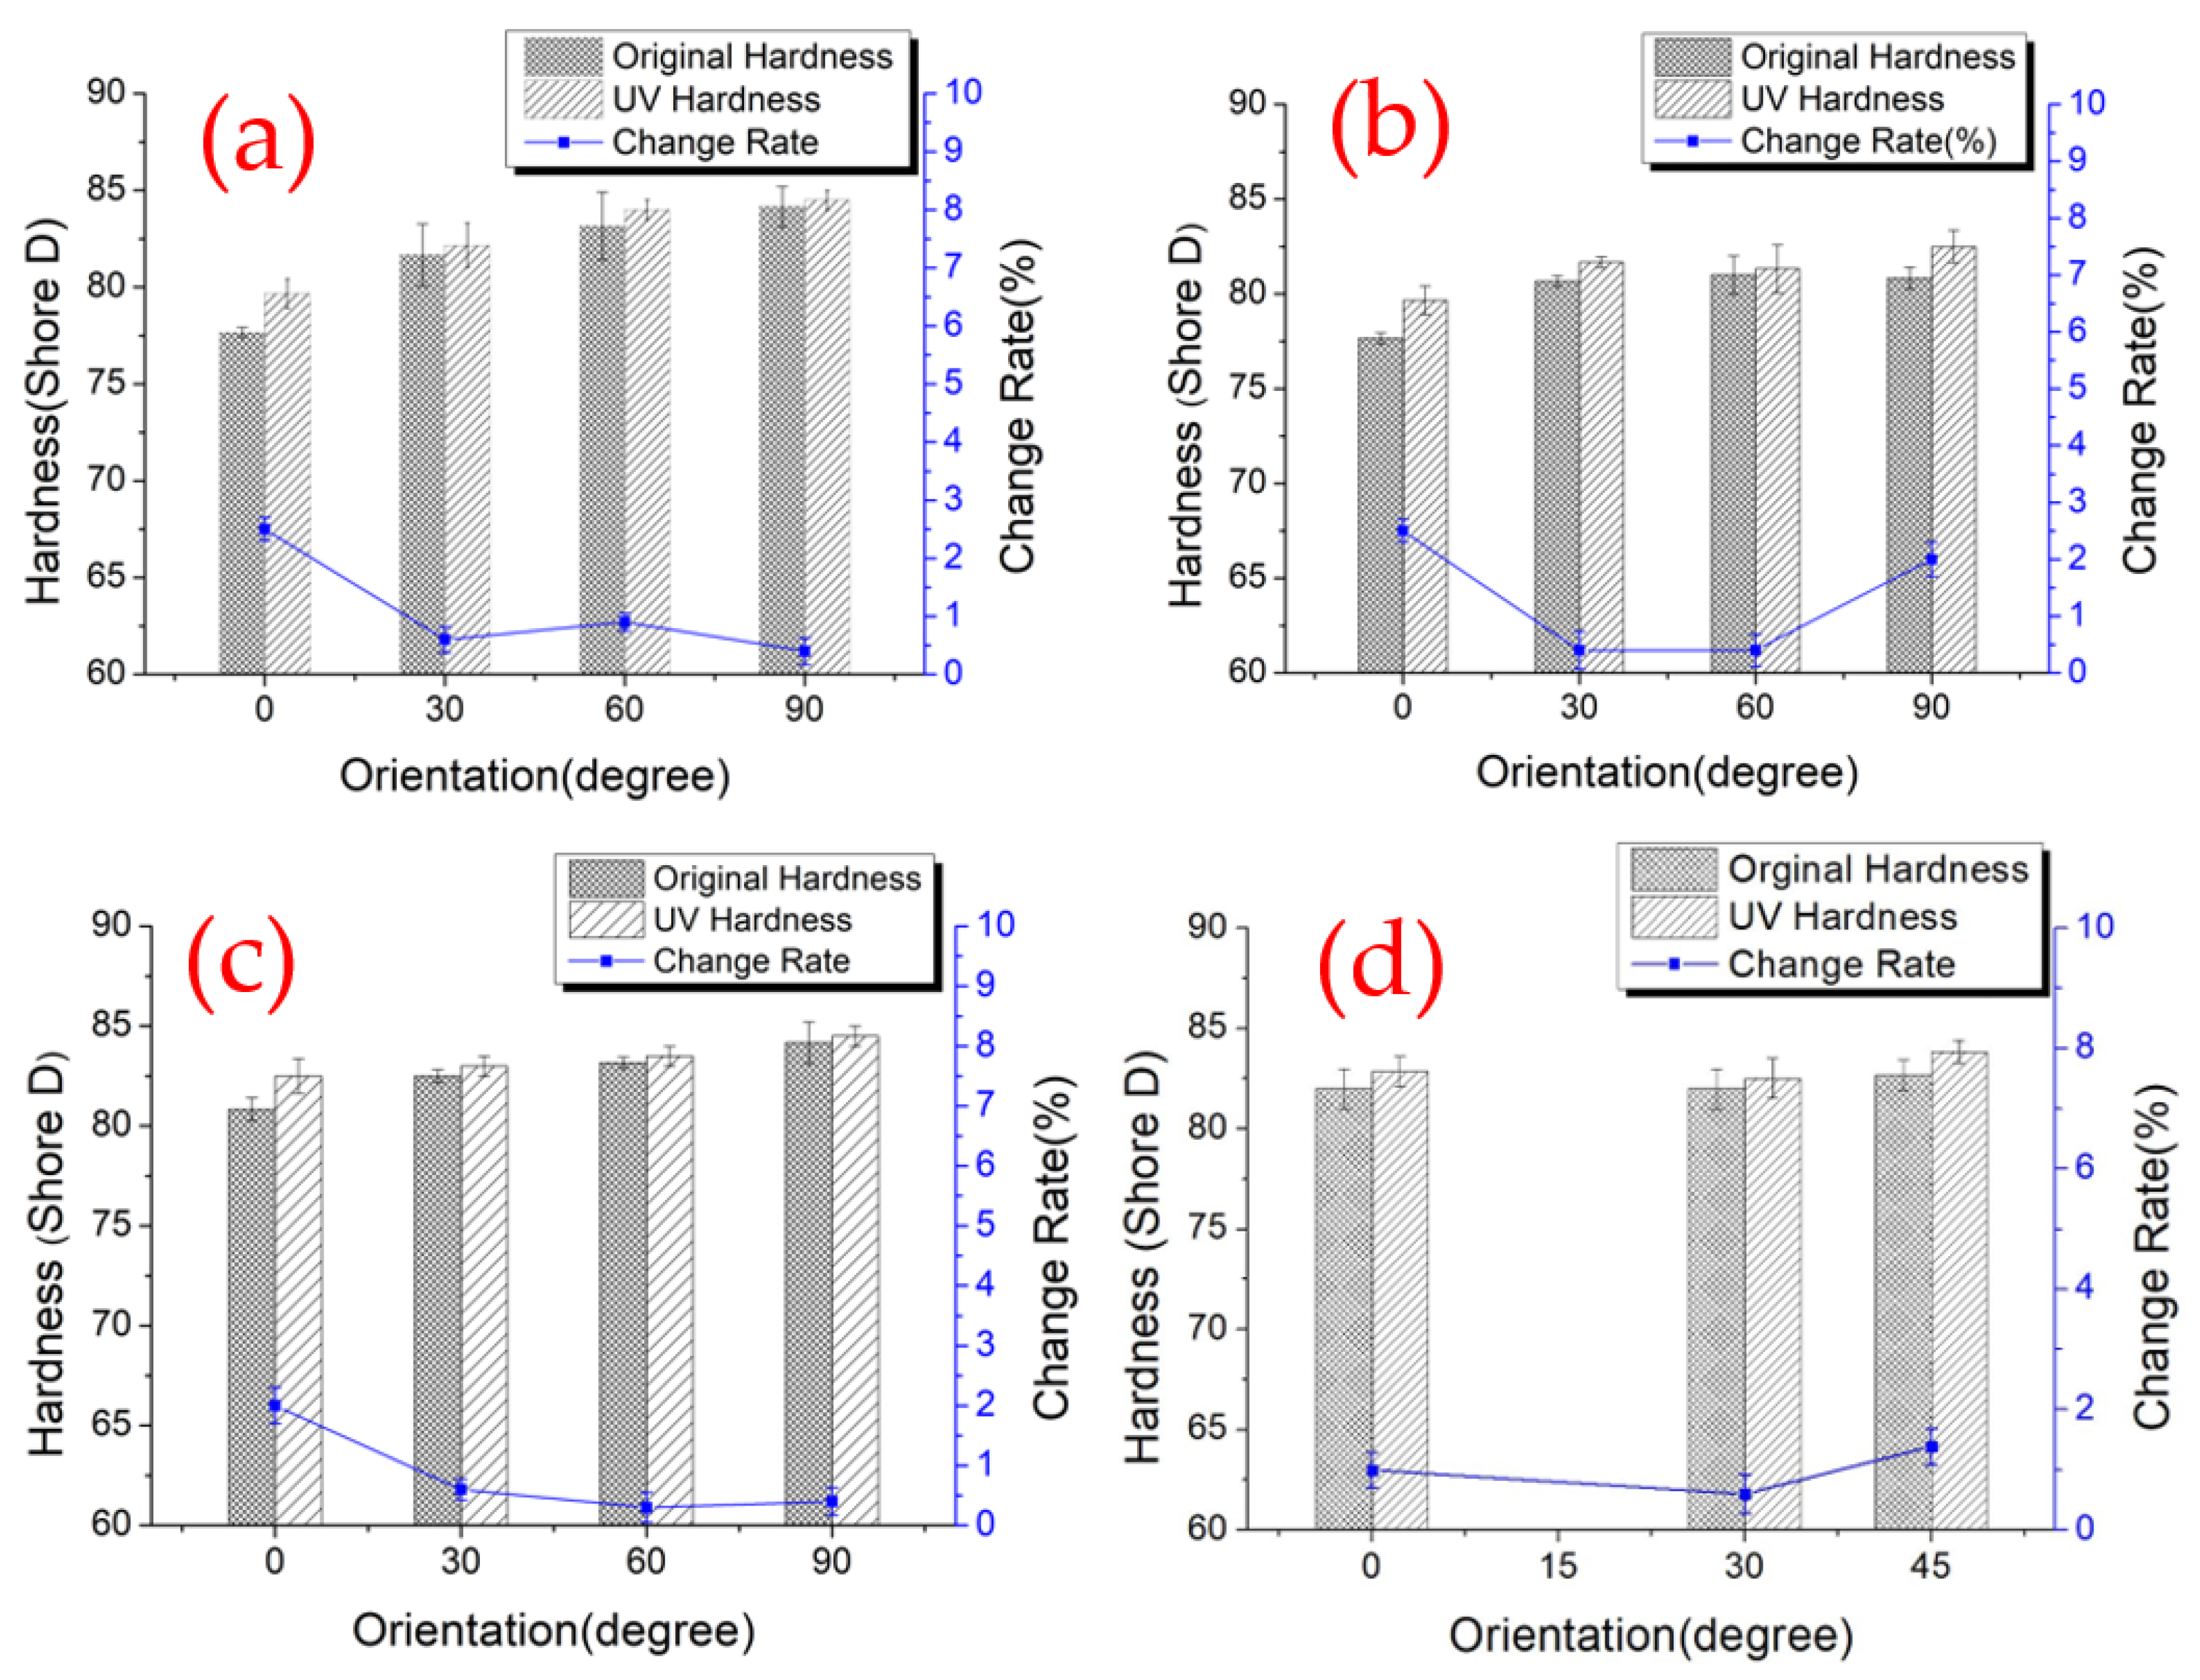
- Changing the printing angle affected the hardness property of the PLA material significantly. Most of the hardness trend of the flat surface basically followed the linear relationship with the printing angle except for the X-type samples. The flat surface of R type 90/0 samples demonstrated the highest hardness value of 83.3; on the contrary, the lowest value of the flat surface of 77.3 appears on Y60, Y90 and Z0 samples.
- The hardness property of the edge surface increased with the printing angle, but the concave surface of the X0° and Y0° samples caused a lower hardness value due to their built orientation. The same situation was also replicated on flat-type samples, for which the 0/−90 sample has the lowest value of 77.3.
- The hardness value collected from the flat surface did not show significant impact via the change in the raster angle.
- The UV curing process enhanced the hardness property of the PLA material, while the extent of the change rate depended on the printing method of the tested sample.
- The tested samples printed with a low infill ratio probably demonstrated an irregular trend on the hardness measurements results because of the empty inner structure, and a higher infill ratio should be used in future study for better stability in the experiment.
Author Contributions
Funding
Acknowledgments
Conflicts of Interest
References
- Leland, W.; Tyler, S. Investigations of Fused Deposition Modeling for Perovskite Active Solar Cells. Polymers 2022, 14, 317. [Google Scholar] [CrossRef]
- Khalil, K.; Ali, A.M.; Ibrahim, D.; Kambiz, V. Thermal analysis of fused deposition modeling process based finite element method: Simulation and parametric study. Numer. Heat Transf. Part A Appl. 2022, 81, 94–118. [Google Scholar] [CrossRef]
- Dave, H.K.; Patel, B.H.; Rajpurohit, S.R.; Prajapati, A.R.; Dumitru, N. Effect of multi-infill patterns on tensile behavior of FDM printed parts. J. Braz. Soc. Mech. Sci. Eng. 2021, 43, 23. [Google Scholar] [CrossRef]
- Radhakrishna, G.; Dugad, R.; Abhishek, G. Morphological evaluation of microcellular foamed composites developed through gas batch foaming integrating Fused Deposition Modeling (FDM) 3D printing technique. Cell. Polym. 2021, 40, 244–266. [Google Scholar] [CrossRef]
- Wickramasinghe, S.; Do, T.; Tran, P. FDM-Based 3D Printing of Polymer and Associated Composite: A Review on Mechanical Properties, Defects and Treatments. Polymers 2020, 12, 1529. [Google Scholar] [CrossRef]
- Hamid Reza, V.; Mohammadali, S.; Saeedeh, V.; Joseph, F.; Sofiane, K.; Abbas, T. Multi-scale damage analysis and fatigue behavior of PLA manufactured by fused deposition modeling. Rapid Prototyp. J. 2021, 27, 371–378. [Google Scholar] [CrossRef]
- Camargo, J.C.; Machado, A.R.; Almeida, E.C.; De Almeida, V.H.M. Mechanical and electrical behavior of ABS polymer reinforced with graphene manufactured by the FDM process. Int. J. Adv. Manuf. Technol. 2021, 119, 1019–1033. [Google Scholar] [CrossRef]
- Mohan, R.; Venkatraman, R.; Raghuraman, S. Experimental analysis on density, micro-hardness, surface roughness and processing time of Acrylonitrile Butadiene Styrene (ABS) through Fused Deposition Modeling (FDM) using Box Behnken Design (BBD). Mater. Today Commun. 2021, 27, 102353. [Google Scholar] [CrossRef]
- Damir, H.; Adi, P. Influence of carbon fibers on mechanical properties of materials in fdm technology. Ann. DAAAM Proc. Int. DAAAM Symp. 2019, 30, 334–342. [Google Scholar] [CrossRef]
- Hsueh, M.H.; Lai, C.J.; Wang, S.H.; Zeng, Y.S.; Hsieh, C.H.; Pan, C.Y.; Huang, W.C. Effect of printing parameters on the thermal and mechanical properties of 3d-printed pla and petg, using fused deposition modeling. Polymers 2021, 13, 1758. [Google Scholar] [CrossRef]
- Barrios, J.M.; Romero, P.E. Improvement of surface roughness and hydrophobicity in PETG parts manufactured via fused deposition modeling (FDM): An application in 3D printed self-cleaning parts. Materials 2019, 12, 2499. [Google Scholar] [CrossRef] [PubMed] [Green Version]
- Guo, C.; Liu, X.; Liu, G. Surface finishing of fdm-fabricated amorphous polyetheretherketone and its carbon-fiber-reinforced composite by dry milling. Polymers 2021, 13, 2175. [Google Scholar] [CrossRef] [PubMed]
- Sneha, P.; Balamurugan, K.; Kalusuraman, G. Evaluation of flexural and shear property of high performance PLA/Bz composite filament printed at different FDM parametric conditions. Int. J. High Perform. Syst. Archit. 2021, 10, 119–127. [Google Scholar] [CrossRef]
- Hu, B.; Xing, Z.; Wu, W.; Zhang, X.; Zhou, H.; Du, C.; Shan, B. Enhancing the mechanical properties of SCF/PEEK composites in FDM via process-parameter optimization. High Perform. Polym. 2021, 33, 914–923. [Google Scholar] [CrossRef]
- Lyu, Y.; Chen, Y.L.; Lin, L.Y.; Schlarb, A.K.; Li, Y.; Shi, X.Y. Architecture of covalent bonds between filament layers to enhance performance of 3D printing biodegradable polymer blends. Polym. Test. 2022, 106, 107456. [Google Scholar] [CrossRef]
- Rajpurohit, S.R.; Dave, H.K. Effect of process parameters on tensile strength of FDM printed PLA part. Rapid Prototyp. J. 2018, 24, 1317–1324. [Google Scholar] [CrossRef]
- Liu, Z.B.; Lei, Q.; Xing, S. Mechanical characteristics of wood, ceramic, metal and carbon fiber-based PLA composites fabricated by FDM. J. Mater. Res. Technol. 2019, 8, 3741–3751. [Google Scholar] [CrossRef]
- Ding, S.J.; Kong, L.Y.; Jin, Y.J.; Lin, J.B.; Chang, C.; Li, H.Y.; Liu, E.Q.; Liu, H.T. Influence of the molding angle on tensile properties of FDM parts with orthogonal layering. Polym. Adv. Technol. 2020, 31, 873–884. [Google Scholar] [CrossRef]
- Kumar, S.; Singh, R.; Singh, T.P.; Batish, A. On flexural and pull out properties of 3D printed PLA based hybrid composite matrix. Mater. Res. Express 2020, 7, 015330. [Google Scholar] [CrossRef]
- Butt, J.; Oxford, P.; Sadeghi-Esfahlani, S.; Ghorabian, M. Hybrid Manufacturing and Mechanical Characterization of Cu/PLA Composites Arabian. J. Sci. Eng. 2020, 45, 9339–9356. [Google Scholar] [CrossRef]
- Vicente, C.M.S.; Martins, T.S.; Leite, M.; Ribeiro, A.; Reis, L. Influence of fused deposition modeling parameters on the mechanical properties of ABS parts. Polym. Adv. Technol. 2020, 31, 501–507. [Google Scholar] [CrossRef]
- Bedi, P.; Singh, R.; Ahuja, I. Multifactor optimization of FDM process parameters for development of rapid tooling using SiC/Al2O3-reinforced LDPE filament. J. Thermoplast. Compos. Mater. 2020, 33, 581–598. [Google Scholar] [CrossRef]
- Hervan, S.Z.; Altınkaynak, A.; Parlar, Z. Hardness, friction and wear characteristics of 3D-printed PLA polymer. Proc. Inst. Mech. Eng. Part J J. Eng. Tribol. 2021, 235, 1590–1598. [Google Scholar] [CrossRef]
- Chohan, J.S.; Singh, R.; Boparai, K.S. Parametric optimization of fused deposition modeling and vapour smoothing processes for surface finishing of biomedical implant replicas. Measurement 2016, 94, 602–613. [Google Scholar] [CrossRef]
- Valerga, A.P.; Fernandez-Vidal, S.R.; Girot, F.; Gamez, A.J. On the Relationship between Mechanical Properties and Crystallisation of Chemically Post-Processed Additive Manufactured Polylactic Acid Pieces. Polymers 2020, 12, 941. [Google Scholar] [CrossRef] [Green Version]
- Felices, N.B.; Pajarito, B.B. Effect of silane-treated wollastonite on mechanical and thermal properties of 3d-printed abs via fused deposition modeling. Key Eng. Mater. 2021, 877, 61–66. [Google Scholar] [CrossRef]
- Vishal, K.; Rajkumar, K.; Sabarinathan, P.; Dhinakaran, V. Mechanical and Wear Characteristics Investigation on 3D Printed Silicon Filled Poly (Lactic Acid) Biopolymer Composite Fabricated by Fused Deposition Modeling. Silicon 2022, 14, 1–13. [Google Scholar] [CrossRef]
- Zhao, G.Q.; Thompson, M.R.; Zhu, Z.R. Effect of poly(2-ethyl-2-oxazoline) and UV irradiation on the melt rheology and mechanical properties of poly(lactic acid). J. Appl. Polym. Sci. 2019, 136, 48023. [Google Scholar] [CrossRef]
- Hsueh, M.H.; Lai, C.J.; Chung, C.F.; Wang, S.H.; Huang, W.C.; Pan, C.Y.; Zeng, Y.S.; Hsieh, C.H. Effect of Printing Parameters on the Tensile Properties of 3D-Printed Polylactic Acid (PLA) Based on Fused Deposition Modeling. Polymers 2021, 13, 2387. [Google Scholar] [CrossRef]
- Hsueh, M.H.; Lai, C.J.; Liu, K.Y.; Chung, C.F.; Wang, S.H.; Pan, C.Y.; Huang, W.C.; Hsieh, C.H.; Zeng, Y.S. Effects of Printing Temperature and Filling Percentage on the Mechanical Behavior of Fused Deposition Molding Technology Components for 3D Printing. Polymers 2021, 13, 2391. [Google Scholar] [CrossRef]
- Francis, V.; Jain, P.K. Investigation on the effect of surface modification of 3D printed parts by nanoclay and dimethyl ketone. Mater. Manuf. Processes 2018, 33, 1080–1092. [Google Scholar] [CrossRef]
- Ramachandran, M.G.; Rajeswari, N. Influence of Nano Silica on Mechanical and Tribological Properties of Additive Manufactured PLA Bio Nanocomposite. Silicon 2022, 14, 703–709. [Google Scholar] [CrossRef]
- Yuan, Z.; Liu, Q.; Pan, X.; Wang, J.; Jin, M.; Li, J. Preparation and properties of star-shaped UV-curable polyester methacrylate resins with Low viscosity derived from renewable resources. Prog. Org. Coat. 2021, 157, 106324. [Google Scholar] [CrossRef]


| Fixed Factor | Value |
|---|---|
| Nozzle temperature | 205 °C |
| Nozzle diameters | 0.4 mm |
| Printing speed | 35 mm/s |
| Infill density | 10% |
| Platform temperature | 60 °C |
| Layer thickness | 0.2 mm |
| Filament diameters | 1.75 mm |
| Controlling factor | Value |
| Printing axis | X, Y, Z |
| Printing angle | 0°, 30°, 60°, 90° |
| Raster angle | 0°/90°, 30°/−60°, 45°/−45° |
| Type | Name | Schematic Diagram |
|---|---|---|
| X−type | X0 (Y0) | 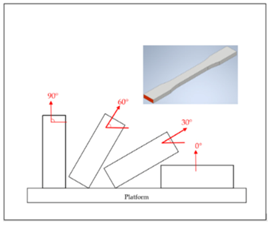 |
| X30 | ||
| X60 | ||
| X90 (Z90) | ||
| Y−type | X0 (Y0) | 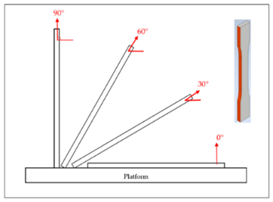 |
| Y30 | ||
| Y60 | ||
| Y90 (Z0) | ||
| Z−type | Y90 (Z0) | 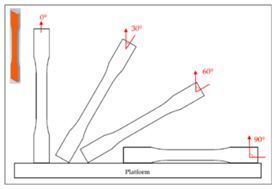 |
| Z30 | ||
| Z60 | ||
| X90 (Z90) | ||
| R−type | 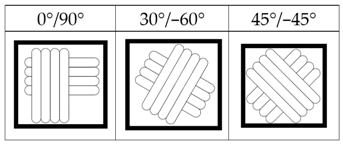 | |
| Parameter | Value |
|---|---|
| Wavelength | 365 nm |
| Rotation speed | 1 rpm |
| Operating temperature | 23 °C |
| Curing time | 60 min |
| Type of Specimens | Hardness (Original) | Hardness (UV) |
|---|---|---|
| X0 | 82.6 ± 0.7 | 83.8 ± 0.5 |
| X30 | 80.7 ± 0.8 | 82.0 ± 0.2 |
| X60 | 81.5 ± 1.6 | 82.5 ± 0.5 |
| X90 | 82.2 ± 1.5 | 84.0 ± 0.5 |
| Y0 | 82.6 ± 0.7 | 83.8 ± 0.5 |
| Y30 | 80.0 ± 1.8 | 81.1 ± 0.2 |
| Y60 | 77.3 ± 1.0 | 80.8 ± 0.5 |
| Y90 | 77.3 ± 1.7 | 80.3 ± 0.2 |
| Z0 | 77.3 ± 1.7 | 80.3 ± 1.0 |
| Z30 | 80.8 ± 0.3 | 82.0 ± 0.5 |
| Z60 | 81.5 ± 1.4 | 82.5 ± 1.3 |
| Z90 | 82.2 ± 1.5 | 84.0 ± 0.5 |
| 0°/90° | 82.1 ± 0.9 | 82.7 ± 0.7 |
| 30°/−60° | 82.0 ± 1.0 | 82.4 ± 1.0 |
| −45°/45° | 82.6 ± 0.7 | 83.8 ± 0.5 |
| Type of Specimens | Hardness (Original) | Hardness (UV) |
|---|---|---|
| X0 | 77.6 ± 0.2 | 79.7 ± 0.7 |
| X30 | 81.6 ± 1.6 | 79.6 ± 1.1 |
| X60 | 83.1 ± 1.7 | 82.2 ± 0.4 |
| X90 | 84.1 ± 1.0 | 84.5 ± 0.5 |
| Y0 | 77.6 ± 0.2 | 79.7 ± 0.7 |
| Y30 | 80.7 ± 0.2 | 81.7 ± 0.2 |
| Y60 | 81.0 ± 0.2 | 81.3 ± 1.2 |
| Y90 | 80.8 ± 0.5 | 82.4 ± 0.8 |
| Z0 | 80.8 ± 0.5 | 82.4 ± 0.8 |
| Z30 | 82.5 ± 0.5 | 83.0 ± 0.5 |
| Z60 | 83.2 ± 0.2 | 83.5 ± 0.4 |
| Z90 | 84.1 ± 1.0 | 84.5 ± 0.5 |
| 0°/90° | 76.6 ± 0.5 | 79.8 ± 0.5 |
| 30°/−60° | 78.8 ± 0.5 | 80.3 ± 1.0 |
| −45°/45° | 77.6 ± 0.2 | 79.7 ± 0.7 |
Publisher’s Note: MDPI stays neutral with regard to jurisdictional claims in published maps and institutional affiliations. |
© 2022 by the authors. Licensee MDPI, Basel, Switzerland. This article is an open access article distributed under the terms and conditions of the Creative Commons Attribution (CC BY) license (https://creativecommons.org/licenses/by/4.0/).
Share and Cite
Zeng, Y.-S.; Hsueh, M.-H.; Lai, C.-J.; Hsiao, T.-C.; Pan, C.-Y.; Huang, W.-C.; Chang, C.-H.; Wang, S.-H. An Investigation on the Hardness of Polylactic Acid Parts Fabricated via Fused Deposition Modeling. Polymers 2022, 14, 2789. https://doi.org/10.3390/polym14142789
Zeng Y-S, Hsueh M-H, Lai C-J, Hsiao T-C, Pan C-Y, Huang W-C, Chang C-H, Wang S-H. An Investigation on the Hardness of Polylactic Acid Parts Fabricated via Fused Deposition Modeling. Polymers. 2022; 14(14):2789. https://doi.org/10.3390/polym14142789
Chicago/Turabian StyleZeng, Yu-Shan, Ming-Hsien Hsueh, Chao-Jung Lai, Te-Ching Hsiao, Chieh-Yu Pan, Wen-Chen Huang, Chih-Hao Chang, and Shi-Hao Wang. 2022. "An Investigation on the Hardness of Polylactic Acid Parts Fabricated via Fused Deposition Modeling" Polymers 14, no. 14: 2789. https://doi.org/10.3390/polym14142789
APA StyleZeng, Y.-S., Hsueh, M.-H., Lai, C.-J., Hsiao, T.-C., Pan, C.-Y., Huang, W.-C., Chang, C.-H., & Wang, S.-H. (2022). An Investigation on the Hardness of Polylactic Acid Parts Fabricated via Fused Deposition Modeling. Polymers, 14(14), 2789. https://doi.org/10.3390/polym14142789