
Mesoporous Magnetic Cysteine Functionalized Chitosan Nanocomposite for Selective Uranyl Ions Sorption: Experimental, Structural Characterization, and Mechanistic Studies

 ,
,
Abstract
:1. Introduction
2. Materials and Methods
2.1. Materials
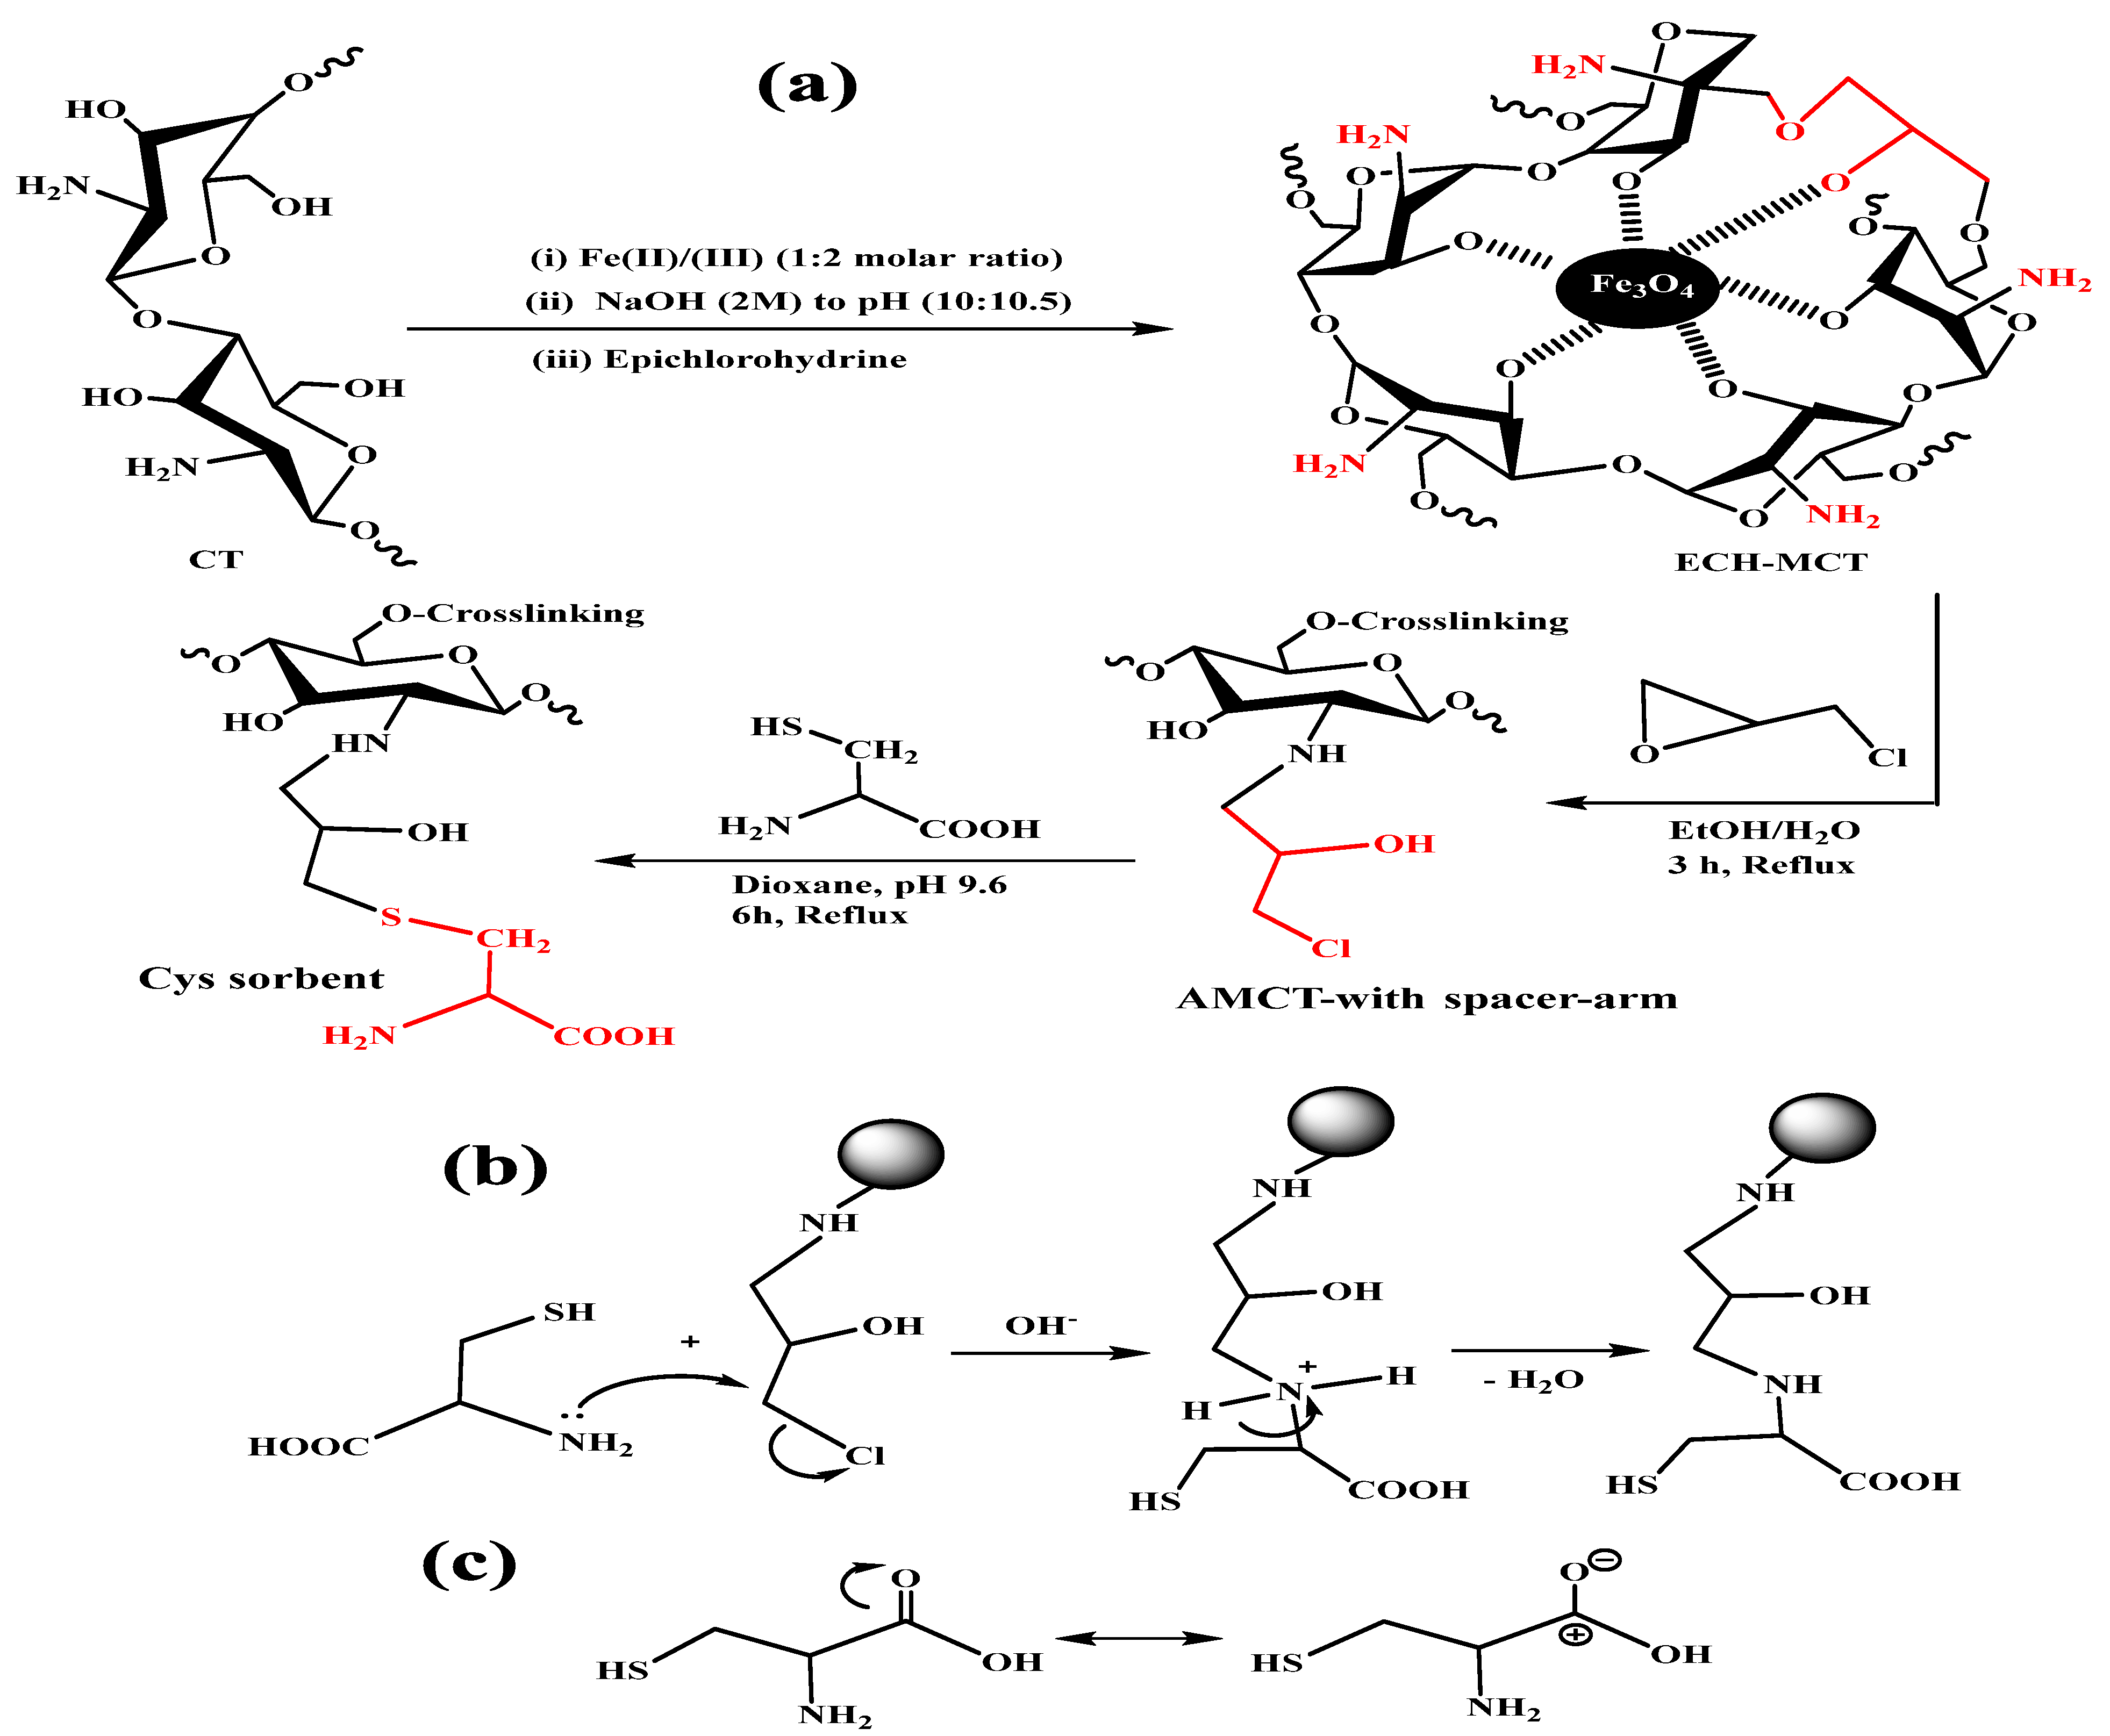
2.2. Sorbent Synthesis
2.2.1. Chitosan–Magnetite Nanocomposite Preparation
2.2.2. Nanocomposite Functionalization
2.3. Characterization
2.4. Batch Sorption and Desorption Experiments
3. Results and Discussion
3.1. Basics of Hybrid Nanocomposite
3.2. Sorbent Characterization
3.2.1. Element Analysis
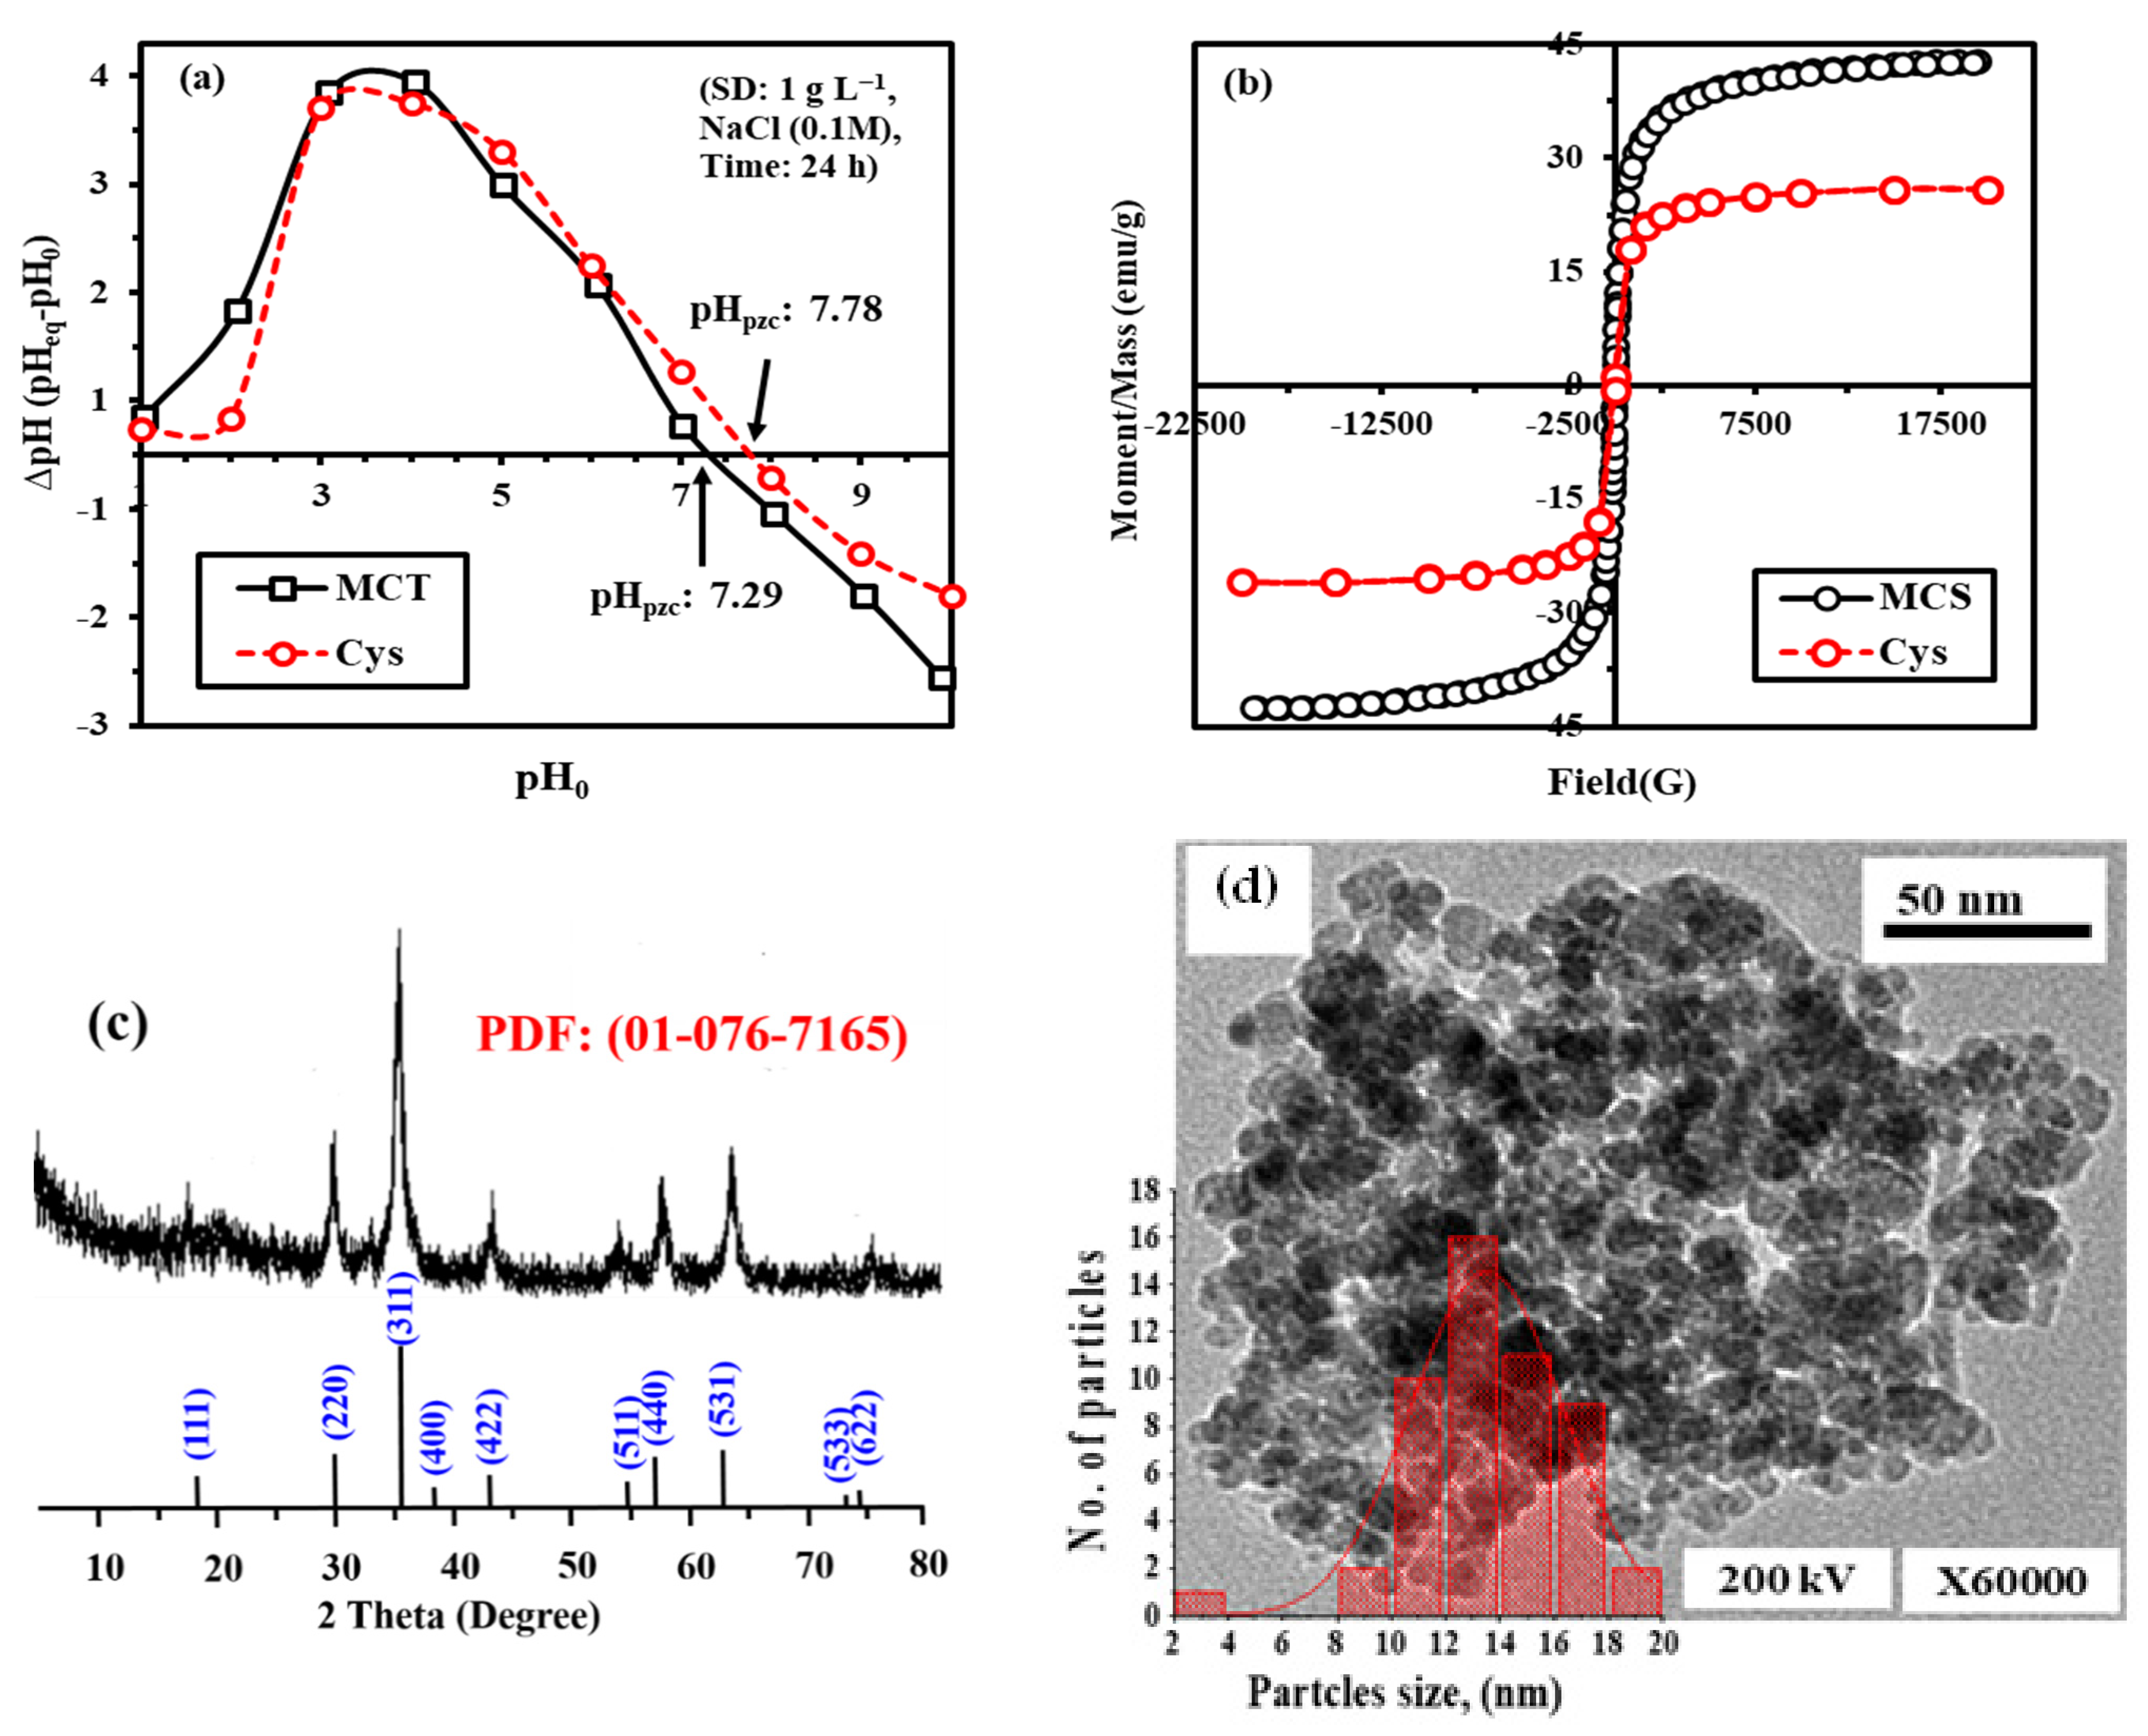
3.2.2. pH Point of Zero Charge (pHPZC) by Drift Titration Method
3.2.3. Magnetic Properties
3.2.4. XRD
3.2.5. TEM Analysis
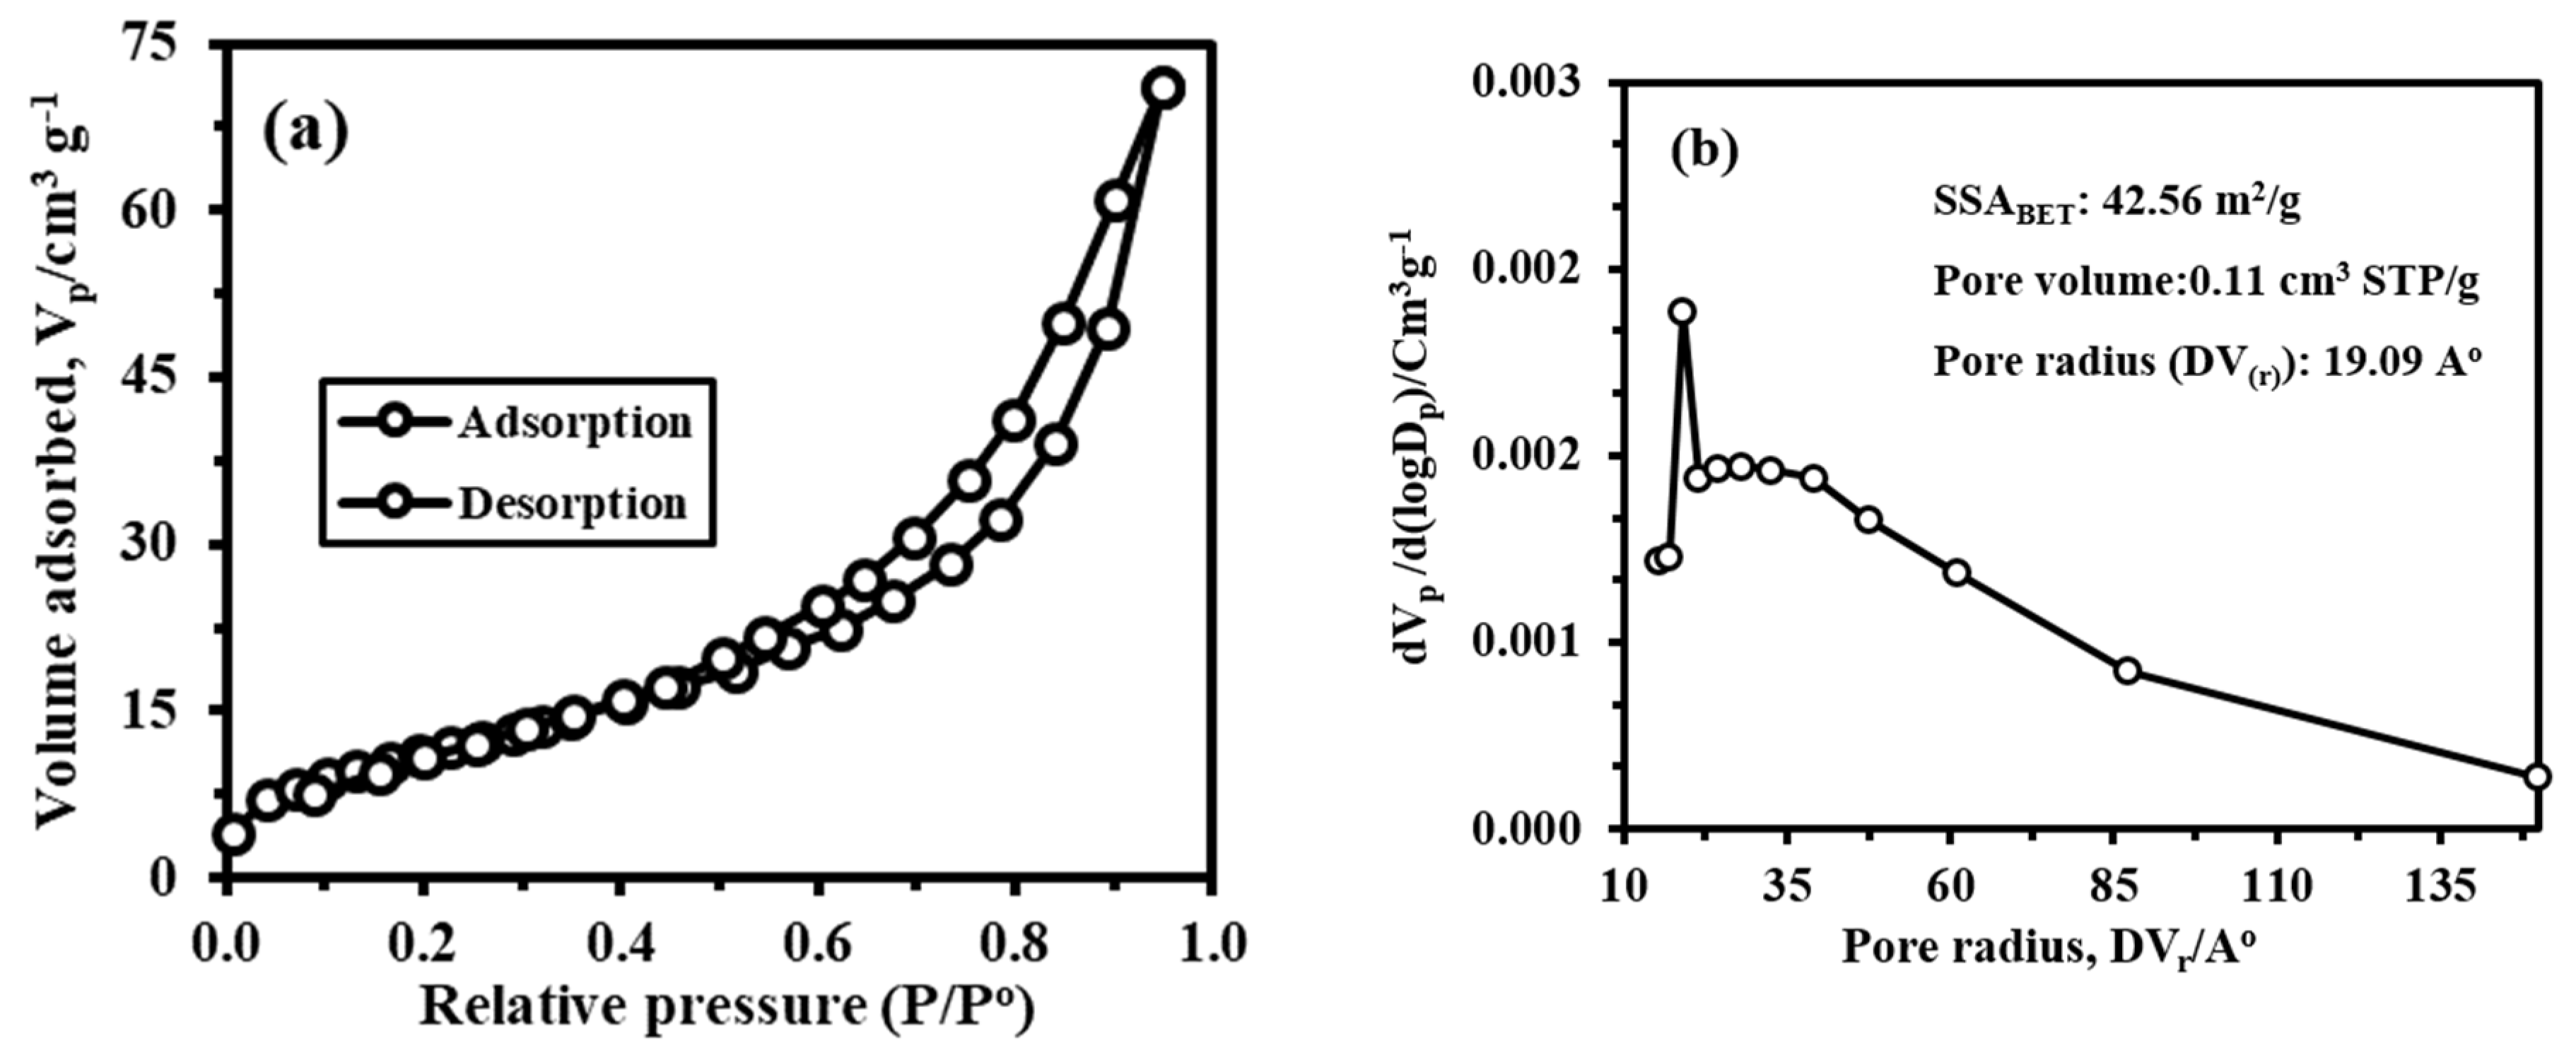
3.2.6. Textural Properties
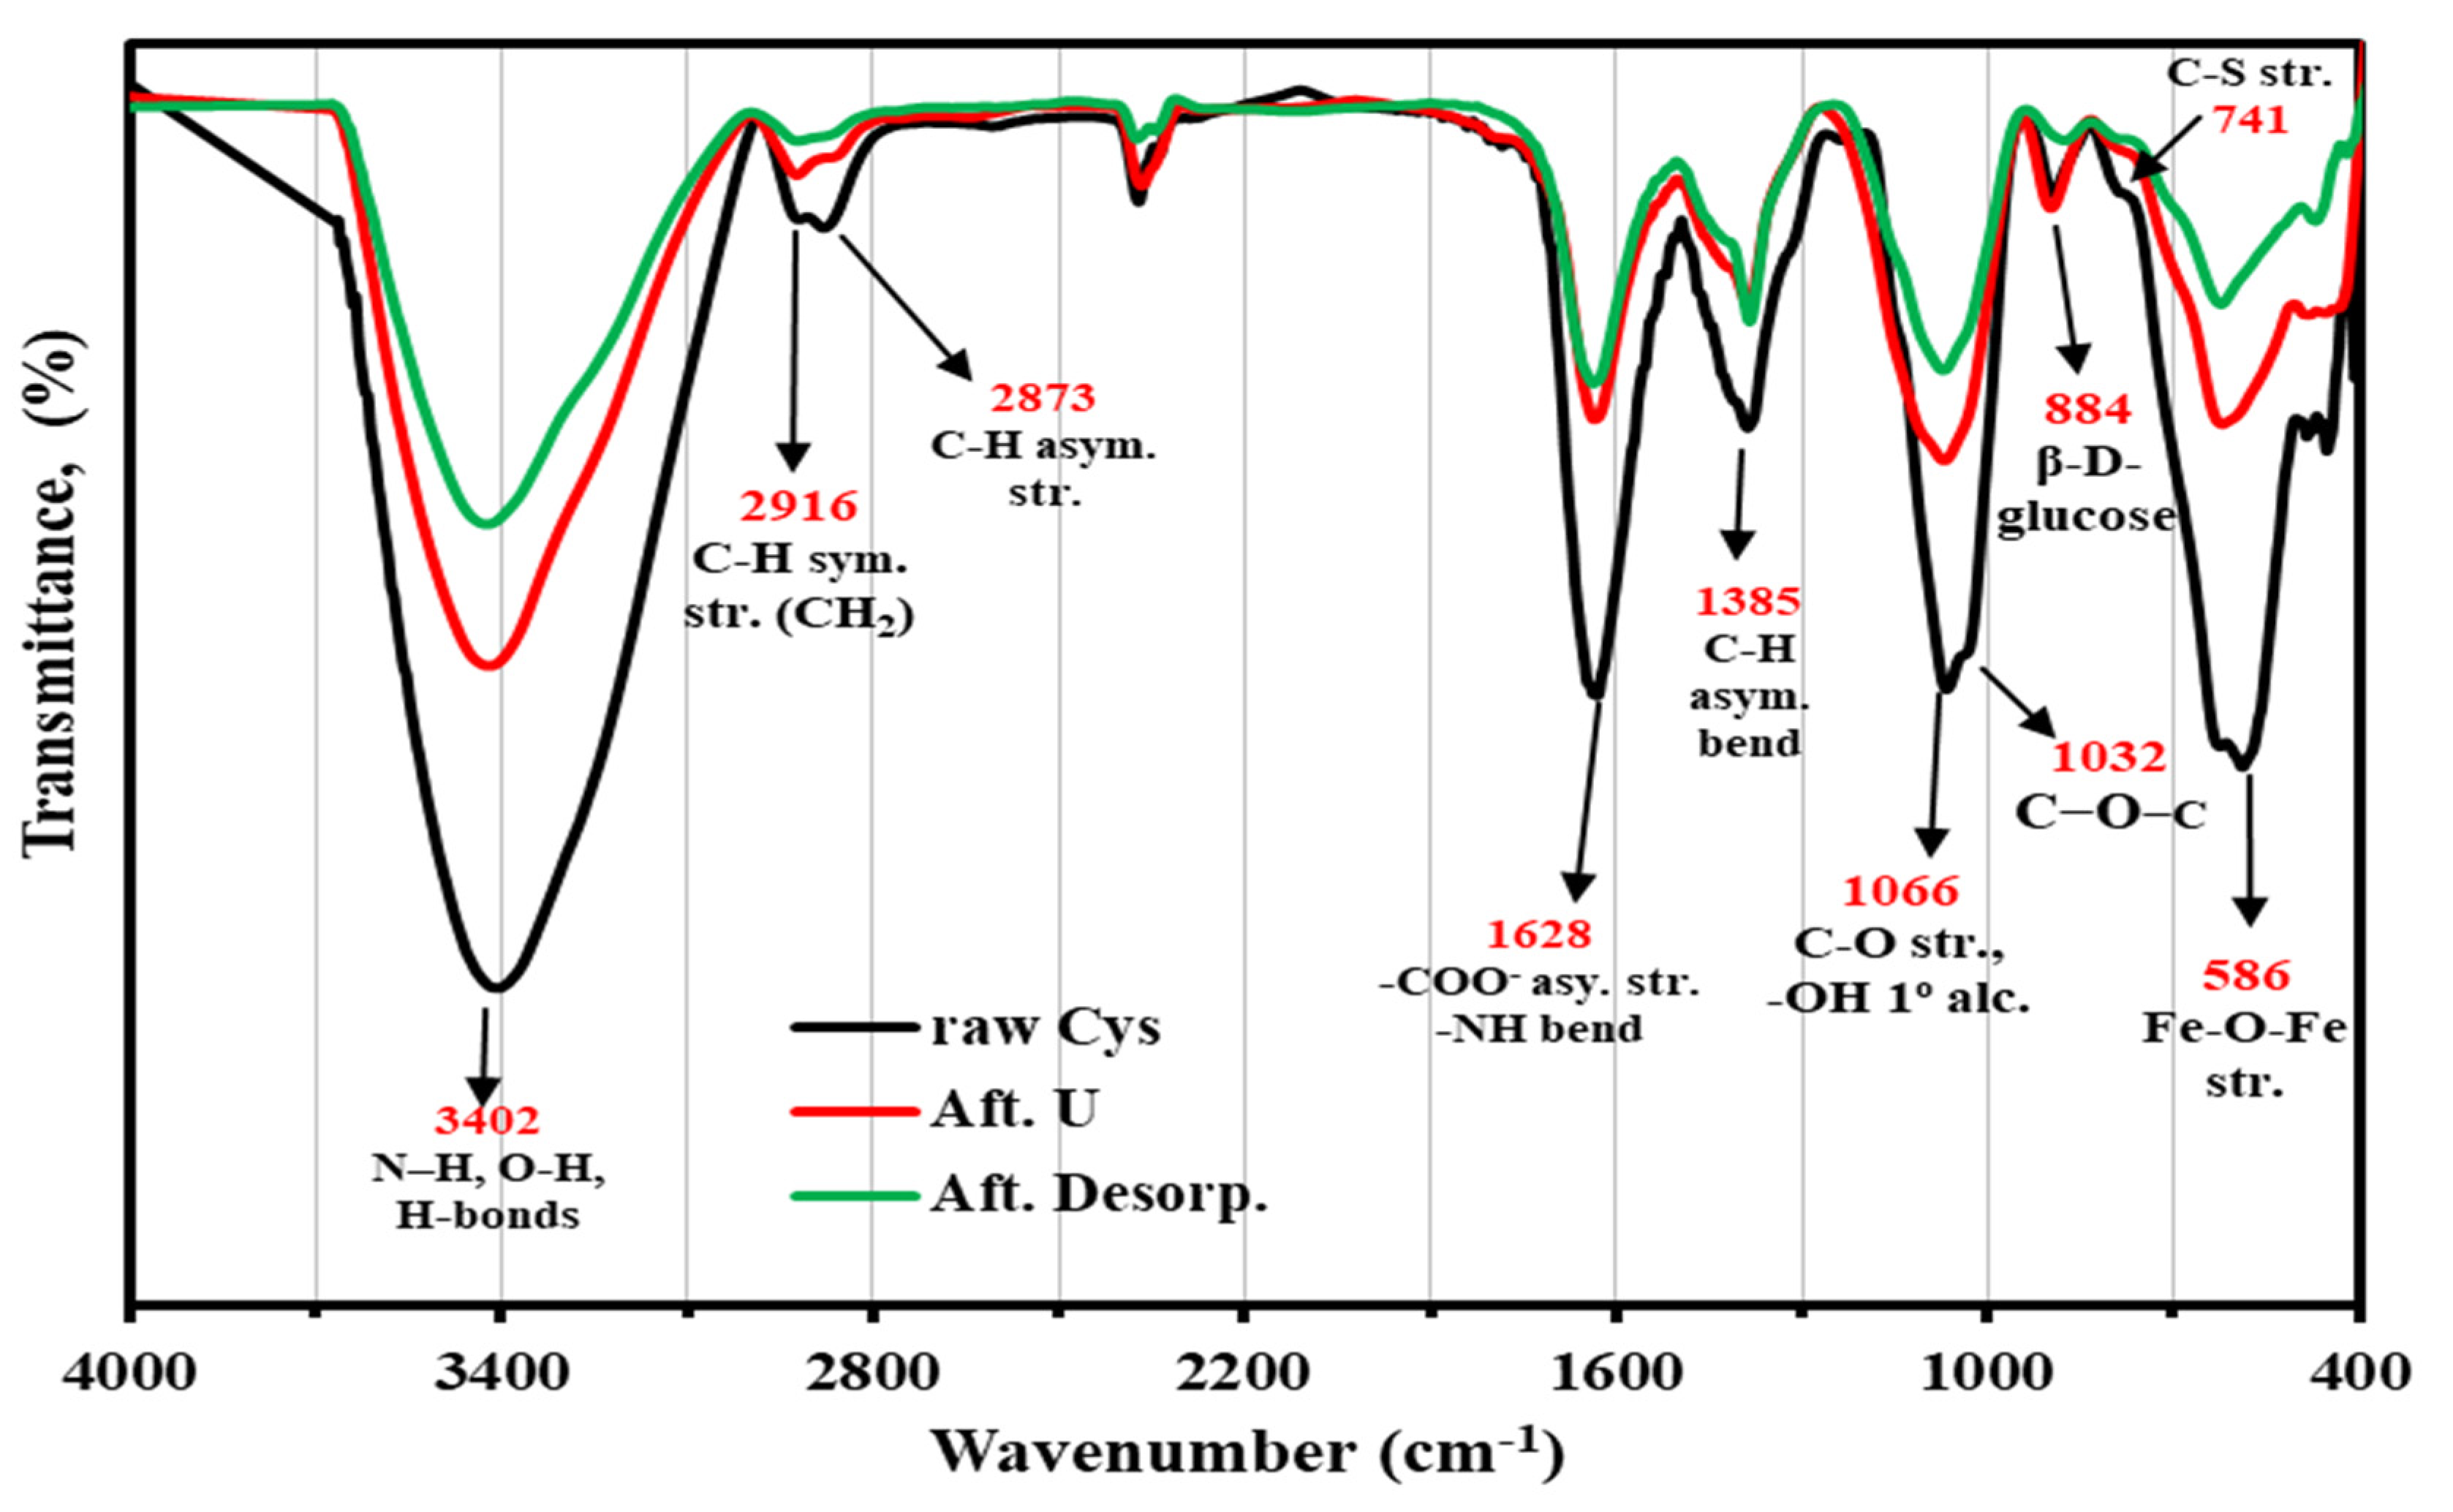
3.2.7. FTIR Analysis
3.2.8. XPS Spectroscopy
3.3. Sorption Studies
3.3.1. Effect of Sorbent Dose
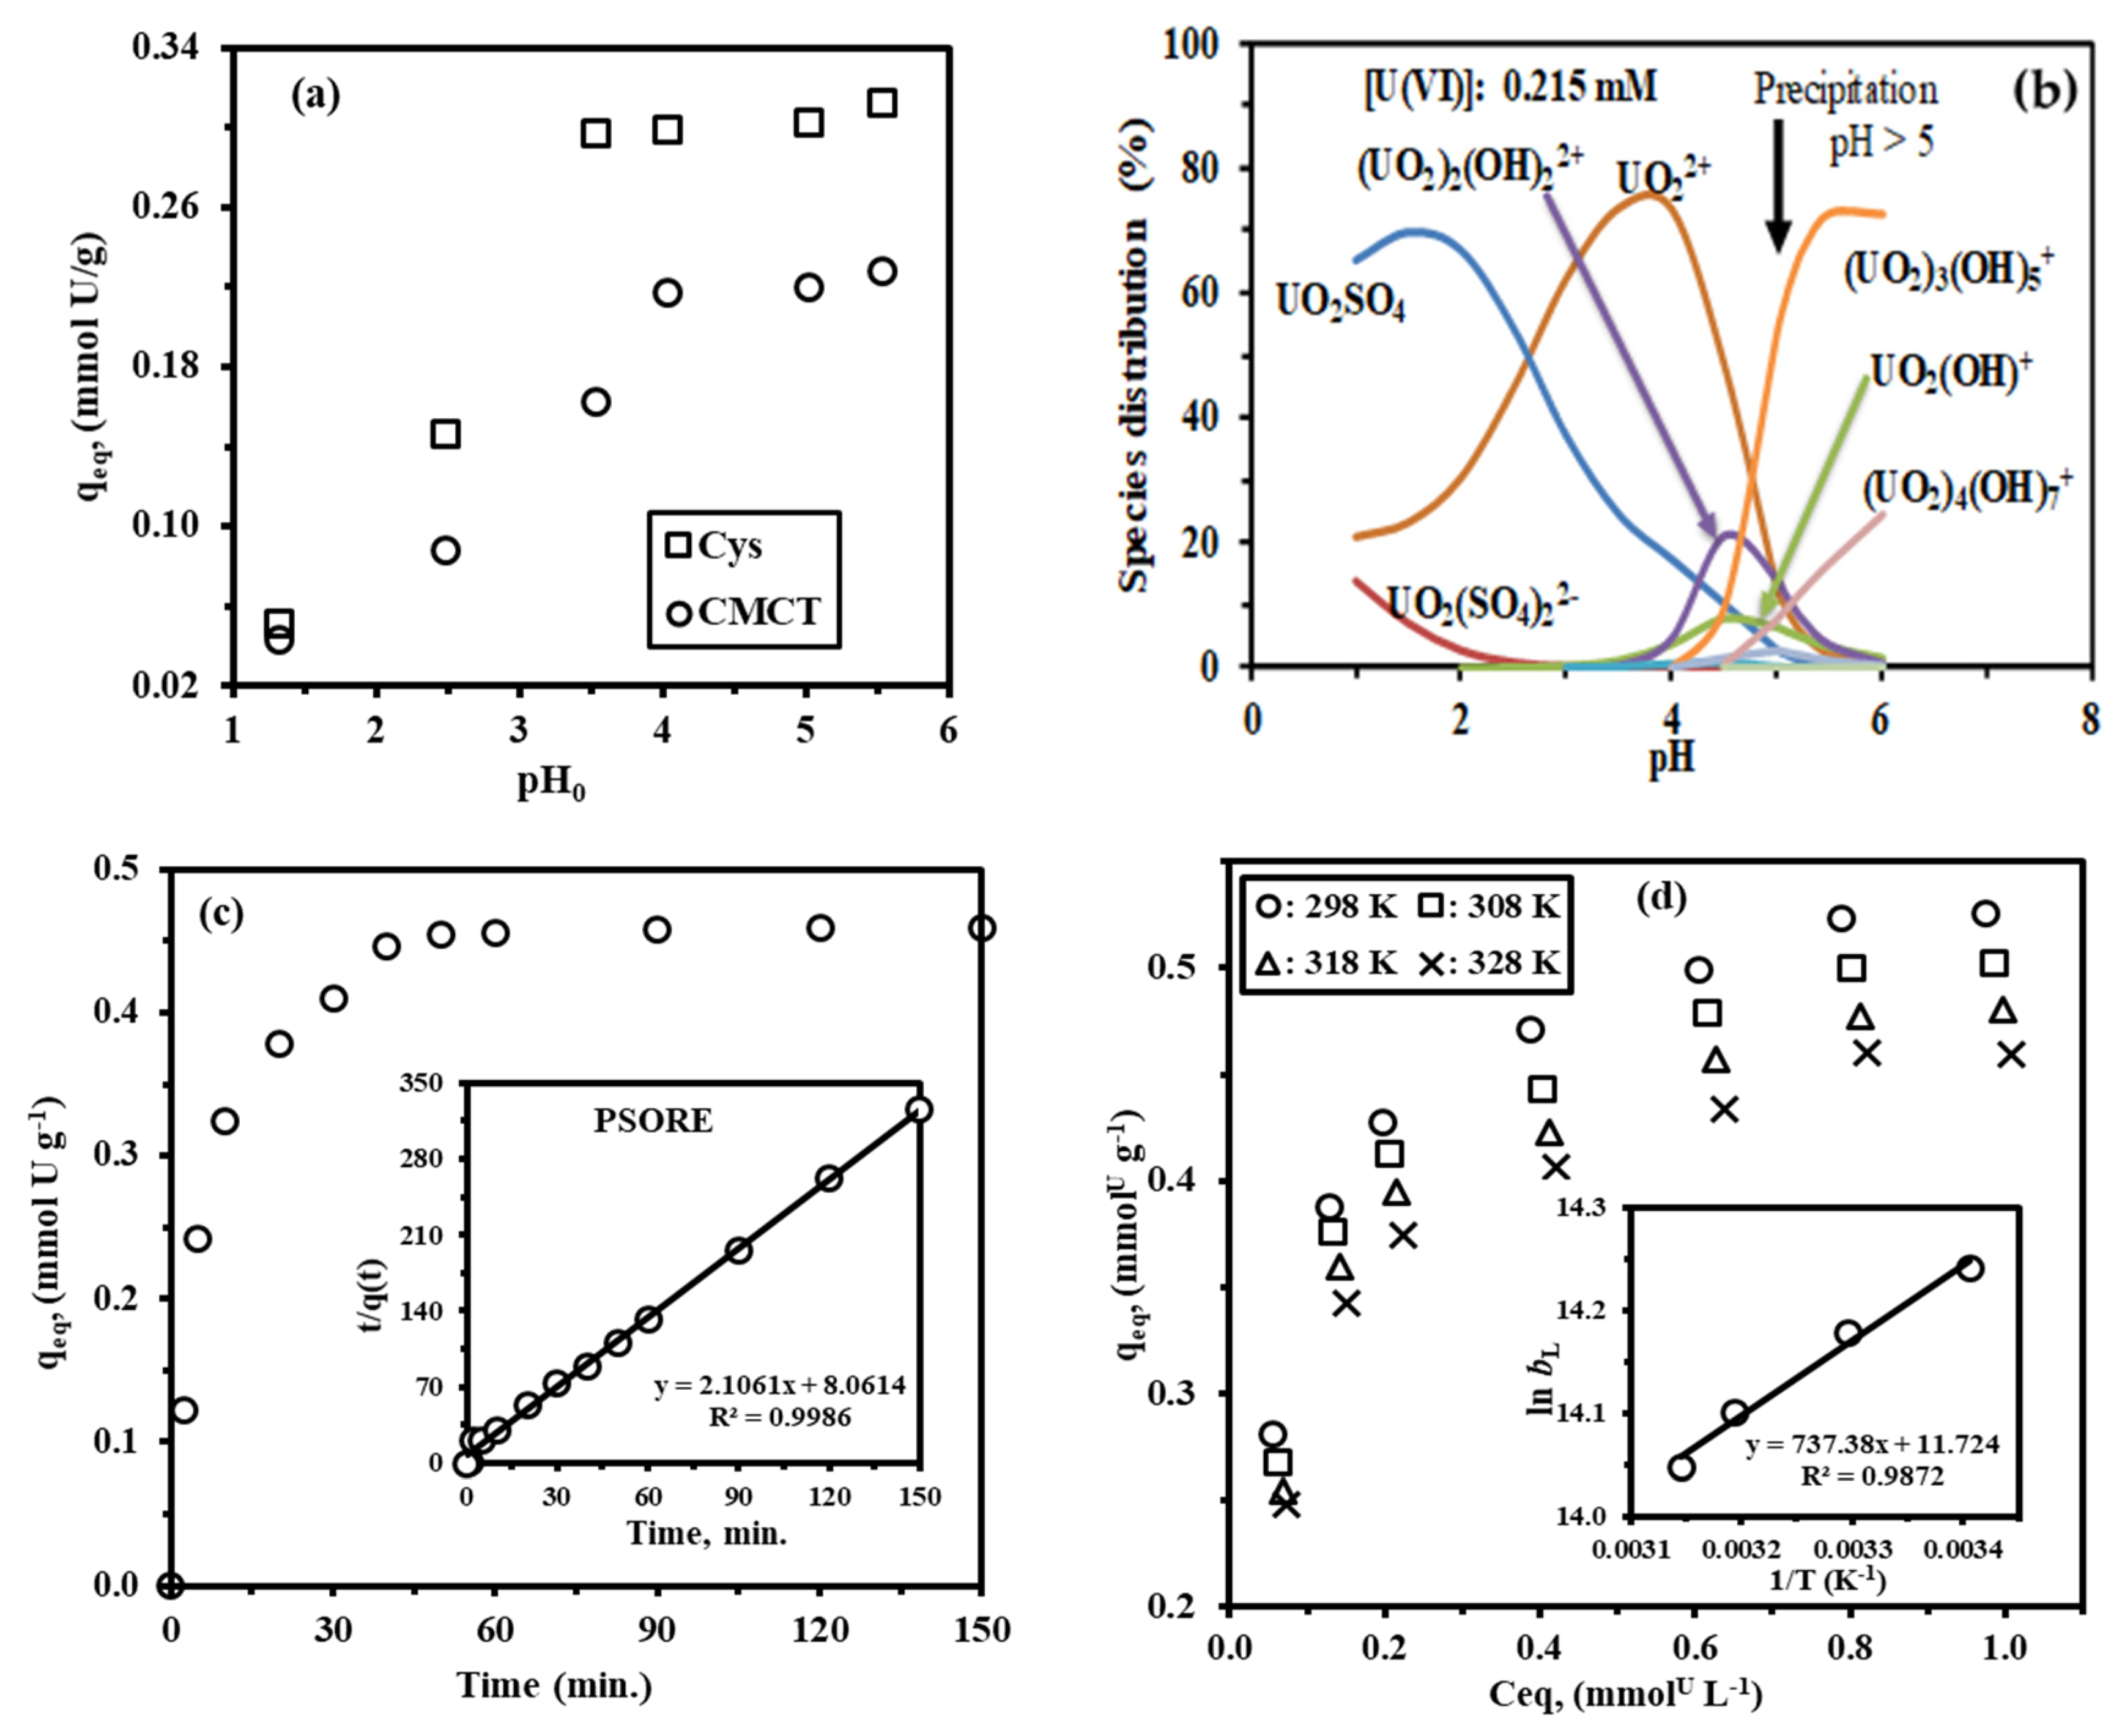
3.3.2. Effect of pH
3.3.3. Equilibration Time
3.3.4. Sorption Isotherms
3.3.5. Comparison of Sorbent Properties for Different Sorbent Material
3.3.6. Metal Desorption and Recycling
3.3.7. Uranyl Species Interactions and Mechanisms
FTIR Spectroscopy
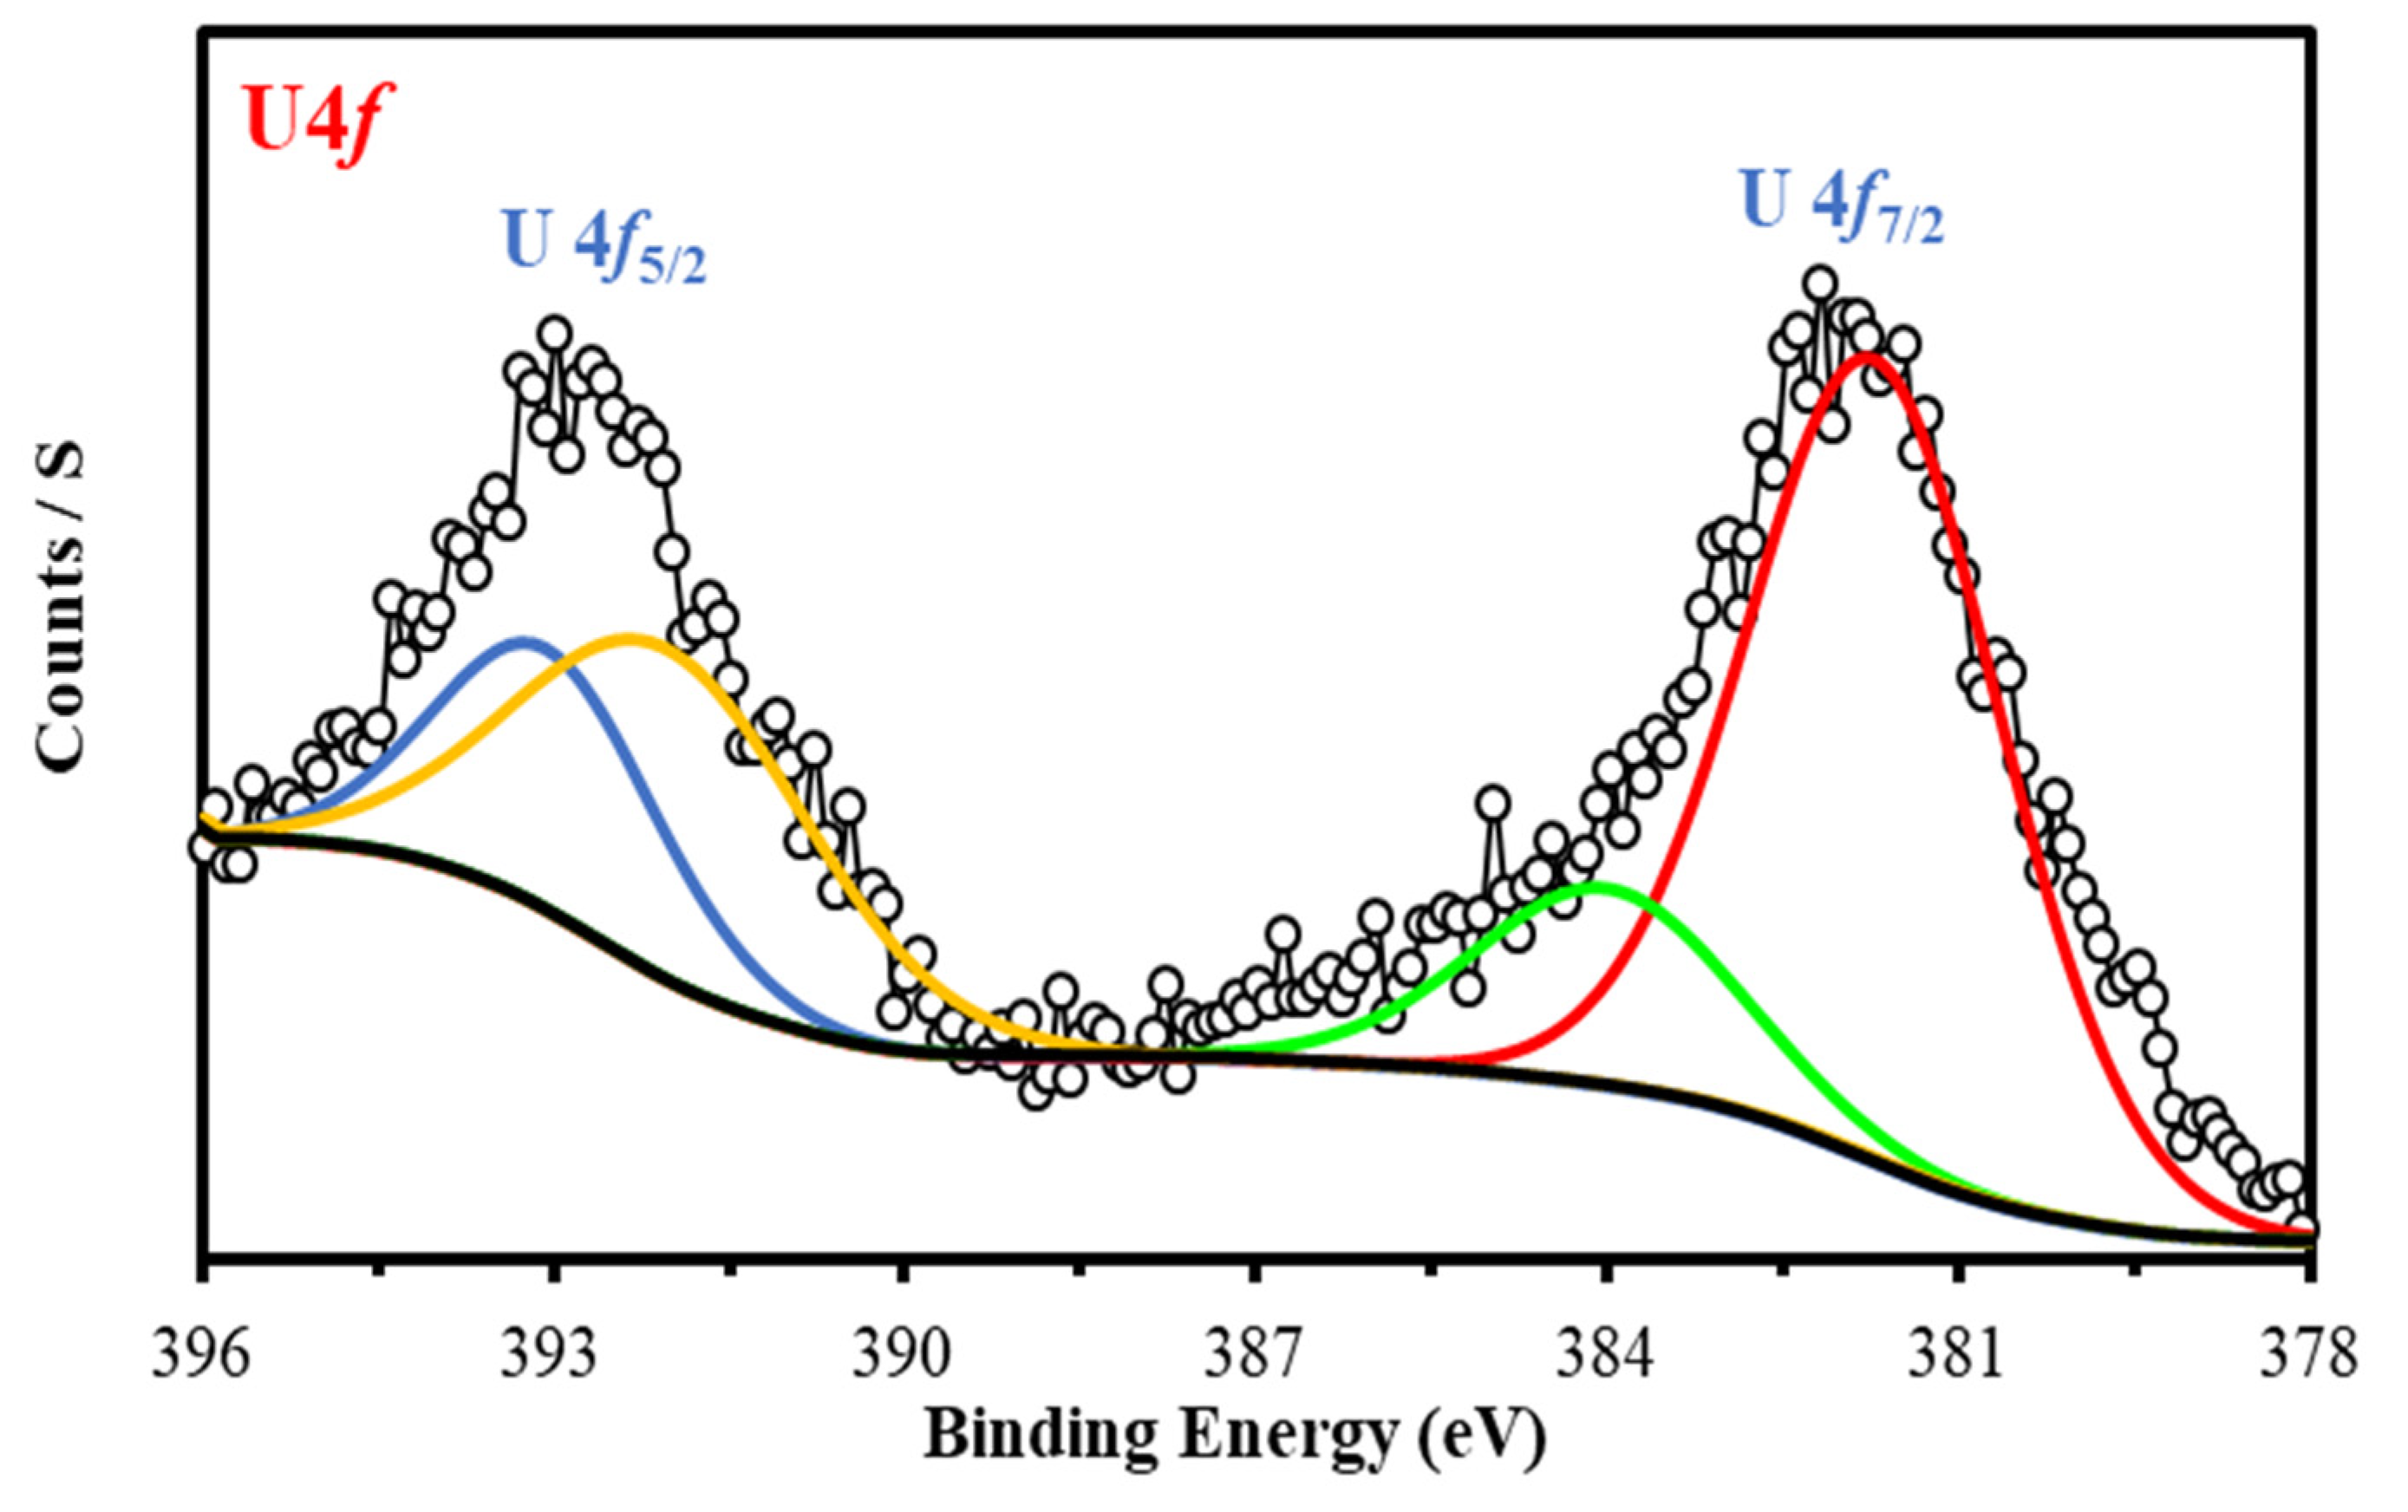
XPS Spectroscopy
3.3.8. Metal Interaction Mechanism
- (a)
- Anion-exchange mechanism of anionic UO2(SO4)22− species via SO42− on the protonated amine groups;
- (b)
- Cation-exchange mechanism with cationic species (UO22+) at higher pH0, but less than pHPZC (i.e., can deprotonate active sites), with the Na+ attached to –COO− and H+ of the –OH and –NH2/>NH groups;
- (c)
- Chelation and complexation mechanisms of UO22+, with different heteroatoms (O and N) on the surface of the sorbent.
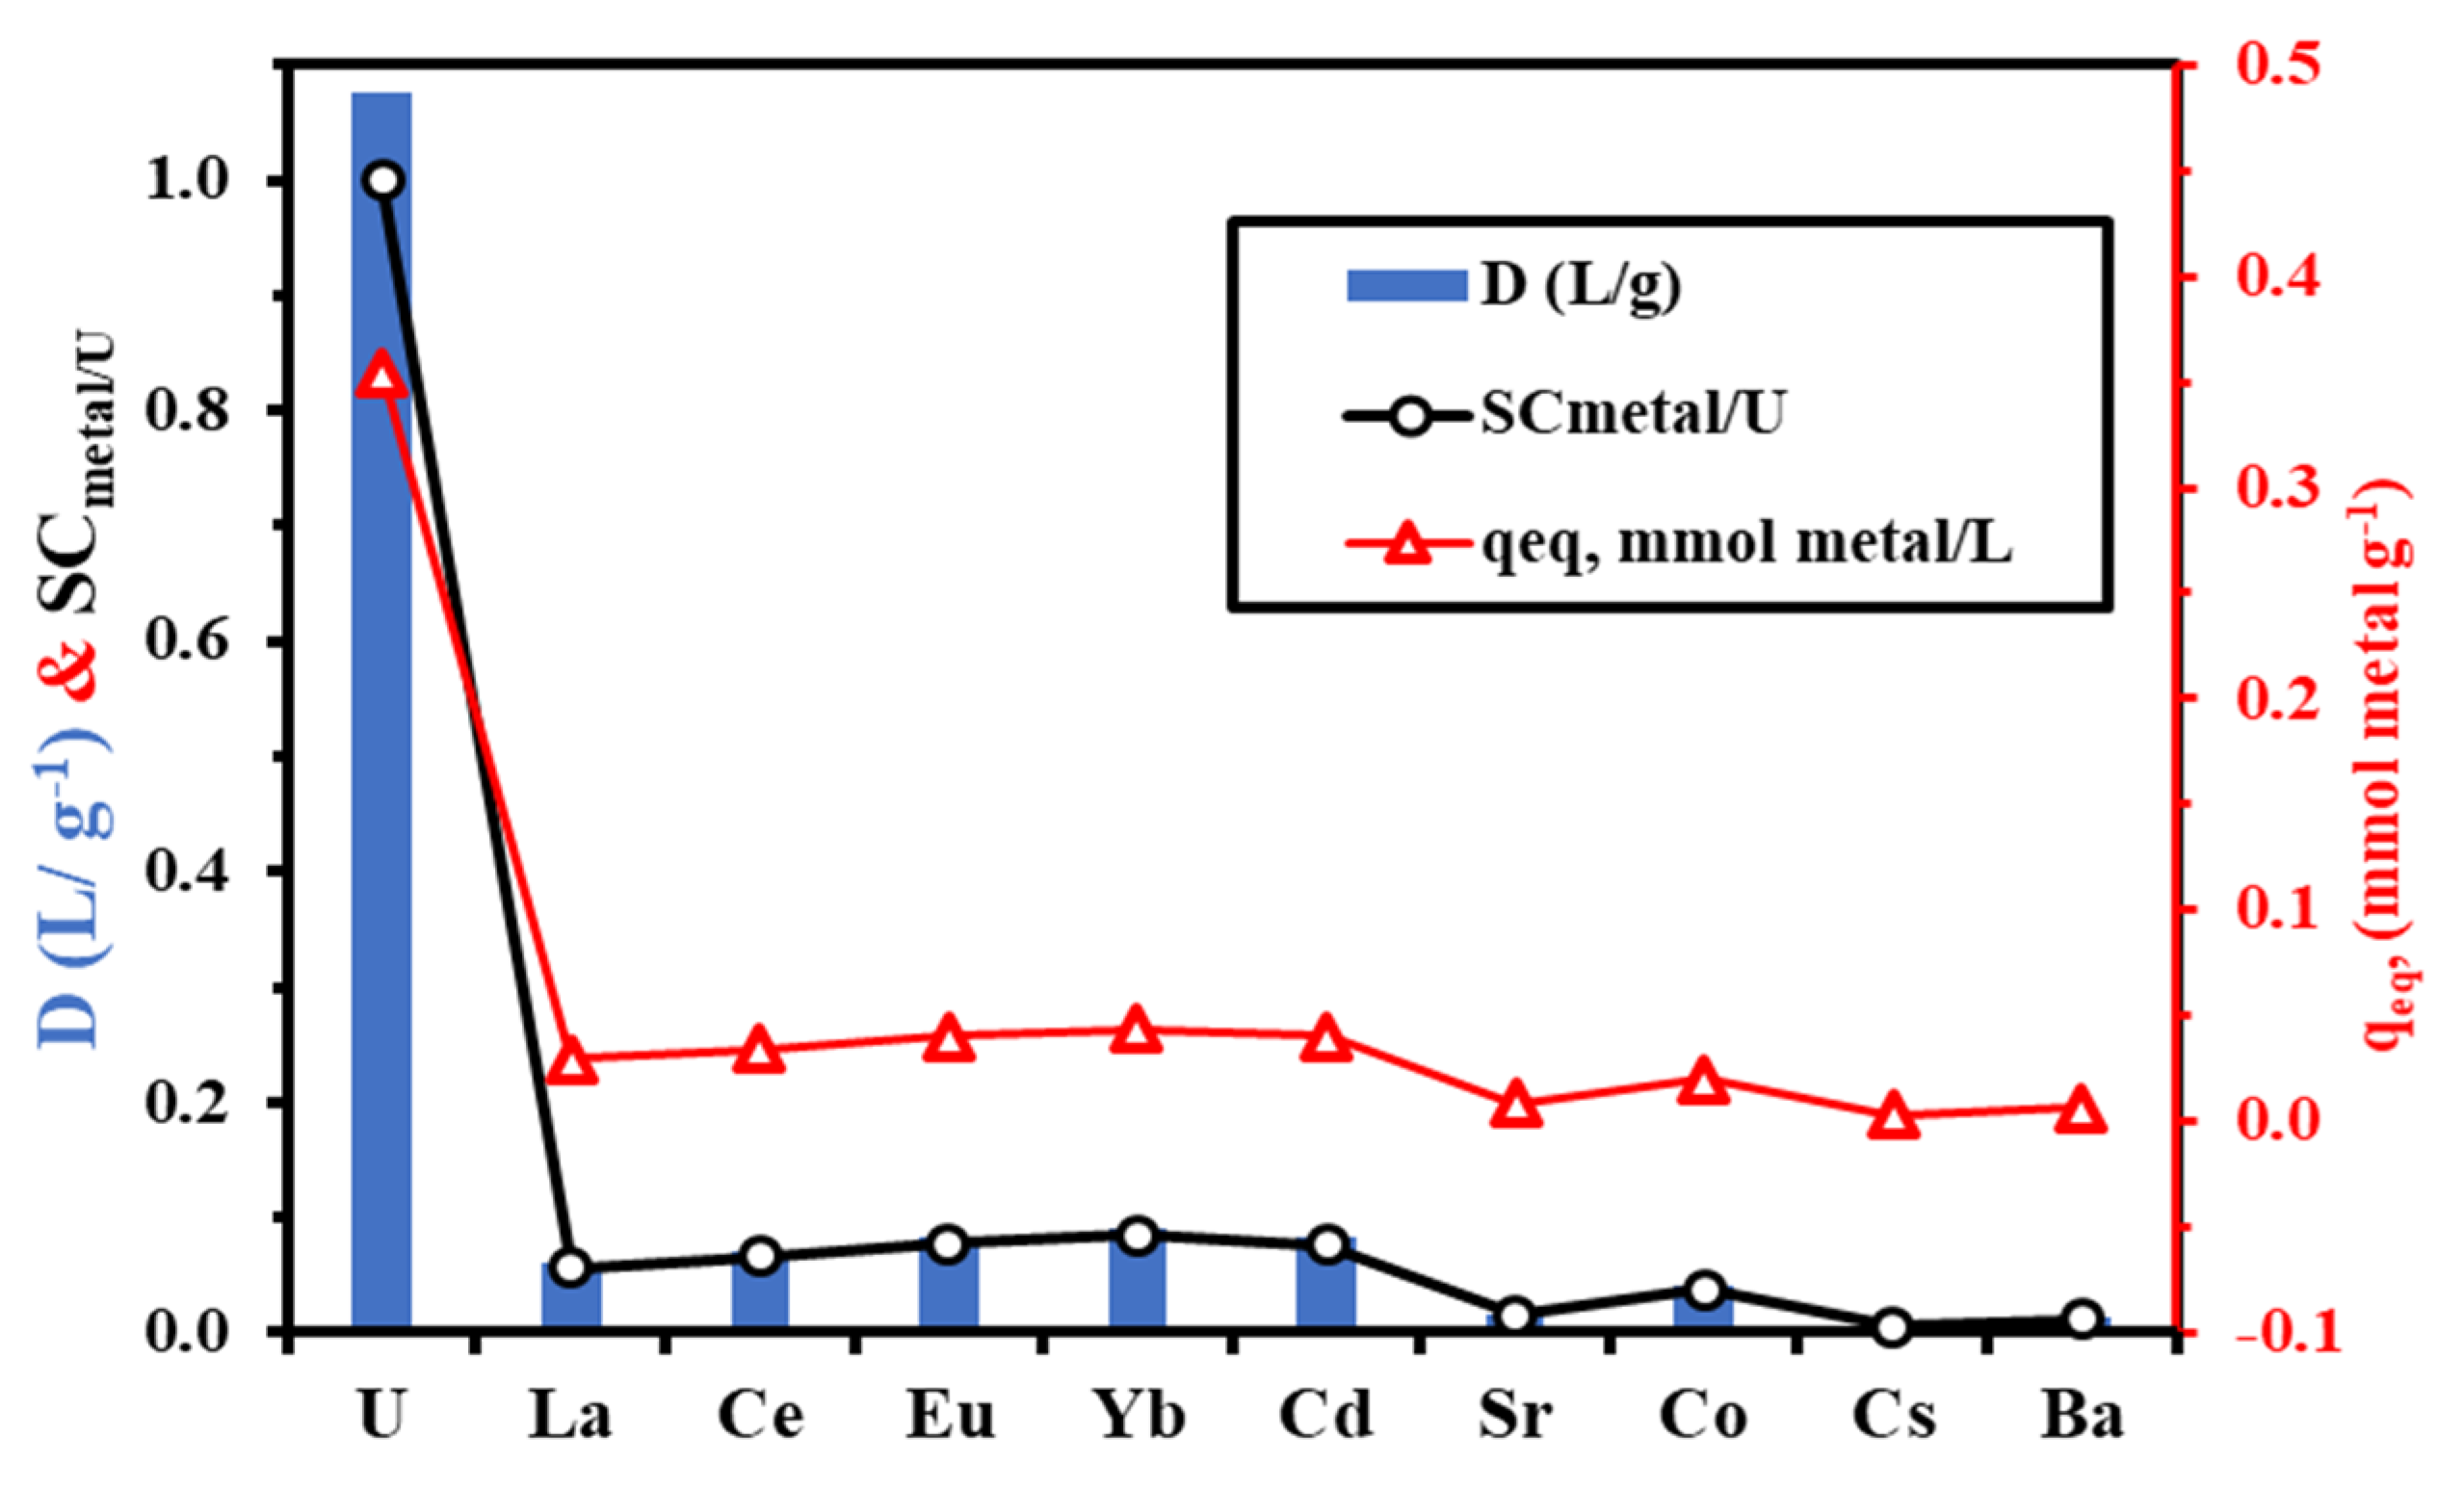
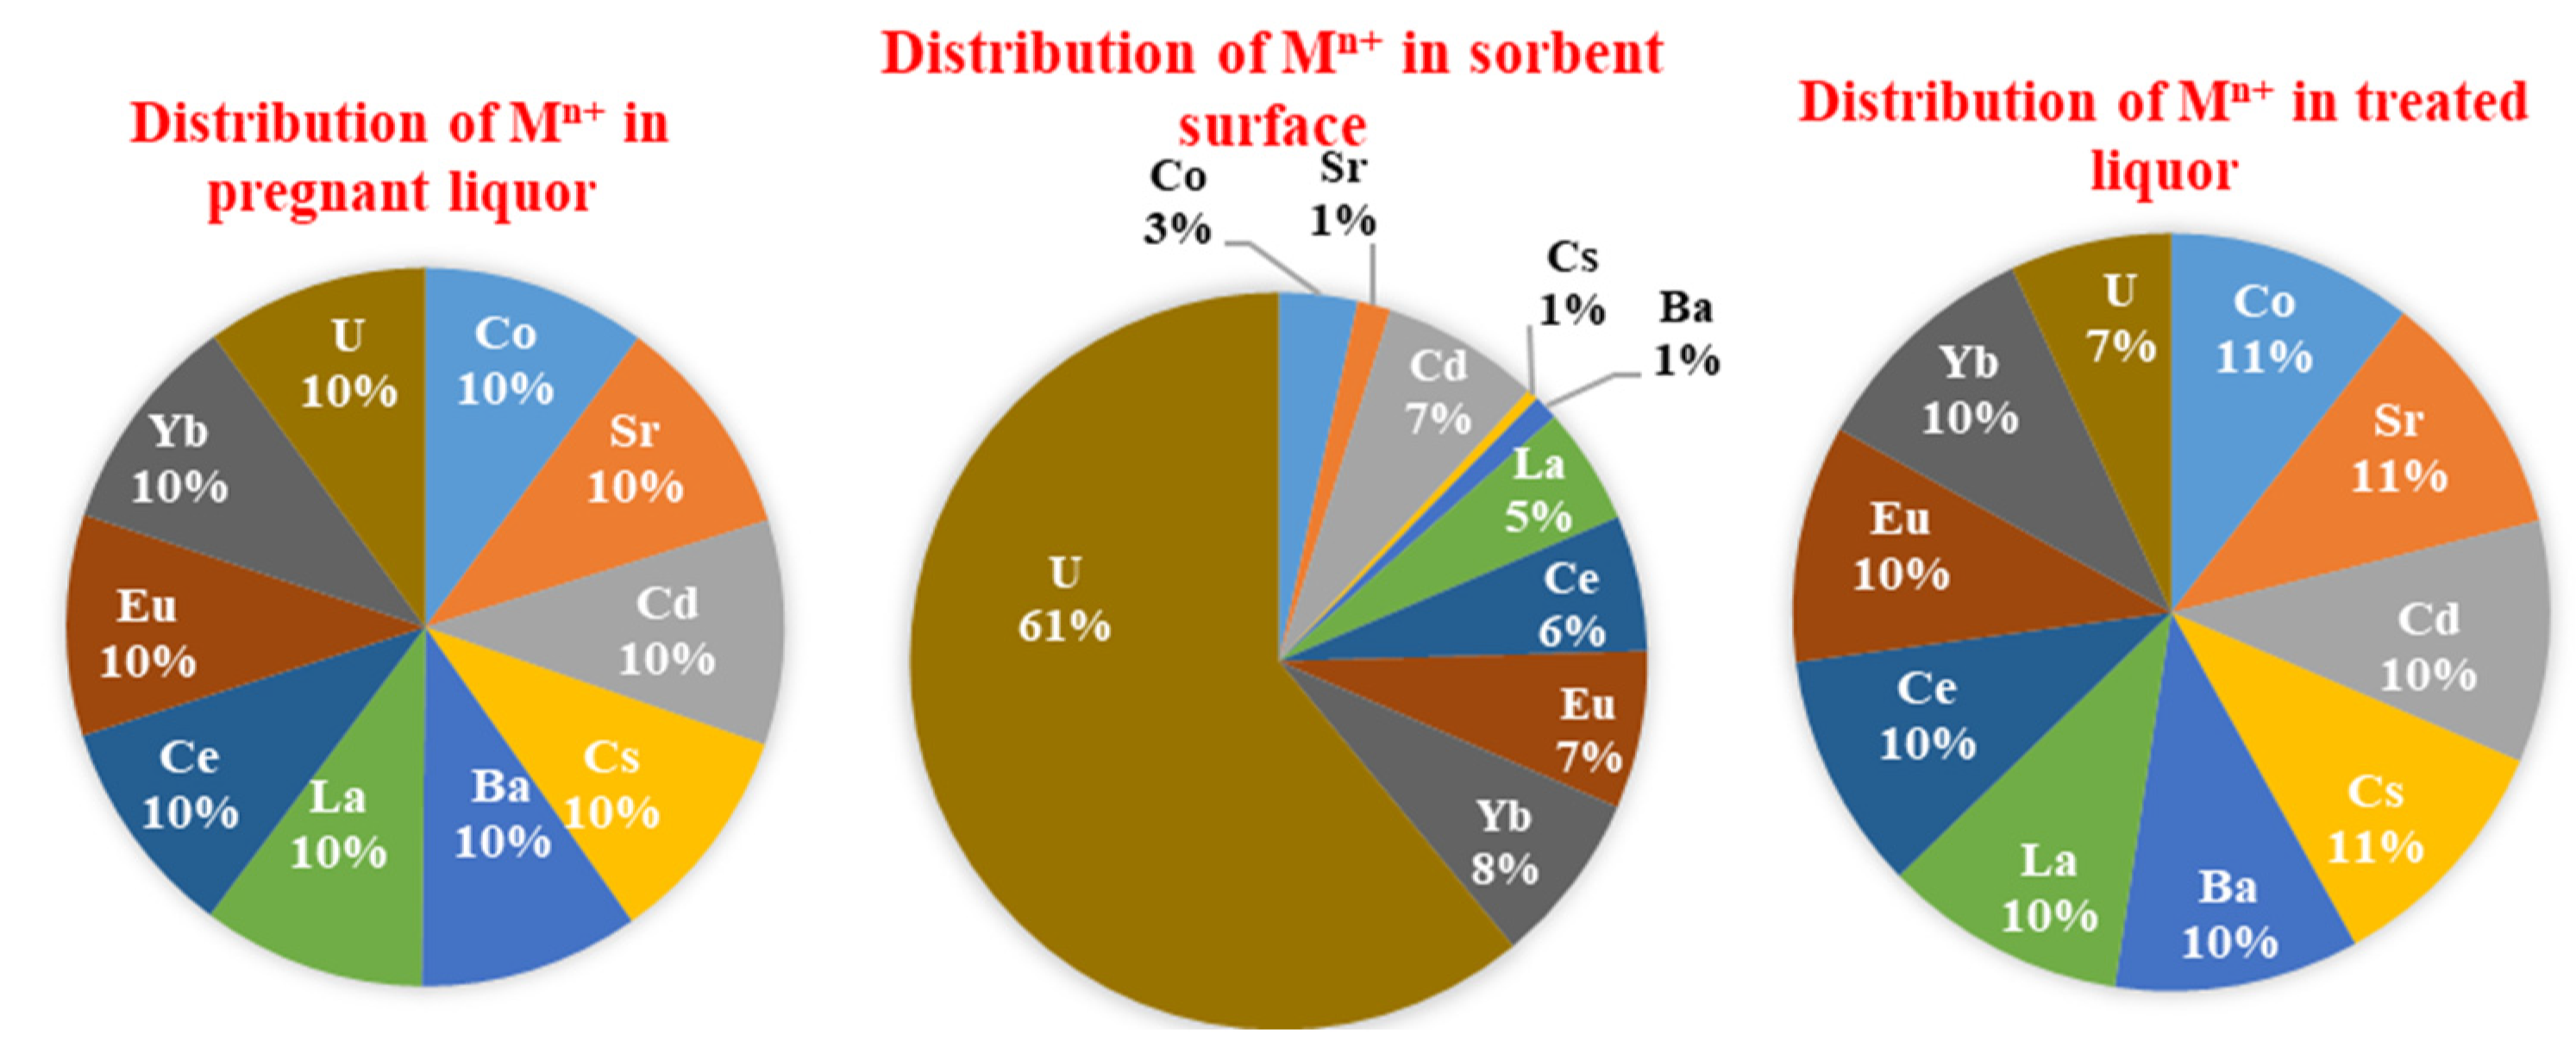
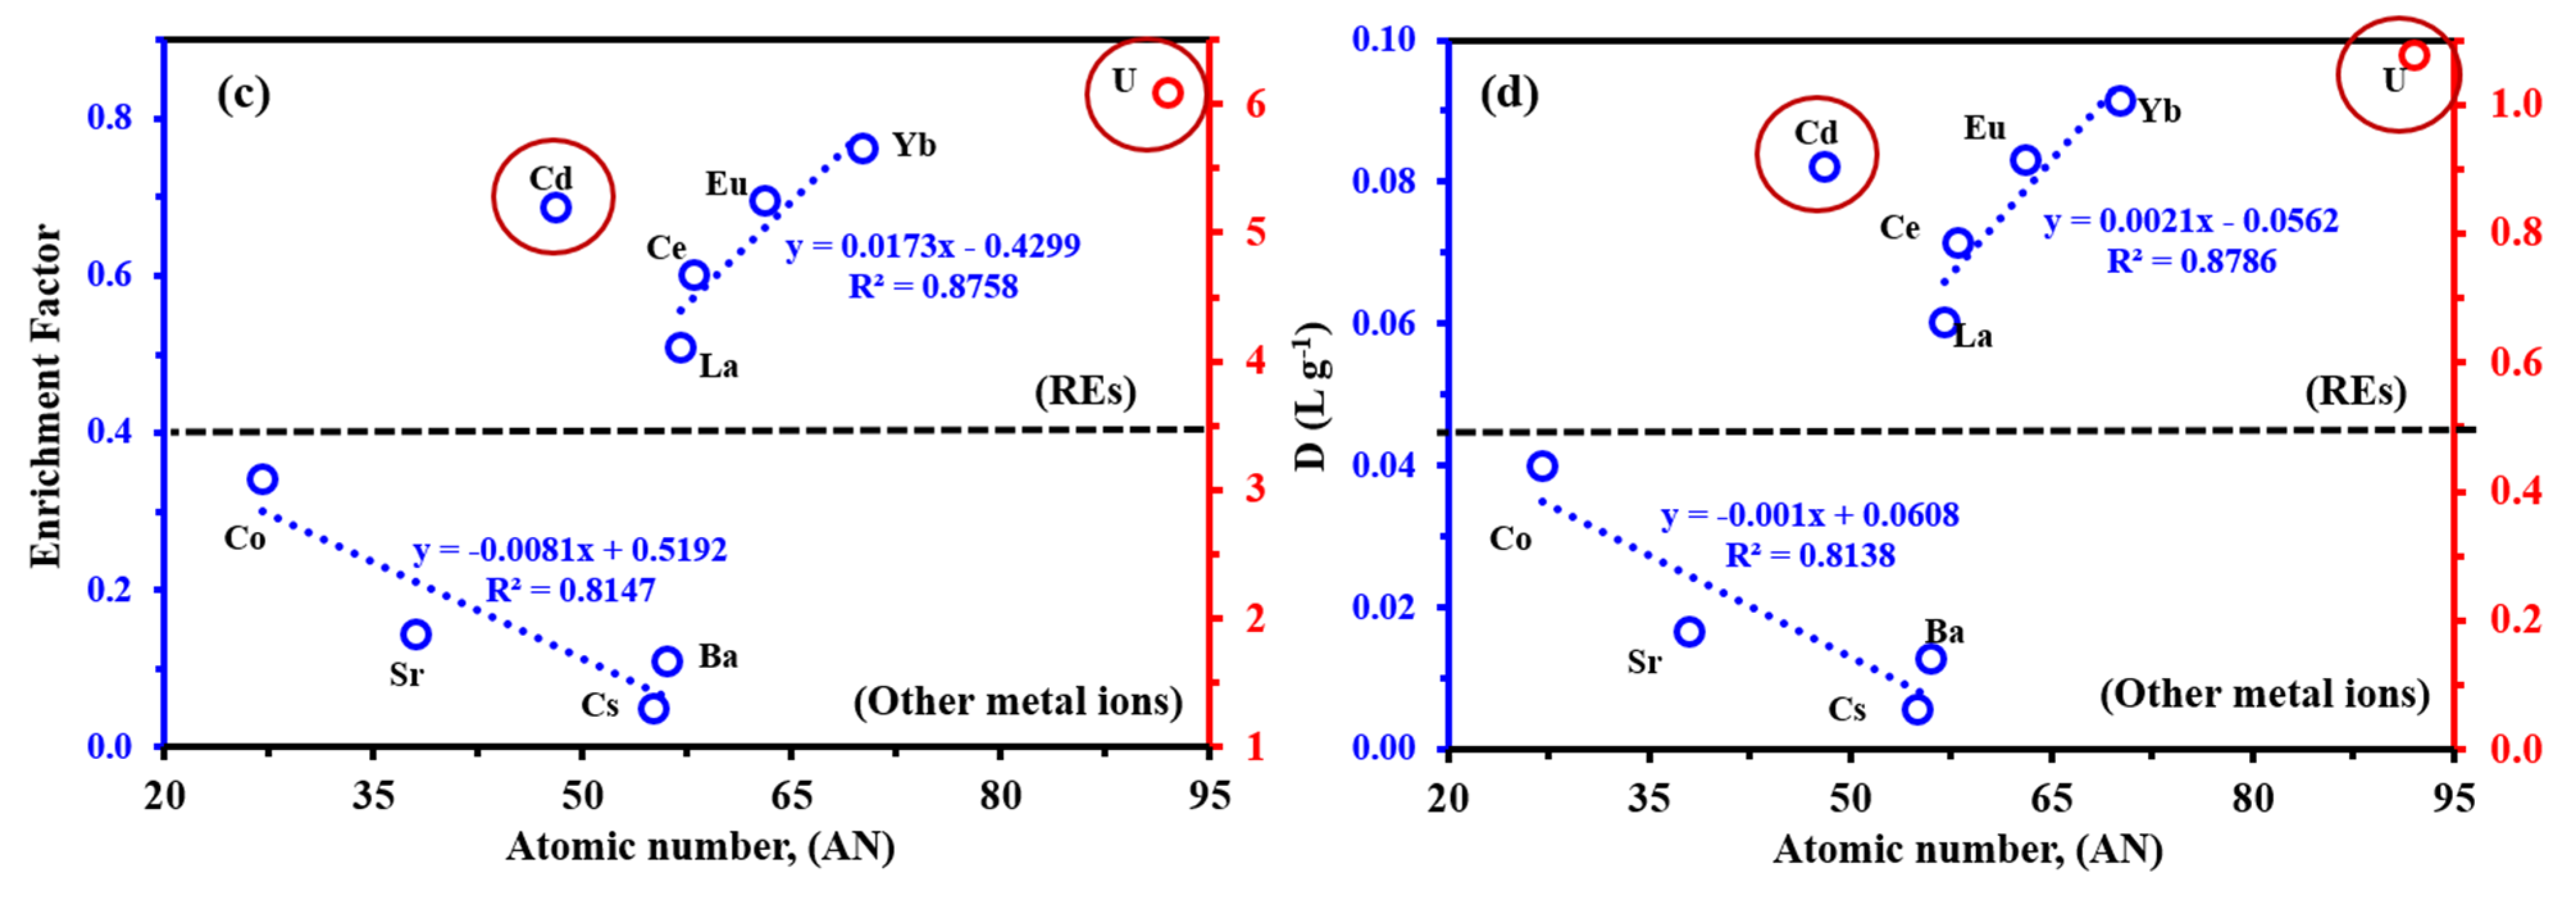
3.3.9. Tests of Selectivity
- (a)
- According to Pearson’s principles (the HSAB concept), uranyl is a hard acid, which indicates that the metal ion binds preferentially to ligands containing O >> N >> S [58];
- (b)
- The electron-withdrawing/releasing effect affects the donating ability of the different functional groups (negatively for carboxylic acid groups, positively for amine groups);
- (c)
- Uranium is present in oxycation form (UO22+), which can be adsorbed in different forms with different mechanisms, as reported in our study;
- (d)
- The steric effect modulates the stability and accessibility to reactive groups: herein, the contribution modes involved sulfur atoms, forming stable five- and six-membered chelating rings, while in other modes forming four membered rings (i.e., stronger steric hindrance when compared with five-/six-membered rings).
4. Conclusions
Supplementary Materials
Author Contributions
Funding
Data Availability Statement
Acknowledgments
Conflicts of Interest
References
- Hu, C.; Zhang, L.; Zhao, Z.-J.; Li, A.; Chang, X.; Gong, J. Water Splitting: Synergism of Geometric Construction and Electronic Regulation: 3D Se-(NiCo)Sx/(OH)x Nanosheets for Highly Efficient Overall Water Splitting. Adv. Mater. 2018, 30, 1870085. [Google Scholar] [CrossRef] [Green Version]
- Yuan, Y.; Meng, Q.; Faheem, M.; Yang, Y.; Li, Z.; Wang, Z.; Deng, D.; Sun, F.; He, H.; Huang, Y.; et al. A molecular coordination template strategy for designing selective porous aromatic framework materials for uranyl capture. ACS Cent. Sci. 2019, 5, 1432–1439. [Google Scholar] [CrossRef] [PubMed] [Green Version]
- Kawamata, Y.; Hayashi, K.; Carlson, E.; Shaji, S.; Waldmann, D.; Simmons, B.J.; Edwards, J.T.; Zapf, C.W.; Saito, M.; Baran, P.S. Chemoselective electrosynthesis using rapid alternating polarity. J. Am. Chem. Soc. 2021, 143, 16580–16588. [Google Scholar] [CrossRef]
- Morshedy, A.S.; Galhoum, A.A.; Abdel Aleem, A.A.H.; Shehab El-din, M.T.; Okaba, D.M.; Mostafa, M.S.; Mira, H.I.; Yang, Z.; El-Sayed, I.E.T. Functionalized aminophosphonate chitosan-magnetic nanocomposites for Cd(II) removal from aqueous solutions: Performance and mechanisms of sorption. Appl. Surf. Sci. 2021, 561, 150069. [Google Scholar] [CrossRef]
- Galhoum, A.A.; Mahfouz, M.G.; Gomaa, N.M.; Vincent, T.; Guibal, E. Chemical modifications of chitosan nano-based magnetic particles for enhanced uranyl sorption. Hydrometallurgy 2017, 168, 127–134. [Google Scholar] [CrossRef]
- Galhoum, A.A.; Mahfouz, M.G.; Gomaa, N.A.; Abdel Rehem, S.S.; Atia, A.A.; Vincent, T.; Guibal, E. Cysteine-functionalized chitosan magnetic nano-based particles for the recovery of uranium(VI): Uptake kinetics and sorption isotherms. Sep. Sci. Technol. 2015, 50, 2776–2789. [Google Scholar]
- Benettayeb, A.; Morsli, A.; Elwakeel, K.Z.; Hamza, M.F.; Guibal, E. Recovery of heavy metal ions using magnetic glycine-modified chitosan: Application to aqueous solutions and tailing leachate. Appl. Sci. 2021, 11, 8377. [Google Scholar] [CrossRef]
- Abd El-Magied, M.O.; Galhoum, A.A.; Atia, A.A.; Tolba, A.A.; Maize, M.S.; Vincent, T.; Guibal, E. Cellulose and chitosan derivatives for enhanced sorption of erbium(III). Colloids Surf. A: Physicochem. Eng. Asp. 2017, 529, 580–593. [Google Scholar] [CrossRef]
- Faulconer, E.K.; von Reitzenstein, N.V.; Mazyck, D.W. Optimization of magnetic powdered activated carbon for aqueous Hg(II) removal and magnetic recovery. J. Hazard. Mater. 2012, 199–200, 9–14. [Google Scholar] [CrossRef] [Green Version]
- Coates, J. Interpretation of infrared spectra, a practical approach. In Encyclopedia of Analytical Chemistry; John Wiley & Sons Ltd.: Chochester, UK, 2006. [Google Scholar]
- Tan, J.; Xie, S.; Wang, G.; Yu, C.W.; Zeng, T.; Cai, P.; Huang, H. Fabrication and optimization of the thermo-sensitive hydrogel carboxymethyl cellulose/poly(N-isopropylacrylamide-co-acrylic acid) for U(VI) removal from aqueous solution. Polymers 2020, 12, 151. [Google Scholar] [CrossRef] [Green Version]
- El-Bohy, M.N.; Abdel-Monem, Y.K.; Rabie, K.A.; Farag, N.M.; Mahfouz, M.G.; Galhoum, A.A.; Guibal, E. Grafting of arginine and glutamic acid onto cellulose for enhanced uranyl sorption. Cellulose 2017, 24, 1427–1443. [Google Scholar] [CrossRef]
- Li, N.; Bai, R. Copper adsorption on chitosan–cellulose hydrogel beads: Behaviors and mechanisms. Sep. Purif. Technol. 2005, 42, 237–247. [Google Scholar] [CrossRef]
- Willianms, R. Pka Data Compiled by R. Willianms. 2017; pp. 1–33. Available online: https://organicchemistrydata.org/hansreich/resources/pka/ (accessed on 10 May 2022).
- Marotta, A.; Luzzi, E.; Salzano de Luna, M.; Aprea, P.; Ambrogi, V.; Filippone, G. Chitosan/Zeolite composite aerogels for a fast and effective removal of both anionic and cationic dyes from water. Polymers 2021, 13, 1691. [Google Scholar] [CrossRef] [PubMed]
- Michailidou, G.; Koumentakou, I.; Liakos, E.V.; Lazaridou, M.; Lambropoulou, D.A.; Bikiaris, D.N.; Kyzas, G.Z. Adsorption of uranium, mercury, and rare earth elements from aqueous solutions onto magnetic chitosan adsorbents: A review. Polymers 2021, 13, 3137. [Google Scholar] [CrossRef]
- Mubarak, M.F.; Ragab, A.H.; Hosny, R.; Ahmed, I.A.; Ahmed, H.A.; El-Bahy, S.M.; El Shahawy, A. Enhanced performance of chitosan via a novel quaternary magnetic nanocomposite chitosan/grafted halloysitenanotubes@ZnγFe3O4 for uptake of Cr(III), Fe(III), and Mn(II) from wastewater. Polymers 2021, 13, 2714. [Google Scholar] [CrossRef]
- Kong, H.; Song, J.; Jang, J. One-step fabrication of magnetic γ-Fe2O3/polyrhodanine nanoparticles using in situ chemical oxidation polymerization and their antibacterial properties. Chem. Commun. 2010, 46, 6735–6737. [Google Scholar] [CrossRef]
- Wall, S.B.; Oh, J.Y.; Diers, A.R.; Landar, A. Oxidative modification of proteins: An emerging mechanism of cell signaling. Front. Physiol. 2012, 3, 369. [Google Scholar] [CrossRef] [Green Version]
- Imam, E.A.; El-Tantawy El-Sayed, I.; Mahfouz, M.G.; Tolba, A.A.; Akashi, T.; Galhoum, A.A.; Guibal, E. Synthesis of α-aminophosphonate functionalized chitosan sorbents: Effect of methyl vs phenyl group on uranium sorption. Chem. Eng. J. 2018, 352, 1022–1034. [Google Scholar] [CrossRef]
- Mahdavi, M.; Ahmad, M.B.; Haron, M.J.; Namvar, F.; Nadi, B.; Rahman, M.Z.; Amin, J. Synthesis, surface modification and characterisation of biocompatible magnetic iron oxide nanoparticles for biomedical applications. Molecules 2013, 18, 7533–7548. [Google Scholar] [CrossRef] [Green Version]
- Yamaura, M.; Camilo, R.L.; Sampaio, L.C.; Macêdo, M.A.; Nakamura, M.; Toma, H.E. Preparation and characterization of (3-aminopropyl)triethoxysilane-coated magnetite nanoparticles. J. Magn. Magn. Mater. 2004, 279, 210–217. [Google Scholar] [CrossRef]
- Marczenko, Z.; Ramsay, C.G.; Jurecki, M. Spectrophotometric Determination of Elements; Horwood, E., Ed.; Halsted Press: Chichester, UK; New York, NY, USA, 1976. [Google Scholar]
- Winsett, J.; Moilanen, A.; Paudel, K.; Kamali, S.; Ding, K.; Cribb, W.; Seifu, D.; Neupane, S. Quantitative determination of magnetite and maghemite in iron oxide nanoparticles using Mössbauer spectroscopy. Appl. Sci. 2019, 1, 1636. [Google Scholar] [CrossRef] [Green Version]
- Pourmortazavi, S.M.; Sahebi, H.; Zandavar, H.; Mirsadeghi, S. Fabrication of Fe3O4 nanoparticles coated by extracted shrimp peels chitosan as sustainable adsorbents for removal of chromium contaminates from wastewater: The design of experiment. Compos. B. Eng. 2019, 175, 107130. [Google Scholar] [CrossRef]
- Stoia, M.; Istratie, R.; Păcurariu, C. Investigation of magnetite nanoparticles stability in air by thermal analysis and FTIR spectroscopy. J. Therm. Anal. Calorim. 2016, 125, 1185–1198. [Google Scholar] [CrossRef]
- Salazar Camacho, C.; Villalobos, M.; Rivas-Sánchez, M.d.l.L.; Arenas-Alatorre, J.; Alcaraz-Cienfuegos, J.; Gutiérrez-Ruiz, M.E. Characterization and surface reactivity of natural and synthetic magnetites. Chem. Geol. 2013, 347, 233–245. [Google Scholar] [CrossRef]
- Oh, S.Y.; Yoo, D.I.; Shin, Y.; Kim, H.C.; Kim, H.Y.; Chung, Y.S.; Park, W.H.; Youk, J.H. Crystalline structure analysis of cellulose treated with sodium hydroxide and carbon dioxide by means of X-ray diffraction and FTIR spectroscopy. Carbohydr. Res. 2005, 340, 2376–2391. [Google Scholar] [CrossRef]
- Muthuselvi, C.; Pandiarajan, S.S.; Ravikumar, B.; Athimoolam, S.; Srinivasan, N.; Krishnakumar, R.V. FT-IR and FT-Raman spectroscopic analyzes of indeno quinoxaline derivative crystal. Asian J. Appl. Sci. 2018, 11, 83–91. [Google Scholar] [CrossRef] [Green Version]
- Gouder, T.; Eloirdi, R.; Caciuffo, R. Direct observation of pure pentavalent uranium in U2O5 thin films by high resolution photoemission spectroscopy. Sci. Rep. 2018, 8, 8306. [Google Scholar] [CrossRef] [Green Version]
- Huang, Z.; Li, Z.; Zheng, L.; Zhou, L.; Chai, Z.; Wang, X.; Shi, W. Interaction mechanism of uranium(VI) with three-dimensional graphene oxide-chitosan composite: Insights from batch experiments, IR, XPS, and EXAFS spectroscopy. Chem. Eng. J. 2017, 328, 1066–1074. [Google Scholar] [CrossRef]
- Guo, J.; Yu, J. Sorption characteristics and mechanisms of Pb(II) from aqueous solution by using bioflocculant MBFR10543. Appl. Microbiol. Biotechnol. 2014, 98, 6431–6441. [Google Scholar] [CrossRef]
- Bai, J.; Ma, X.; Yan, H.; Zhu, J.; Wang, K.; Wang, J. A novel functional porous organic polymer for the removal of uranium from wastewater. Microporous Mesoporous Mater. 2020, 306, 110441. [Google Scholar] [CrossRef]
- Galhoum, A.A.; Eisa, W.H.; El-Tantawy El-Sayed, I.; Tolba, A.A.; Shalaby, Z.M.; Mohamady, S.I.; Muhammad, S.S.; Hussien, S.S.; Akashi, T.; Guibal, E. A new route for manufacturing poly(aminophosphonic)-functionalized poly(glycidyl methacrylate)-magnetic nanocomposite-application to uranium sorption from ore leachate. Environ. Pollut. 2020, 264, 114797. [Google Scholar] [CrossRef] [PubMed]
- Tien, C. Adsorption Calculations and Modeling; Butterworth-Heinemann: Boston, MA, USA, 1994. [Google Scholar]
- Hu, X.; Chen, C.; Zhang, D.; Xue, Y. Kinetics, isotherm and chemical speciation analysis of Hg(Ⅱ) adsorption over oxygen-containing MXene adsorbent. Chemosphere 2021, 278, 130206. [Google Scholar] [CrossRef]
- Cheung, W.H.; Szeto, Y.S.; McKay, G. Intraparticle diffusion processes during acid dye adsorption onto chitosan. Bioresour. Technol. 2007, 98, 2897–2904. [Google Scholar] [CrossRef]
- Pan, S.Y.; Syu, W.J.; Chang, T.-K.; Lee, C.H. A multiple model approach for evaluating the performance of time-lapse capsules in trapping heavy metals from water bodies. RSC Adv. 2020, 10, 16490–16501. [Google Scholar] [CrossRef] [PubMed] [Green Version]
- Galhoum, A.A.; Elshehy, E.A.; Tolan, D.A.; El-Nahas, A.M.; Taketsugu, T.; Nishikiori, K.; Akashi, T.; Morshedy, A.S.; Guibal, E. Synthesis of polyaminophosphonic acid-functionalized poly(glycidyl methacrylate) for the efficient sorption of La(III) and Y(III). Chem. Eng. J. 2019, 375, 121932. [Google Scholar] [CrossRef]
- Rangabhashiyam, S.; Anu, N.; Giri Nandagopal, M.S.; Selvaraju, N. Relevance of isotherm models in biosorption of pollutants by agricultural byproducts. J. Environ. Chem. Eng. 2014, 2, 398–414. [Google Scholar] [CrossRef]
- Liu, L.; Huang, Y.; Zhang, S.; Gong, Y.; Su, Y.; Cao, J.; Hu, H. Adsorption characteristics and mechanism of Pb(II) by agricultural waste-derived biochars produced from a pilot-scale pyrolysis system. Waste Manag. 2019, 100, 287–295. [Google Scholar] [CrossRef]
- Rashad, M.M.; El-Sayed, I.E.; Galhoum, A.A.; Abdeen, M.M.; Mira, H.I.; Elshehy, E.A.; Zhang, S.; Lu, X.; Xin, J.; Guibal, E. Synthesis of α-aminophosphonate based sorbents: Influence of inserted groups (carboxylic vs. amine) on uranyl sorption. Chem. Eng. J. 2021, 421, 127830. [Google Scholar] [CrossRef]
- Lima, E.C.; Hosseini-Bandegharaei, A.; Moreno-Piraján, J.C.; Anastopoulos, I. A critical review of the estimation of the thermodynamic parameters on adsorption equilibria. Wrong use of equilibrium constant in the Van’t Hoof equation for calculation of thermodynamic parameters of adsorption. J. Mol. Liq. 2019, 273, 425–434. [Google Scholar] [CrossRef]
- Bakather, O.Y.; Zouli, N.; Abutaleb, A.; Mahmoud, M.A.; Daher, A.; Hassan, M.; Eldoma, M.A.; Alasweda, S.O.; Fowad, A.A. Uranium (VI) ions uptake from liquid wastes by Solanum incanum leaves: Biosorption, desorption and recovery. Alex. Eng. J. 2020, 59, 1495–1504. [Google Scholar] [CrossRef]
- Zhang, Z.; Dong, Z.; Wang, X.; Dai, Y.; Cao, X.; Wang, Y.; Hua, R.; Feng, H.; Chen, J.; Liu, Y.; et al. Synthesis of ultralight phosphorylated carbon aerogel for efficient removal of U(VI): Batch and fixed-bed column studies. Chem. Eng. J. 2019, 370, 1376–1387. [Google Scholar] [CrossRef]
- Basu, H.; Saha, S.; Pimple, M.V.; Singhal, R.K. Novel hybrid material humic acid impregnated magnetic chitosan nano particles for decontamination of uranium from aquatic environment. J. Environ. Chem. Eng. 2019, 7, 103110. [Google Scholar] [CrossRef]
- Zhang, X.; Jiao, C.; Wang, J.; Liu, Q.; Li, R.; Yang, P.; Zhang, M. Removal of uranium(VI) from aqueous solutions by magnetic Schiff base: Kinetic and thermodynamic investigation. Chem. Eng. J. 2012, 198–199, 412–419. [Google Scholar] [CrossRef]
- Elwakeel, K.Z.; Atia, A.A. Uptake of U(VI) from aqueous media by magnetic Schiff’s base chitosan composite. J. Clean. Prod. 2014, 70, 292–302. [Google Scholar] [CrossRef]
- Song, Q.; Ma, L.; Liu, J.; Bai, C.; Geng, J.; Wang, H.; Li, B.; Wang, L.; Li, S. Preparation and adsorption performance of 5-azacytosine-functionalized hydrothermal carbon for selective solid-phase extraction of uranium. J. Colloid Interface Sci. 2012, 386, 291–299. [Google Scholar] [CrossRef] [PubMed]
- Son, D.; Cho, S.; Nam, J.; Lee, H.; Kim, M. X-ray based spectroscopic techniques for characterization of polymer nanocomposite materials at a molecular level. Polymers 2020, 12, 1053. [Google Scholar] [CrossRef]
- Rao Akshatha, S.; Sreenivasa, S.; Parashuram, L.; Raghu, M.S.; Yogesh Kumar, K.; Madhu Chakrapani Rao, T. Visible-light-induced photochemical hydrogen evolution and degradation of crystal violet dye by interwoven layered MoS2/wurtzite ZnS heterostructure photocatalyst. Chem. Sel. 2020, 5, 6918–6926. [Google Scholar]
- Hamza, M.F.; Hamad, D.M.; Hamad, N.A.; Abdel Rahman, A.A.H.; Fouda, A.; Wei, Y.; Guibal, E.; El-Etrawy, A.A.S. Functionalization of magnetic chitosan microparticles for high-performance removal of chromate from aqueous solutions and tannery effluent. Chem. Eng. J. 2022, 428, 131775. [Google Scholar] [CrossRef]
- Grosvenor, A.P.; Kobe, B.A.; Biesinger, M.C.; McIntyre, N.S. Investigation of multiplet splitting of Fe 2p XPS spectra and bonding in iron compounds. Surf. Interface Anal. 2004, 36, 1564–1574. [Google Scholar] [CrossRef]
- Esfandiari, N.; Kashefi, M.; Mirjalili, M.; Afsharnezhad, S. Role of silica mid-layer in thermal and chemical stability of hierarchical Fe3O4-SiO2-TiO2 nanoparticles for improvement of lead adsorption: Kinetics, thermodynamic and deep XPS investigation. Mater. Sci. Eng. B 2020, 262, 114690. [Google Scholar] [CrossRef]
- Wang, J.; Ma, X.; Qu, F.; Asiri, A.M.; Sun, X. Fe-doped Ni 2P nanosheet array for high efficiency electrochemical water oxidation. Inorg. Chem. 2017, 56, 1041–1044. [Google Scholar] [CrossRef] [PubMed]
- Ritcey, G.M.; Ashbrook, A.W. Solvent Extraction: Principles and Applications to Process Metallurgy; Elsevier: Amsterdam, NL, USA, 1984. [Google Scholar]
- Awual, M.R.; Suzuki, S.; Taguchi, T.; Shiwaku, H.; Okamoto, Y.; Yaita, T. Radioactive cesium removal from nuclear wastewater by novel inorganic and conjugate adsorbents. Chem. Eng. J. 2014, 242, 127–135. [Google Scholar] [CrossRef]
- Persson, I. Hydrated metal ions in aqueous solution: How regular are their structures? J. Pure Appl. Chem. 2010, 82, 1901–1917. [Google Scholar] [CrossRef]
- Shannon, R.D. Revised effective ionic radii and systematic studies of interatomic distances in halides and chalcogenides. Acta Crystallogr. A 1976, 32, 751–767. [Google Scholar] [CrossRef]


| Materials | C (%) | H (%) | N (%) | N (mmol/g) | S (%) |
|---|---|---|---|---|---|
| r-CT | 39.97 | 6.86 | 7.76 | 5.54 | --- |
| MCT | 18.91 | 4.07 | 3.58 | 2.56 | --- |
| CMCT | 18.35 | 3.93 | 3.01 | 2.15 | --- |
| AMCT | 15.82 | 3.23 | 1.98 | 1.41 | --- |
| Cys | 20.51 | 4.01 | 3.40 | 2.43 | 3.01 |
| Model | Parameters | Values |
|---|---|---|
| qmax, Exp. | (mmol U/g) | 0.455 |
| PFORE | K1 × 10−4 (min−1) | 748.478 |
| qmax,cal. * | 0.362 | |
| R2 | 0.953 | |
| PSORE | K2 × 10−4 (g/mmol.min) | 550.230 |
| qmax,cal.* | 0.475 | |
| R2 | 0.998 | |
| sRIPD | Kid,1 ** | 0.1051 |
| Kid,2 | 0.0361 | |
| Kid,3 | 0.0009 |
| T (K) | qmax.exp. * | Langmuir Isotherm | Freundlich Isotherm | Temkin Isotherm | ||||||
|---|---|---|---|---|---|---|---|---|---|---|
| qmax.cal., * | bL (L/mmol) | R2 | 1/n | KF * | R2 | AT (L.mmol) | BT (J/mol) | R2 | ||
| 298 | 0.546 | 0.576 | 17.58 | 0.9996 | 0.1963 | 0.576 | 0.933 | 876.731 | 0.0831 | 0.970 |
| 308 | 0.522 | 0.553 | 16.49 | 0.9993 | 0.1987 | 0.549 | 0.914 | 789.342 | 0.0806 | 0.956 |
| 318 | 0.501 | 0.532 | 15.25 | 0.9993 | 0.2051 | 0.526 | 0.905 | 640.533 | 0.0796 | 0.949 |
| 328 | 0.480 | 0.512 | 14.48 | 0.9991 | 0.2052 | 0.502 | 0.9264 | 601.364 | 0.0769 | 0.964 |
| Temp. (K) | ∆H° (kJ/mol) | ∆S° (J/mol) | ∆G° (kJ/mol) | T∆S° (kJ/mol) | R2 |
|---|---|---|---|---|---|
| 298 | −6.131 | 97.473 | −35.18 | 29.05 | 0.9872 |
| 308 | −36.15 | 30.02 | |||
| 318 | −37.13 | 31.00 | |||
| 323 | −37.61 | 31.48 |
| Sorbent | pH0 | Teq (min) | SD (g/)L | Temp. (K) | qm,exp * | qm,L * | bL (L/mmol) | Ref. |
|---|---|---|---|---|---|---|---|---|
| HCPs | 8.0 | 70 | 1.0 | 308 | 0.196 | 0.200 | 14.520 | [33] |
| SIL | 4.0 | 60 | 1.0 | 325 | 0.168 | 0.157 | 19.753 | [44] |
| Arg-Cell Glu-Cell | 5.0 | 180 | 0.5 | 318 | 0.581 0.676 | 0.618 0.705 | 17.852 24.993 | [12] |
| CA CA-PO4 | 5.5 | 120 | 1.0 | 298 | 0.431 0.631 | 0.431 0.631 | 26.183 52.366 | [45] |
| DETA-MC | 4.0 | 60 | 0.2 | 298 | 0.748 | 0.778 | 22.137 | [5] |
| HA-MCNPs | 5–7 | 20 | 1.0 | 333 | 46.3 | 47.9 | 3.166 | [46] |
| Mag. Schiff base | 6.0 | 360 | 0.02 | 298 | 0.396 | 0.416 | 138.176 | [47] |
| Schiff’s base-MC | 4.0 | 20 | 1.0 | 298 | 2.322 | 2.454 | 1.800 | [48] |
| HTC-Acy | 4.5 | 120 | 1.0 | 335 | 1.716 | --- | --- | [49] |
| Cys | 4.0 | 50 | 0.5 | 298 | 0547 | 0.576 | 17.58 | Here |
| Cycle No. | Sorption Step | Desorption Step | ||||
|---|---|---|---|---|---|---|
| SE (%) | qeq (mmol U/g) | DE (%) | Eluate Conc. (mmol U/L) | |||
| Average | St. Dev. | Average | Average | St. Dev. | Average | |
| 1 | 100 * | 0.00 | 0.515 | 97.88 | 0.19 | 0.504 |
| 2 | 97.11 | 0.08 | 0.500 | 96.77 | 0.26 | 0.498 |
| 3 | 95.65 | 0.17 | 0.492 | 95.05 | 0.48 | 0.480 |
| 4 | 93.81 | 0.06 | 0.483 | 95.43 | 0.86 | 0.476 |
| 5 | 92.36 | 0.25 | 0.475 | 94.07 | 0.50 | 0.454 |
| 6 | 91.52 | 0.05 | 0.471 | 93.00 | 0.76 | 0.442 |
| Δ(1st/6th) | −8.48 | −4.88 | ||||
| Signal | Bef. U–Sorption | Aft. U–Sorption | Possible Chemical Assignments | ||
|---|---|---|---|---|---|
| BE (eV) | AF (%) | BE (eV) | AF (%) | ||
| C 1s | 285.36 | 22.88 | 285.84 | 35.89 | C–H, C–C |
| 286.37 | 24.32 | 286.5 | 46.5 | C–S, C–N, C–O, C–O–C, | |
| 287.23 | 52.8 | 288.24 | 17.57 | C=O, COO- | |
| O 1s | 530.17 | 20.29 | 530.4 | 20.85 | Lattice O (Fe–O, Fe3O4) |
| 531.99 | 42.76 | 532.53 | 59.27 | C=O, O-C=O | |
| 532.98 | 36.95 | 533.14 | 19.88 | C–OH, H2O, C–O–C, Metal(OH)x | |
| N 1s | 399.54 | 64.37 | 399.41 | 30.59 | C–N |
| 401.36 | 35.63 | 400.9 | 69.41 | –NH2, >NH | |
| S 2p | 164.17 | 82.27 | 164.17 | 59.11 | C–S (2p3/2) |
| 168.05 | 17.73 | 167.98 | 14.43 | C–S–C (S 2p1/2) | |
| 169.43 | 26.47 | S–O (S 2p3/2 Sulfate) | |||
| Fe 2p | 710.68 | 31.18 | 710.92 | 42.75 | Fe 2p3/2 (Fe3+–octa) |
| 713.23 | 19.42 | 713.45 | 16.2 | Fe 2p3/2 (multipl–Fe2+–octa) | |
| 716.96 | 7.97 | 717.02 | 5.62 | Fe 2p3/2 (Fe3+–tetra) | |
| 719.99 | 8.72 | 720.02 | 4.25 | Fe 2p1/2 (Fe3+–Satallite) | |
| 724.31 | 19.88 | 724.1 | 17.36 | Fe 2p1/2 (Fe2+–octa) | |
| 727.69 | 7.8 | 726.91 | 9.48 | Fe 2p1/2 (Fe3+–tetra) | |
| 732.39 | 4.97 | 733.21 | 4.34 | Fe 2p3/2 (Fe3+–octa) | |
| U 4f | 381.82 | 58.44 | U 4f7/2 (U(VI)) | ||
| 385.61 | 6.12 | U 4f7/2 (U(VI) –Satellite) | |||
| 392.12 | 22 | U 4f5/2 (U(VI)) | |||
| 393.07 | 13.44 | U 4f5/2(UVI –Satellite) | |||
| Element | Atomic Number | Hydrated Species | M-O Bond Distance (Å) | Mn+ Ion Radius (Å) [59] | Mn+ Ion Radius, (Å) [58] | Electronegativity (Pauling Units) |
|---|---|---|---|---|---|---|
| Co | 27 | Co(H2O)62+ | 2.08 | 0.74 | 0.745 | 1.88 |
| Sr | 38 | Sr(H2O)82+ | 2.62 | 1.28 | 1.26 | 0.95 |
| Cd | 48 | Cd(H2O)62+ | 2.3 | 0.96 | 0.95 | 1.69 |
| Cs | 55 | Cs(H2O)12+ | 3.25 * | 1.91 * | 1.88 | 0.79 |
| Ba | 56 | Ba(H2O)82+ | 2.82 | 1.48 | 1.42 | 0.89 |
| La | 57 | La(H2O)93+ | 2.52 + 2.64 | 1.18 + 1.30 | 1.216 | 1.1 |
| Ce | 58 | Ce(H2O)93+ | 2.54 | 1.2 | 1.196 | 1.12 |
| Eu | 63 | Eu(H2O)93+ | 2.425 | 1.085 | 1.062 | 1.2 |
| Yb | 70 | Yb(H2O)8.53+ | 2.32 | 0.98 | 0.985 | 1.11 |
| U | 92 | U(H2O)94+ | 2.42 | 1.08 | 1.05 | 1.38 |
| UO2(H2O)52+ | (1.70) + 2.42 | 1.08 | 1.38 |
Publisher’s Note: MDPI stays neutral with regard to jurisdictional claims in published maps and institutional affiliations. |
© 2022 by the authors. Licensee MDPI, Basel, Switzerland. This article is an open access article distributed under the terms and conditions of the Creative Commons Attribution (CC BY) license (https://creativecommons.org/licenses/by/4.0/).
Share and Cite
Al-Ghamdi, A.A.; Galhoum, A.A.; Alshahrie, A.; Al-Turki, Y.A.; Al-Amri, A.M.; Wageh, S. Mesoporous Magnetic Cysteine Functionalized Chitosan Nanocomposite for Selective Uranyl Ions Sorption: Experimental, Structural Characterization, and Mechanistic Studies. Polymers 2022, 14, 2568. https://doi.org/10.3390/polym14132568
Al-Ghamdi AA, Galhoum AA, Alshahrie A, Al-Turki YA, Al-Amri AM, Wageh S. Mesoporous Magnetic Cysteine Functionalized Chitosan Nanocomposite for Selective Uranyl Ions Sorption: Experimental, Structural Characterization, and Mechanistic Studies. Polymers. 2022; 14(13):2568. https://doi.org/10.3390/polym14132568
Chicago/Turabian StyleAl-Ghamdi, Ahmed A., Ahmed A. Galhoum, Ahmed Alshahrie, Yusuf A. Al-Turki, Amal M. Al-Amri, and S. Wageh. 2022. "Mesoporous Magnetic Cysteine Functionalized Chitosan Nanocomposite for Selective Uranyl Ions Sorption: Experimental, Structural Characterization, and Mechanistic Studies" Polymers 14, no. 13: 2568. https://doi.org/10.3390/polym14132568
APA StyleAl-Ghamdi, A. A., Galhoum, A. A., Alshahrie, A., Al-Turki, Y. A., Al-Amri, A. M., & Wageh, S. (2022). Mesoporous Magnetic Cysteine Functionalized Chitosan Nanocomposite for Selective Uranyl Ions Sorption: Experimental, Structural Characterization, and Mechanistic Studies. Polymers, 14(13), 2568. https://doi.org/10.3390/polym14132568