
Optimization of Ultrasonic Welding Process Parameters to Enhance Weld Strength of 3C Power Cases Using a Design of Experiments Approach


Abstract
:1. Introduction
2. Experimental Details
3. Results and Discussion
3.1. Amplitude
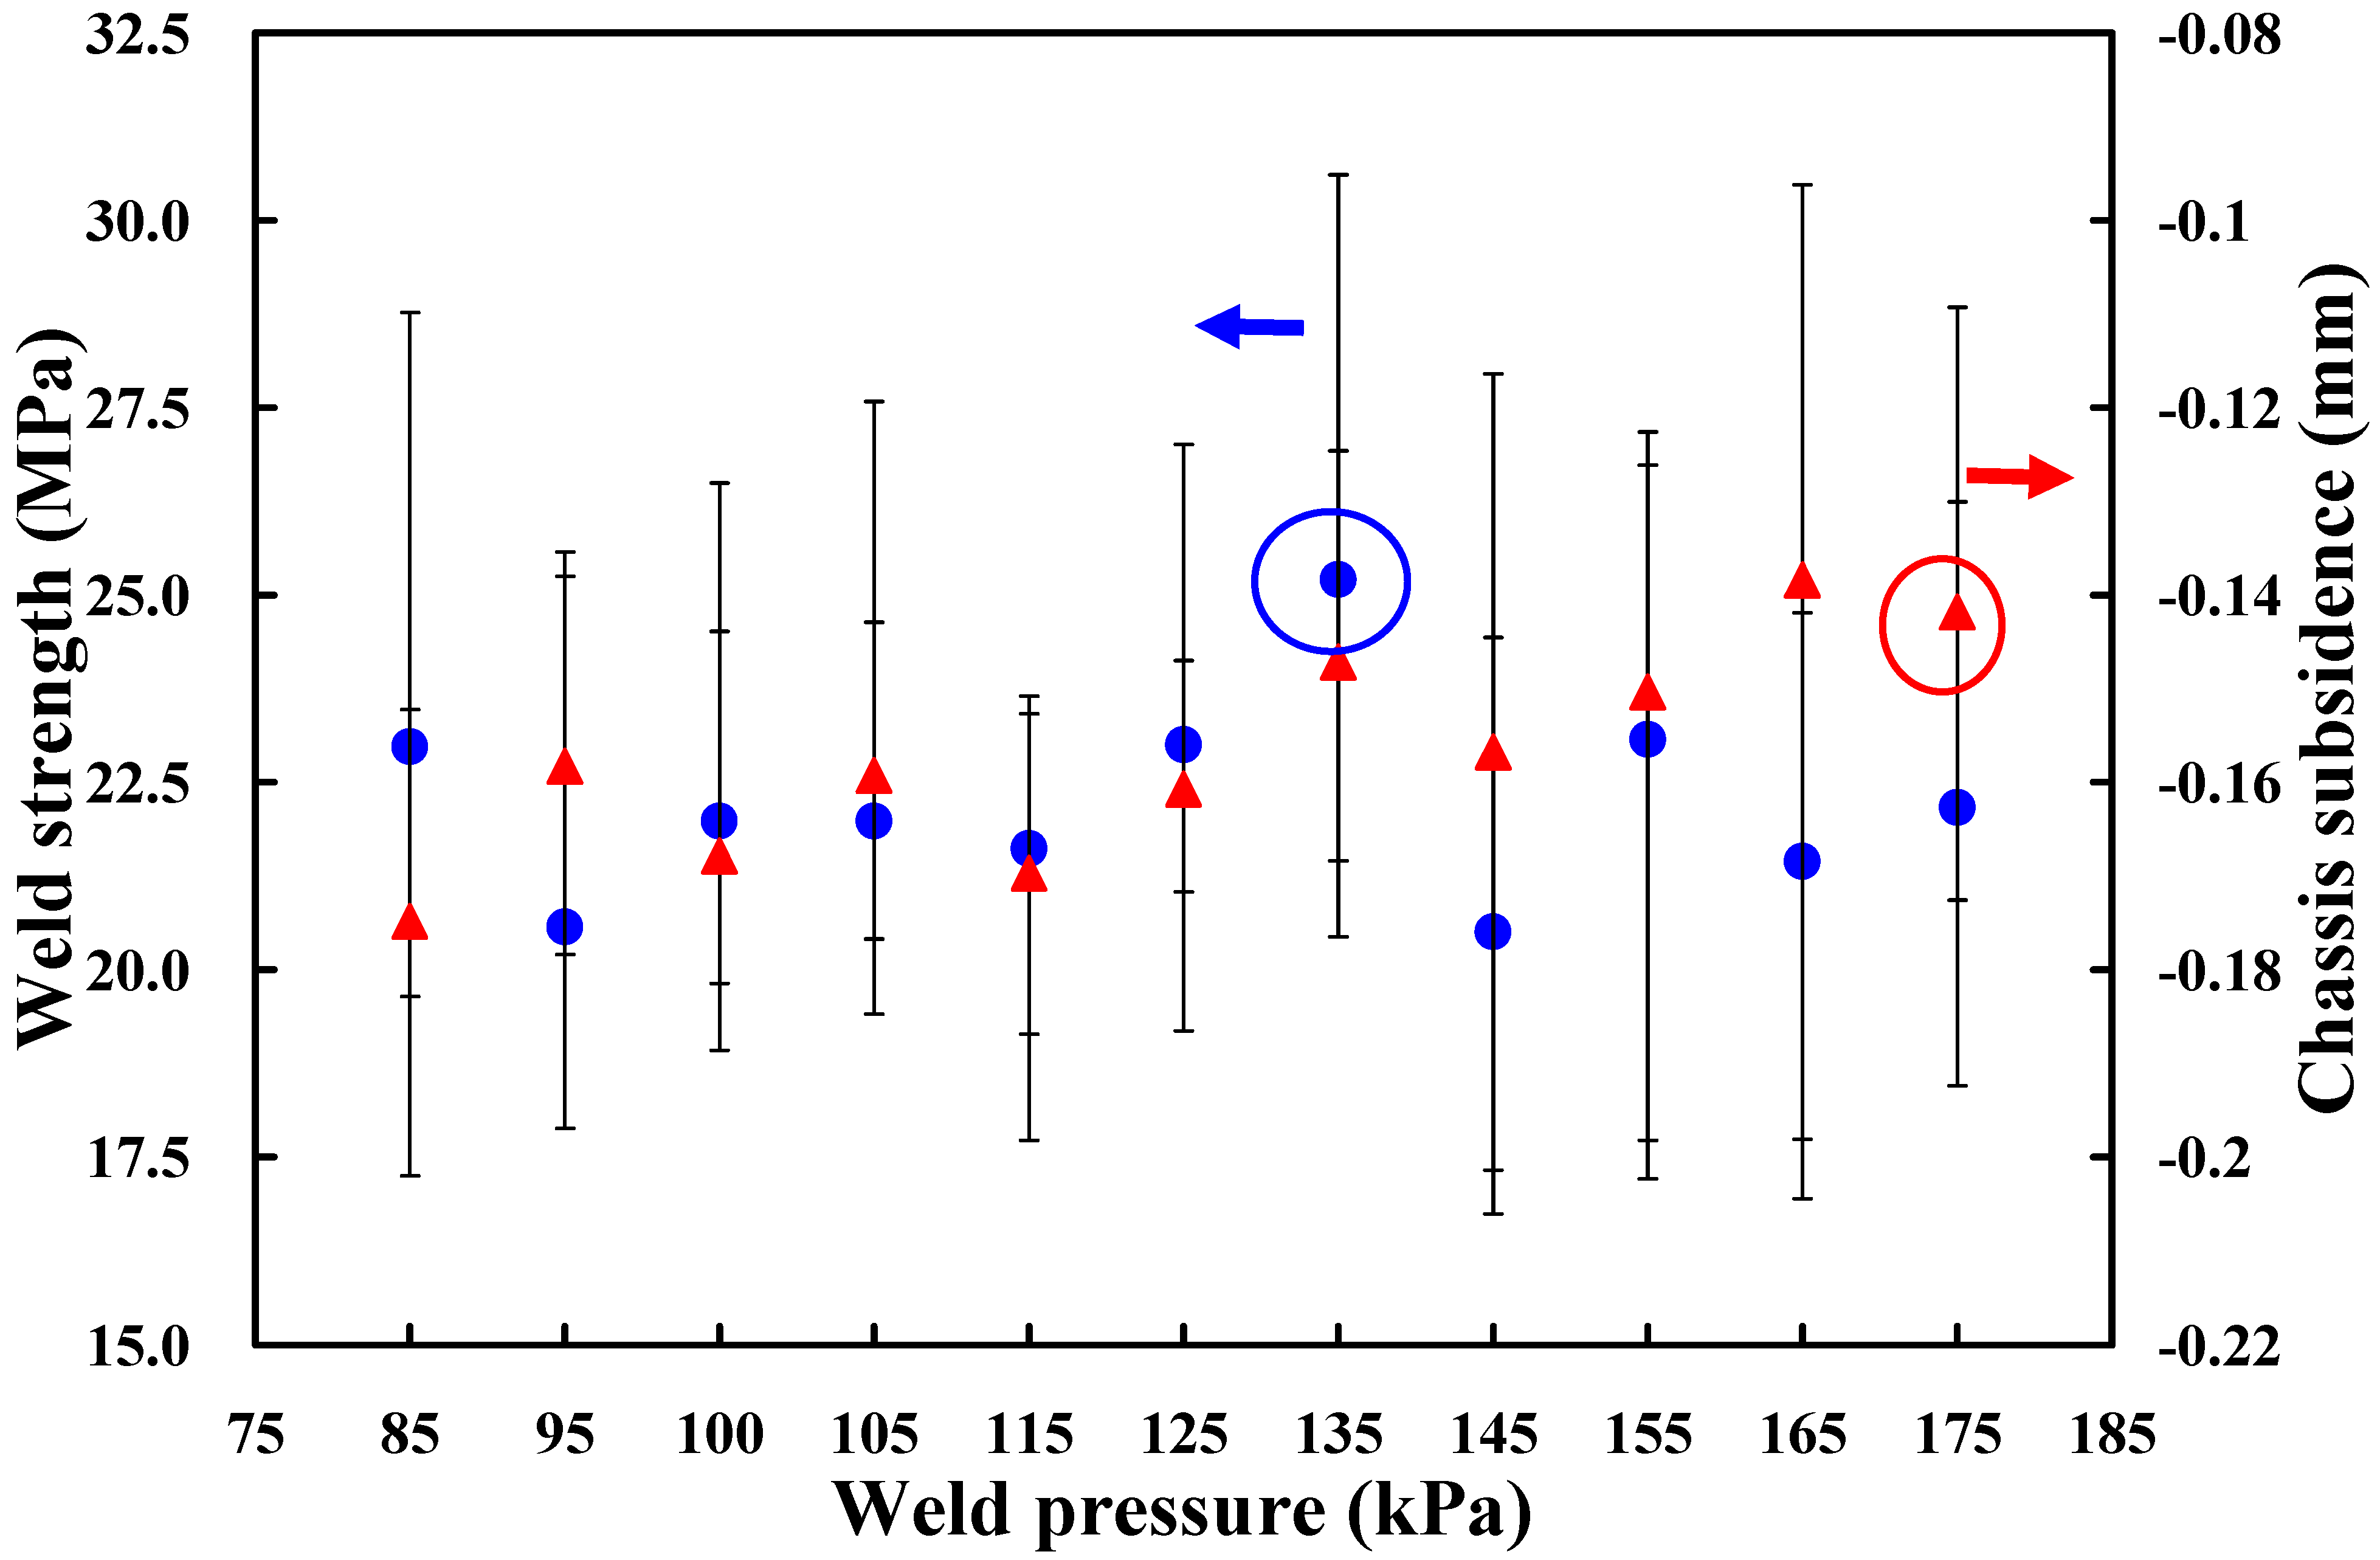
3.2. Weld Pressure
3.3. Trigger Position
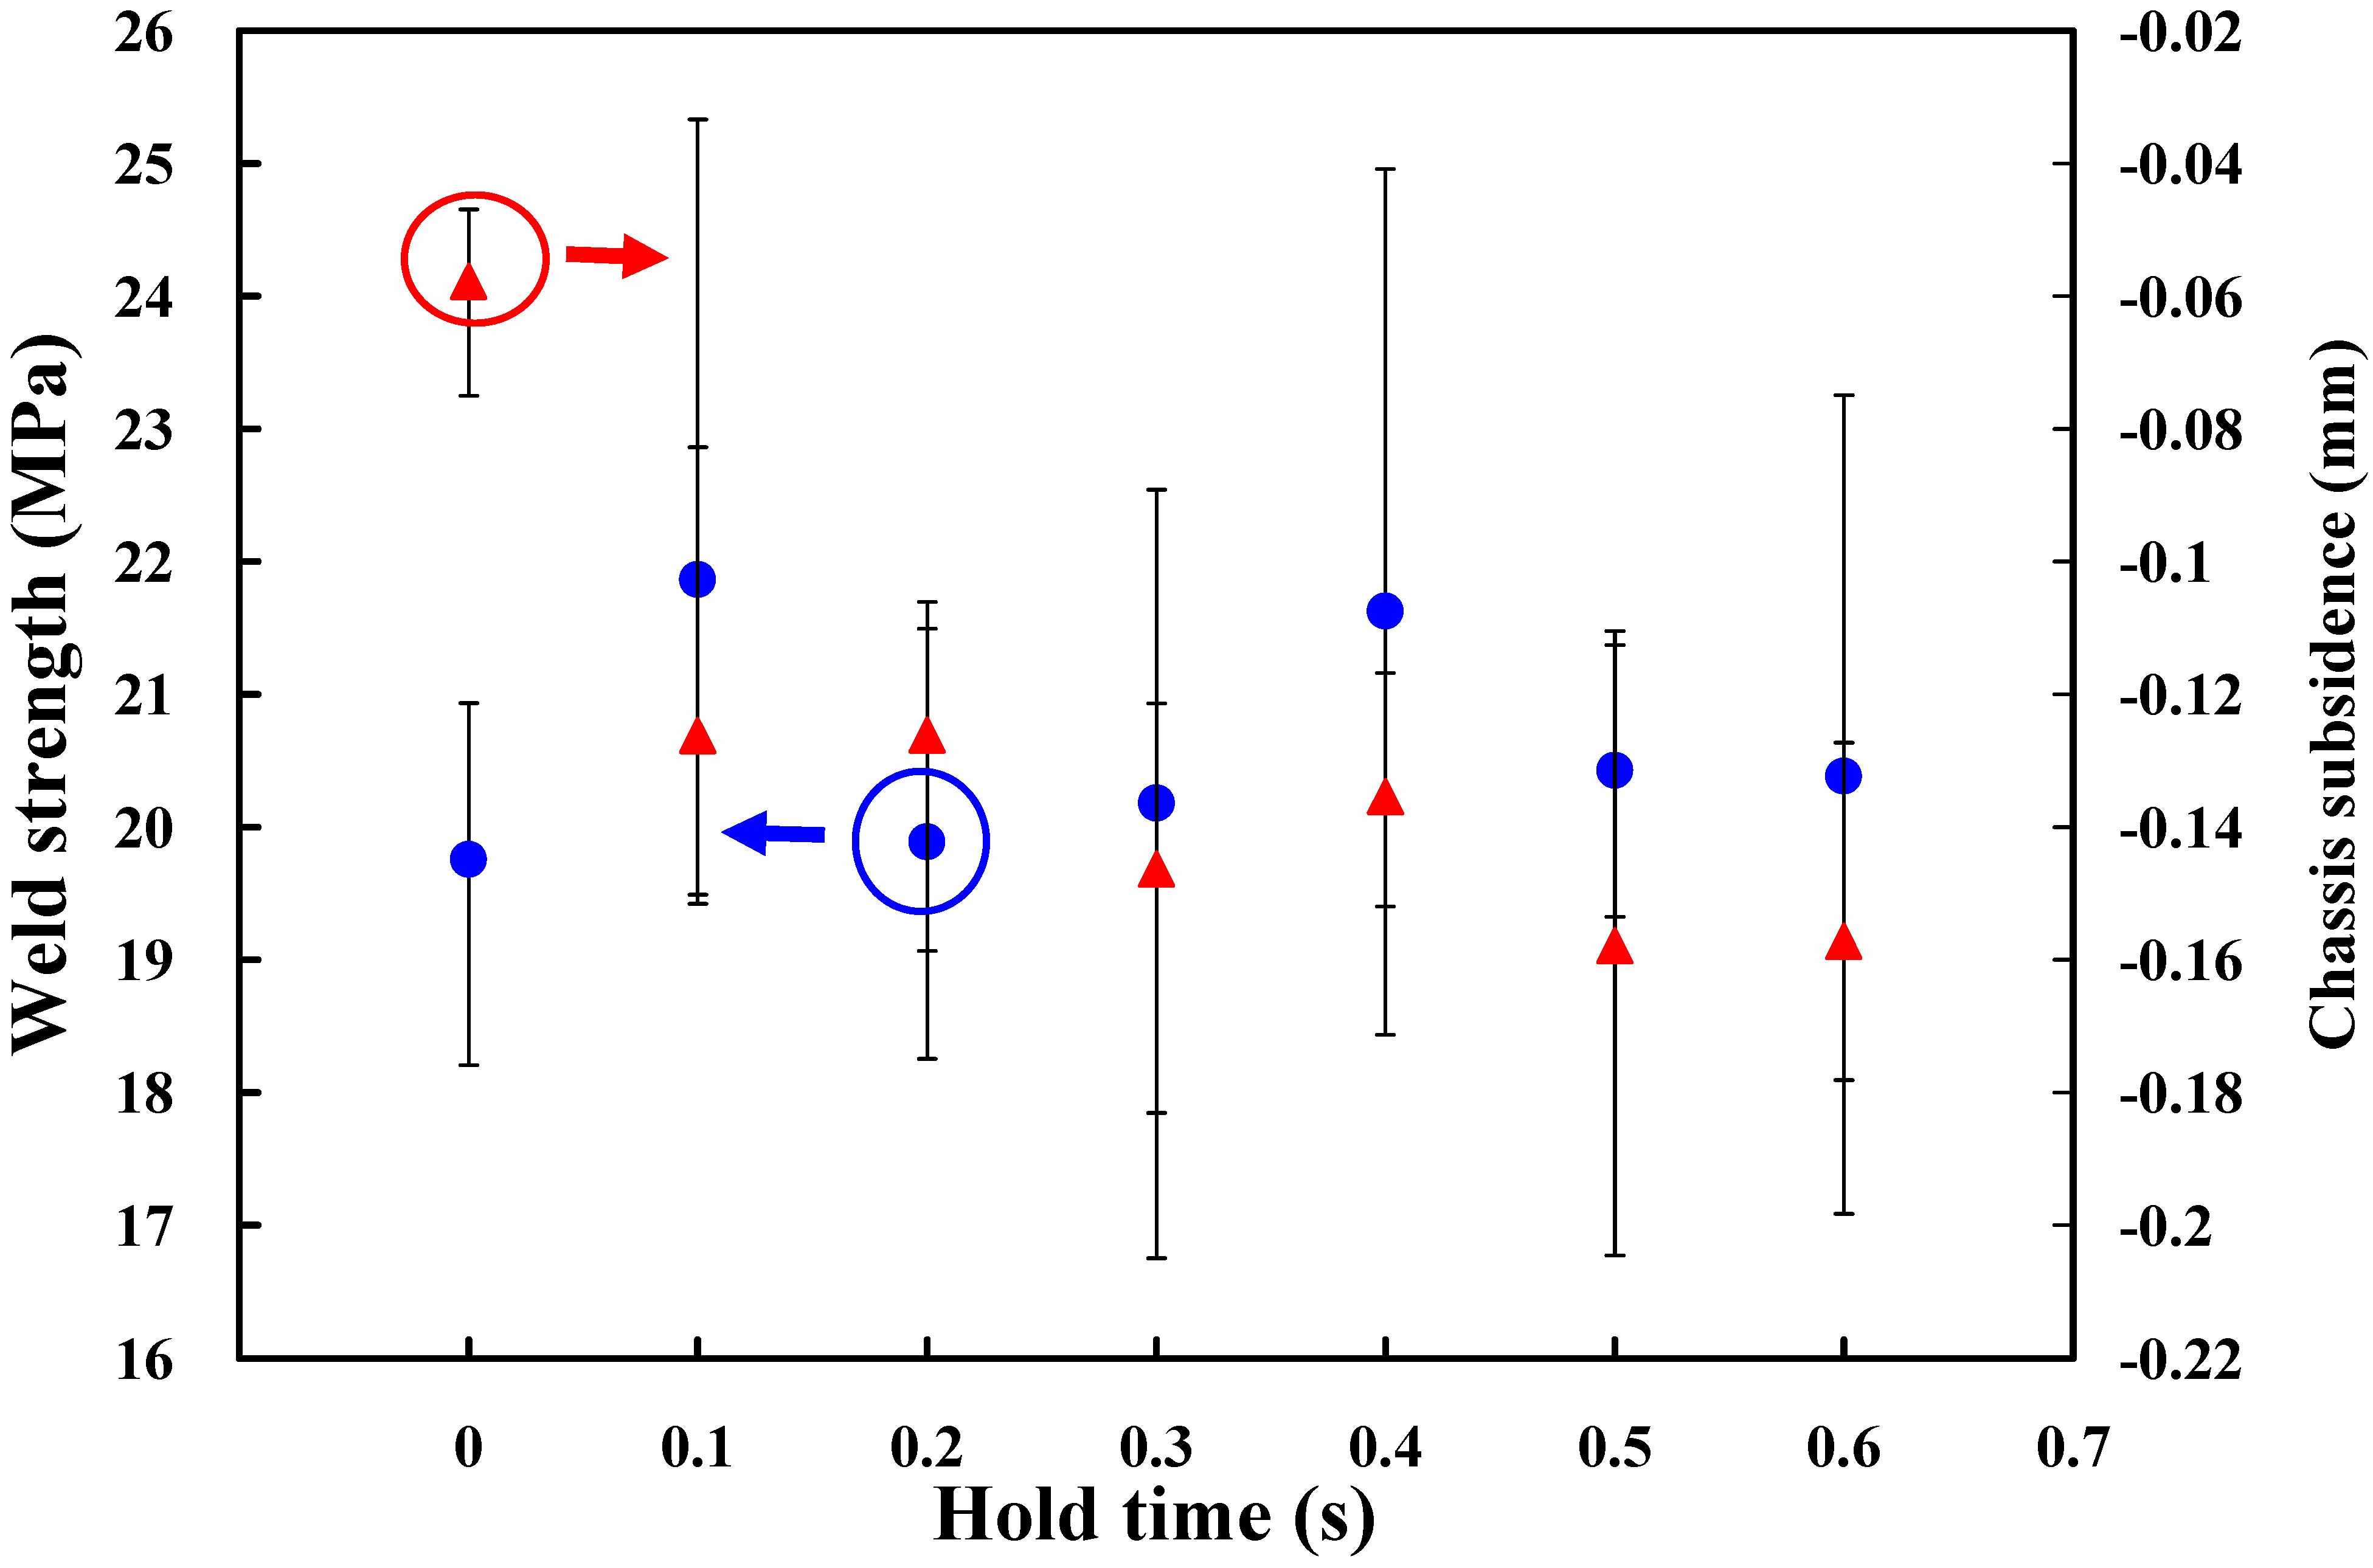
3.4. Hold Time
4. Conclusions
- The remarkable findings in this study are very practical and provide potential applications in industry because investigation of optimum UW process parameters for a new 3C plastic power case in current industry is possible.
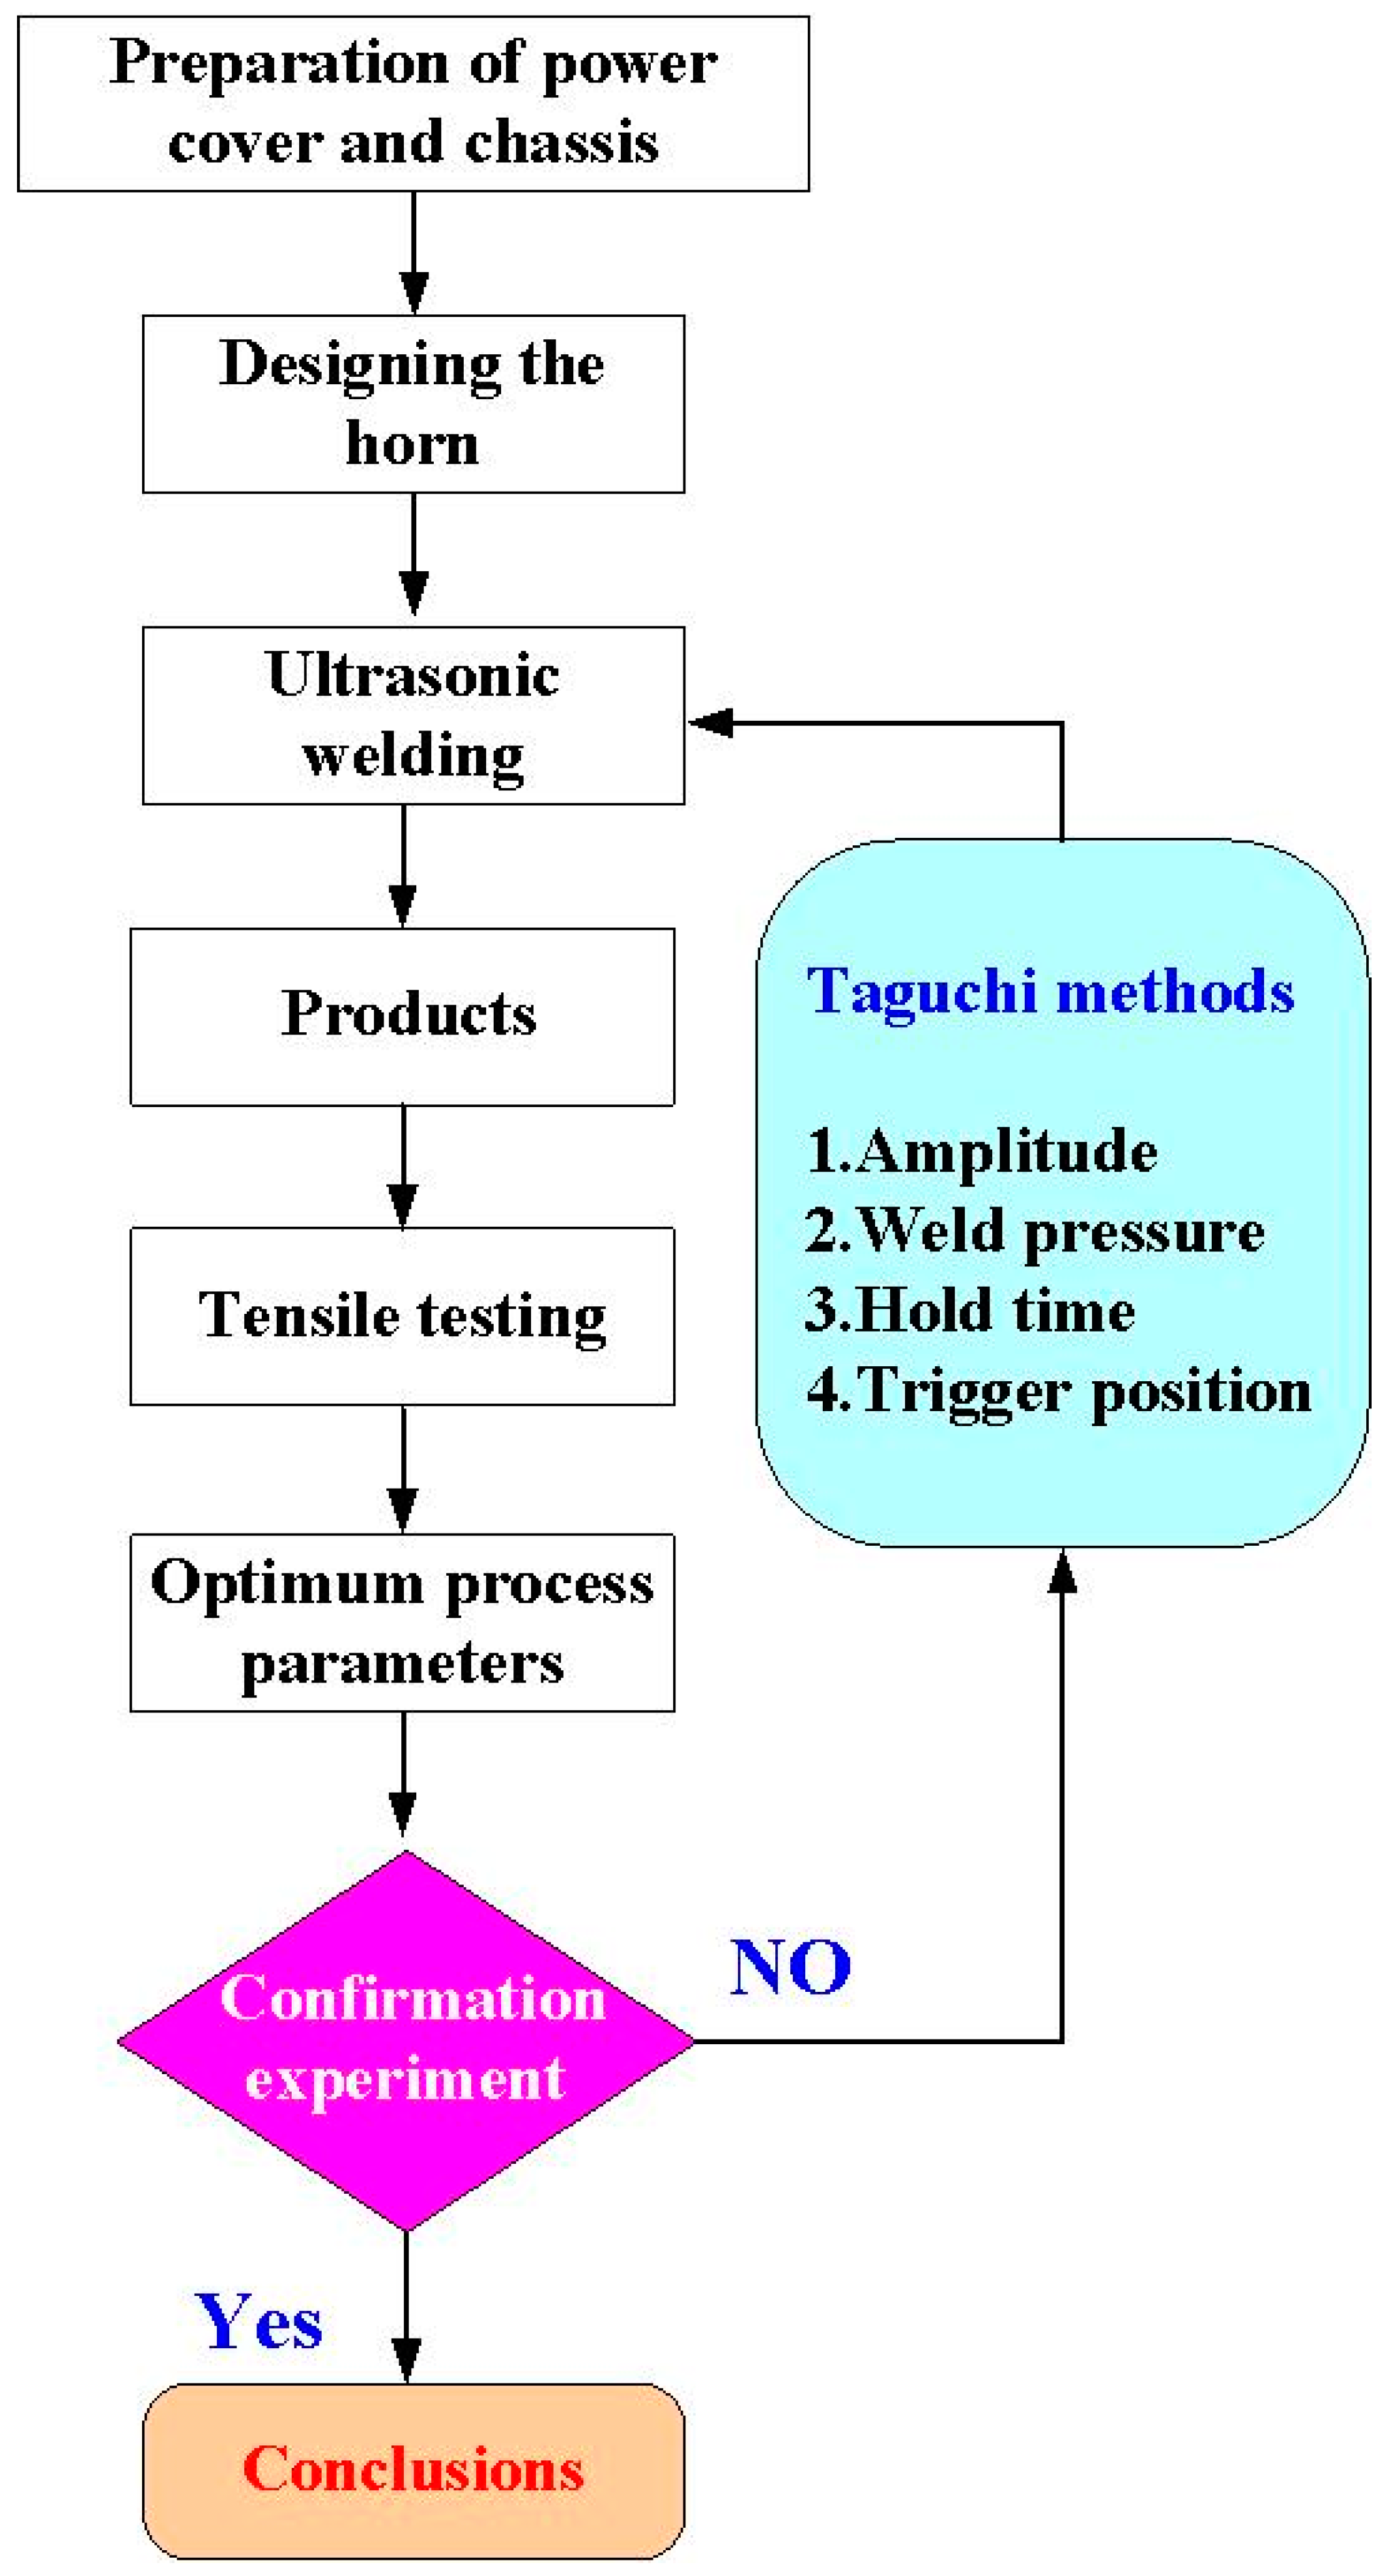
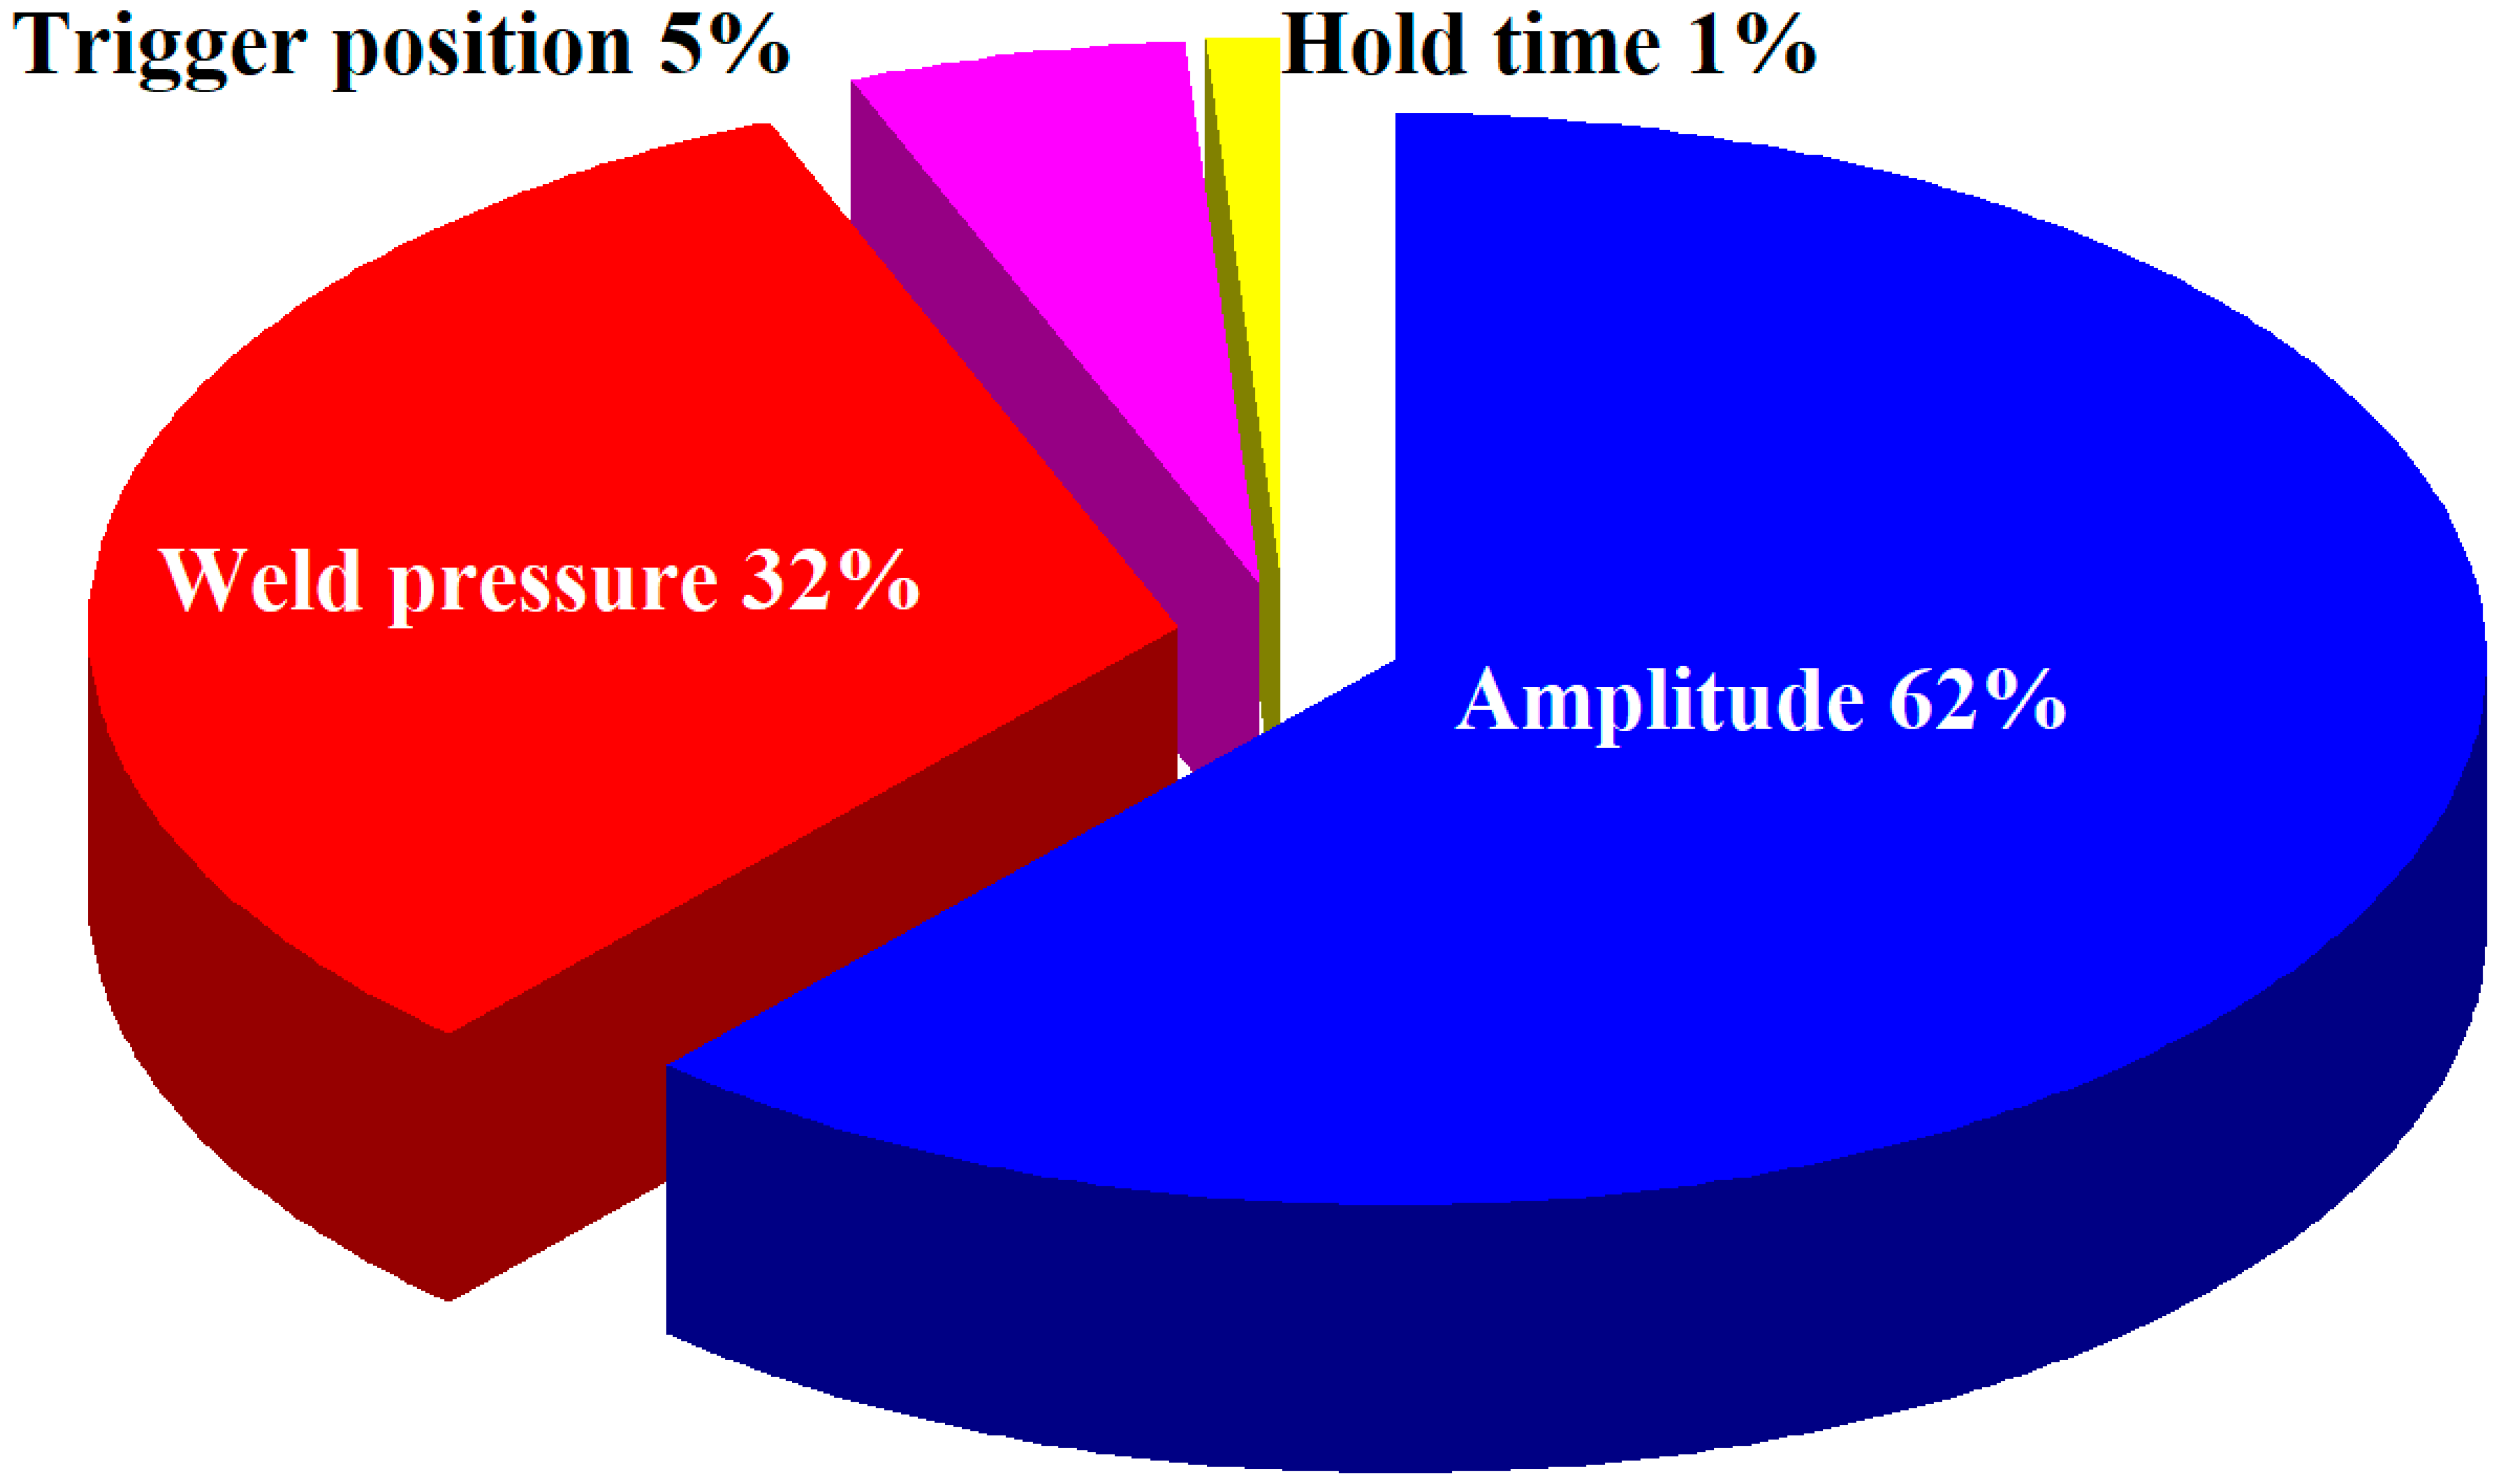
- The most important control factor influencing weld strength is amplitude, followed by weld pressure, hold time, and trigger position.
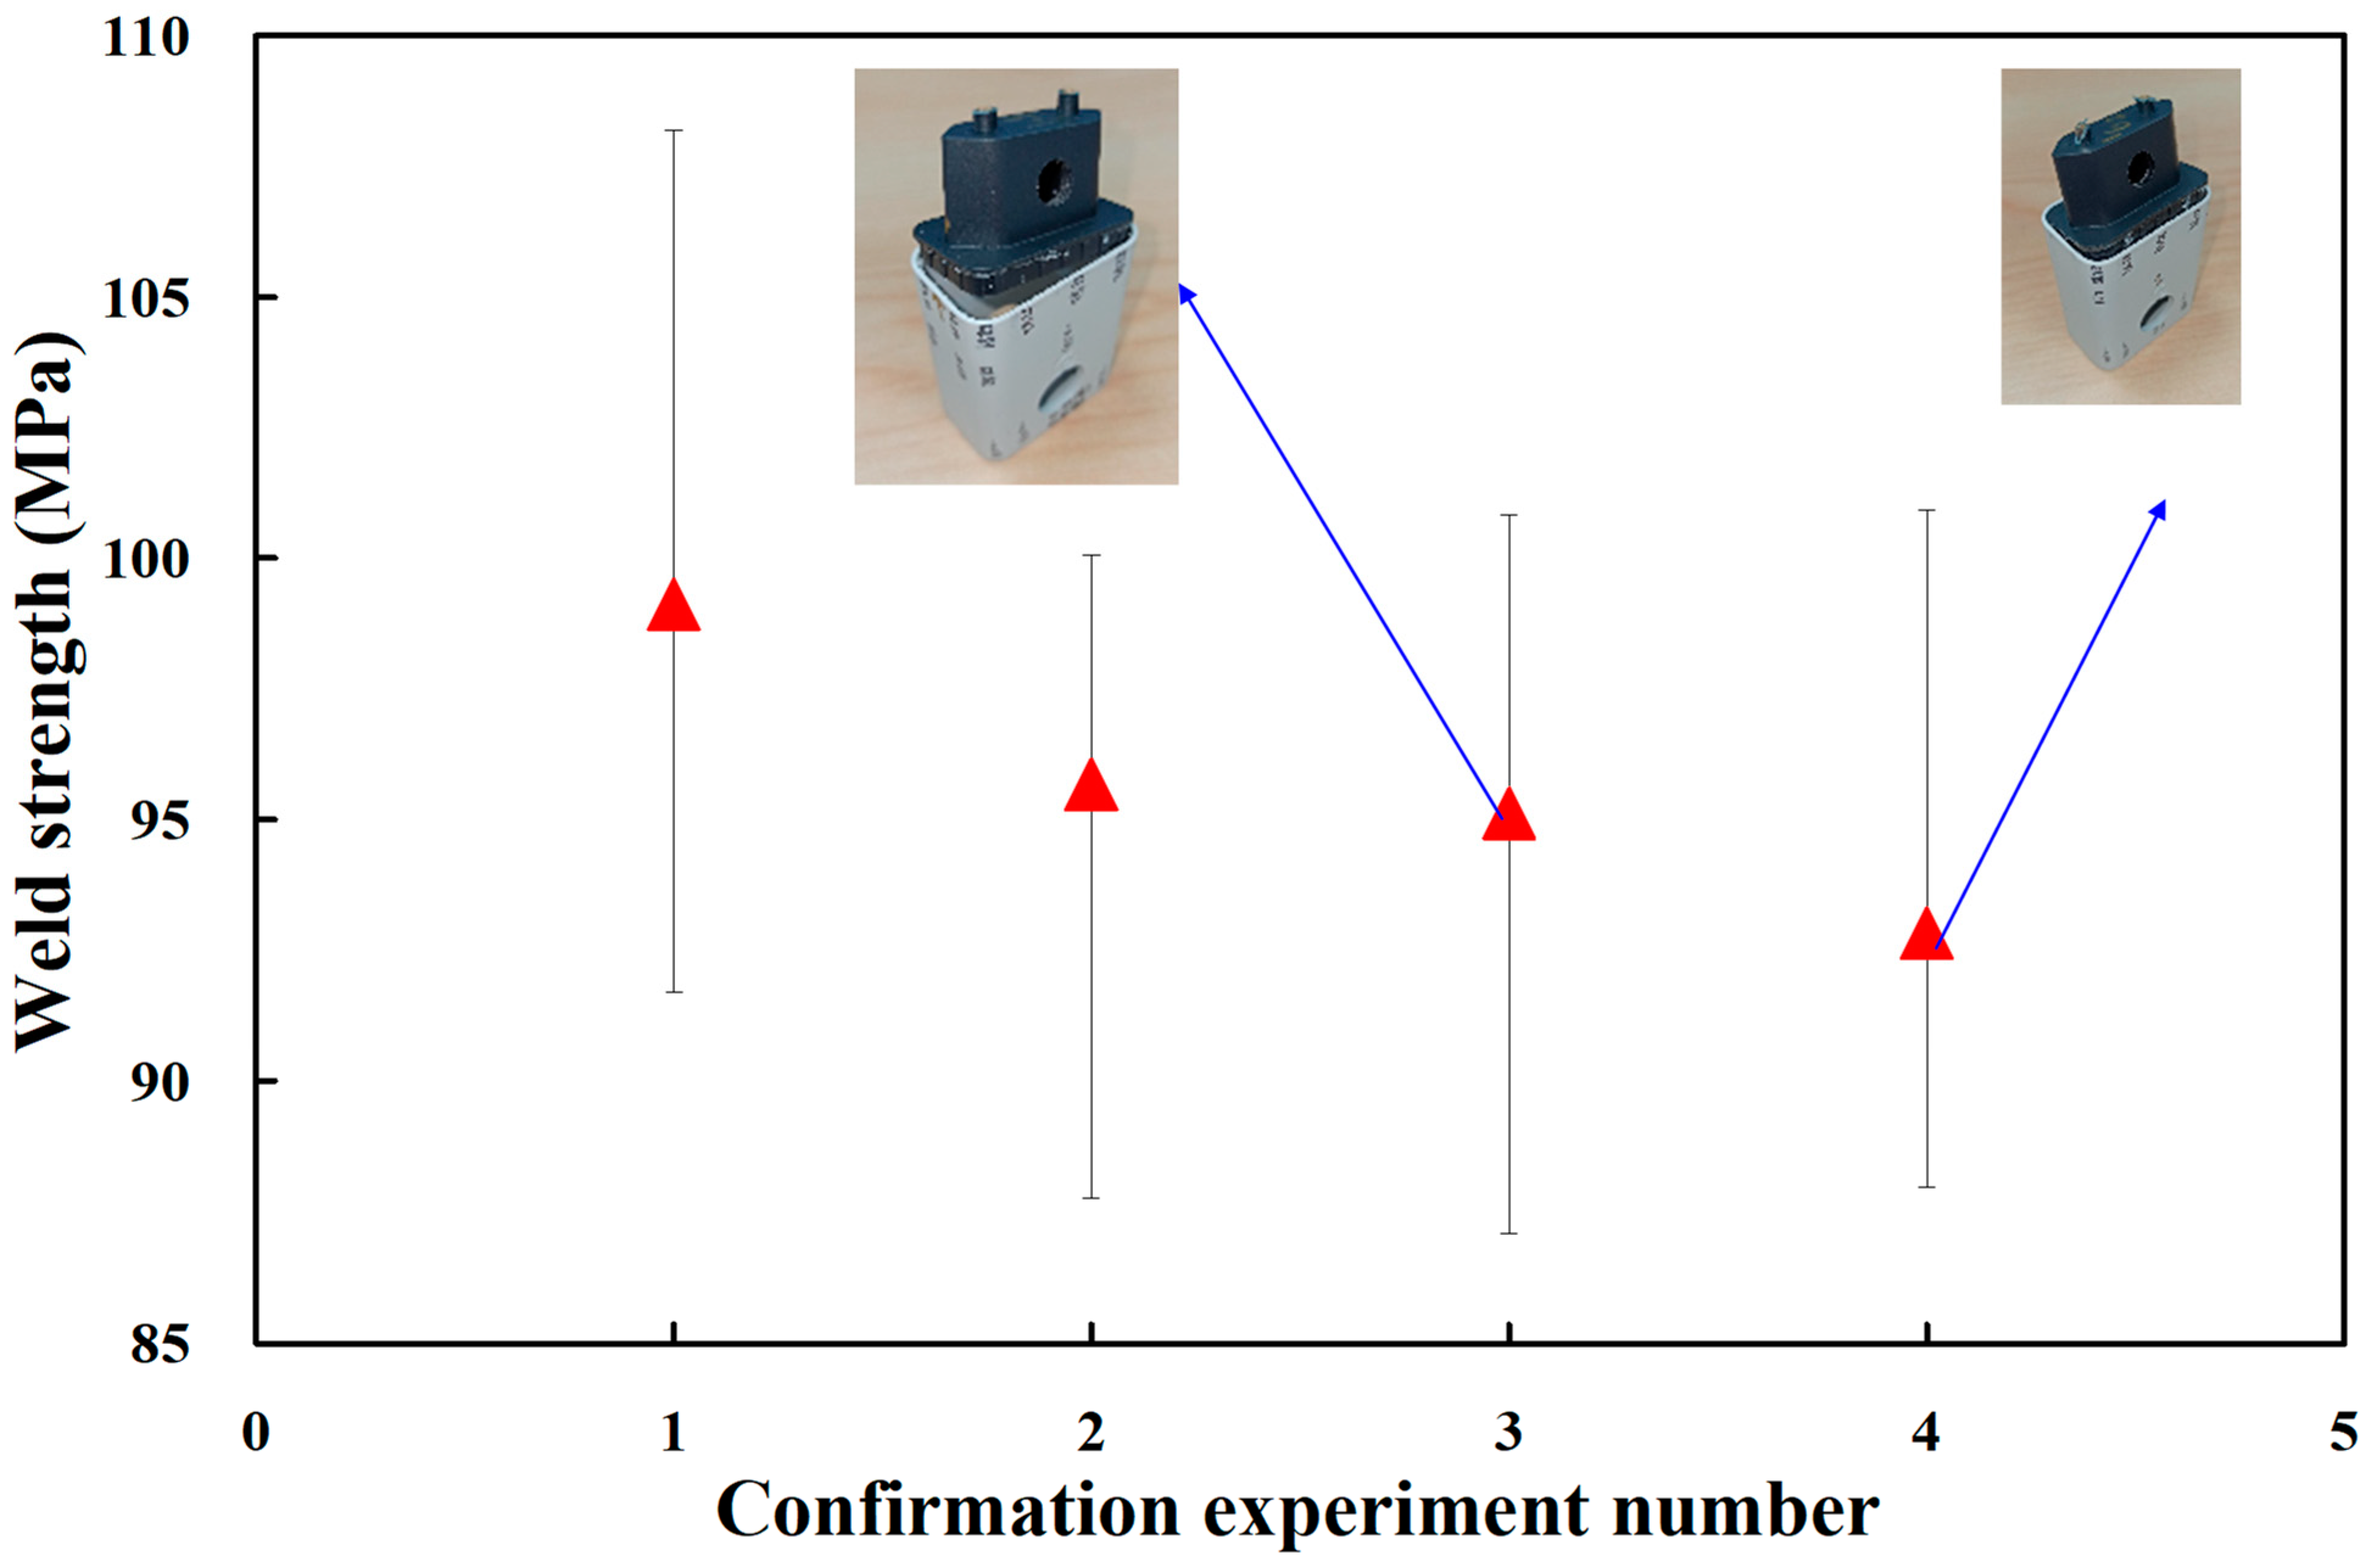
- Confirmation experiments were performed to verify the obtained optimum process parameters. The optimum UW process parameters are amplitude of 43.4 µm, weld pressure of 115 kPa, hold time of 0.4 s, and trigger position of 69.95 mm.
Author Contributions
Funding
Institutional Review Board Statement
Informed Consent Statement
Data Availability Statement
Conflicts of Interest
References
- Li, H.; Chen, C.; Yi, R.; Li, Y.; Wu, J. Ultrasonic welding of fiber-reinforced thermoplastic composites: A review. Int. J. Adv. Manuf. Technol. 2022, 120, 29–57. [Google Scholar] [CrossRef]
- Raza, S.F.; Khan, S.A.; Mughal, M.P. Optimizing the weld factors affecting ultrasonic welding of thermoplastics. Int. J. Adv. Manuf. Technol. 2019, 103, 2053–2067. [Google Scholar] [CrossRef]
- Ma, Z.; Sun, X.; Ji, S.; Wang, Y.; Yue, Y. Influences of ultrasonic on friction stir welding of Al/Ti dissimilar alloys under different welding conditions. Int. J. Adv. Manuf. Technol. 2021, 112, 2573–2582. [Google Scholar] [CrossRef]
- Zhi, Q.; Li, Y.; Shu, P.; Tan, X.; Tan, C.; Liu, Z. Double-Pulse Ultrasonic Welding of Carbon-Fiber-Reinforced Polyamide 66 Composite. Polymers 2022, 14, 714. [Google Scholar] [CrossRef] [PubMed]
- Fan, C.; Chen, C.; Lin, S.; Liu, Z.; Cai, X.; Yang, Y. Microstructure homogenization of 2A14 aluminum alloy weld seam by ultrasonic irradiation in metal inert gas welding. Int. J. Adv. Manuf. Technol. 2020, 108, 1085–1089. [Google Scholar] [CrossRef]
- Ni, Z.L.; Yang, J.J.; Hao, Y.X.; Chen, L.F.; Li, S.; Wang, X.X.; Ye, F.X. Ultrasonic spot welding of aluminum to copper: A review. Int. J. Adv. Manuf. Technol. 2020, 107, 585–606. [Google Scholar] [CrossRef]
- Das, A.; Masters, I.; Williams, D. Process robustness and strength analysis of multi-layered dissimilar joints using ultrasonic metal welding. Int. J. Adv. Manuf. Technol. 2019, 101, 881–900. [Google Scholar] [CrossRef] [Green Version]
- Alinaghian, I.; Honarpisheh, M.; Amini, S. The influence of bending mode ultrasonic-assisted friction stir welding of Al-6061-T6 alloy on residual stress, welding force and macrostructure. Int. J. Adv. Manuf. Technol. 2018, 95, 2757–2766. [Google Scholar] [CrossRef]
- Yang, Y.; Liu, Z.; Wang, Y.; Li, Y. Numerical Study of Contact Behavior and Temperature Characterization in Ultrasonic Welding of CF/PA66. Polymers 2022, 14, 683. [Google Scholar] [CrossRef]
- Dobrotă, D.; Lazăr, S.V. Ultrasonic Welding of PBT-GF30 (70% Polybutylene Terephthalate + 30% Fiber Glass) and Expanded Polytetrafluoroethylene (e-PTFE). Polymers 2021, 13, 298. [Google Scholar] [CrossRef]
- Qiu, J.; Zhang, G.; Sakai, E.; Liu, W.; Zang, L. Thermal Welding by the Third Phase Between Polymers: A Review for Ultrasonic Weld Technology Developments. Polymers 2020, 12, 759. [Google Scholar] [CrossRef] [PubMed] [Green Version]
- Jongbloed, B.C.P.; Teuwen, J.J.E.; Benedictus, R.; Villegas, I.F. A Study on Through-the-Thickness Heating in Continuous Ultrasonic Welding of Thermoplastic Composites. Materials 2021, 14, 6620. [Google Scholar] [CrossRef] [PubMed]
- Micus, S.; Rostami, S.G.; Haupt, M.; Gresser, G.T.; Meghrazi, M.A.; Eskandarian, L. Integrating Electronics to Textiles by Ultrasonic Welding for Cable-Driven Applications for Smart Textiles. Materials 2021, 14, 5735. [Google Scholar] [CrossRef]
- Frederick, H.; Li, W.; Palardy, G. Disassembly Study of Ultrasonically Welded Thermoplastic Composite Joints via Resistance Heating. Materials 2021, 14, 2521. [Google Scholar] [CrossRef]
- Staab, F.; Prescher, M.; Balle, F.; Kirste, L. 3D X-ray Microscopy of Ultrasonically Welded Aluminum/Fiber-Reinforced Polymer Hybrid Joints. Materials 2021, 14, 1784. [Google Scholar] [CrossRef]
- Adnan, M.F.; AbdullahE, A.B.; Samad, Z. Springback behavior of AA6061 with non-uniform thickness section using Taguchi Method. Int. J. Adv. Manuf. Technol. 2017, 89, 2041–2052. [Google Scholar] [CrossRef]
- Akıncıoglu, S.; Gokkaya, H.; Uygur, I. The effects of cryogenic-treated carbide tools on tool wear and surface roughness of turning of Hastelloy C22 based on Taguchi method. Int. J. Adv. Manuf. Technol. 2016, 82, 303–314. [Google Scholar] [CrossRef]
- Mahmoudian, M.; Poursattar Marjani, A.; Hasanzadeh, R.; Moradian, M.; Mamaghani Shishavan, S. Optimization of mechanical properties of in situ polymerized poly(methyl methacrylate)/alumina nanoparticles nanocomposites using Taguchi approach. Polym. Bull. 2020, 77, 2837–2854. [Google Scholar] [CrossRef]
- Azadeh, A.; Gharibdousti, M.S.; Firoozi, M.; Baseri, M.; Alishahi, M.; Salehi, V. Selection of optimum maintenance policy using an integrated multi-criteria Taguchi modeling approach by considering resilience engineering. Int. J. Adv. Manuf. Technol. 2016, 84, 1067–1079. [Google Scholar] [CrossRef]
- Costa, D.M.D.; Paula, T.I.; Silva, P.A.P.; Paiva, A.P. Normal boundary intersection method based on principal components and Taguchi’s signal-to-noise ratio applied to the multiobjective optimization of 12L14 free machining steel turning process. Int. J. Adv. Manuf. Technol. 2016, 87, 825–834. [Google Scholar] [CrossRef]
- Effertz, P.S.; Quintino, L.; Infante, V. The optimization of process parameters for friction spot welded 7050-T76 aluminium alloy using a Taguchi orthogonal array. Int. J. Adv. Manuf. Technol. 2017, 91, 3683–3695. [Google Scholar] [CrossRef]
- Montoya-Zapata, D.; Posada, J.; Alvarez, P.; Creus, C.; Moreno, A.; Ortiz, I.; Ruiz-Salguero, O. Experimental and computational assessment of minimizing overfill in trajectory corners by laser velocity control of laser cladding. Int. J. Adv. Manuf. Technol. 2022, 119, 6393–6411. [Google Scholar] [CrossRef]
- Lin, C.-M.; Hung, Y.-T.; Tan, C.-M. Hybrid Taguchi–Gray Relation Analysis Method for Design of Metal Powder Injection-Molded Artificial Knee Joints with Optimum Powder Concentration and Volume Shrinkage. Polymers 2021, 13, 865. [Google Scholar] [CrossRef]
- Budiman, A.S.; Sahay, R.; Agarwal, K.; Fajarna, R.; Gunawan, F.E.; Baji, A.; Raghavan, N. Modeling Impact Mechanics of 3D Helicoidally Architected Polymer Composites Enabled by Additive Manufacturing for Lightweight Silicon Photovoltaics Technology. Polymers 2022, 14, 1228. [Google Scholar] [CrossRef]
- Liou, G.-Y.; Su, C.-W.; Huang, P.-W.; Hwang, S.-J.; Huang, C.-T.; Peng, H.-S. Fabrication and Property Characterization of Long-Glass-Fiber-Reinforced Polypropylene Composites Processed Using a Three-Barrel Injection Molding Machine. Polymers 2022, 14, 1251. [Google Scholar] [CrossRef]
- Kuo, C.-C.; Chen, J.-Y.; Chang, Y.-H. Optimization of Process Parameters for Fabricating Polylactic Acid Filaments Using Design of Experiments Approach. Polymers 2021, 13, 1222. [Google Scholar] [CrossRef]
- Abdulkadir, L.N.; Abou-El-Hossein, K.; Abioye, A.M.; Liman, M.M.; Cheng, Y.C.; Abbas, A.A. Process parameter selection for optical silicon considering both experimental and AE results using Taguchi L9 orthogonal design. Int. J. Adv. Manuf. Technol. 2019, 103, 4355–4367. [Google Scholar] [CrossRef]
- Kuo, C.C.; Tasi, Q.Z.; Xie, B.X.; Huang, J.-M.; Qiu, S.-X. Improving the quality of a circular cooling channel fabrication by fused filament fabrication using Taguchi methods. Int. J. Adv. Manuf. Technol. 2022, 120, 3353–3364. [Google Scholar] [CrossRef]
- Asmael, M.; Safaei, B.; Zeeshan, Q.; Zargar, O.; Nuhu, A.A. Ultrasonic machining of carbon fiber–reinforced plastic composites: A review. Int. J. Adv. Manuf. Technol. 2021, 113, 3079–3120. [Google Scholar] [CrossRef]
- Xiao, Y.; Sun, F.; Ran, J.Q.; Wang, B.; Zhong, J.-M.; Ma, J.; Luo, F. Ultrasonic micro punching with flexible punch for thin stainless sheet metal. Int. J. Adv. Manuf. Technol. 2020, 108, 2763–2773. [Google Scholar] [CrossRef]
- Arungalai Vendan, S.; Chinnadurai, T.; Senthil Kumar, K.; Prakash, N. Investigations on mechanical and structural aspects of ultrasonic hybrid polymer mixture welding for industrial applications. Int. J. Adv. Manuf. Technol. 2017, 93, 89–102. [Google Scholar] [CrossRef]
- Zhu, Z.; Lee, K.Y.; Wang, X. Ultrasonic welding of dissimilar metals, AA6061 and Ti6Al4V. Int. J. Adv. Manuf. Technol. 2012, 59, 569–574. [Google Scholar] [CrossRef]
- Mohd Basri, M.S.; Liew Min Ren, B.A.; Talib, R.; Zakaria, R.; Kamarudin, S.H. Novel Mangosteen-Leaves-Based Marker Ink: Color Lightness, Viscosity, Optimized Composition, and Microstructural Analysis. Polymers 2021, 13, 158. [Google Scholar] [CrossRef]
- Rashli, R.; Abu Bakar, E.; Kamaruddin, S. Determination of Ultrasonic Welding Optimal Parameters for Thermoplastic Material of Manufacturing Products. J. Teknol. 2013, 64. [Google Scholar] [CrossRef] [Green Version]
- Kechagias, J.D.; Ninikas, K.; Petousis, M.; Vidakis, N. Laser cutting of 3D printed acrylonitrile butadiene styrene plates for dimensional and surface roughness optimization. Int. J. Adv. Manuf. Technol. 2022, 119, 2301–2315. [Google Scholar] [CrossRef]
- Hentati, F.; Hadriche, I.; Masmoudi, N.; Bradai, C. Optimization of the injection molding process for the PC/ABS parts by integrating Taguchi approach and CAE simulation. Int. J. Adv. Manuf. Technol. 2019, 104, 4353–4363. [Google Scholar] [CrossRef]
- Cui, B.; Liu, S.; Zhang, F.; Luo, T.; Feng, M. Effect of welding heat input on pores in laser-arc hybrid welding of high nitrogen steel. Int. J. Adv. Manuf. Technol. 2022, 119, 421–434. [Google Scholar] [CrossRef]
- Rossi, F.; Magni, G.; Colasanti, R.; Banchelli, M.; Iacoangeli, M.; Carrassi, E.; Aiudi, D.; Di Rienzo, A.; Giannoni, L.; Pieri, L.; et al. Characterization and Ex Vivo Application of Indocyanine Green Chitosan Patches in Dura Mater Laser Bonding. Polymers 2021, 13, 2130. [Google Scholar] [CrossRef]


| Control Factor | Level 1 | Level 2 | Level 3 | |
|---|---|---|---|---|
| A | Amplitude (%) | 60 | 65 | 70 |
| B | Weld pressure (kPa) | 115 | 125 | 135 |
| C | Hold time (s) | 69.9 | 69.95 | 70 |
| D | Trigger position (mm) | 0.3 | 0.4 | 0.5 |
| Experiment No. | Control Factor | Weld Strength (MPa) | σ2 | S/N (dB) | |||||
|---|---|---|---|---|---|---|---|---|---|
| A | B | C | D | 1 | 2 | 3 | |||
| 1 | A1 | B1 | C1 | D1 | 18 | 22 | 21.6 | 2.23 | 26.14 |
| 2 | A1 | B2 | C2 | D2 | 20.2 | 22.4 | 17.1 | 2.65 | 25.82 |
| 3 | A1 | B3 | C3 | D3 | 22.8 | 21.6 | 13.9 | 4.82 | 25.11 |
| 4 | A2 | B1 | C2 | D3 | 24.3 | 23.9 | 20.2 | 2.27 | 27.06 |
| 5 | A2 | B2 | C3 | D1 | 24.6 | 18.1 | 20.1 | 3.36 | 26.21 |
| 6 | A 2 | B3 | C1 | D2 | 20.9 | 19.5 | 19.9 | 0.72 | 26.06 |
| 7 | A3 | B1 | C3 | D2 | 24.3 | 20.8 | 23.6 | 1.90 | 27.14 |
| 8 | A3 | B2 | C1 | D3 | 22.7 | 18.9 | 25 | 3.09 | 26.74 |
| 9 | A3 | B3 | C2 | D1 | 19.5 | 20.8 | 24.9 | 2.79 | 26.61 |
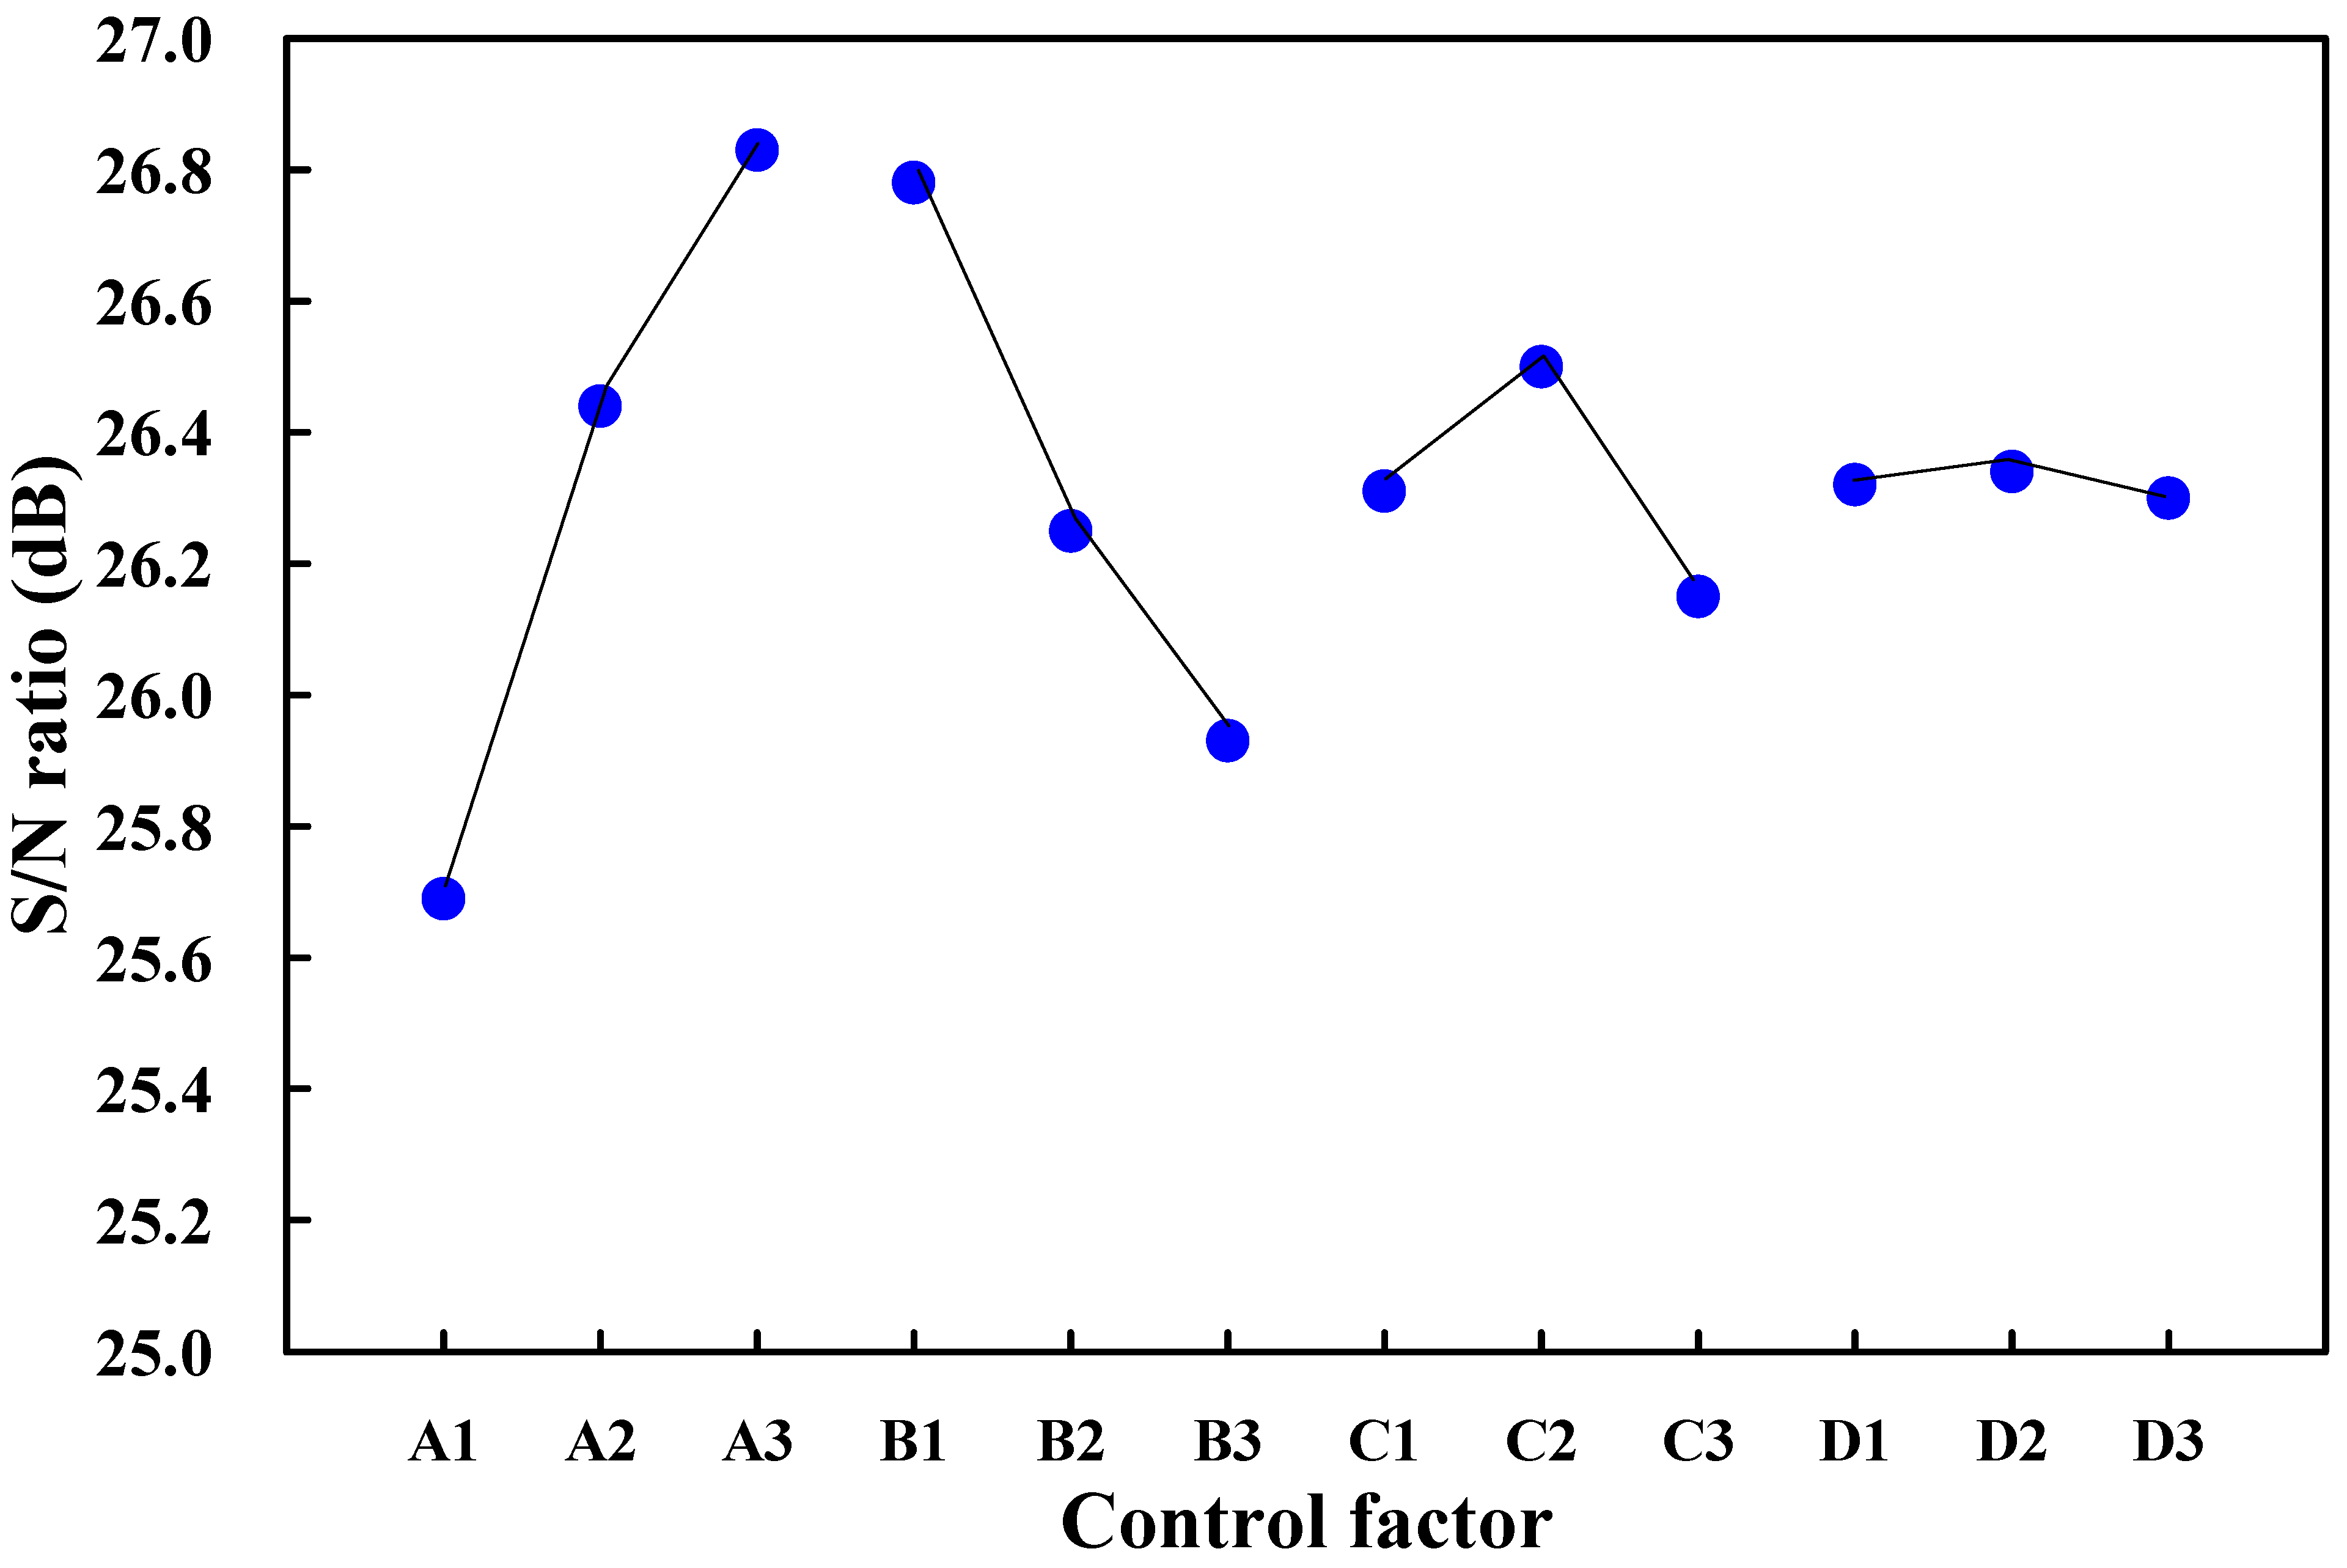
| Control Factor | Level 1 | Level 2 | Level 3 |
|---|---|---|---|
| Amplitude (%) | 25.69 | 26.44 | 26.83 |
| Weld pressure (kPa) | 26.78 | 26.25 | 25.93 |
| Hold time (s) | 26.31 | 26.50 | 26.15 |
| Trigger position (mm) | 26.32 | 26.34 | 26.30 |
| Control Factor | Leve1 | Level 2 | Level 3 | Sum of Squares | Degree of Freedom | Mean Squares | Contribution (%) | |
|---|---|---|---|---|---|---|---|---|
| A | Amplitude (%) | 25.69 | 26.44 | 26.83 | 2.018 | 2 | 1.009 | 62 |
| B | Weld pressure (kPa) | 26.78 | 26.25 | 25.93 | 1.106 | 2 | 0.553 | 32 |
| C | Hold time (s) | 26.31 | 26.50 | 26.15 | 0.177 | 2 | 0.089 | 5 |
| D | Trigger position (mm) | 26.32 | 26.34 | 26.30 | 0.002 | 2 | 0.001 | 1 |
| Confirmation Experiment Number | UW Process Parameters | Weld Strength (MPa) | |||||
|---|---|---|---|---|---|---|---|
| 1 | 2 | 3 | 4 | 5 | Average | ||
| 1 (Optimum process parameters) | Amplitude 43.4 µm | 18.80 | 17.44 | 17.81 | 20.56 | 19.61 | 18.85 |
| Weld pressure 115 kPa | |||||||
| Trigger position 69.95 mm | |||||||
| Hold time 0.4 s | |||||||
| 2 | Amplitude 37.2 µm | 16.69 | 18.526 | 18.51 | 18.20 | 19.03 | 18.19 |
| Weld pressure 135 kPa | |||||||
| Trigger position 69.95 mm | |||||||
| Hold time 0.3 s | |||||||
| 3 | Amplitude 40.3 µm | 16.56 | 18.57 | 19.17 | 18.46 | 17.66 | 18.09 |
| Weld pressure 125 kPa | |||||||
| Trigger position 69.90 mm | |||||||
| Hold time 0.5 s | |||||||
| 4 | Amplitude 43.4 µm | 17.33 | 16.73 | 17.19 | 19.19 | 17.81 | 17.66 |
| Weld pressure 125 kPa | |||||||
| Trigger position 70.00 mm | |||||||
| Hold time 0.3 s | |||||||
Publisher’s Note: MDPI stays neutral with regard to jurisdictional claims in published maps and institutional affiliations. |
© 2022 by the authors. Licensee MDPI, Basel, Switzerland. This article is an open access article distributed under the terms and conditions of the Creative Commons Attribution (CC BY) license (https://creativecommons.org/licenses/by/4.0/).
Share and Cite
Kuo, C.-C.; Tsai, Q.-Z.; Li, D.-Y.; Lin, Y.-X.; Chen, W.-X. Optimization of Ultrasonic Welding Process Parameters to Enhance Weld Strength of 3C Power Cases Using a Design of Experiments Approach. Polymers 2022, 14, 2388. https://doi.org/10.3390/polym14122388
Kuo C-C, Tsai Q-Z, Li D-Y, Lin Y-X, Chen W-X. Optimization of Ultrasonic Welding Process Parameters to Enhance Weld Strength of 3C Power Cases Using a Design of Experiments Approach. Polymers. 2022; 14(12):2388. https://doi.org/10.3390/polym14122388
Chicago/Turabian StyleKuo, Chil-Chyuan, Qing-Zhou Tsai, Ding-Yang Li, Yong-Xhi Lin, and Wen-Xiong Chen. 2022. "Optimization of Ultrasonic Welding Process Parameters to Enhance Weld Strength of 3C Power Cases Using a Design of Experiments Approach" Polymers 14, no. 12: 2388. https://doi.org/10.3390/polym14122388
APA StyleKuo, C.-C., Tsai, Q.-Z., Li, D.-Y., Lin, Y.-X., & Chen, W.-X. (2022). Optimization of Ultrasonic Welding Process Parameters to Enhance Weld Strength of 3C Power Cases Using a Design of Experiments Approach. Polymers, 14(12), 2388. https://doi.org/10.3390/polym14122388