
Modified Flory–Rehner Theory Describes Thermotropic Swelling Transition of Smart Copolymer Microgels


Abstract
:1. Introduction
2. Theory
2.1. Flory–Rehner Theory for Copolymer Microgels
2.2. Hill-like Model for the Interaction Parameter
3. Results and Discussion
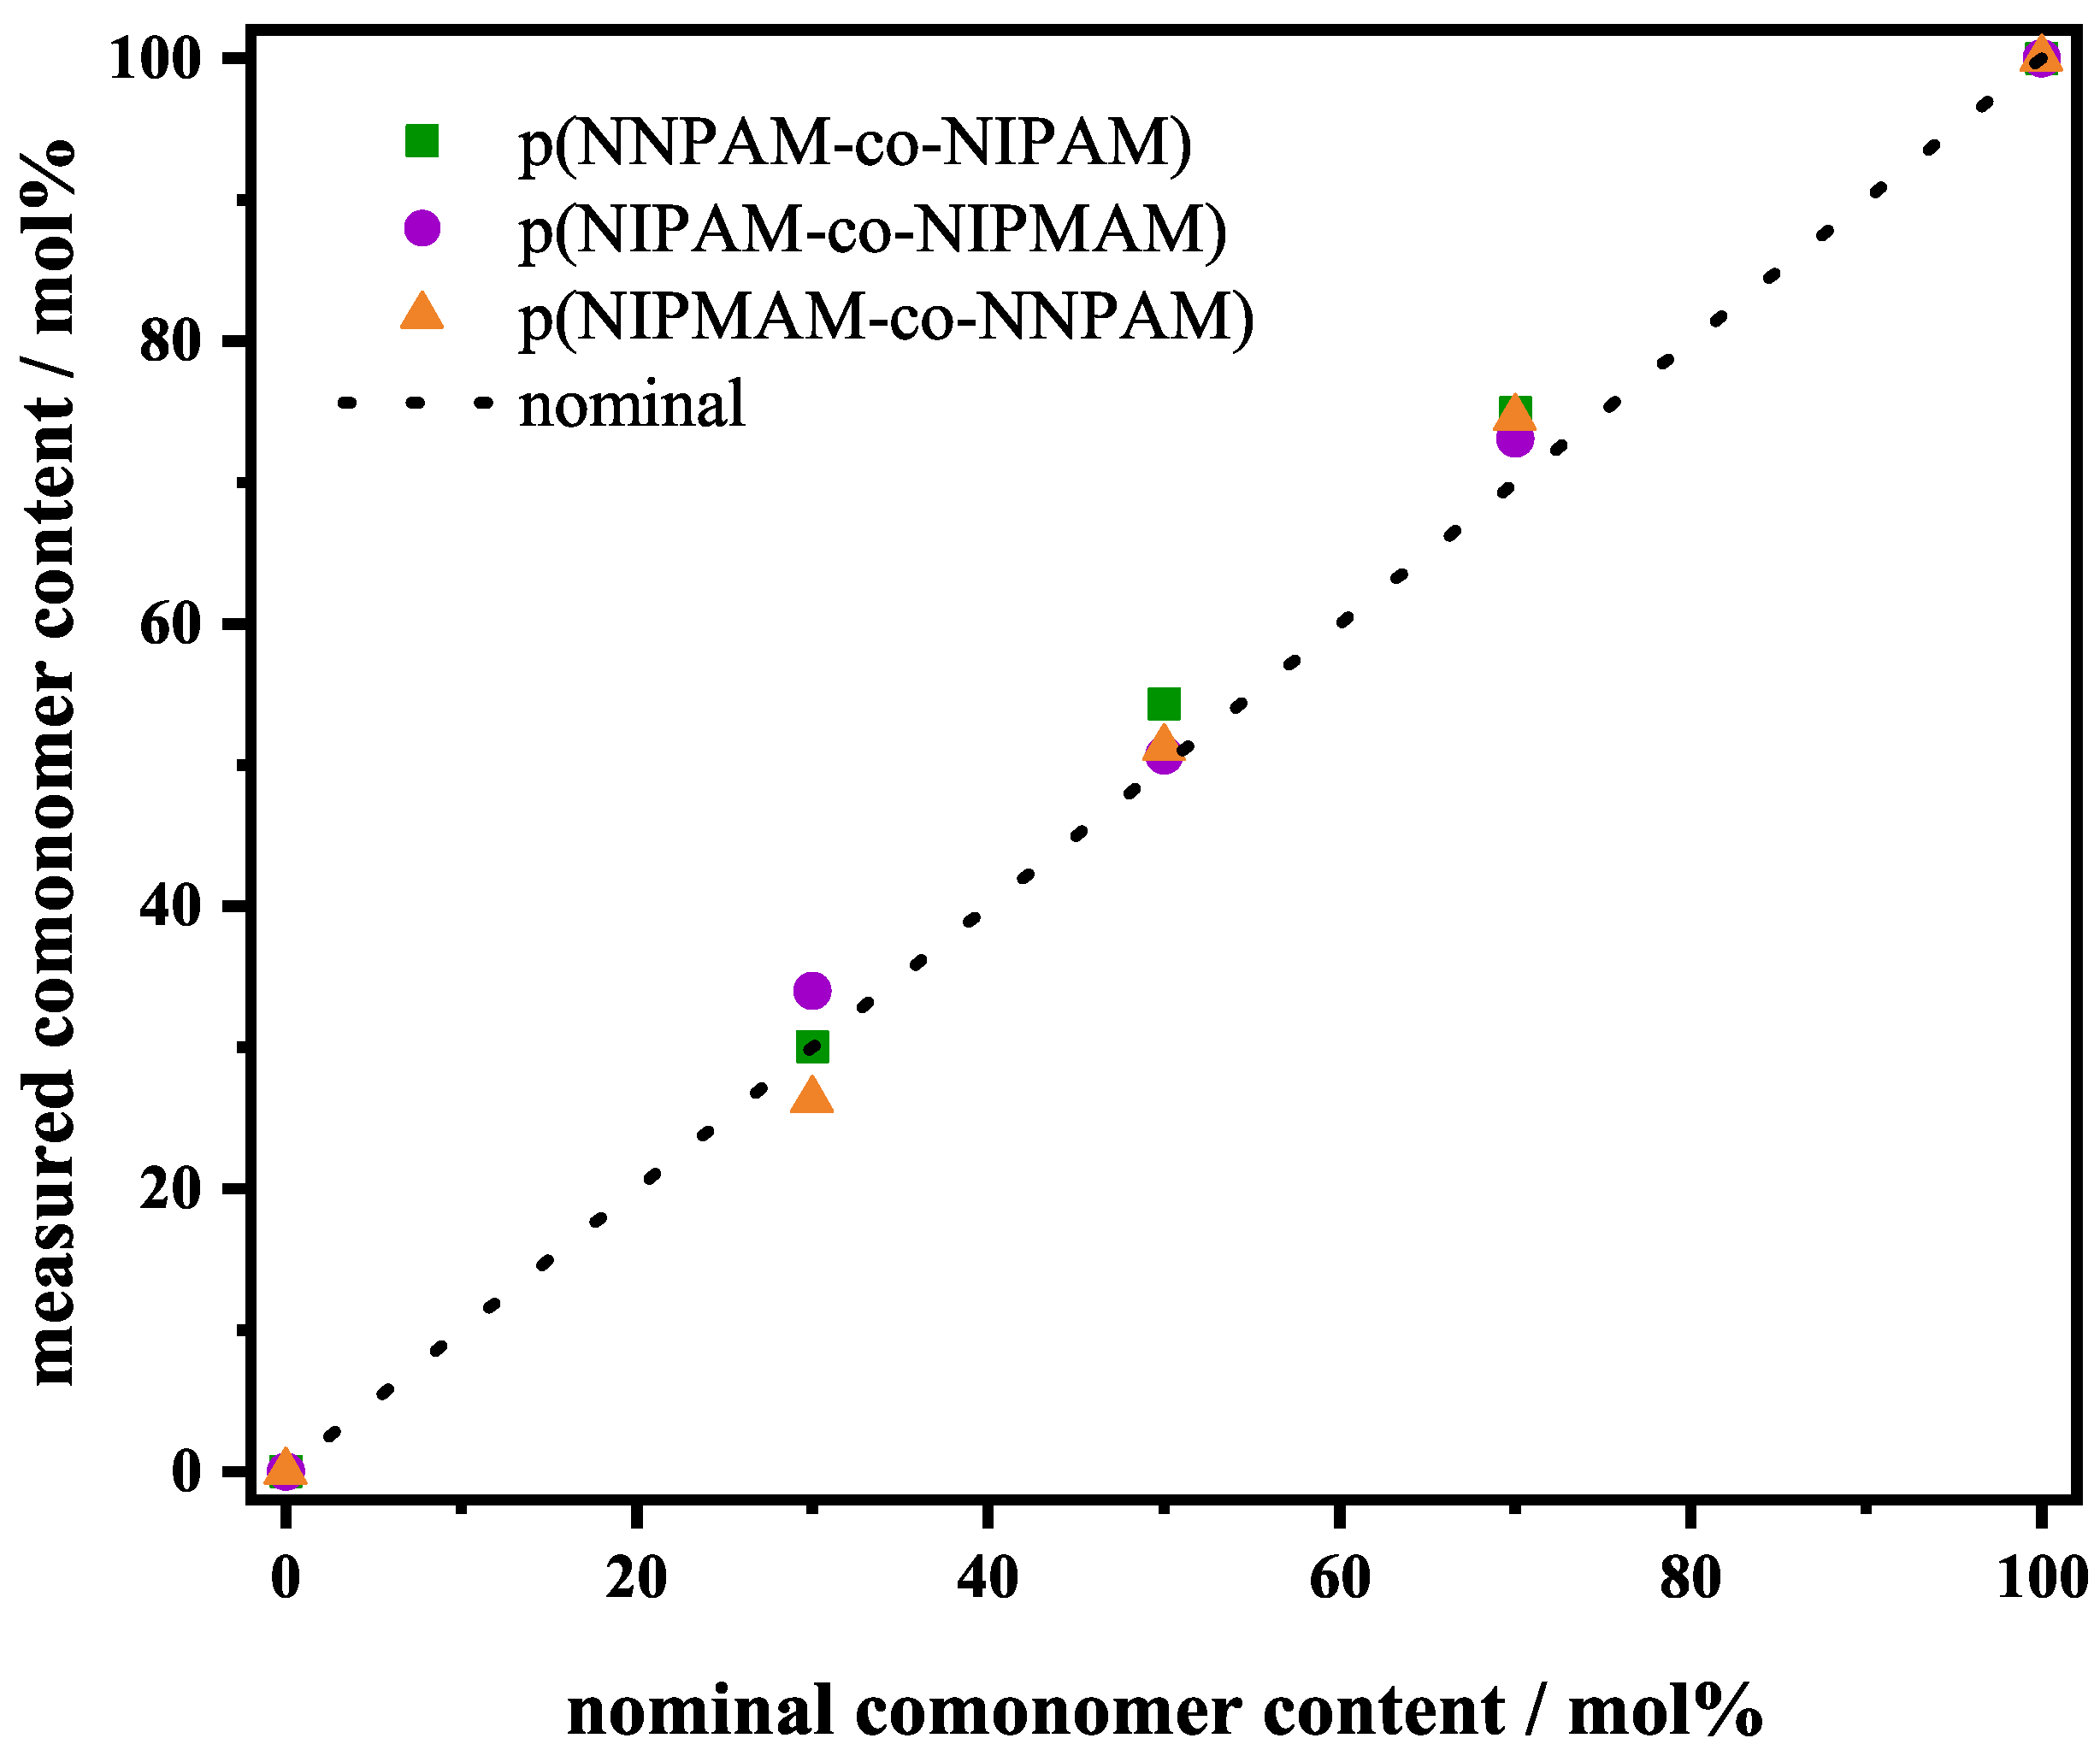
3.1. 1H-NMR
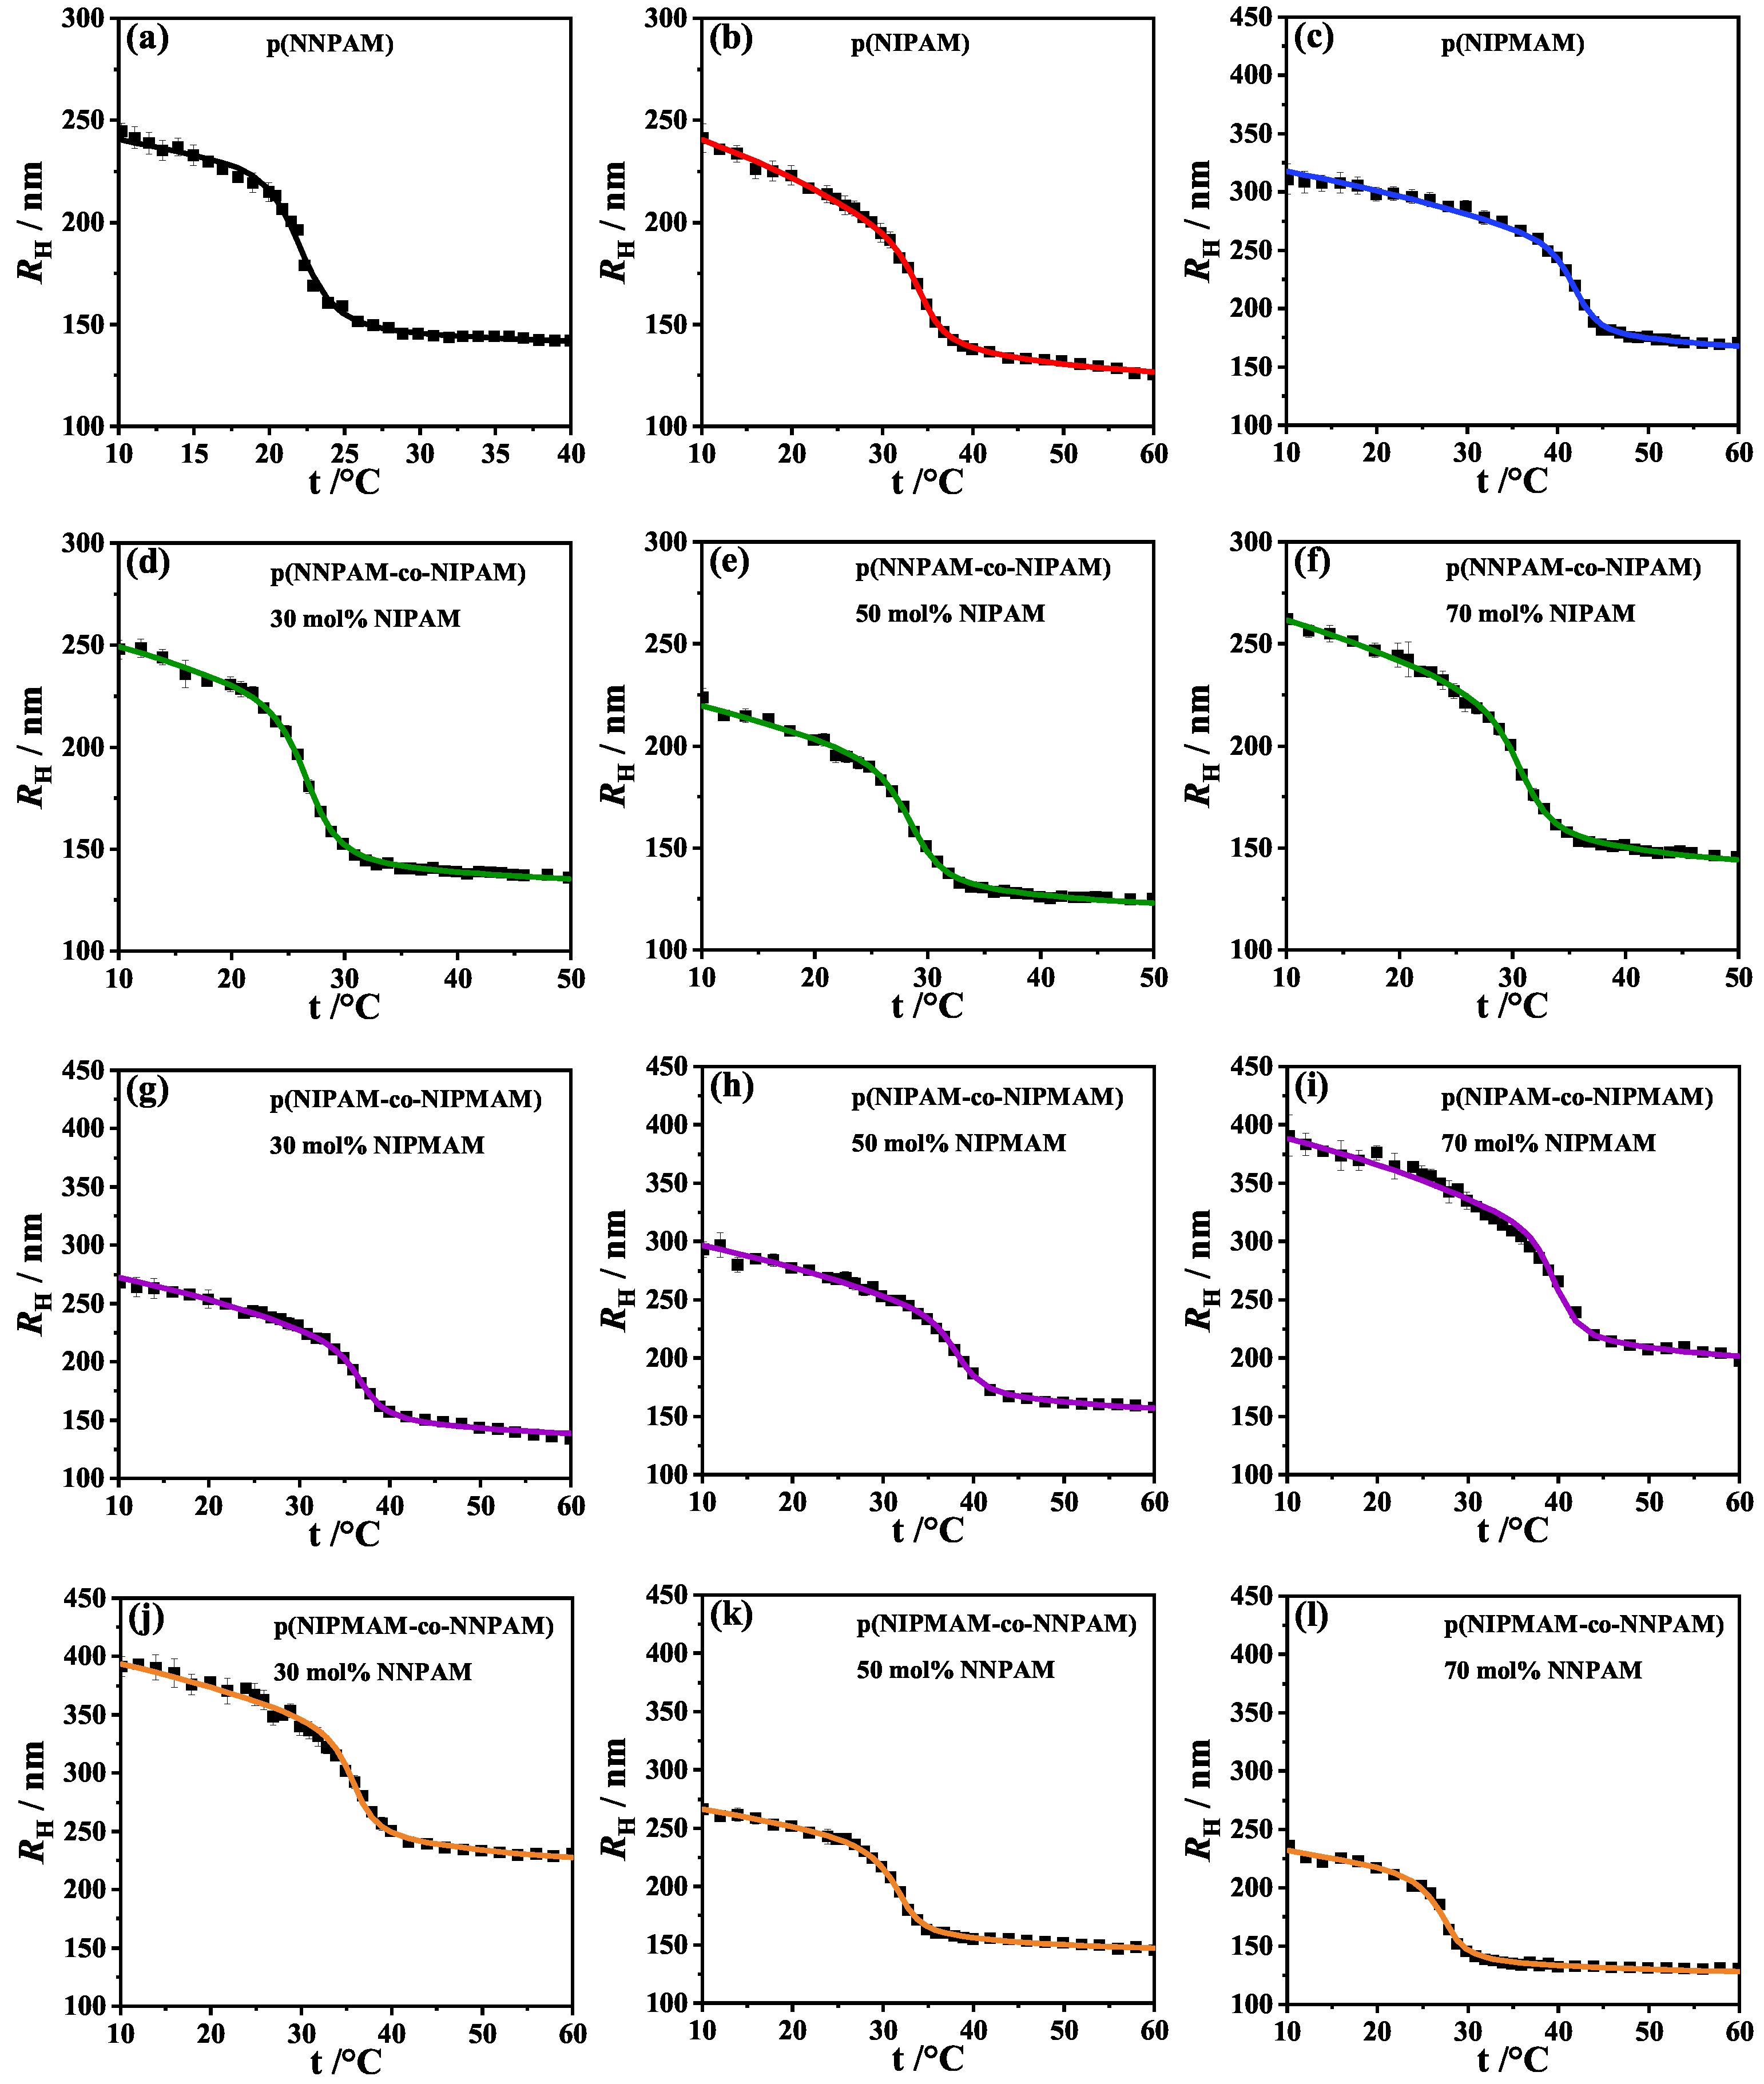
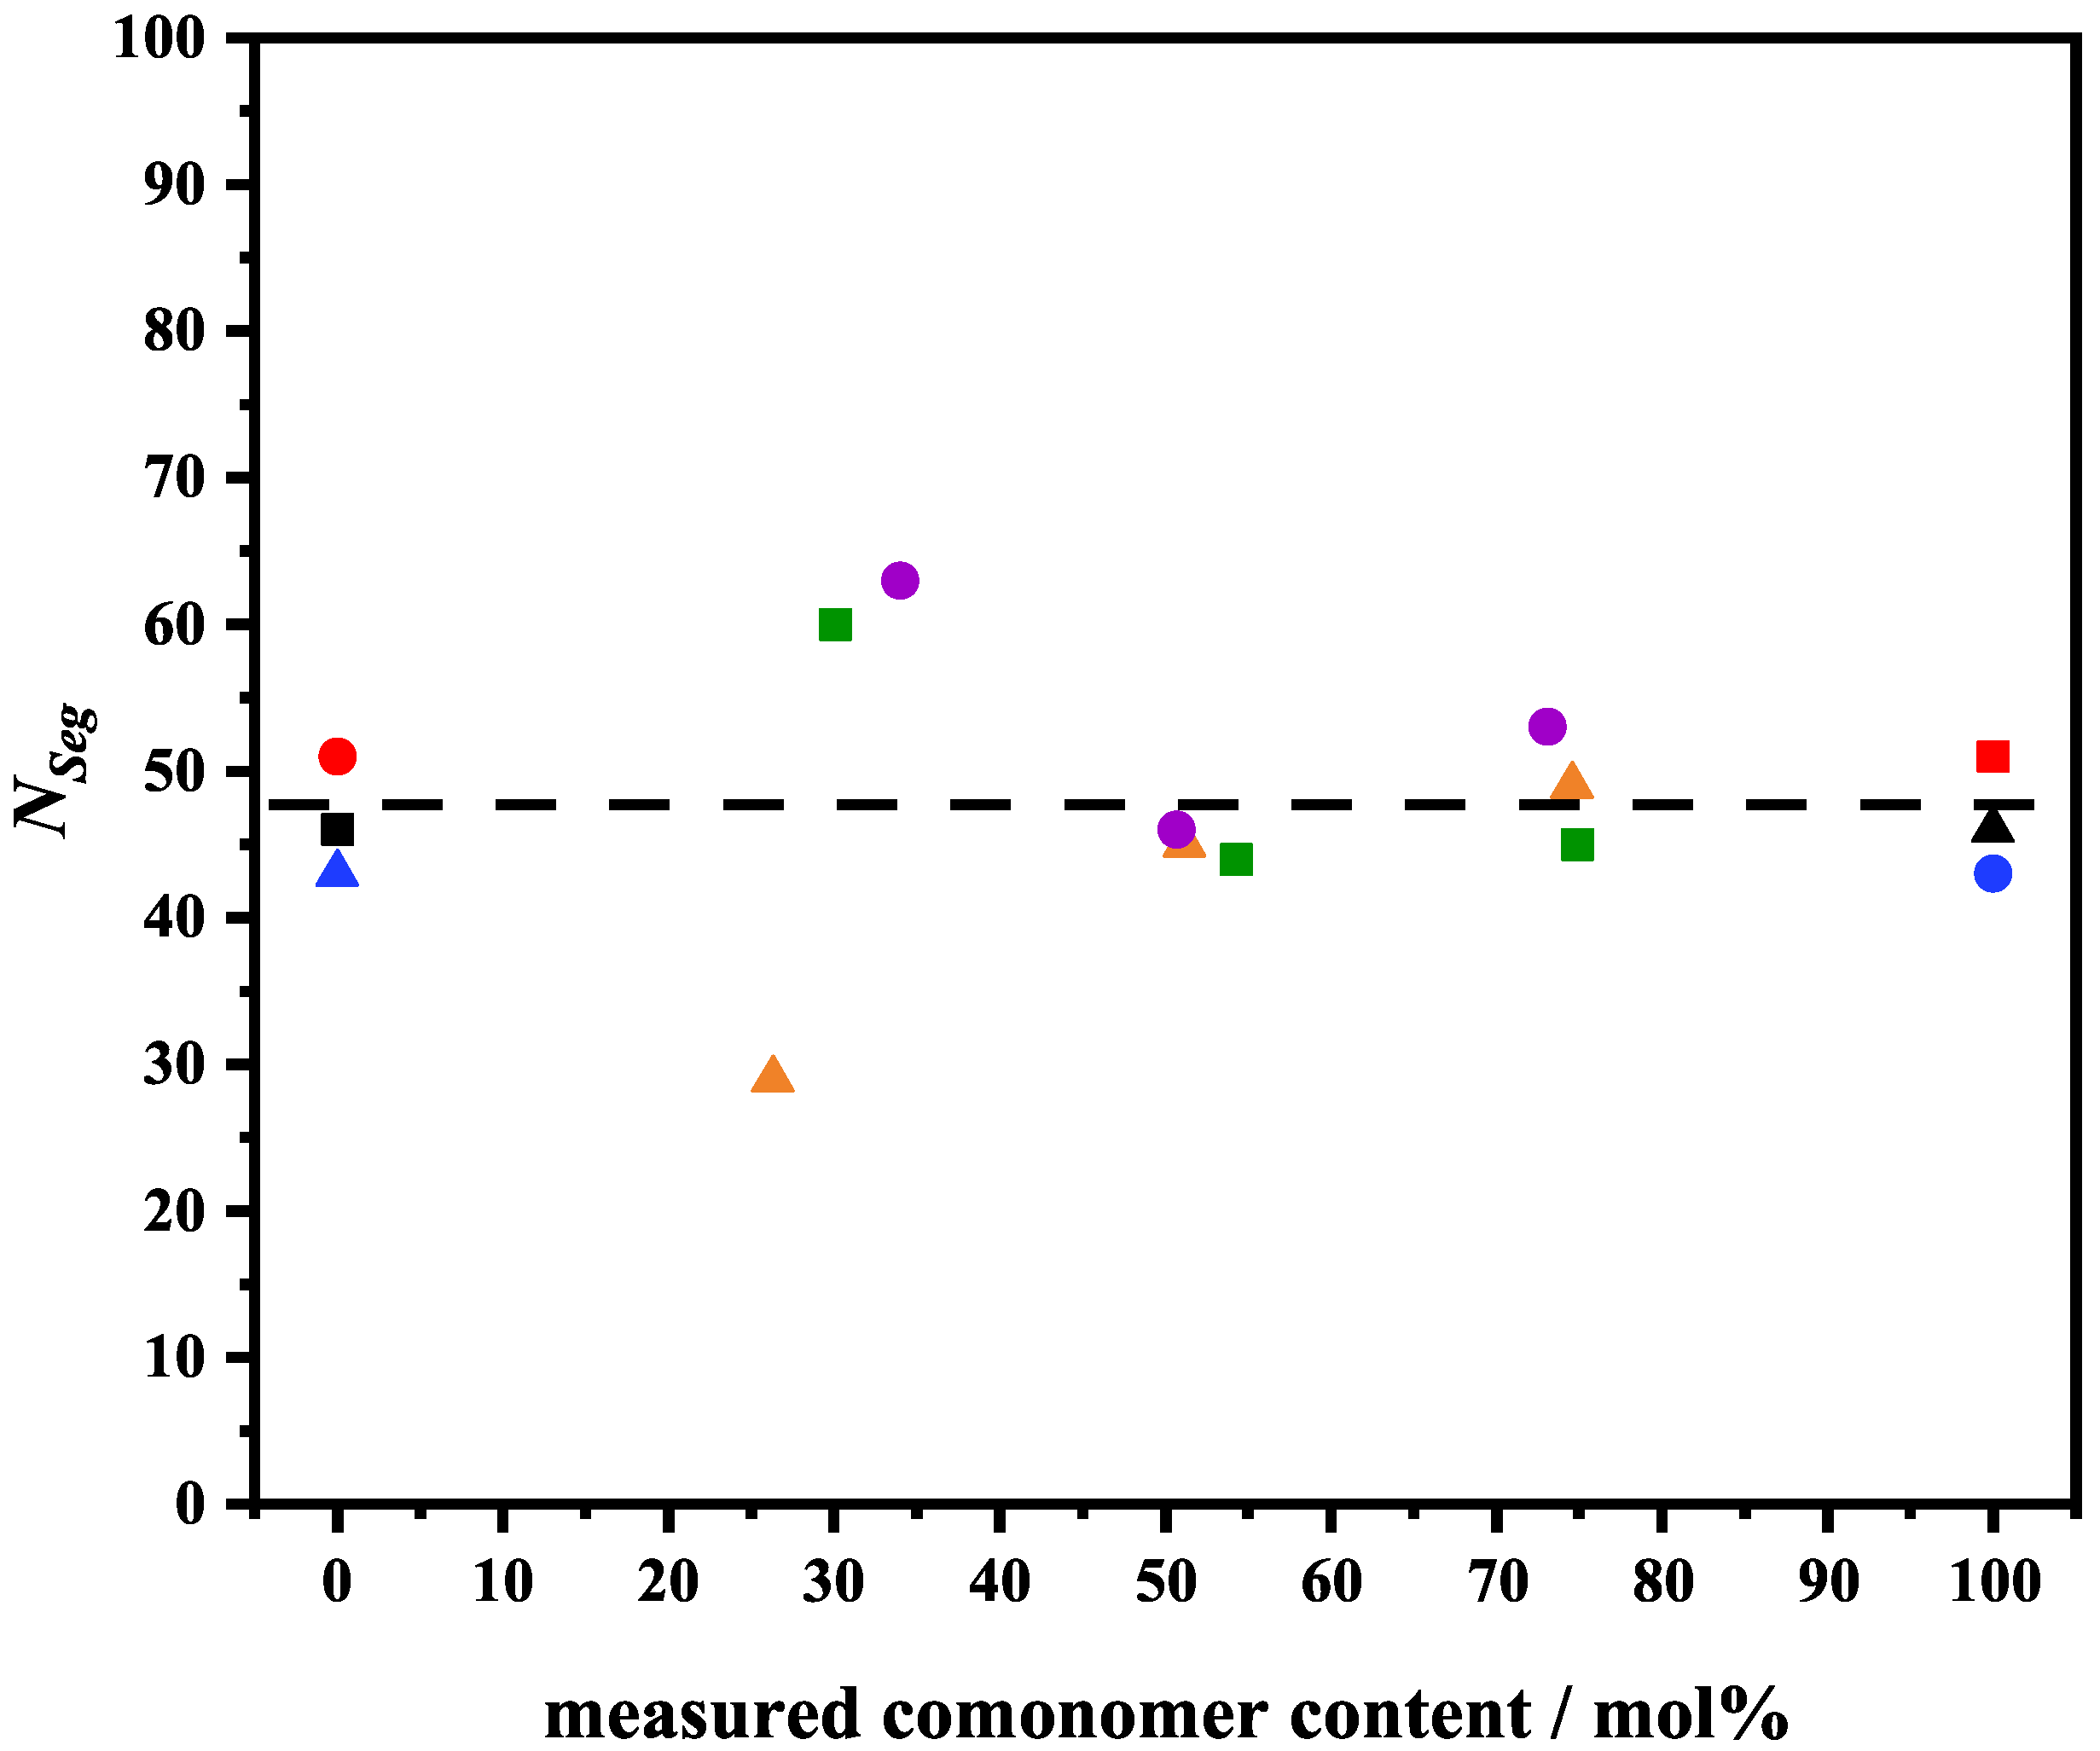
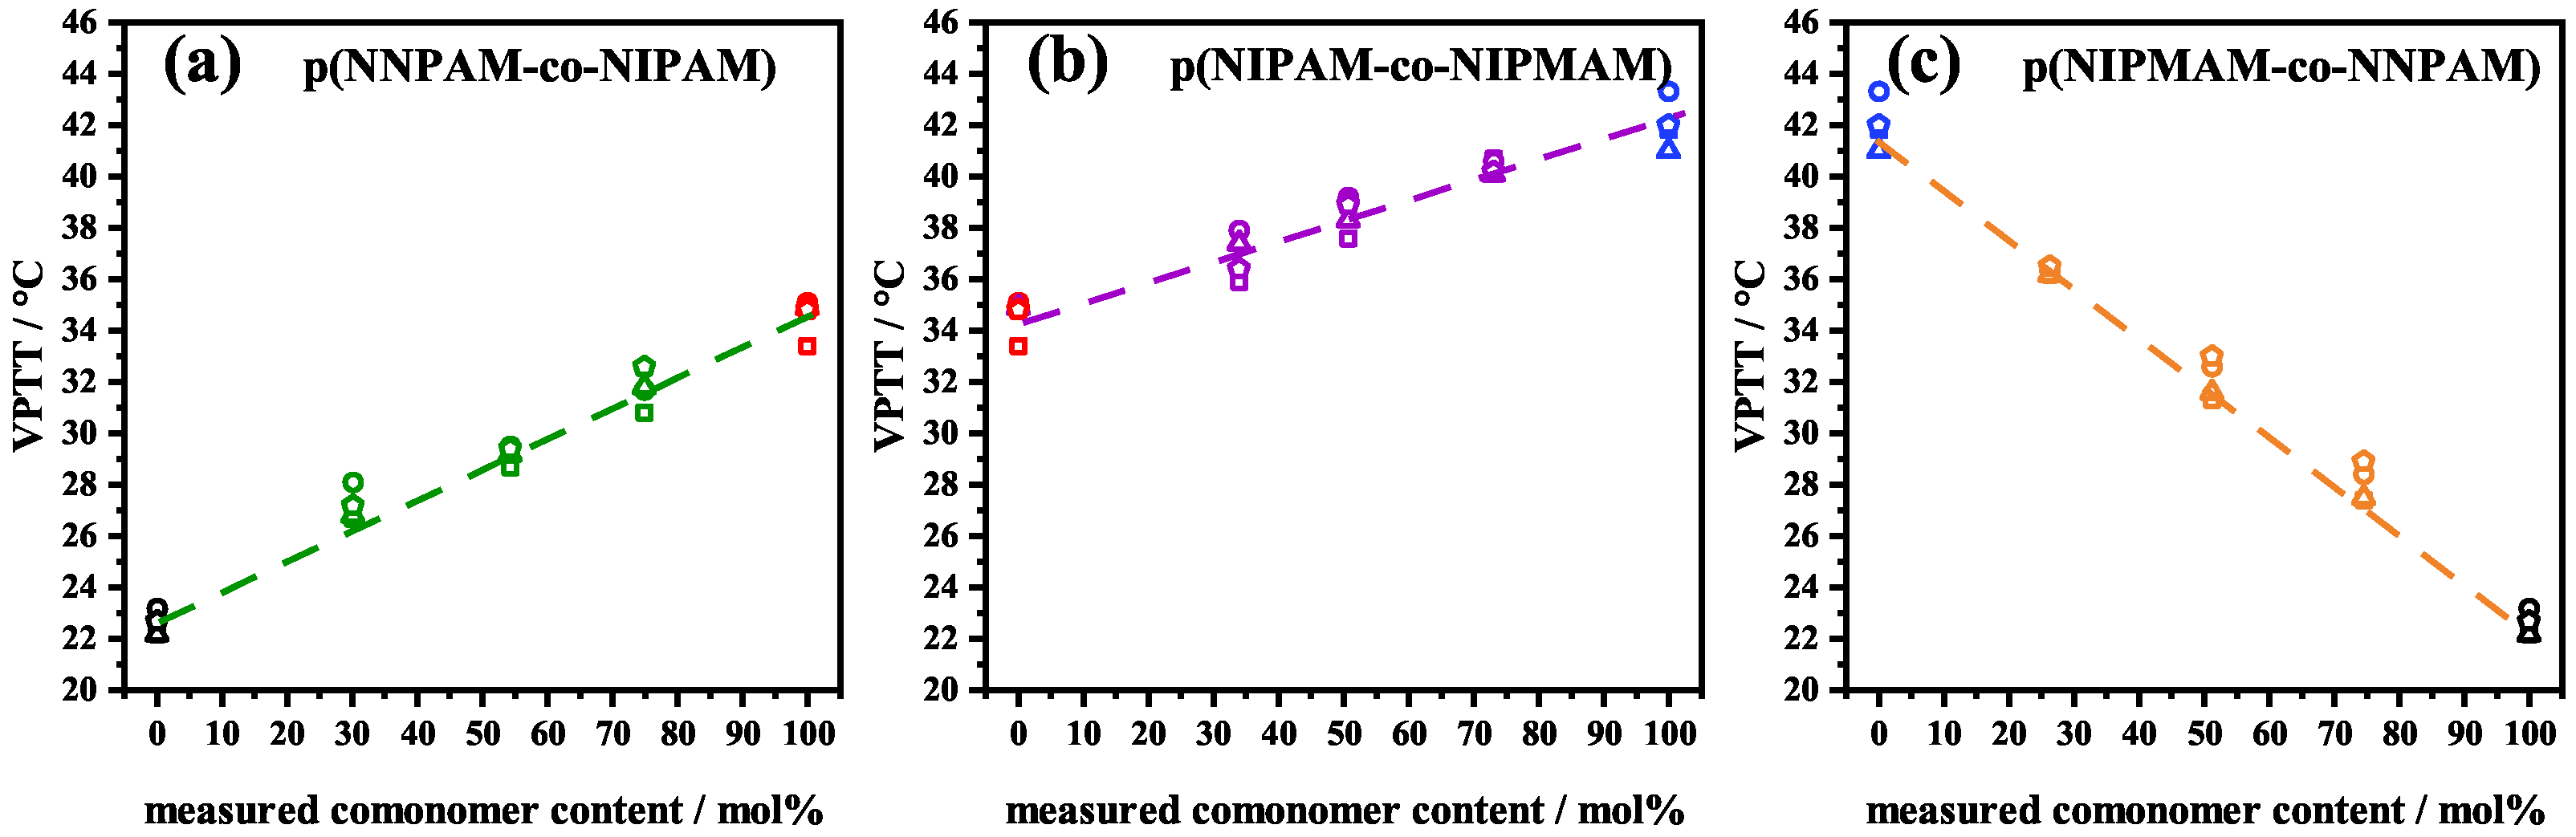
3.2. Analysis of the -Swelling Curves
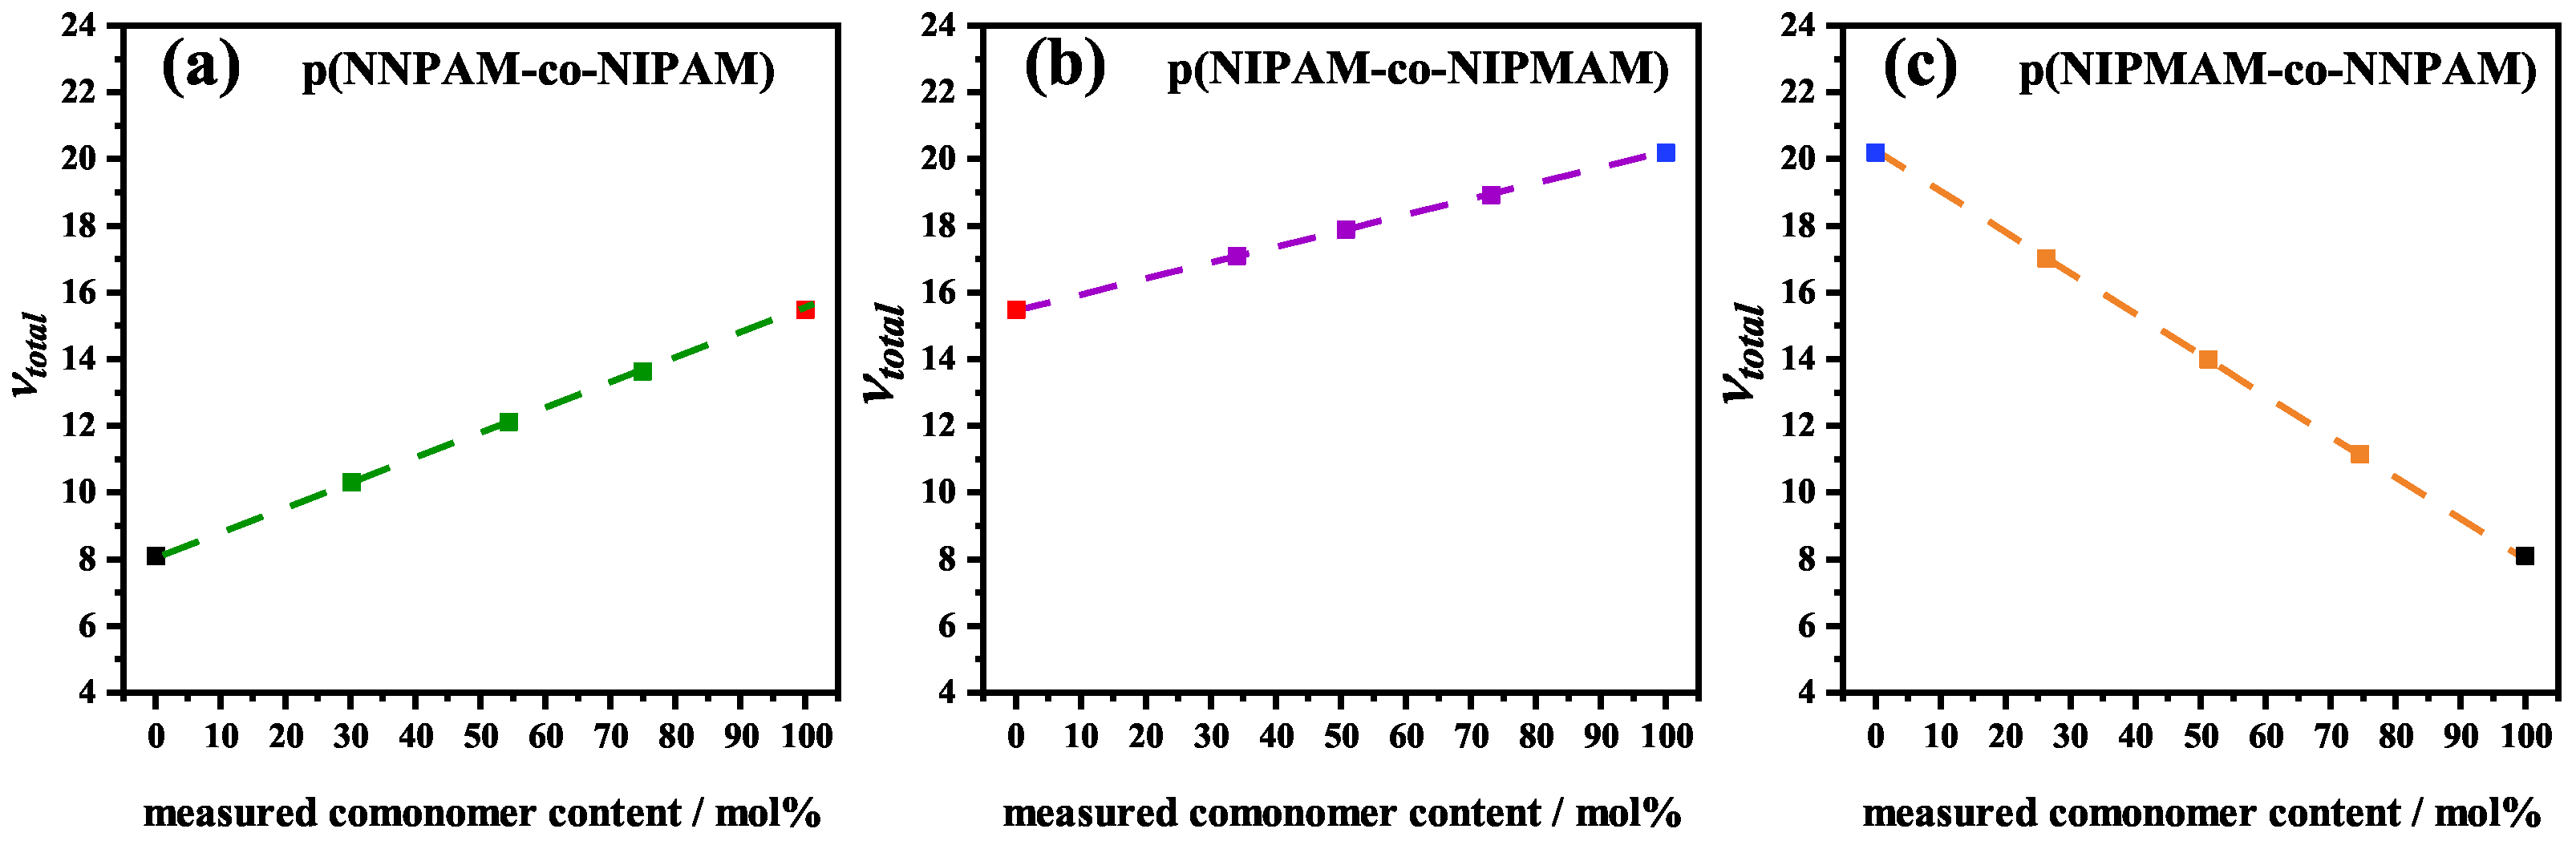
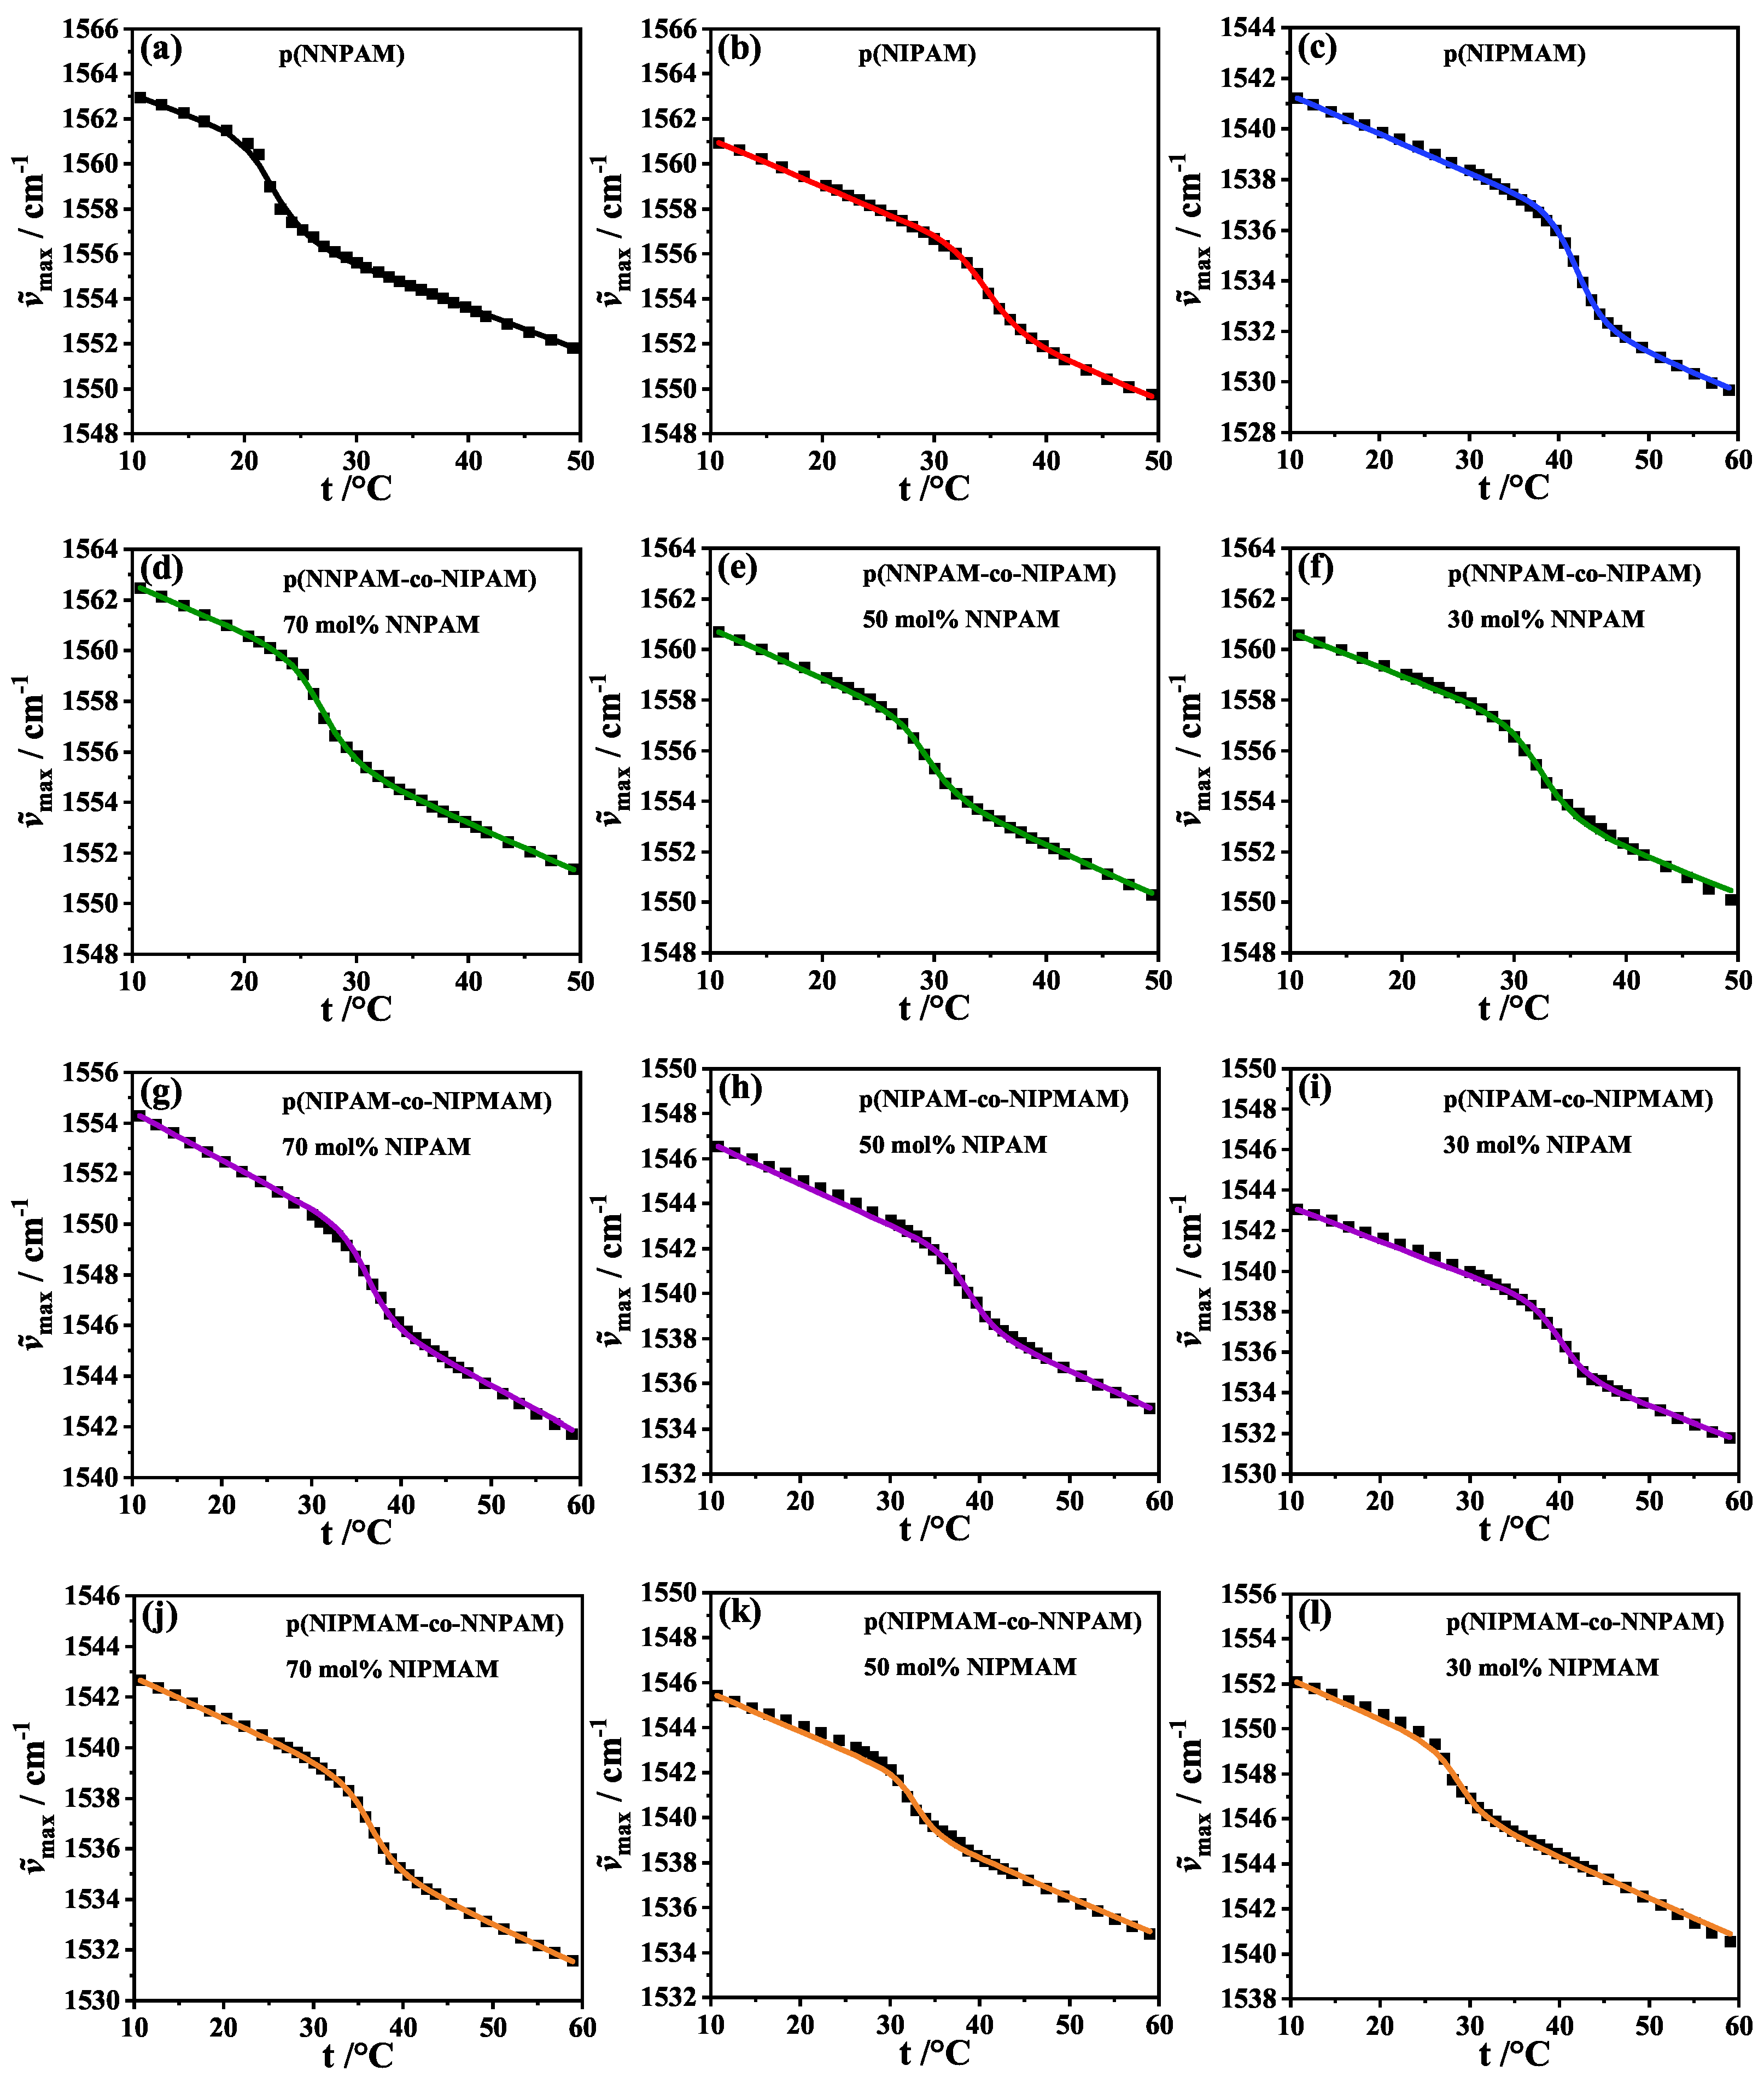
3.3. Analysis of the FTIR-Swelling Curves
4. Conclusions
5. Materials and Methods
5.1. Materials
5.2. Synthesis of Homo- and Copolymer Microgels
5.3. Photon Correlation Spectroscopy
5.4. Fourier Transformation Infrared Spectroscopy
5.5. Nuclear Magnetic Resonance Spectroscopy
Supplementary Materials
Author Contributions
Funding
Institutional Review Board Statement
Informed Consent Statement
Data Availability Statement
Acknowledgments
Conflicts of Interest
References
- Pelton, R.H.; Chibante, P. Preparation of aqueous latices with N-Isopropylacrylamide. Colloids Surf. 1986, 20, 247–256. [Google Scholar] [CrossRef]
- Pelton, R. Temperature-sensitive aqueous microgels. Adv. Colloid Interface Sci. 2000, 85, 1–33. [Google Scholar] [CrossRef]
- Dirksen, M.; Kinder, T.A.; Brändel, T.; Hellweg, T. Temperature controlled loading and release of the anti-inflammatory drug cannabidiol by smart microgels. Molecules 2021, 26, 3181. [Google Scholar] [CrossRef] [PubMed]
- Langer, R. New methods of drug delivery. Science 1990, 249, 1527–1533. [Google Scholar] [CrossRef] [PubMed]
- Smeets, N.M.B.; Hoare, T. Designing responsive microgels for drug delivery applications. J. Polym. Sci. Part A Polym. Chem. 2013, 51, 3027–3043. [Google Scholar] [CrossRef]
- Jain, K.K. Drug delivery systems—An overview. Drug Deliv. Syst. 2008, 437, 1–50. [Google Scholar] [CrossRef]
- Park, T.G.; Hoffman, A.S. Immobilization and characterization of beta-galactosidase in thermally reversible hydrogel beads. J. Biomed. Mater. Res. 1990, 24, 21–38. [Google Scholar] [CrossRef]
- Welsch, N.; Becker, A.L.; Dzubiella, J.; Ballauff, M. Core–shell microgels as “smart” carriers for enzymes. Soft Matter 2012, 8, 1428–1436. [Google Scholar] [CrossRef]
- Xu, W.; Rudov, A.A.; Schroeder, R.; Portnov, I.V.; Richtering, W.; Potemkin, I.I.; Pich, A. Distribution of ionizable groups in polyampholyte microgels controls interactions with captured proteins: From blockade and “levitation” to accelerated release. Biomacromolecules 2019, 20, 1578–1591. [Google Scholar] [CrossRef]
- Lu, Y.; Mei, Y.; Drechsler, M.; Ballauff, M. Thermosensitive core-shell particles as carriers for ag nanoparticles: Modulating the catalytic activity by a phase transition in networks. Angew. Chem. (Int. Ed. Engl.) 2006, 45, 813–816. [Google Scholar] [CrossRef]
- Sabadasch, V.; Wiehemeier, L.; Kottke, T.; Hellweg, T. Core-shell microgels as thermoresponsive carriers for catalytic palladium nanoparticles. Soft Matter 2020, 16, 5422–5430. [Google Scholar] [CrossRef] [PubMed]
- Lu, Y.; Spyra, P.; Mei, Y.; Ballauff, M.; Pich, A. Composite hydrogels: Robust carriers for catalytic nanoparticles. Macromol. Chem. Phys. 2007, 208, 254–261. [Google Scholar] [CrossRef]
- Arif, M.; Shahid, M.; Irfan, A.; Nisar, J.; Wu, W.; Farooqi, Z.H.; Begum, R. Polymer microgels for the stabilization of gold nanoparticles and their application in the catalytic reduction of nitroarenes in aqueous media. RSC Adv. 2022, 12, 5105–5117. [Google Scholar] [CrossRef] [PubMed]
- Uhlig, K.; Wegener, T.; He, J.; Zeiser, M.; Bookhold, J.; Dewald, I.; Godino, N.; Jaeger, M.; Hellweg, T.; Fery, A.; et al. Patterned thermoresponsive microgel coatings for noninvasive processing of adherent cells. Biomacromolecules 2016, 17, 1110–1116. [Google Scholar] [CrossRef] [PubMed]
- Saha, P.; Santi, M.; Emondts, M.; Roth, H.; Rahimi, K.; Großkurth, J.; Ganguly, R.; Wessling, M.; Singha, N.K.; Pich, A. Stimuli-Responsive Zwitterionic Core–Shell Microgels for Antifouling Surface Coatings. ACS Appl. Mater. Interfaces 2020, 12, 58223–58238. [Google Scholar] [CrossRef] [PubMed]
- Thorne, J.B.; Vine, G.J.; Snowden, M.J. Microgel applications and commercial considerations. Colloid Polym. Sci. 2011, 289, 625–646. [Google Scholar] [CrossRef]
- Saunders, B.R.; Vincent, B. Microgel particles as model colloids: Theory, properties and applications. Adv. Colloid Interface Sci. 1999, 80, 1–25. [Google Scholar] [CrossRef]
- Wedel, B.; Zeiser, M.; Hellweg, T. Non NIPAM based smart microgels: Systematic variation of the volume phase transition temperature by copolymerization. Z. Für Phys. Chem. 2012, 226, 737–748. [Google Scholar] [CrossRef]
- Karg, M.; Pich, A.; Hellweg, T.; Hoare, T.; Lyon, L.A.; Crassous, J.J.; Suzuki, D.; Gumerov, R.A.; Schneider, S.; Potemkin, I.I.; et al. Nanogels and microgels: From model colloids to applications, recent developments, and future trends. Langmuir 2019, 35, 6231–6255. [Google Scholar] [CrossRef]
- Nayak, S.; Lyon, L.A. Weiche Nanotechnologie mit weichen Nanopartikeln. Angew. Chem. 2005, 117, 7862–7886. [Google Scholar] [CrossRef]
- Plamper, F.A.; Richtering, W. Functional microgels and microgel systems. Acc. Chem. Res. 2017, 50, 131–140. [Google Scholar] [CrossRef] [PubMed]
- Richtering, W.; Saunders, B.R. Gel architectures and their complexity. Soft Matter 2014, 10, 3695–3702. [Google Scholar] [CrossRef] [PubMed] [Green Version]
- Pich, A.; Richtering, W. (Eds.) Chemical Design of Responsive Microgels; Advances in Polymer Science; Springer: Berlin/Heidelberg, Germany, 2010; Volume 234. [Google Scholar]
- Hannappel, Y.; Wiehemeier, L.; Dirksen, M.; Kottke, T.; Hellweg, T. Smart microgels from unconventional acrylamides. Macromol. Chem. Phys. 2021, 222, 2100067. [Google Scholar] [CrossRef]
- Wrede, O.; Reimann, Y.; Lülsdorf, S.; Emmrich, D.; Schneider, K.; Schmid, A.J.; Zauser, D.; Hannappel, Y.; Beyer, A.; Schweins, R.; et al. Volume phase transition kinetics of smart N-N-propylacrylamide microgels studied by time-resolved pressure jump small angle neutron scattering. Sci. Rep. 2018, 8, 13781. [Google Scholar] [CrossRef]
- Berndt, I.; Richtering, W. Doubly temperature sensitive core- shell microgels. Macromolecules 2003, 36, 8780–8785. [Google Scholar] [CrossRef]
- Inomata, H.; Wada, N.; Yagi, Y.; Goto, S.; Saito, S. Swelling behaviours of N-Alkylacrylamide Gels Water: Effects of copolymerization and crosslinking density. Polymer 1995, 36, 875–877. [Google Scholar] [CrossRef]
- Djokpé, E.; Vogt, W. N-Isopropylacrylamide N-Isopropylmethacryl Cloud Points Mixtures Copolym. Macromol. Chem. Phys. 2001, 202, 750–757. [Google Scholar] [CrossRef]
- Hertle, Y.; Hellweg, T. Thermoresponsive copolymer microgels. J. Mater. Chem. B 2013, 1, 5874. [Google Scholar] [CrossRef]
- Wedel, B. Thermoresponsive Mikrogele auf N-Alkylacrylamidbasis: Einfluss der chemischen Struktur der Monomere auf die Partikelbildung sowie die strukturellen und thermischen Eigenschaften von Homopolymer-und Copolymersystemen. Ph.D. Thesis, Universität Bielefeld, Bielefeld, Germany, 2015. [Google Scholar]
- Flory, P.J.; Rehner, J. Statistical Mechanics of Cross–Linked Polymer Networks I. Rubberlike Elasticity. J. Chem. Phys. 1943, 11, 512–520. [Google Scholar] [CrossRef]
- Erman, B.; Flory, P.J. Critical phenomena and transitions in swollen polymer networks and in linear macromolecules. Macromolecules 1986, 19, 2342–2353. [Google Scholar] [CrossRef]
- Nigro, V.; Angelini, R.; Bertoldo, M.; Bruni, F.; Ricci, M.A.; Ruzicka, B. Dynamical behavior of microgels of interpenetrated polymer networks. Soft Matter 2017, 13, 5185–5193. [Google Scholar] [CrossRef] [PubMed]
- Tiktopulo, E.; Bychkova, V.; Ricka, J.; Ptitsyn, O. Cooperativity of the coil-globule transition in a homopolymer: Microcalorimetric study of poly (N-Isopropylacrylamide). Macromolecules 1994, 27, 2879–2882. [Google Scholar] [CrossRef]
- Friesen, S.; Hannappel, Y.; Kakorin, S.; Hellweg, T. Accounting for cooperativity in the thermotropic volume phase transition of smart microgels. Gels 2021, 7, 42. [Google Scholar] [CrossRef] [PubMed]
- Friesen, S.; Hannappel, Y.; Kakorin, S.; Hellweg, T. Comparison of different approaches to describe the thermotropic volume phase transition of smart microgels. Colloid Polym. Sci. 2022, 35, 6231. [Google Scholar] [CrossRef]
- Tavagnacco, L.; Zaccarelli, E.; Chiessi, E. On the molecular origin of the cooperative coil-to-globule transition of poly(N-Isopropylacrylamide) Water. Phys. Chem. Chem. Phys. PCCP 2018, 20, 9997–10010. [Google Scholar] [CrossRef] [Green Version]
- Leite, D.C.; Kakorin, S.; Hertle, Y.; Hellweg, T.; da Silveira, N.P. Smart starch–poly(N-Isopropylacrylamide) Hybrid Microgels: Synthesis, Structure, and Swelling Behavior. Langmuir 2018, 34, 10943–10954. [Google Scholar] [CrossRef]
- Hertle, Y.; Zeiser, M.; Hasenöhrl, C.; Busch, P.; Hellweg, T. Responsive P(NIPAM-co-NtBAM) microgels: Flory–Rehner description of the swelling behaviour. Colloid Polym. Sci. 2010, 288, 1047–1059. [Google Scholar] [CrossRef]
- Godbole, R.V.; Khabaz, F.; Khare, R.; Hedden, R.C. Swelling of random copolymer networks in pure and mixed solvents: Multi-component Flory-Rehner theory. J. Phys. Chem. B 2017, 121, 7963–7977. [Google Scholar] [CrossRef]
- Flory, P.J. Principles of Polymer Chemistry, 19th ed.; Cornell Univ. Press: Ithaca, NY, USA, 1953. [Google Scholar]
- Weiss, J.N. The Hill equation revisited: Uses and misuses. FASEB J. 1997, 11, 835–841. [Google Scholar] [CrossRef]
- Tavagnacco, L.; Chiessi, E.; Zanatta, M.; Orecchini, A.; Zaccarelli, E. Water–polymer coupling induces a dynamical transition in microgels. J. Phys. Chem. Lett. 2019, 10, 870–876. [Google Scholar] [CrossRef] [Green Version]
- Tavagnacco, L.; Zaccarelli, E.; Chiessi, E. Modeling solution behavior of poly(N-isopropylacrylamide): A comparison between water models. J. Phys. Chem. B 2022. [Google Scholar] [CrossRef] [PubMed]
- Press, W.H.; Teukolsky, S.A.; Vetterling, W.T.; Flannery, B.P. Numerical Recipes: The Art of Scientific Computing, 3rd ed.; Cambridge University Press: Cambridge, MA, USA, 2007. [Google Scholar]
- Voudouris, P.; Florea, D.; van der Schoot, P.; Wyss, H.M. Micromechanics of temperature sensitive microgels: Dip in the Poisson ratio near the LCST. Soft Matter 2013, 9, 7158. [Google Scholar] [CrossRef] [Green Version]
- Lopez, C.G.; Richtering, W. Does Flory-Rehner theory quantitatively describe the swelling of thermoresponsive microgels? Soft Matter 2017, 13, 8271–8280. [Google Scholar] [CrossRef] [PubMed]
- Sierra-Martín, B.; Choi, Y.; Romero-Cano, M.S.; Cosgrove, T.; Vincent, B.; Fernández-Barbero, A. Microscopic signature of a microgel volume phase transition. Macromolecules 2005, 38, 10782–10787. [Google Scholar] [CrossRef]
- Crassous, J.J.; Wittemann, A.; Siebenbürger, M.; Schrinner, M.; Drechsler, M.; Ballauff, M. Direct imaging of temperature-sensitive core-shell latexes by cryogenic transmission electron microscopy. Colloid Polym. Sci. 2008, 286, 805–812. [Google Scholar] [CrossRef]
- Karg, M.; Prévost, S.; Brandt, A.; Wallacher, D.; Klitzing, R.V.; Hellweg, T. Poly-NIPAM Microgels with Different Cross-Linker Densities; Springer International Publishing: Cham, Swizterland, 2013; pp. 63–76. [Google Scholar] [CrossRef]
- Wiehemeier, L.; Cors, M.; Wrede, O.; Oberdisse, J.; Hellweg, T.; Kottke, T. Swelling behaviour of core-shell microgels in H2O, analysed by temperature-dependent FTIR spectroscopy. Phys. Chem. Chem. Phys. PCCP 2019, 21, 572–580. [Google Scholar] [CrossRef]
- Iwai, K.; Matsumura, Y.; Uchiyama, S.; de Silva, A.P. Development of fluorescent microgel thermometers based on thermo-responsive polymers and their modulation of sensitivity range. J. Mater. Chem. 2005, 15, 2796–2800. [Google Scholar] [CrossRef]
- Uchiyama, S.; Matsumura, Y.; de Silva, A.P.; Iwai, K. Modulation of the sensitive temperature range of fluorescent molecular thermometers based on thermoresponsive polymers. Anal. Chem. 2004, 76, 1793–1798. [Google Scholar] [CrossRef]
- Hirano, T.; Nakamura, K.; Kamikubo, T.; Ishii, S.; Tani, K.; Mori, T.; Sato, T. Hydrogen-bond-assisted syndiotactic-specific radical polymerizations of N-Alkylacrylamides: The Effect of the N-Substituents on the Stereospecificities and Unusual Large Hysteresis in the Phase-Transition Behavior of Aqueous Solution of Syndiotactic Poly(N-N-propylacrylamide). J. Polym. Sci. Part A Polym. Chem. 2008, 46, 4575–4583. [Google Scholar] [CrossRef]


| System | Nominal Comonomer Content /mol% | Measured Comonomer Content /mol% | /°C | /°C | /nm | ||
|---|---|---|---|---|---|---|---|
| poly(NNPAM) | – | – | 0.77 | 46 | 23.2 | 22.2 | 0.9 |
| poly(NIPAM) | – | – | 0.84 | 51 | 35.1 | 33.4 | 0.3 |
| poly(NIPMAM) | – | – | 0.71 | 43 | 43.3 | 41.8 | 1.0 |
| poly(NNPAM-co-NIPAM) | 30.0 | 30.1 | 0.78 | 60 | 28.1 | 26.7 | 0.3 |
| 50.0 | 54.3 | 0.74 | 44 | 29.5 | 28.7 | 0.5 | |
| 70.0 | 74.9 | 0.74 | 45 | 31.7 | 30.8 | 0.4 | |
| poly(NIPAM-co-NIPMAM) | 30.0 | 34.0 | 0.89 | 63 | 37.9 | 35.9 | 1.0 |
| 50.0 | 50.7 | 0.78 | 46 | 39.2 | 37.6 | 0.8 | |
| 70.0 | 73.1 | 0.82 | 53 | 40.6 | 40.7 | 2.7 | |
| poly(NIPMAM-co-NNPAM) | 30.0 | 26.3 | 0.75 | 29 | 36.3 | 36.2 | 1.9 |
| 50.0 | 51.2 | 0.83 | 45 | 32.6 | 31.3 | 0.4 | |
| 70.0 | 74.6 | 0.77 | 49 | 28.4 | 27.4 | 1.1 |
| System | a | b | ||
|---|---|---|---|---|
| /K −1 | ||||
| poly(NNPAM) | 0.239 | 0.012 | 0.576 | 8.10 |
| poly(NIPAM) | 0.020 | 0.020 | 0.290 | 15.5 |
| poly(NIPMAM) | 0.016 | 0.387 | 20.2 |
| System | Measured Comonomer Content/mol% | / | / | / | /°C | /°C | / |
|---|---|---|---|---|---|---|---|
| poly(NNPAM) | – | −3.907 | – | – | 22.7 | 22.2 | 3.8 |
| poly(NIPAM) | – | – | −3.140 | – | 34.8 | 34.9 | 1.2 |
| poly(NIPMAM) | – | – | – | −3.999 | 42.0 | 41.0 | 1.8 |
| poly(NNPAM-co-NIPAM) 1 | 30.1 | −3.891 | −3.146 | – | 27.2 | 26.8 | 1.2 |
| 54.3 | −2.165 | −3.143 | – | 29.4 | 29.2 | 0.6 | |
| 74.9 | −3.958 | −3.181 | – | 32.6 | 31.8 | 3.4 | |
| poly(NIPAM-co-NIPMAM) | 34.0 | – | −3.213 | −2.983 | 36.4 | 37.4 | 4.0 |
| 50.7 | – | −2.489 | −3.152 | 38.9 | 38.3 | 4.5 | |
| 73.1 | – | −2.797 | −3.030 | 40.2 | 40.1 | 4.2 | |
| poly(NIPMAM-co-NNPAM) | 26.3 | −4.947 | – | −2.657 | 36.5 | 36.2 | 0.3 |
| 51.2 | −0.878 | – | −3.685 | 33.0 | 31.6 | 8.3 | |
| 74.6 | −2.053 | – | −4.169 | 28.9 | 27.5 | 7.1 |
| System | Nominal Comonomer Content /mol% | [NNPAM] /mmol | [NIPAM] /mmol | [NIPMAM] /mmol |
|---|---|---|---|---|
| poly(NNPAM) | – | 3.850 | – | – |
| poly(NIPAM) | – | – | 3.850 | – |
| poly(NIPMAM) | – | – | – | 3.850 |
| poly(NNPAM-co-NIPAM) | 30 | 2.695 | 1.155 | – |
| 50 | 1.925 | 1.925 | – | |
| 70 | 1.155 | 2.695 | – | |
| poly(NIPAM-co-NIPMAM) | 30 | – | 2.695 | 1.155 |
| 50 | – | 1.925 | 1.925 | |
| 70 | – | 1.155 | 2.695 | |
| poly(NIPMAM-co-NNPAM) | 30 | 1.155 | – | 2.695 |
| 50 | 1.925 | – | 1.925 | |
| 70 | 2.695 | – | 1.155 |
Publisher’s Note: MDPI stays neutral with regard to jurisdictional claims in published maps and institutional affiliations. |
© 2022 by the authors. Licensee MDPI, Basel, Switzerland. This article is an open access article distributed under the terms and conditions of the Creative Commons Attribution (CC BY) license (https://creativecommons.org/licenses/by/4.0/).
Share and Cite
Friesen, S.; Kakorin, S.; Hellweg, T. Modified Flory–Rehner Theory Describes Thermotropic Swelling Transition of Smart Copolymer Microgels. Polymers 2022, 14, 1999. https://doi.org/10.3390/polym14101999
Friesen S, Kakorin S, Hellweg T. Modified Flory–Rehner Theory Describes Thermotropic Swelling Transition of Smart Copolymer Microgels. Polymers. 2022; 14(10):1999. https://doi.org/10.3390/polym14101999
Chicago/Turabian StyleFriesen, Simon, Sergej Kakorin, and Thomas Hellweg. 2022. "Modified Flory–Rehner Theory Describes Thermotropic Swelling Transition of Smart Copolymer Microgels" Polymers 14, no. 10: 1999. https://doi.org/10.3390/polym14101999
APA StyleFriesen, S., Kakorin, S., & Hellweg, T. (2022). Modified Flory–Rehner Theory Describes Thermotropic Swelling Transition of Smart Copolymer Microgels. Polymers, 14(10), 1999. https://doi.org/10.3390/polym14101999