
Styrene–Acrylic Emulsion with “Transition Layer” for Damping Coating: Synthesis and Characterization

Abstract
1. Introduction
2. Materials and Methods
2.1. Materials
2.2. Latex Preparation
2.2.1. Synthesis of Seed Latex
2.2.2. Synthesis of Core–Shell Latex
2.3. Characterization
3. Results and Discussion
3.1. The Basic Properties of the Emulsion
3.2. Damping Properties of the Latex Film
3.3. Activation Ennergy of Latex in Glass Trasition
3.4. Tensile Strength of Latex Film
4. Conclusions
Author Contributions
Funding
Data Availability Statement
Acknowledgments
Conflicts of Interest
References
- Patsias, S.; Saxton, C.; Shipton, M. Hard damping coatings: An experimental procedure for extraction of damping characteristics and modulus of elasticity. Mater. Sci. Eng. A 2004, 370, 412–416. [Google Scholar] [CrossRef]
- Torvik, P.J. The Need for Damping. In Coatings for Enhanced Passive Damping, 3rd ed.; Wiley: Hoboken, NJ, USA, 2009; Volume 29, pp. 3–7. [Google Scholar]
- Torvik, P.J. Analysis of Free-Layer Damping Coatings. Key Eng. Mater. 2007, 333, 195–214. [Google Scholar] [CrossRef]
- Chandra, R.; Singh, S.P.; Gupta, K. Damping studies in fiber-reinforced composites. Compos. Struct. 1999, 46, 41–51. [Google Scholar] [CrossRef]
- Choudhary, N.; Kaur, D. Vibration Damping Materials and Their Applications in Nano/Micro-Electro-Mechanical Systems. J. Nanosci. Nanotechnol. 2015, 15, 1907–1924. [Google Scholar] [CrossRef]
- Lv, X.; Huang, Z.; Huang, C.; Shi, M.; Gao, G.; Gao, Q. Damping properties and the morphology analysis of the polyurethane/epoxy continuous gradient IPN materials. Compos. Part B Eng. 2016, 88, 139–149. [Google Scholar] [CrossRef]
- Su, Y.; Lin, H.; Zhang, S.; Yang, Z.; Yuan, T. One-Step Synthesis of Novel Renewable Vegetable Oil-Based Acrylate Prepolymers and Their Application in UV-Curable Coatings. Polymers 2020, 12, 1165. [Google Scholar] [CrossRef]
- Deng, Y.J.; Zhou, C.; Zhang, M.Y.; Zhang, H.X. Effects of the reagent ratio on the properties of waterborne polyurethanes-acrylate for application in damping coating. Prog. Org. Coat. 2018, 122, 239–247. [Google Scholar] [CrossRef]
- Suresh, K.I.; Vishwanatham, S.; Bartsch, E. Viscoelastic and damping characteristics of poly(n-butyl acrylate)-poly(n-butyl methacrylate) semi-IPN latex films. Polym. Adv. Technol. 2010, 18, 364–372. [Google Scholar] [CrossRef]
- Wang, H.; Yang, F.; Zhu, A.; Lu, T.; Kong, F.; Ji, L. Preparation and reticulation of styrene acrylic/epoxy complex latex. Polym. Bull. 2014, 71, 1523–1537. [Google Scholar] [CrossRef]
- Xing, R.W.; Chen, F.S.; Qin, M.H. Study on the New Cationic Styrene-Acrylic Easter Copolymer Micro-emulsion. In Chung-kuo Tsao Chih/China Pulp and Paper; China Technical Association of Paper Industry: Beijing, China, 2009; Volume 28, pp. 30–34. [Google Scholar]
- Zhong, Z.; Yu, Q.; Yao, H.; Wu, W.; Feng, W.; Yu, L.; Xu, Z. Study of the styrene–acrylic emulsion modified by hydroxyl-phosphate ester and its stoving varnish. Prog. Org. Coat. 2013, 76, 858–862. [Google Scholar] [CrossRef]
- Zhang, H.; Yang, H.; Lu, J.; Lang, J.; Gao, H. Study on Stability and Stability Mechanism of Styrene-Acrylic Emulsion Prepared Using Nanocellulose Modified with Long-Chain Fatty Acids. Polymers 2019, 11, 1131. [Google Scholar] [CrossRef]
- Fage, J.; Knoll, K.; Niessner, N.; Carstensen, O.; Schulz, T.; Malz, F.; Döring, M.; Schönberger, F. Poly (Butyl Acrylate)-Graft-Polystyrene Synthesis by Free-Radical Polymerization: Interplay between Structure, Morphology, Mechanical, and Optical Properties. Polymers 2019, 11, 1317. [Google Scholar] [CrossRef]
- Xiao, J.; Qiu, Z.; Yang, W.; Qiu, J.; Yang, T.; Xu, Y.; Zeng, Y.; Wang, F.; Li, S. Organosilicone modification of allyl methacrylate with speier’s catalyst for waterborne self-matting styrene-acrylic emulsion. Prog. Org. Coat. 2018, 116, 1–6. [Google Scholar] [CrossRef]
- Kim, M.; Hwang, Y.; Ghim, H.D. Electronically Stabilized Copoly(Styrene-Acrylic Acid) Submicrocapsules Prepared by Miniemulsion Copolymerization. Polymers 2017, 9, 291. [Google Scholar]
- Zhang, F.; Wang, Y.; Chai, C. Preparation of styrene-acrylic emulsion by using nano-SiO2 as seeds. Polym. Int. 2010, 53, 1353–1359. [Google Scholar] [CrossRef]
- Matsumoto, T.; Okubo, M.; Shibao, S. Formation Mechanism of Heterogeneous Structure in Particles Produced by Seed-Emulsion Polymerization. Kobunshi Ronbunshu 1976, 10, 575–583. [Google Scholar] [CrossRef]
- Sun, G.; Jia, S.; Zhu, X.; Hao, B.; Yu, Y. The dynamic mechanical behavior of water-solubilized damping coating with interpenetrating polymer networks of core-shell type of thermoset polyacrylic. J. Chin. Soc. Corros. Prot. 2004, 24, 43–44. [Google Scholar]
- Xu, C.; Qiu, T.; Deng, J.; Meng, Y.; He, L.; Li, X. Dynamic mechanical study on multilayer core–shell latex for damping applications. Prog. Org. Coat. 2012, 74, 233–239. [Google Scholar] [CrossRef]
- Zahedi, F.; Amraei, I.A.; Fathizade, M.A. Investigation of dynamic-mechanical properties of multilayer latex IPNs (MLIPNs) with core/shell morphology: Synthesis and characterization. Polymer 2016, 83, 162–171. [Google Scholar] [CrossRef]
- Bai, L.; Huan, S.; Zhang, X.; Jia, Z.; Gu, J.; Li, Z. Rational design and synthesis of transition layer-mediated structured latex particles with poly(vinyl acetate) cores and poly(styrene) shells. Colloid Polym. Sci. 2017, 295, 353–362. [Google Scholar] [CrossRef]
- Bai, L.; Huan, S.; Zhang, X.; Gu, J.; Li, Z. Fabrication and evaluation of one-component core/shell structured latex adhesives containing poly(styrene) cores and poly(acrylate) shells. Int. J. Adhes. Adhes. 2016, 70, 152–159. [Google Scholar] [CrossRef]
- Zhang, X.; Bai, L.; Lou, C.; Chen, X.; Jia, Z.; Gu, J.; Li, Z. Fabrication and morphological evolution of inverse core/shell structural latex particles of poly(vinyl acetate)/polystyrene by maleic anhydride grafting. Colloid Polym. Sci. 2016, 294, 1117–1128. [Google Scholar] [CrossRef]
- Sun, J.; Zhang, X.; Bai, L.; Li, Z.; Jia, Z.; Gu, J. Effect of Shell Growth on the Morphology of Polyvinyl Acetate/Polystyrene Inverted Core-Shell Latex Fabricated by Acrylonitrile Grafting. Materials 2018, 11, 2482. [Google Scholar] [CrossRef] [PubMed]
- Liu, M.; Song, G.; Yi, J.; Xu, Y. Damping analysis of polyurethane/polyacrylate interpenetrating polymer network composites filled with graphite particles. Polym. Compos. 2013, 34, 288–292. [Google Scholar] [CrossRef]
- Li, S.; Deng, Y.; Fu, Z.; Zhang, H.; Zhou, C.; Jiao, Y. Hydroxyl-terminated polybutadiene based waterborne polyurethane acrylate emulsions: Synthesis, characterization, and damping property. J. Appl. Polym. Sci. 2021, 138, 50333. [Google Scholar] [CrossRef]
- Zhang, Q.; Deng, Y.; Fu, Z.; Zhang, H. Effects of the molecular structure on the vibration reduction andproperties of hyperbranched waterborne polyurethane–acrylate for damping coatings. J. Appl. Polym. Sci. 2019, 136, 47733. [Google Scholar]
- Shieh, Y.A.; Chuang, H.H. DSC and DMA studies on silane-grafted and water-crosslinked LDPE/LLDPE blends. J. Appl. Polym. Sci. 2010, 81, 1808–1816. [Google Scholar] [CrossRef]
- Wang, Y.; Huang, Z.; Du, M.; Zhang, L. Experimental investigation on the damping behaviors of epoxies with different epoxy value. Polym. Plast. Technol. Eng. 2007, 46, 973–977. [Google Scholar]
- Menard, K.P.; Menard, N. Frequency Scans. In Dynamic Mechanical Analysis, 3rd ed.; Deanta Global Publishing Services: Chennai, India; CRC Press: Boca Raton, FL, USA, 2015; p. 7. [Google Scholar]


| Sample | Material | tan δmax | Effective Temperature Region (tan δ > 0.3) (°C) | Tg | Tensile Strength/MPa | Elongation at Break/% |
|---|---|---|---|---|---|---|
| Literature1 [20] | styrene–acrylic emulsion | 0.88 | −12.0 to 97.1 | ≈6 | - | - |
| Literature2 [21] | styrene–acrylic emulsion | 0.83 | −23.7 to 124 | - | - | - |
| Literature3 [26] | polyurethane/polyacrylate with graphite particles | 0.528 | −1 to 108 | 55 | 0.540 | 182 |
| Literature4 [27] | polyurethane–acrylate emulsions: | ≈0.7 | −26.6 to 79.14 | ≈−8 | ≈1.6 | ≈215 |
| Literature5 [8] | polyurethanes–acrylate | 1.23 | −11 to 64 | 10.5 | - | - |
| Literature6 [28] | polyurethane–acrylate | 0.66 | −15 to 68 | ≈4 | - | - |
| Sample | CS1 | CS2 | CS3 | CS4 | CST1 | CST2 | CST3 | CST4 | |
|---|---|---|---|---|---|---|---|---|---|
| Seed | Water (g) | 60 | 60 | 60 | 60 | 60 | 60 | 60 | 60 |
| SDS (g) | 2.00 | 2.00 | 2.00 | 2.00 | 2.00 | 2.00 | 2.00 | 2.00 | |
| OP-10 (g) | 1.00 | 1.00 | 1.00 | 1.00 | 1.00 | 1.00 | 1.00 | 1.00 | |
| NaHCO3 (g) | 0.30 | 0.30 | 0.30 | 0.30 | 0.30 | 0.30 | 0.30 | 0.30 | |
| BA (g) | 0 | 0 | 0.75 | 2.25 | 0 | 0 | 0.75 | 2.25 | |
| MMA (g) | 3.25 | 3.25 | 3.25 | 3.25 | 3.25 | 3.25 | 3.25 | 3.25 | |
| MBA (g) | 0.75 | 2.25 | 2.25 | 0.75 | 0.75 | 2.25 | 2.25 | 0.75 | |
| St (g) | 2.25 | 0.75 | 0 | 0 | 2.25 | 0.75 | 0 | 0 | |
| KPS (solutions/g) b | 20 | 20 | 20 | 20 | 20 | 20 | 20 | 20 | |
| Core | BA (g) | 0 | 0 | 2.25 | 6.75 | 0 | 0 | 2.25 | 6.75 |
| MMA (g) | 9.75 | 9.75 | 9.75 | 9.75 | 9.75 | 9.75 | 9.75 | 9.75 | |
| MBA (g) | 2.25 | 6.75 | 6.75 | 2.25 | 2.25 | 6.75 | 6.75 | 2.25 | |
| St (g) | 6.75 | 2.25 | 0 | 0 | 6.75 | 2.25 | 0 | 0 | |
| KPS (solutions/g) b | 10 | 10 | 10 | 10 | 10 | 10 | 10 | 10 | |
| C/S a | MBA (g) | 22 | 16 | 16 | 22 | 12 | 12 | 12 | 12 |
| 10 | 4 | 4 | 10 | ||||||
| BA (g) | 38 | 38 | 35 | 29 | 38 | 38 | 35 | 29 | |
| St (g) | 15 | 21 | 24 | 24 | 15 | 21 | 24 | 24 | |
| KPS (solutions/g) b | 35 | 35 | 35 | 35 | 35 | 35 | 35 | 35 | |
| Samples | Solid Content/% | Conversion/% | Viscosity/mPa·s | Particle Size a/nm |
|---|---|---|---|---|
| CS1 | 44.73 | 98.51 | 203 | ~100 |
| CS2 | 44.28 | 97.54 | 201 | |
| CS3 | 44.52 | 98.06 | 201 | |
| CS4 | 44.11 | 97.16 | 199 | |
| CST1 | 44.61 | 98.33 | 205 | |
| CST2 | 44.46 | 97.94 | 203 | |
| CST3 | 44.44 | 97.88 | 198 | |
| CST4 | 44.70 | 98.46 | 202 |
| Sample with “Transition Layer” | Mass Ratio | Tg (Fox)/°C | Tg (tan δmax)/°C | Tan δmax | Effective Temperature Region (tan δ > 0.3) (°C) |
| Core:Shell | Core/Shell | ||||
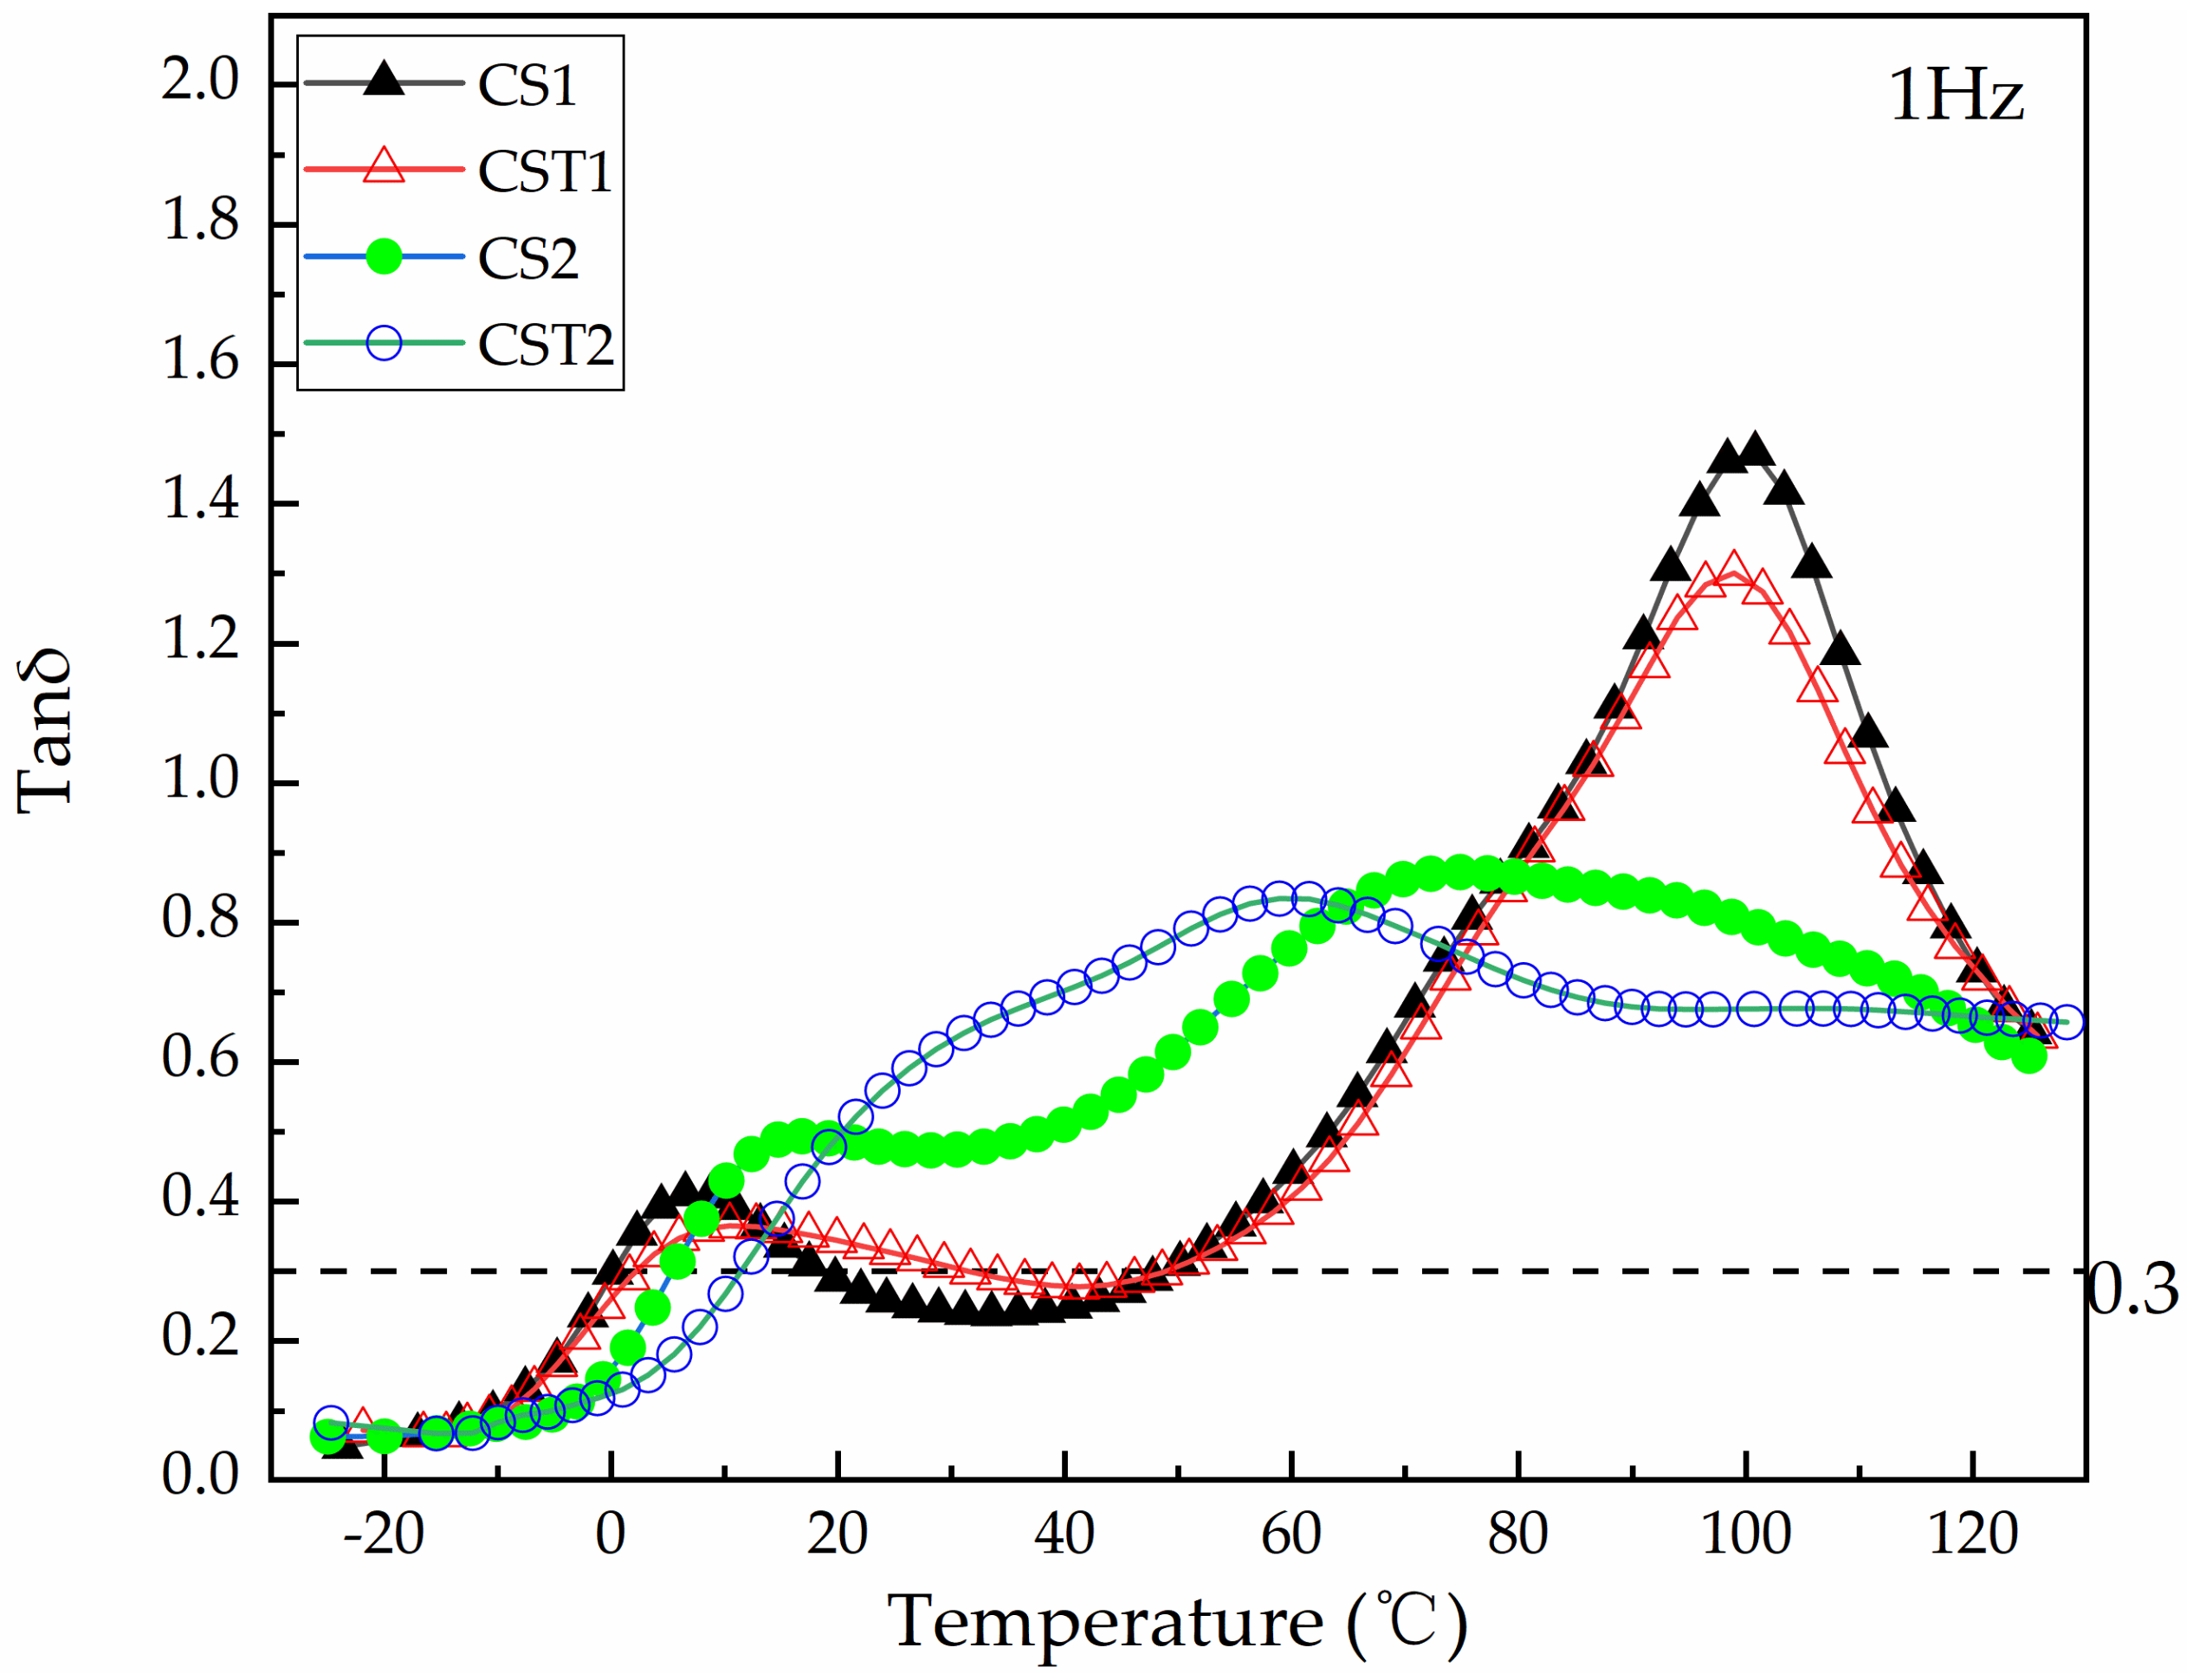
| CS1 | 1:3 | 96.07/−13.31 | 100.84/6.55 | 1.47 | 0.31–18.63/49.37–~ |
| CS2 | 1:3 | 69.18/−9.30 | 74.83/16.84 | 0.87 | 5.28–~ |
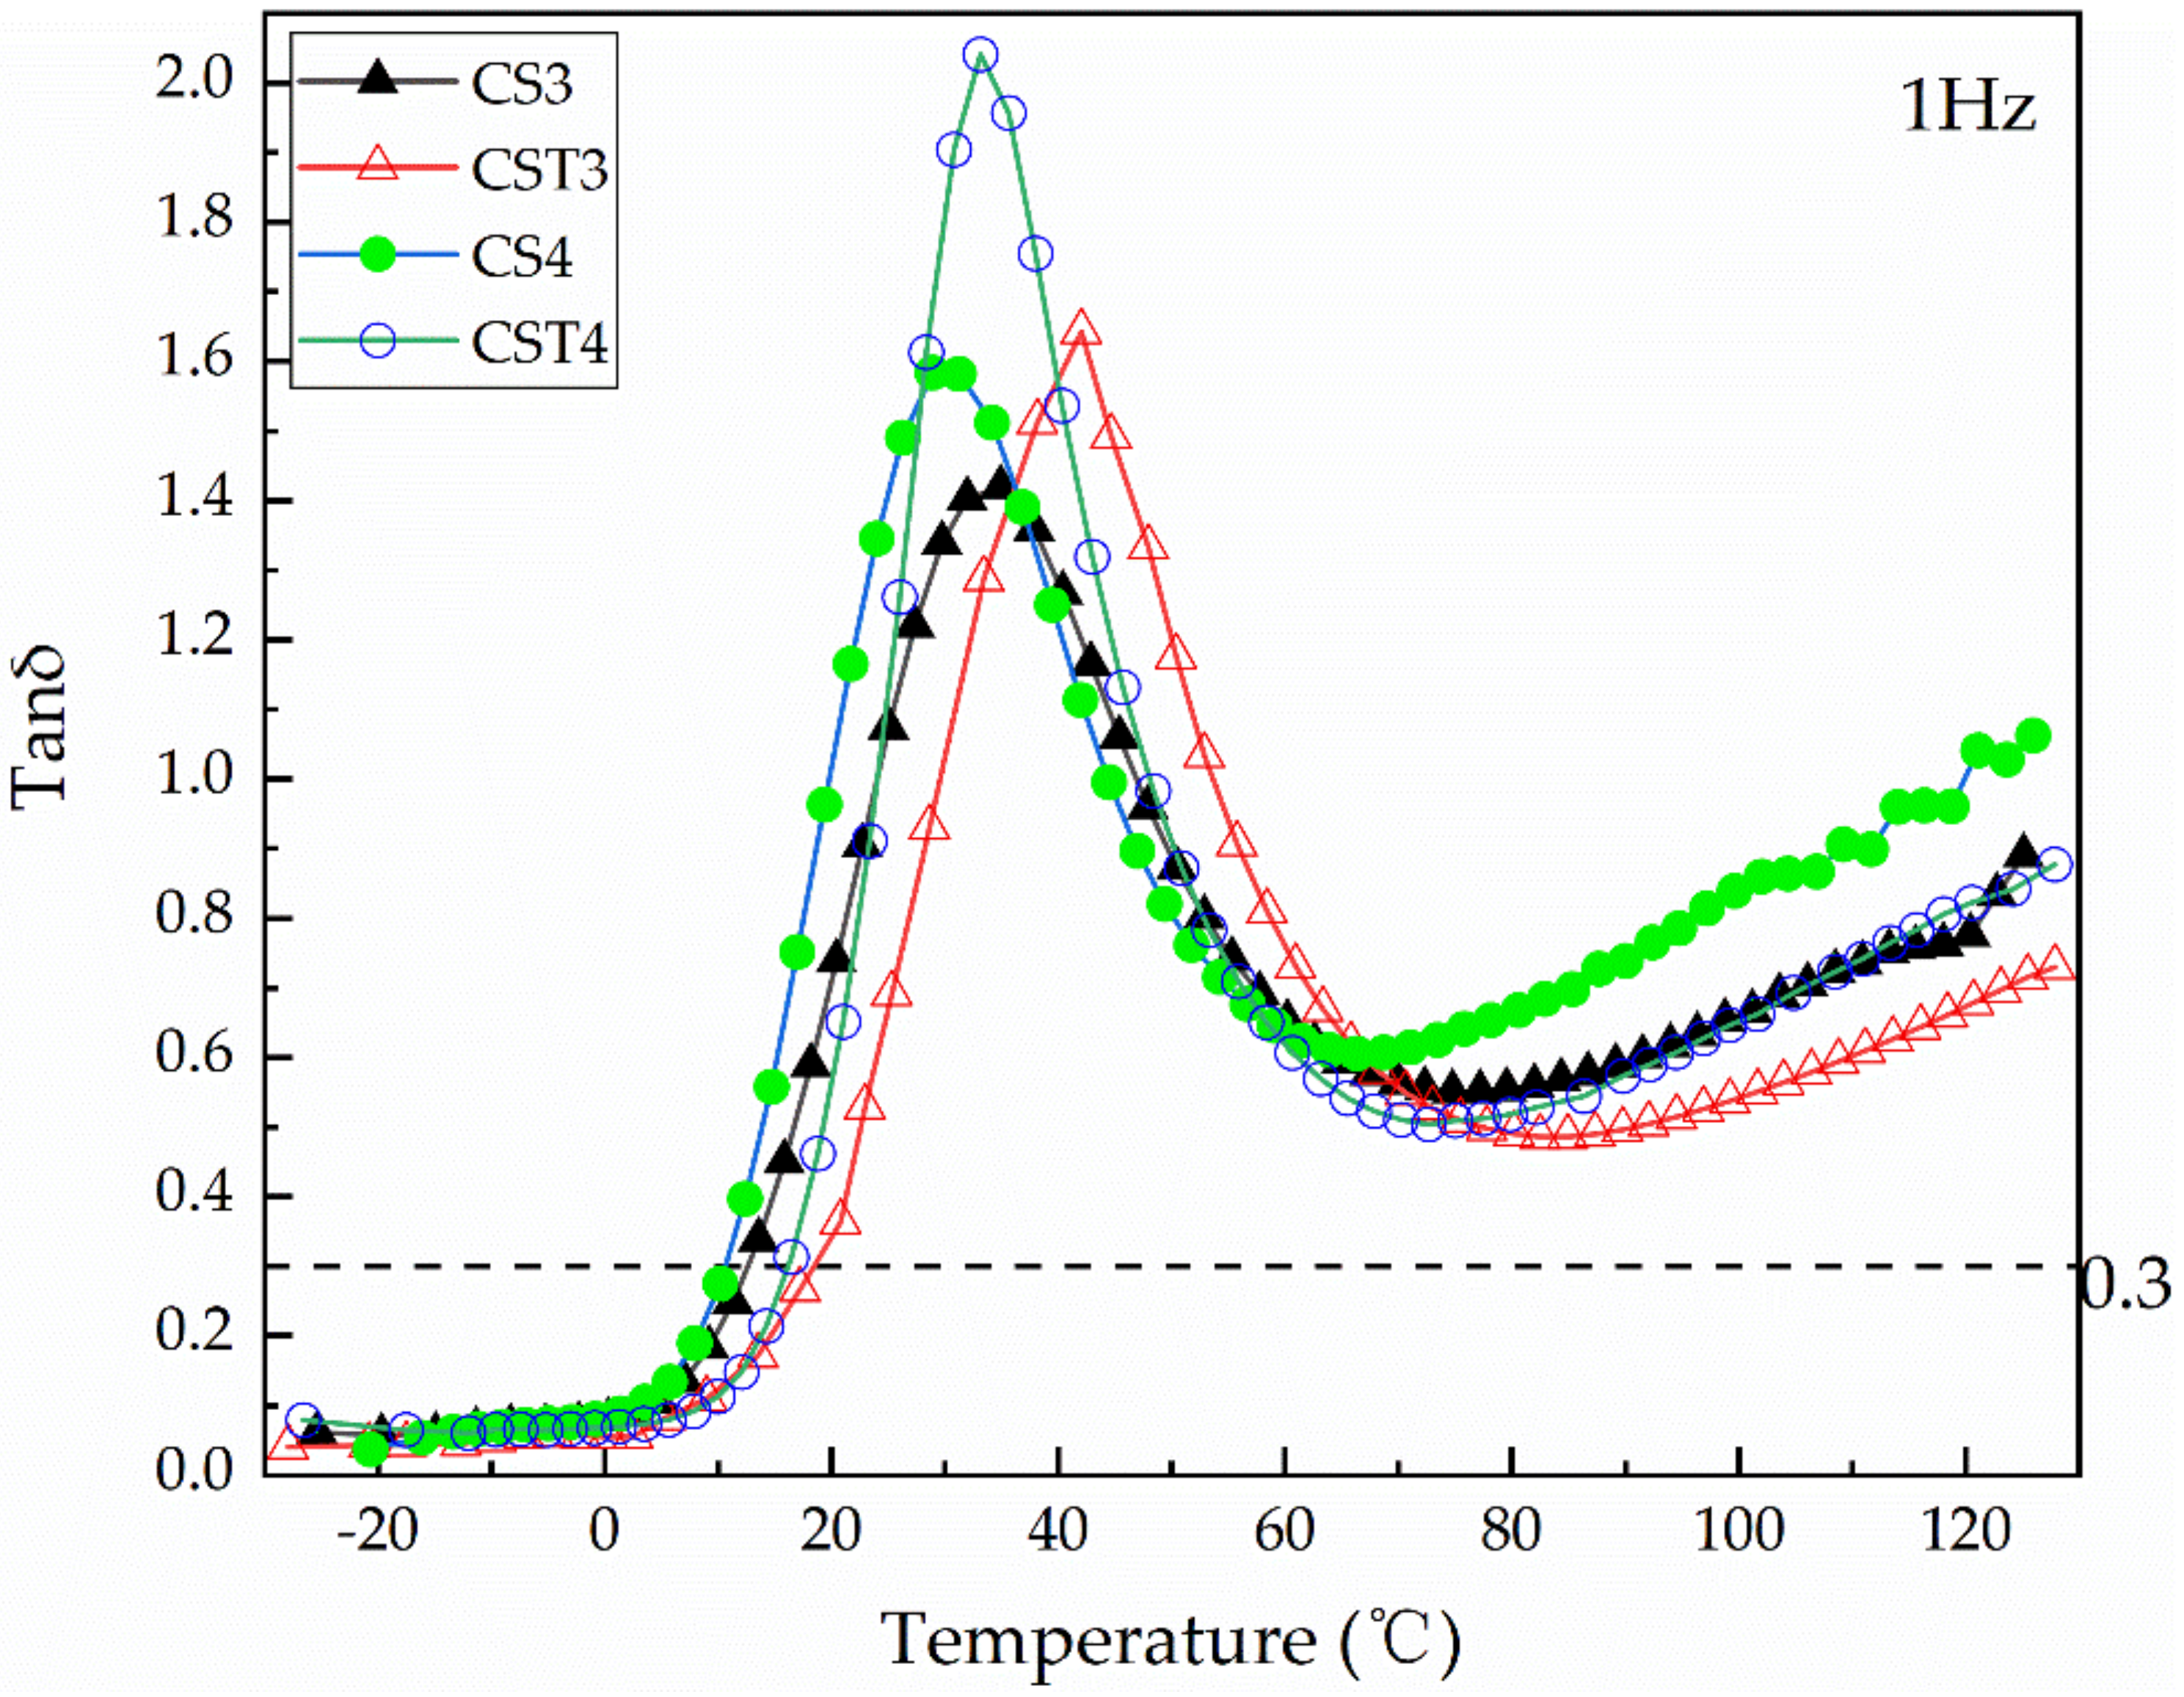
| CS3 | 1:3 | 44.61/−3.95 | 34.92 | 1.42 | 12.75–76.99 a |
| CS4 | 1:3 | 18.94/2.90 | 28.92 | 1.58 | 10.57–66.56 |
| Sample without “Transition Layer” | Core:Shell (Transition Layer:Shell) | Core/Transition Layer/SHELL | Tg (tan δmax)/°C | Tan δmax | Effective Temperature Region (tan δ > 0.3) (°C) |
| CST1 | 1:3 (12:63) | 96.07/20.00/−18.82 | 99.00/10.47 | 1.30 | 2.50–30.74/49.37–~ |
| CST2 | 1:3 (12:63) | 69.18/20.00/−14.23 | 61.91/23.93 | 0.83 | 11.51~ |
| CST3 | 1:3 (12:63) | 44.61/20.00/−8.07 | 42.04 | 1.64 | 18.63–85.24 a |
| CST4 | 1:3 (12:63) | 18.94/20.00/−0.14 | 33.13 | 2.04 | 15.85–73.86 |
| Sample with “Transition Layer” | Frequency/Hz | Tg/°C | ΔE (KJ/mol) | Sample without “Transition Layer” | Frequency/Hz | Tg/°C | ΔE (KJ/mol) |
|---|---|---|---|---|---|---|---|
| CS1 | 1 | 6.55/100.84 | 186.31/351.89 | CST1 | 1 | 14.92/103.06 | 124.57/307.94 |
| 10 | 15.68/108.81 | 10 | 22.33/113.05 | ||||
| 25 | 16.00/111.57 | 25 | 30.62/115.80 | ||||
| 50 | 20.80/111.88 | 50 | 38.38/116.09 | ||||
| 100 | 23.63/117.40 | 100 | 39.18/121.55 | ||||
| CS2 | 1 | 34.92 | 317.91 | CST2 | 1 | 58.91 | 278.66 |
| 10 | 40.84 | 10 | 67.03 | ||||
| 25 | 46.10 | 25 | 71.09 | ||||
| 50 | 49.03 | 50 | 71.60 | ||||
| 100 | 52.13 | 100 | 74.71 | ||||
| CS3 | 1 | 34.92 | 215.33 | CST3 | 1 | 42.04 | 259.24 |
| 10 | 40.84 | 10 | 48.39 | ||||
| 25 | 46.10 | 25 | 51.19 | ||||
| 50 | 49.03 | 50 | 54.05 | ||||
| 100 | 52.13 | 100 | 57.66 | ||||
| CS4 | 1 | 28.92 | 200.9 | CST4 | 1 | 33.13 | 224.78 |
| 10 | 37.25 | 10 | 40.76 | ||||
| 25 | 40.3 | 25 | 43.72 | ||||
| 50 | 45.58 | 50 | 46.95 | ||||
| 100 | 46.27 | 100 | 50.16 |
| Sample | Tensile Strength/MPa | Elongation at Break/% | Sample | Tensile Strength/MPa | Elongation at Break/% | ||
|---|---|---|---|---|---|---|---|
| With “transition layer” | CS1 | 5.21 | 243.2 | Without “transition layer” | CST1 | 6.28 | 182.1 |
| CS2 | 8.72 | 175.6 | CST2 | 10.21 | 143.6 | ||
| CS3 | 8.28 | 172.3 | CST3 | 10.32 | 139.8 | ||
| CS4 | 6.96 | 126.4 | CST4 | 9.95 | 121.4 | ||
Publisher’s Note: MDPI stays neutral with regard to jurisdictional claims in published maps and institutional affiliations. |
© 2021 by the authors. Licensee MDPI, Basel, Switzerland. This article is an open access article distributed under the terms and conditions of the Creative Commons Attribution (CC BY) license (https://creativecommons.org/licenses/by/4.0/).
Share and Cite
Chen, D.; Ding, M.; Huang, Z.; Wang, Y. Styrene–Acrylic Emulsion with “Transition Layer” for Damping Coating: Synthesis and Characterization. Polymers 2021, 13, 1406. https://doi.org/10.3390/polym13091406
Chen D, Ding M, Huang Z, Wang Y. Styrene–Acrylic Emulsion with “Transition Layer” for Damping Coating: Synthesis and Characterization. Polymers. 2021; 13(9):1406. https://doi.org/10.3390/polym13091406
Chicago/Turabian StyleChen, Daoyuan, Mingjin Ding, Zhixiong Huang, and Yanbing Wang. 2021. "Styrene–Acrylic Emulsion with “Transition Layer” for Damping Coating: Synthesis and Characterization" Polymers 13, no. 9: 1406. https://doi.org/10.3390/polym13091406
APA StyleChen, D., Ding, M., Huang, Z., & Wang, Y. (2021). Styrene–Acrylic Emulsion with “Transition Layer” for Damping Coating: Synthesis and Characterization. Polymers, 13(9), 1406. https://doi.org/10.3390/polym13091406