Article

Revised Atomic Charges for OPLS Force Field Model of Poly(Ethylene Oxide): Benchmarks and Applications in Polymer Electrolyte

by
Chan-En Fang
1,†,
Yi-Chen Tsai
1,2,†,
Christoph Scheurer
3,† and
Chi-Cheng Chiu
1,2,*,†
1
Department of Chemical Engineering, National Cheng Kung University, Tainan 70101, Taiwan
2
Hierarchical Green-Energy Materials (Hi-GEM) Research Center, National Cheng Kung University, Tainan 70101, Taiwan
3
Chair for Theoretical Chemistry and Catalysis Research Center, Technische Universität München, Lichtenbergstrasse 4, D-85747 Garching, Germany
*
Author to whom correspondence should be addressed.
These authors contributed equally to this work.
Polymers 2021, 13(7), 1131; https://doi.org/10.3390/polym13071131
Submission received: 28 February 2021 / Revised: 26 March 2021 / Accepted: 27 March 2021 / Published: 2 April 2021

Abstract

:
Poly(ethylene oxide) (PEO)-based polymers are common hosts in solid polymer electrolytes (SPEs) for high-power energy devices. Molecular simulations have provided valuable molecular insights into structures and ion transport mechanisms of PEO-based SPEs. The calculation of thermodynamic and kinetic properties rely crucially on the dependability of the molecular force fields describing inter- and intra-molecular interactions with the target system. In this work, we reparametrized atomic partial charges for the widely applied optimized potentials for liquid simulations (OPLS) force field of PEO. The revised OPLS force field, OPLSR, improves the calculations of density, thermal expansion coefficient, and the phase transition of the PEO system. In particular, OPLSR greatly enhances the accuracy of the calculated dielectric constant of PEO, which is critical for simulating polymer electrolytes. The reparameterization method was further applied to SPE system of PEO/LiTFSI with O:Li ratio of 16:1. Based on the reparametrized partial charges, we applied separate charge-scaling factors for PEO and Li salts. The charge-rescaled OPLSR model significantly improves the resulting kinetics of Li+ transport while maintaining the accurate description of coordination structures within PEO-based SPE. The proposed OPLSR force field can benefit the future simulation studies of SPE systems.

Graphical Abstract

1. Introduction

Solid polymer electrolytes (SPEs) have attracted wide attention due to their high safety, low leakage issue and good mechanical strength compared with conventional liquid electrolytes [1,2]. SPEs have been applied in developing various energies devices such as lithium-ion batteries, solar cells, and supercapacitors [3,4]. Among various SPEs, poly(ethylene oxide) PEO, or poly(ethylene glycol) PEG, is one of the most common polymer hosts for its low toxicity, good electrochemical stability, and the excellent ability to dissolve various lithium salts [5,6]. PEO can form stable complexes with Li+ via its ether oxygen atoms and conduct ions along its flexible chains [7,8]. Poly(ethylene oxide) dimethyl ether, PEODME, denotes the aprotic PEO methylated at both ends. Short chained PEODME, also referred as glyme, has less interaction with anions due to lack of terminal hydroxyl groups [9,10]. Glyme has been commonly applied in room temperature ionic liquids or as plasticizers for SPE to enhance the ion conductivity [11,12,13,14]. Please note that at high molecular weight, PEODME and PEO show similar physico-chemical characteristics as polymer electrolyte for the minimal effects of terminal groups in long-chain polymeric systems [15,16,17].
Molecular dynamics (MD) simulations can provide microscopic insight into polymer electrolyte systems and have contributed to unveiling the molecular mechanisms of ion transport within SPEs [7,18,19]. To better understand the thermodynamic and dynamic properties of target systems, the reliability of force field potentials describing inter- and intra-molecular interaction is critical. The all-atom optimized potentials for liquid simulations (OPLS) force field is one of the most common molecular models applied in MD studies of polymers, organic solvents, ionic liquids, and SPE systems [20,21,22,23,24,25]. Acevedo et al. developed OPLS models for various ionic liquid molecules that can accurately reproduce experimental properties, including density, heats of vaporization, heat capacities, and viscosities, etc. [20,23]. For the PEO system, various modifications have been proposed to enhance the applicability of OPLS model for electrolyte systems. Saito et al. revised the van der Waals parameters and atomic partial charges for OPLS to study the Li+ complex structure with glyme in ionic liquid and demonstrated consistent results with experiments [12]. Tsuzuki et al. modified OPLS for short-chain PEOGME, triglyme (G3), and tetraglyme (G4), to examine the coordination structures and ion dynamics within [Li(glyme)]+TFSI (bis(trifluoromethane)sulfonimide) ionic liquid [13]. Note, however, a later report by Barbosa et al. showed that the original OPLS force field is more accurate in calculating density, thermal expansivity, and dielectric constant of pure glyme systems than the two modified OPLS models [26].
Polarizable force fields allow atomic charge variations and have been successful in modeling various PEO-based SPE systems, including PEO/LiPF6, PEO/LiTFSI, and PEO/LiBF4, etc. [27,28,29,30]. In contrast, non-polarizable force fields, including OPLS, assign full charges for ions and fix the partial charge of each corresponding atom. Compared with polarizable force fields, non-polarizable models are more computationally efficient. Yet, the dynamics from MD simulations with non-polarizable force field have been shown to deviate substantially from experimental data [31,32]. To overcome this problem, a common strategy is to rescale the atomic charges within the system by a factor of 0.5–0.8 to account for the charge transfer among ion pairs [23,24,33,34]. However, reducing charges may correct the dynamics but also induce improper description of system structural properties [35,36]. Therefore, choosing appropriate scaling factors is crucial for simulation studies of electrolyte systems using non-polarizable force fields.
As discussed above, deriving atomic partial charges is critical in force field development, particularly for electrolyte systems in which electrostatic potentials play major roles in inter-molecular interactions. A recent study by Barbosa et al. developed transferable parameters of short-chain PEOGMEs based on the general AMBER force field (GAFF), another common force field for organic compounds, and derived the atomic partial charges via the restrained electrostatic potential (RESP) method [26]. The modified GAFF for various glymes showed significant improvement over the original GAFF in the calculations of density, viscosity, vaporization enthalpy, and dielectric constant. Another study by Liu et al. reparametrized OPLS force field for chlorinated hydrocarbons with RESP partial charges [37]. The revised OPLS force field greatly improved the accuracy on reproducing experimental dielectric constant values. Inspired by these works, here we revised OPLS parameters of long-chain PEODME using RESP partial charges. The newly derived model, i.e., OPLSR, was tested for its predictability of density, phase transition, thermal expansion coefficient, and dielectric constant of the pure PEO polymer melt system. The reparameterization was further applied to the PEO/LiTFSI SPE system with O:Li ratio of 16:1. Based on the resulting RESP partial charges, we propose to use different charge-scaling factors for PEO and Li salts. The charge-rescaled OPLSR model for SPE significantly improves the prediction of Li+ dynamics without sacrificing the microscopic description of PEO-based SPE structures.

2. Methods

2.1. Force Field and Atomic Charge Reparameterization

In the non-polarizable OPLS force field, the system energy is calculated as the sum of all intra-molecular and inter-molecular interactions [20,23,38,39]. The intra-molecular terms, E b o n d , includes bond stretching, angle bending, and torsional energies. The inter-molecular potential, E n o n b o n d , includes Coulomb energies and van der Waals interaction described by 12-6 Lennard-Jones terms:
E s y s = E b o n d + E n o n b o n d ,
E b o n d = i k b , i ( d i d 0 , i ) 2 + j k a , j ( θ j θ 0 , j ) 2 + m 1 2 k 1 , m ( 1 + c o s ϕ ) + k 2 , m ( 1 c o s 2 ϕ ) + k 3 , m ( 1 + c o s 3 ϕ ) + k 4 , m ( 1 c o s 4 ϕ ) ,
E n o n b o n d = i i > j q i q j e 2 r i j + 4 ϵ i j σ i j r i j 12 σ i j r i j 6 ,
where k x denotes the force constant for each energy term, d, θ , ϕ represent the bond length, angle, and torsional angle within a molecule with the equilibrium bond length d 0 and angle θ 0 . In E n o n b o n d , q is the atomic partial charge, σ represents vdW radius, and ϵ denotes the vdW well-depth. Here, the PEO polymer and the lithium-ion was described using original OPLS parameters, except for the partial charges. The bis(trifluoromethane)sulfonimide (TFSI ) anion was modeled by recently developed OPLS parameters for ionic liquid [20,23].
Atomic partial charges are crucial for modeling electrolyte systems, and the restrained electrostatic potential (RESP) method has been shown to improve the predictability of non-polarizable force field in system dielectric constant calculations [37,39,40,41]. Here, we revised the OPLS force field with RESP charges, denoted as OPLSR, for a PEO molecule. Please note that the RESP calculation is sensitive to the molecular conformation, and thus the averaged charges are more appropriate for the model parameterization. To calculate averaged RESP charges of PEO polymer, we constructed two PEODMEs with the degree of polymerization (DP) of 10 and 20, i.e., 10 and 20 monomers, respectively, as the target PEO molecules as shown in Figure 1a. An initial configuration of a polymer melt system with 40 PEO chains in a cubic cell was established using the PACKMOL software [42]. A short MD equilibration under constant pressure and constant temperature (NPT) at 1 atm and 363 K were then performed to obtain 10 polymer chain configurations as the initial structures for RESP charge calculations of two PEO systems with DP of 10 and 20. The molecular partial charges for the two PEO systems were first calculated via density functional theory (DFT) method with B3LYP/6-311G* basis sets using Gaussian 03 package [43]. The partial atomic charges were then fitted using the RESP method via the Antechamber package [44,45]. The averaged RESP charges from 10 polymer configurations for each atom of PEO polymer were rounded to the third decimal places while maintaining neutral net charges. The RESP charges from both PEO systems in DP of 10 and 20 were compared to check the partial charge convergence with respect to the polymer length. The resulting RESP partial charges of PEO are illustrated in Figure 1 in comparison with the original OPLS model and the partial charges reported by Barbosa et al. [26].

2.2. Molecular Dynamics Simulation Details

The derived OPLSR parameters were applied to a PEODME with DP of 64 (approximate molecular weight of 2800) as the model PEO chain to construct both pure polymer melt and solid polymer electrolyte systems. The initial configuration of the pure polymer system was constructed by randomly placing 40 PEO chains into a cubic box using the PACKMOL software [42]. The SPE system included 40 PEO chains and 160 lithium bis(trifluoromethane)sulfonimide (LiTFSI), corresponding to the O:Li+ ratio of 16:1. Each system was first energy minimized through the steepest descent minimization algorithm to eliminate unreasonable structures, followed by a short NVT (constant volume, constant temperature) simulation at 298K to further eliminate any high-energy configurations. The system was further heated and equilibrated at 898 K and 1 bar under NPT ensemble to facilitate the equilibration of the polymer melt. The system was then slowly annealed to 298 K with the rate of 0.08 K/ps, followed by a production run of 400 ns at 298 K and 1 bar with system configurations saved every 5 ps for further analyses. All the polymer melt and polymer electrolyte systems studied in this work are listed in Table S1–S3. All simulations were carried out using the GROMACS 5.0.4 package with an integration time step of 1 fs [46,47]. Periodic boundary conditions (PBC) were applied to the system cell in all three dimensions. The van der Waals (vdW) and short-range electrostatic potentials were cut off at 1.2 nm where the vdW interactions were smoothly shifted to zero starting from 0.8 nm. Long-range electrostatic interactions were evaluated by the Particle Mesh Ewald (PME) algorithm [48,49]. Temperature and pressure were controlled using the Nose-Hoover thermostat algorithm and Parrinello–Rahman barostats with the coupling time constants of 0.5 ps and 1 ps, respectively [50,51,52,53]. System configurations were visualized with visual molecular dynamics (VMD) software [54]. All the analyses described in the subsequent sections were performed using built-in modules of GROMACS and in-house analysis scripts.

3. Results and Discussion

The OPLS model revised with RESP charges, OPLSR, for PEO was derived as described in the Methods section. The resulting atomic partial charges of OPLS, Barbosa [26], and OPLSR model for PEO are shown and compared in Figure 1. For the OPLSR model, the RESP charges converge after the third ethylene oxide monomer, similar to the model derived by Barbosa [26]. Compared with the original OPLS, the partial charges of oxygen atoms are more negative in the Barbosa and OPLSR resulting in larger local dipole moments, whereas the Barbosa model gives the most negative oxides among the three models. With these three force fields, the properties of PEO polymer melt systems including density, melting point (Tm), thermal expansion coefficient, and dielectric constant were analyzed and compared to evaluate the accuracy and the reliability of the proposed OPLSR model. A PEO-based SPE system was further simulated to evaluate the applicability of OPLSR. SPE structures, Li+ diffusion coefficient, and diffusion activation energy were compared among the three tested force fields and validated against experimental data.

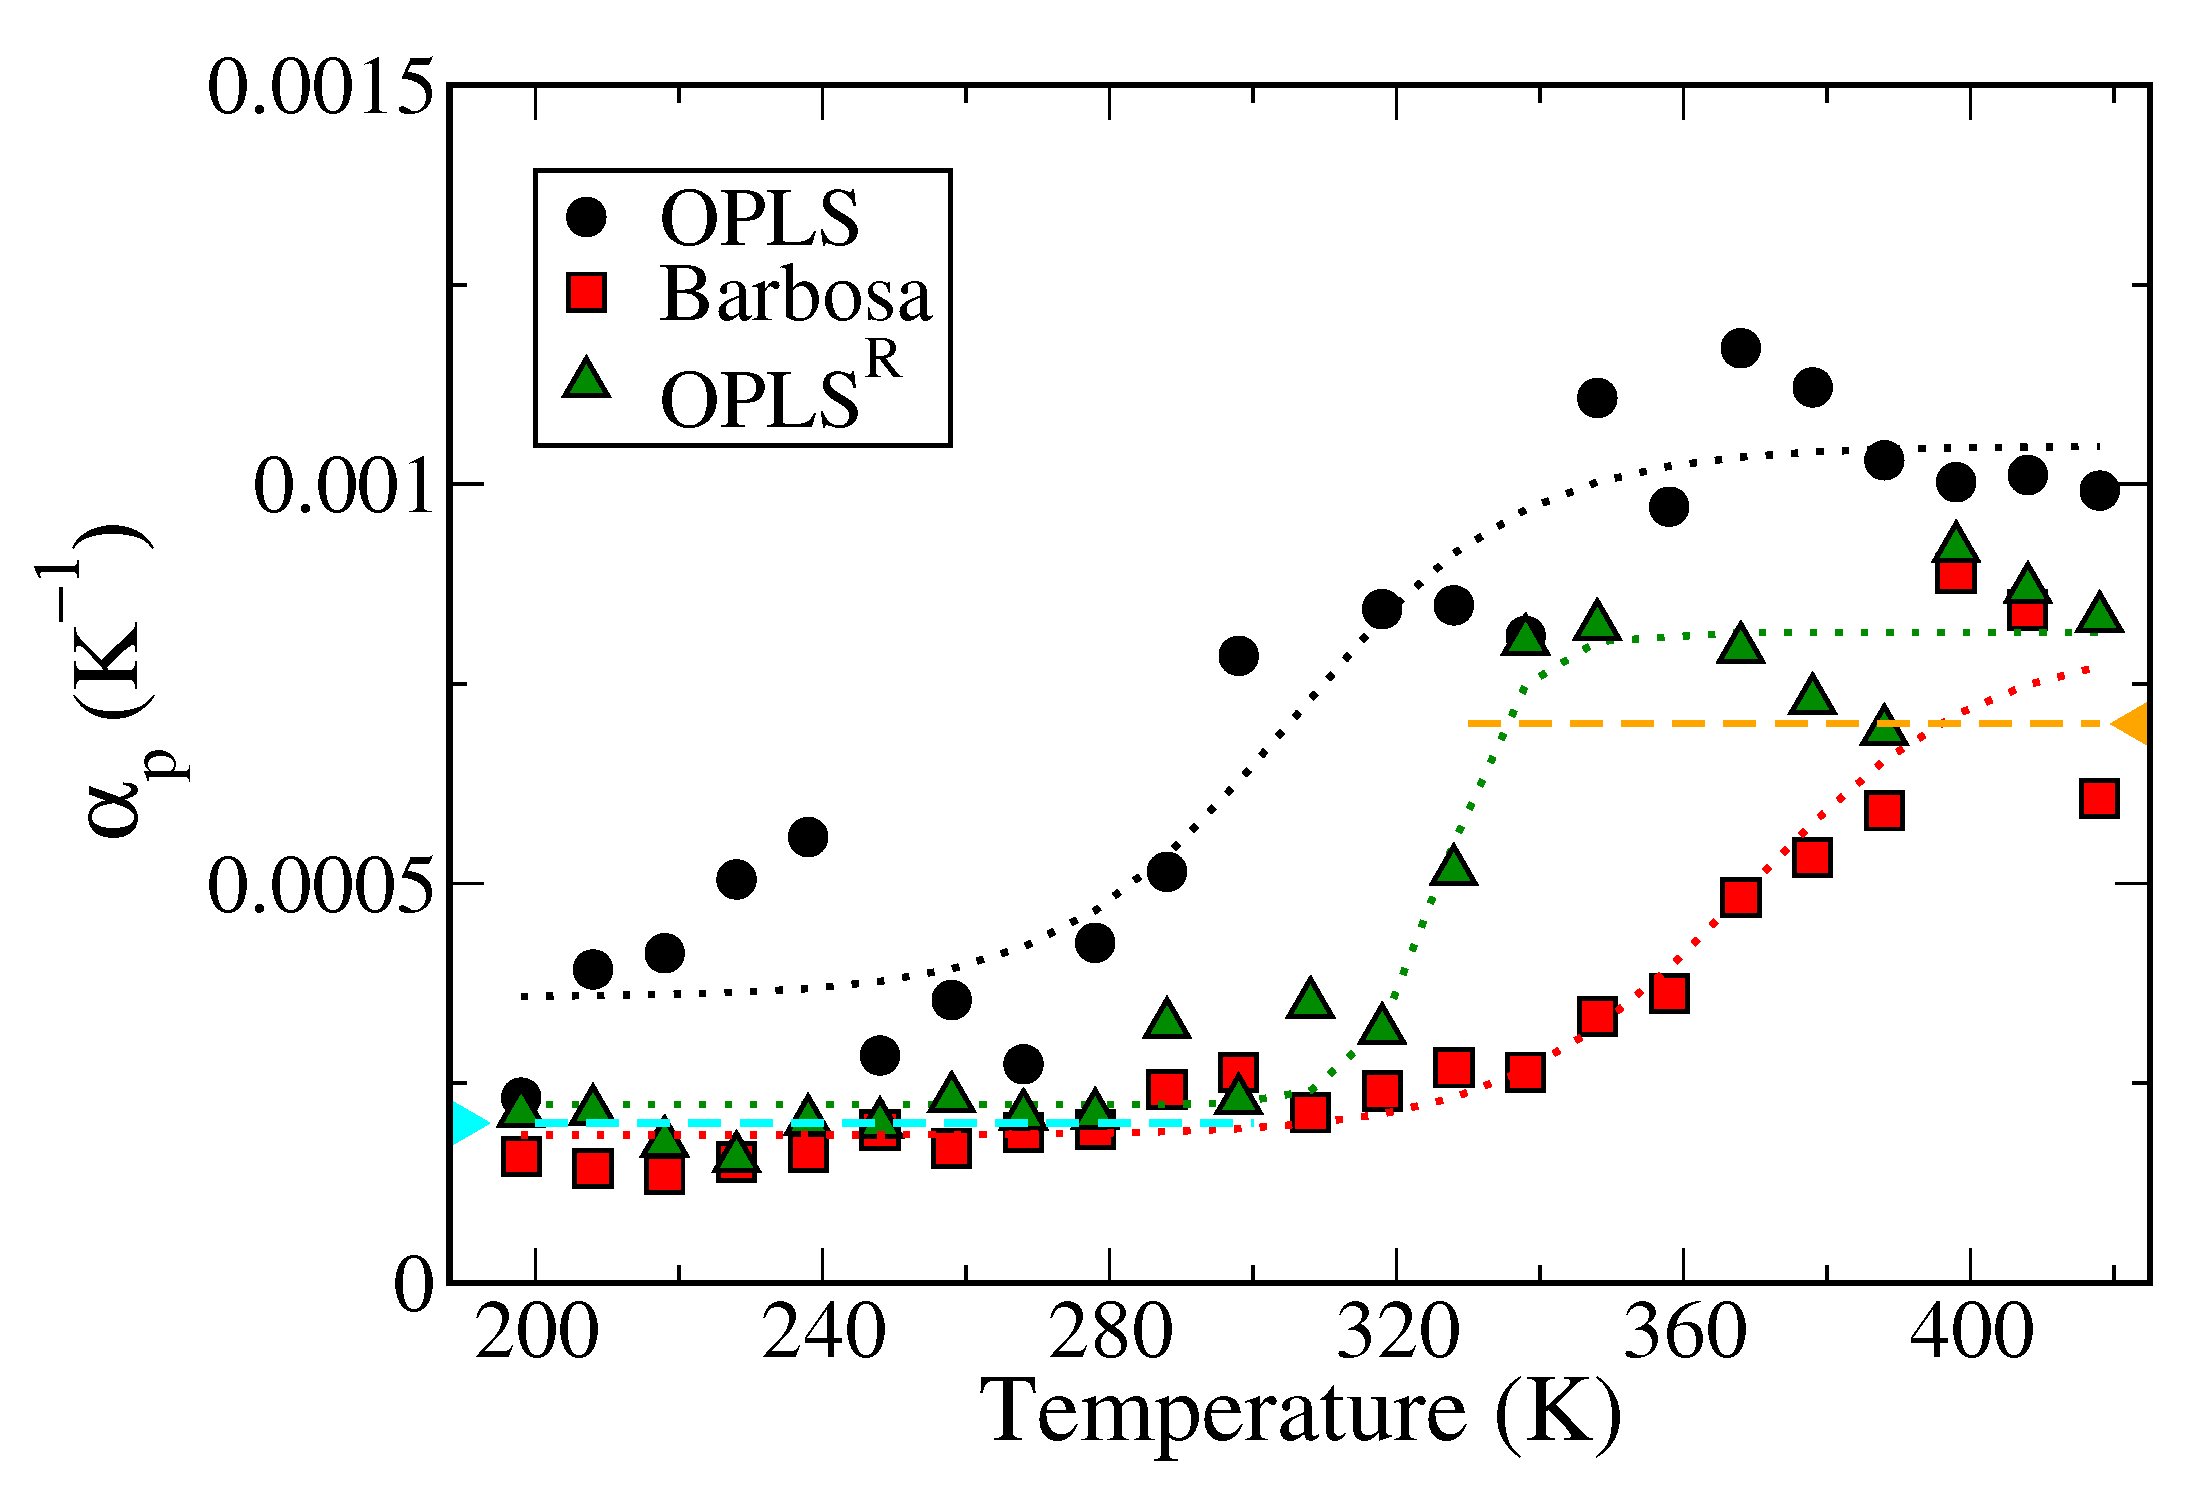
3.1. Polymer Melts System

The physical properties of PEO melt systems containing 40 PEO chains with DP of 64 were analyzed from the simulations using the three tested force fields. Figure 2 shows the density of PEO melts over a wide temperature range of 198–448 K. The resulting densities at 298 K are 1100 kg/m3 for the OPLS model, 1176 kg/m3 for the Barbosa model, and 1170 kg/m3 for the OPLSR model. The results derived from the RESP and Barbosa models were in good agreement with the experimental value of 1200 kg/m3 [55], whereas the original OPLS force field underestimates by 8%. The default OPLS model exhibits a relatively small local dipole moment; thus, the calculated density deviates from the experimental value. In contrast, due to the larger dipole moments, the inter-chain interactions for the Barbosa and OPLSR models are enhanced, leading to improved density values of PEO melts.
Figure 3 displays the calculated specific heat capacities (Cp) per mole of PEO chains at temperatures ranging from 198K to 418K of PEO melt systems modeled with the three tested force fields. The Cp was evaluated from the fluctuations of the system enthalpy H [56]:
C p = H 2 H 2 k B T 2
where k B denotes the Boltzmann constant and T is the simulation temperature. The distinct peaks observed in Cp-T profiles indicate the phase transition of the polymer melts. Moreover, the onset temperature of Cp rising can be related to the transition temperature determined from the density–temperature profile as shown in Figure 2. The experimental melting temperature (Tm) of PEO is ∼330 K [55]. The results shown in Figure 3 suggest that the three tested models estimate Tm of PEO differently, with 300 K for OPLS, 400 K for the Barbosa model, and 360 K for OPLSR. It is noteworthy that the Tm overestimation for the Barbosa model is particularly severe with the relative error of around 21% of the experimental value. This is because the charges of oxygen and carbon atoms in the Barbosa model were too large compared to the other two models, leading to a greater local polarity of the PEO polymer and further resulted in an erroneous Tm despite the improvement in the PEO density. In contrast, the Tm calculated by the OPLS and the derived RESP models are more consistent with the experimental value with relative errors of 9%. For OPLSR, the greater dipoles also lead to slightly higher Tm than the experimental value; whereas the OPLS model results in a lower Tm due to a smaller local dipole. Yet, the onset temperature of Cp raising of OPLSR is closer to the experimental Tm in comparison to that of the original OPLS model, suggesting that OPLSR can describe similar phase behaviors of PEO compared to default OPLS.
The thermal expansion coefficients ( α P ) of each PEO model were analyzed to confirm the force field validity. The thermal expansion coefficient was evaluated as [56]:
α P = V · U V U + P 2 ( V 2 V 2 ) k B T V
where U denotes the system potential energy, P, V and T are the system pressure, volume and temperature, respectively, and k B is the Boltzmann constant. Figure 4 displays the thermal expansion coefficients ( α P ) as functions of temperature obtained from three different PEO models. The averaged α P values in the high-temperature region above Tm and the low-temperature region below Tm are summarized in Table 1. In the low-temperature region of 210 K to 300 K, the expansion coefficient results of PEO in the Barbosa and OPLSR model are in excellent agreement with the experimental value [57], whereas the values obtained from OPLS are marginally overestimated. In the high-temperature range, however, the results from the Barbosa model deviate more from the experimental value, where the α P values of the Barbosa model at 400 K is already higher than the experimental data. This suggests that the Barbosa model overestimates the α P of molten PEO above Tm. The absence of a high-temperature plateau region in the α P -T profile of the Barbosa model can be related to the severe overestimation of Tm as shown in Figure 3. Surprisingly, despite that OPLSR gives a slightly higher Tm than original OPLS model, the α P of molten PEO above Tm from OPLSR is closer to the experimental value than that from the original OPLS force field. Hence, the overall α P results of the OPLSR model are the most consistent with the experimental data.
The main objective of re-parameterizing atomic charges of the OPLS model for PEO is to improve the validity of polymer electrolyte simulations in which the dielectric response properties are critical. Before applying OPLSR for SPE systems, we first analyzed the dielectric constants of pure PEO melts in three tested models and compared the results with experimental data [58]. The static dielectric constant ϵ is related to the fluctuations of the system dipole moment M and can be calculated as [59]:
ϵ = 1 + 4 π 3 M 2 M 2 V k B T
where k B denotes the Boltzmann constant, V is the system volume, and T is the simulation temperature. The system dipole moment M was evaluated as:
M = q i r i ,
where the q i and r i denoted the charge and position of the ith atom, respectively, and the summation summed over all the particles within the system. Here, the dielectric constant ϵ was calculated using the g m x d i p o l e s analysis tools within the GROMACS package [46,47].
The resulting dielectric constants from three different PEO models at 298 K compared with the experimental value are listed in Table 1 [58]. As reported in the literature [39], the OPLS model gives ϵ of 4.36 for pure PEO, which is severely underestimated compared to the experimental data. This indicates a poor description of the dielectric response of PEO in the original OPLS force field. The Barbosa and the newly derived OPLSR models predict higher dielectric constant values of ϵ = 8.08 and 9.94, respectively, that are consistent with the experimental ϵ of 9∼11. The higher dielectric responses of the two models can be attributed to the larger local dipoles as shown in Figure 1. Changes in polymer conformations can lead to larger fluctuations for more pronounced local polarization, resulting in a greater static dielectric constant value. Combined analyses suggest that OPLSR with RESP partial charges improves the predictions of bulk PEO density, thermal expansion coefficient, and dielectric response, while maintaining a reasonable description of thermotropic phase behavior.

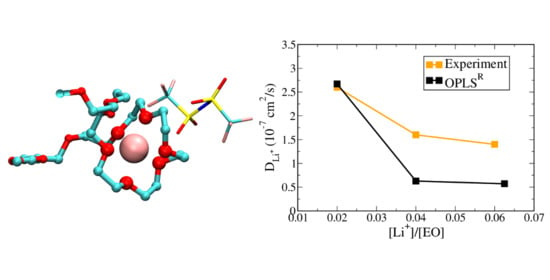
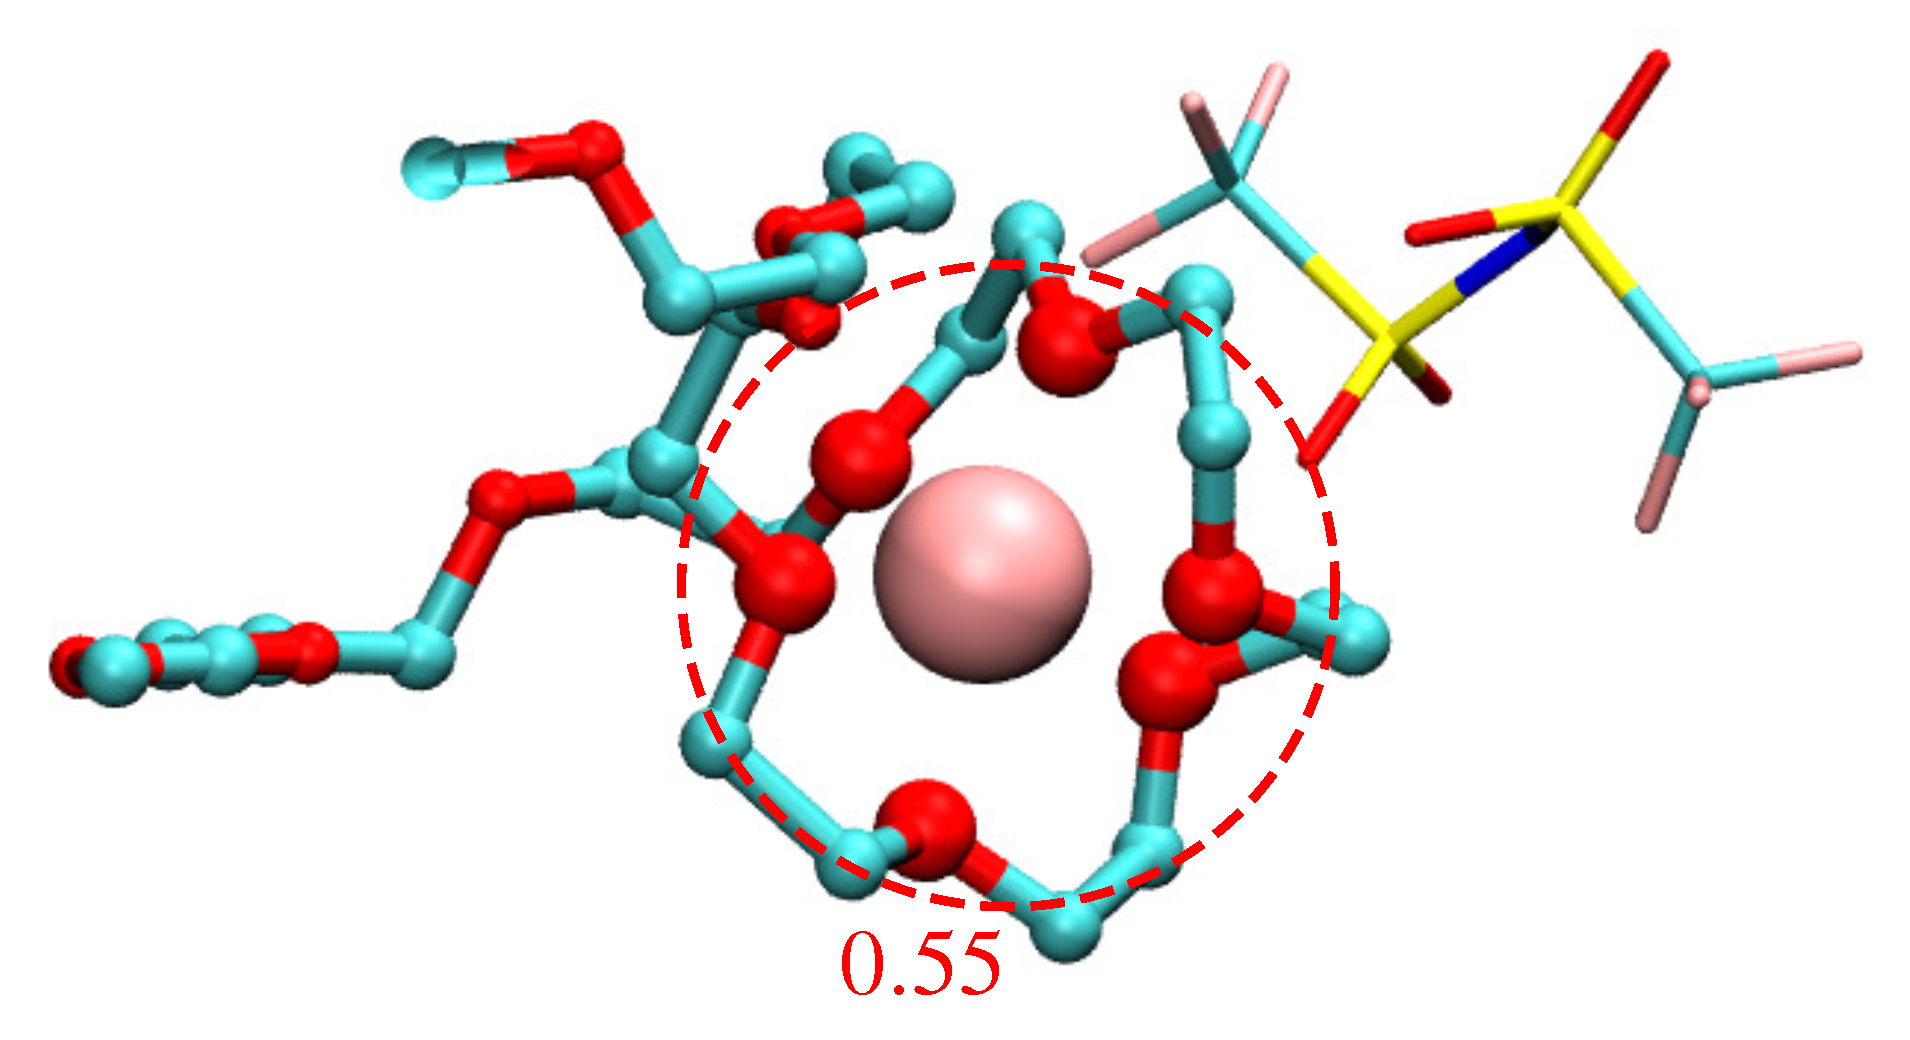
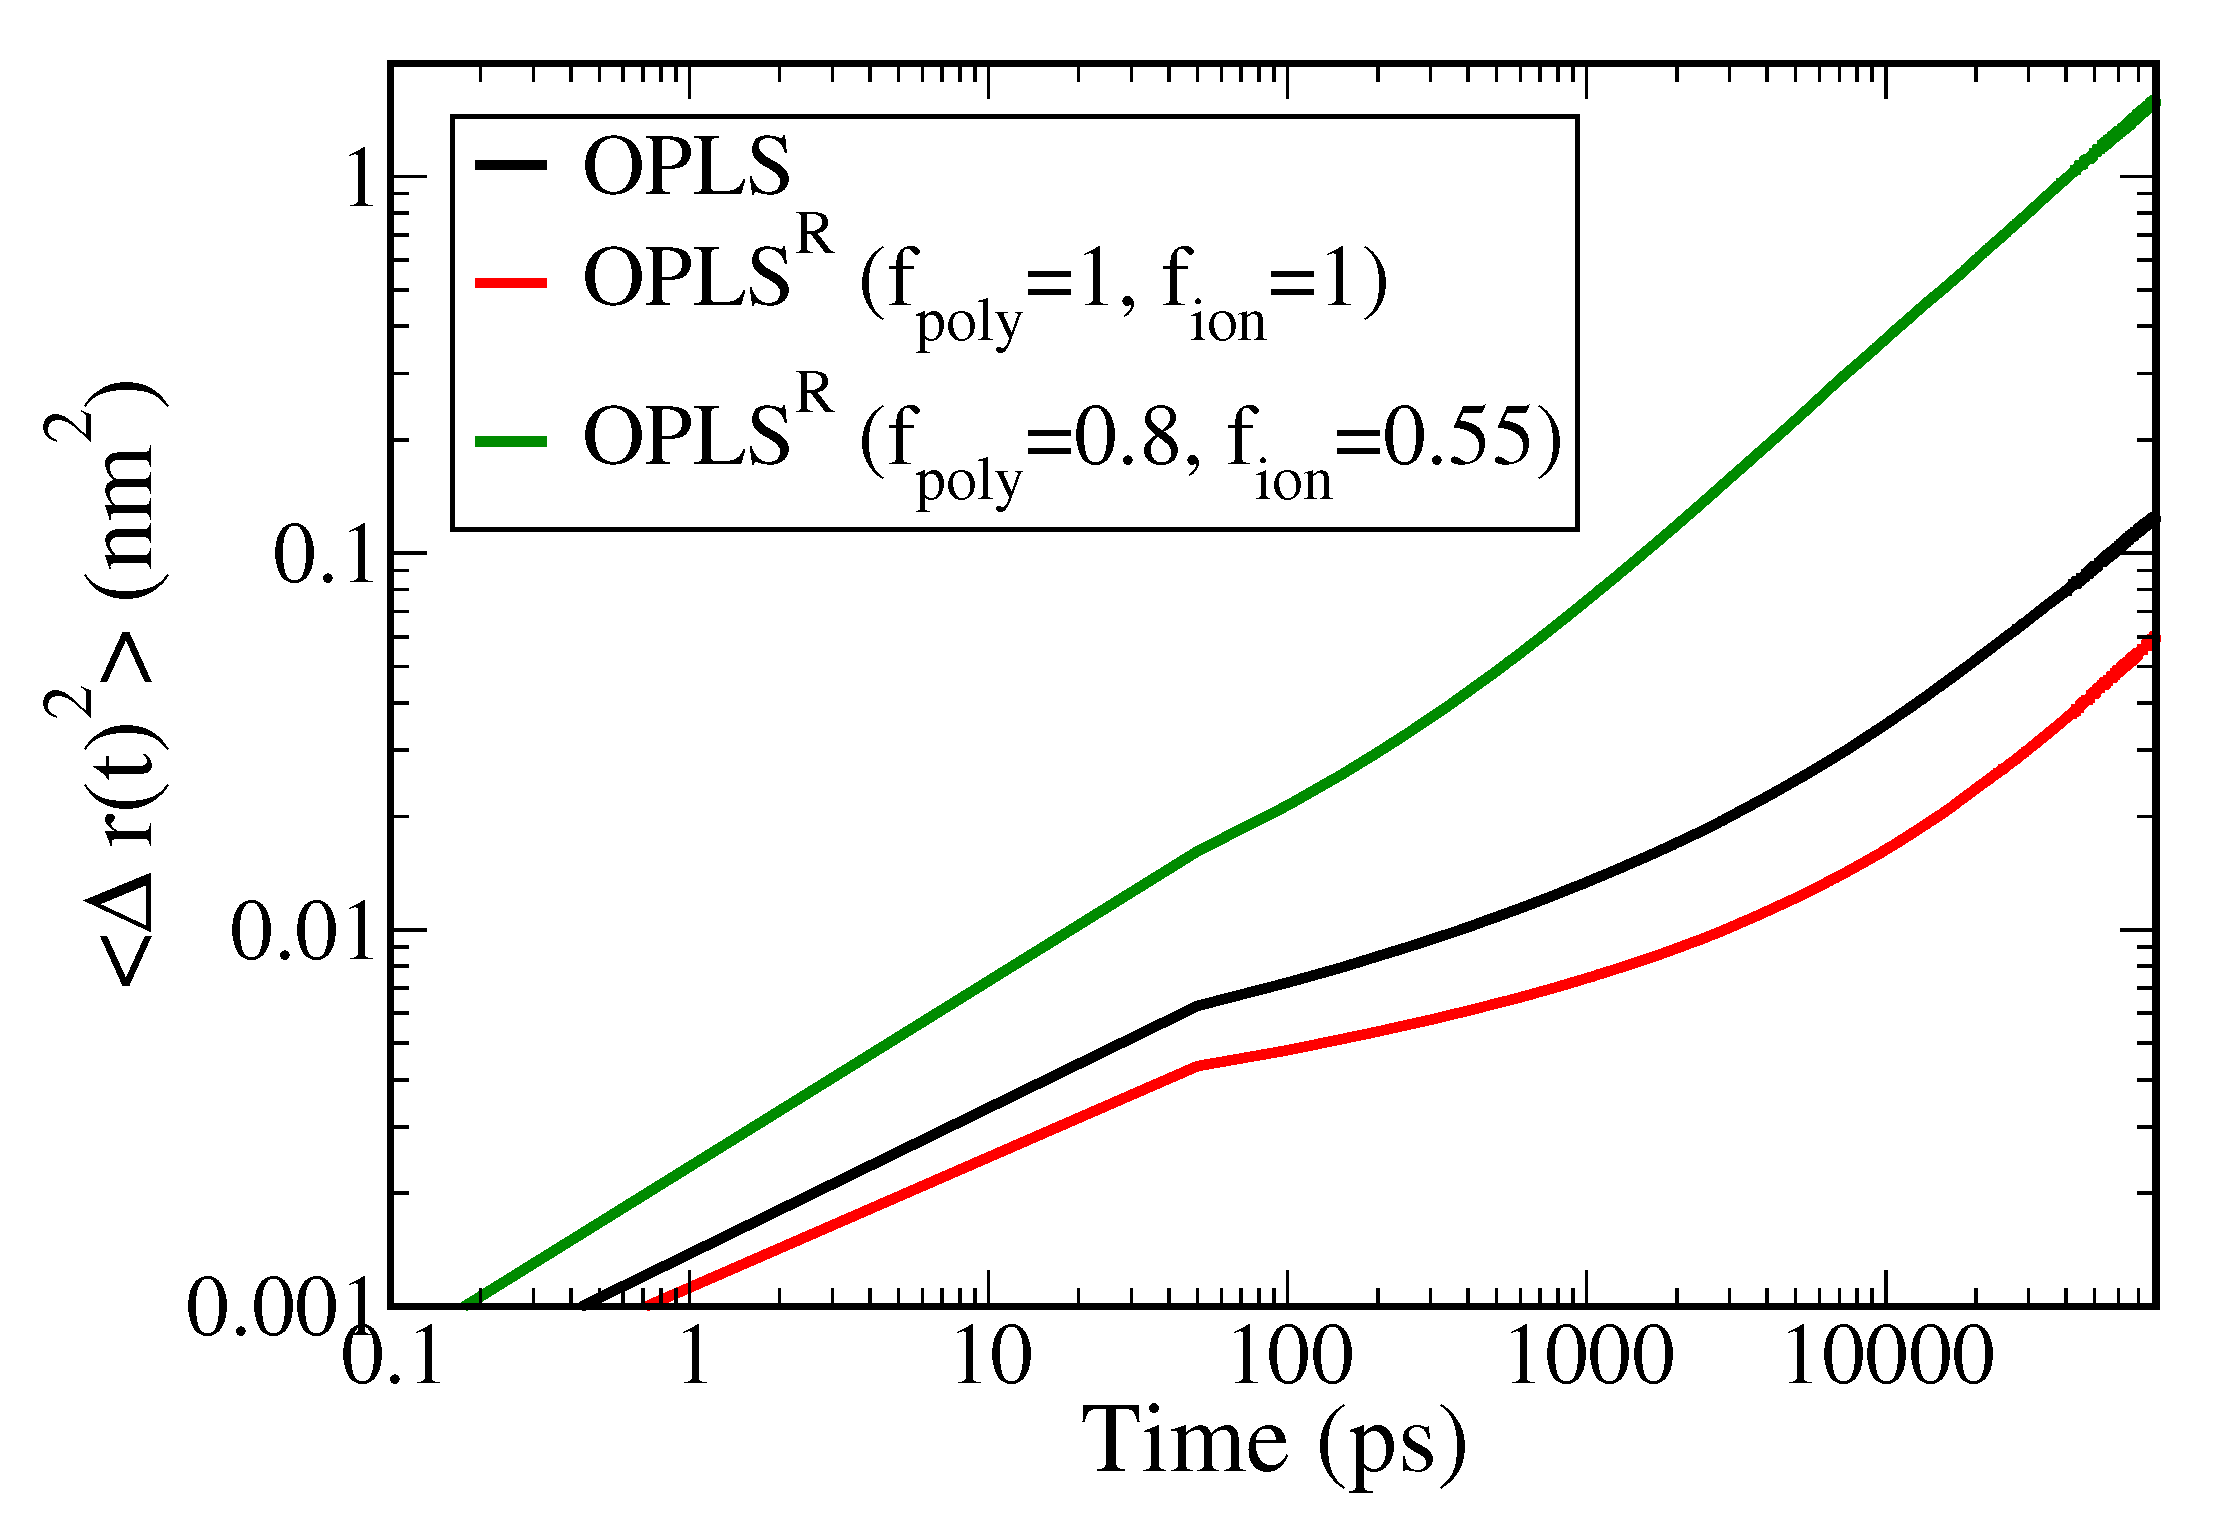
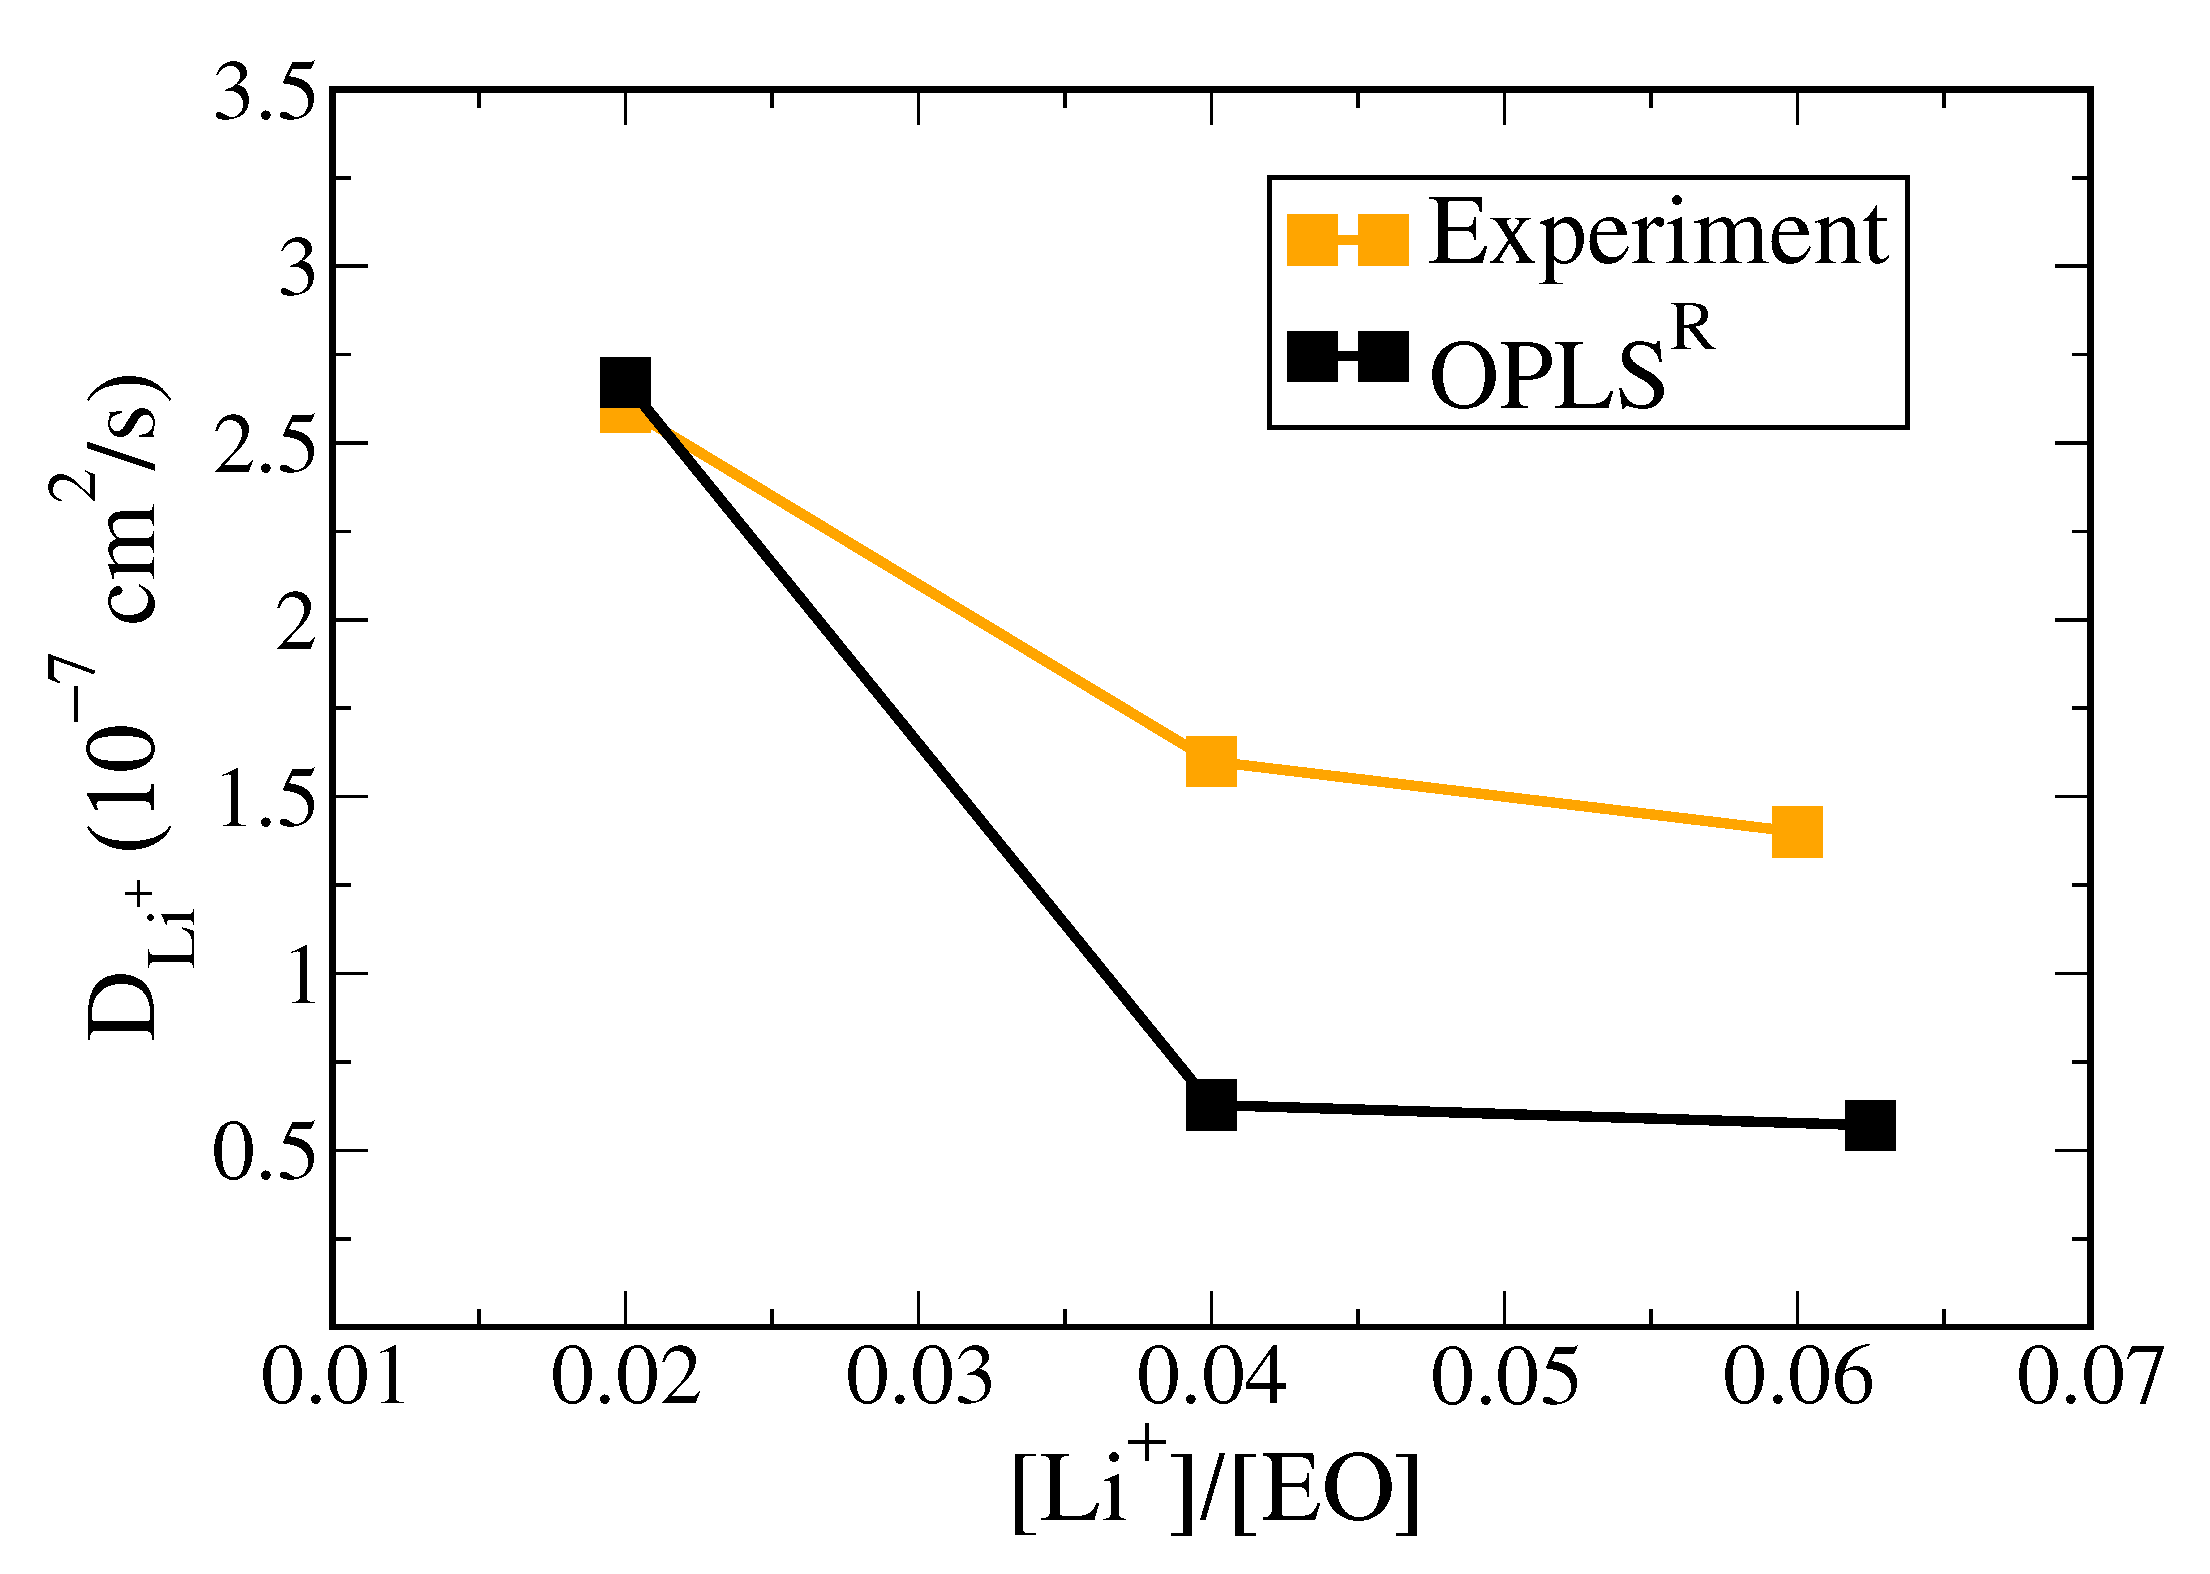
3.2. Polymer Electrolyte

According to the analyses of pure PEO melt systems, although the dielectric constant and density at 298 K resulting from the Barbosa model are consistent with the experimental data, its applicability is poor at higher temperature and deviates far from the experimental values. Therefore, for the polymer electrolyte systems, we focused mainly on the comparison of OPLS and OPLSR models with reported experimental data.
For non-polarizable force fields such as OPLS, the dynamics of electrolyte systems are known to deviate from experimental data [31,32], mainly due to the incapability of describing charge transfer between ions and polymer. A common approach to overcome this issue is through rescaling the atomic partial charges of the system by a factor of 0.5–0.8 [23,24,33,34]. Here, to examine the effects of charge transfer on partial charges in PEO/LiTFSI SPE system and to find the appropriate scaling of charges, we performed RESP calculations on a system containing one LiTFSI and one PEO chain of DP = 16, corresponding to a SPE system of O:Li+ = 16:1, in 10 different configurations. As demonstrated in Figure 5, PEO can wrap around Li+ to form a stable coordination complex. The resulting charge for Li+ is around +0.55 and the net charge for TFSI is ∼−0.55. Interestingly, the partial charges for oxygen atoms coordinating with Li+ and their nearby alkyl chains also have their charges reduced by a factor of 0.55 compared to the pure polymer system. For the PEO segment away from ions, the partial charges remain consistent with pure PEO. Therefore, we applied separate charge-scaling factors for ions and polymers in the PEO/LiTFSI SPE system. For Li+ and TFSI , we set the scaling factor f i o n = 0.55 according to the RESP calculation. Please note that in the PEO-based SPE system, there are on average 5–6 oxygen atoms coordinating with one Li+. Hence, for the PEO/LiTFSI SPE system with O:Li+ =16:1, the charge-scaling factor for PEO polymers was estimated as f p o l y = 1 / 16 [ 0.55 × 6 + ( 16 6 ) ] 0.8 to account for the averaged charge transfer effects induced by Li+ coordination. The resulting f p o l y = 0.8 is also close to the scaling factor reported in the literature [23,24].
To validate the proposed charge-scaling scheme, we conducted equilibrium MD simulations of PEO/LiTFSI SPE systems using original OPLS, OPLSR with full charge ( f p o l y = 1 , f i o n = 1 ), and charge-rescaled OPLSR ( f p o l y = 0.8 , f i o n = 0.55 ). The SPE structures were characterized with radial distribution functions (RDF) between ions and polymers as illustrated in Figure 6. For the full-charged and charge-rescaled OPLSR models, compared with the original OPLS model, the RDFs between Li+ exhibit attenuated first peaks at around 10 Å; whereas the RDFs between PEO and Li+ show enhanced peaks at 2 Å, corresponding to the first coordination shell. This indicates that the greater dipole within the OPLSR model allows better solvation of Li+. The numbers of PEO oxygen within the first coordination shell of Li+, i.e., the coordination numbers C N , were 5.6 for OPLS, 5.64 for OPLSR, and 4.91 for charge-rescaled OPLSR. The resulting C N for charge-rescaled OPLSR is more consistent with the values of CN 5 reported by polarizable MD force field and the experimental data [60,61], where the ones by OPLS and OPLSR are slightly overestimated. Due to the scaled charges, the repulsion between same ions is reduced. Therefore, the first RDF peaks of Li+-Li+ and TFSI -TFSI pairs slightly shift to smaller separation distance. However, comparing the full-charged and charge-rescaled OPLSR models, the RDF profiles for all tested pairs are similar, suggesting that the charge-scaling has minimal effects on the SPE structural description.
The main purpose of charge-rescaling of SPE system is to improve the description of the ionic dynamics in MD simulations. To calculate the self-diffusion coefficient of Li+, D L i + , one of the most common approaches is through the mean square displacements (MSD, Δ r ( t ) 2 ) of Li+ via the Einstein relation [56]:
D = lim t 1 6 t Δ r ( t ) 2 ,
where t denotes the diffusion time, r ( t ) is the displacement of Li+ over the time span t, and the angle brackets represent the ensemble average. A larger D L i + indicates better Li+ mobility.
The resulting MSD profiles of PEO/LiTFSI SPE systems at 333 K in the default OPLS, OPLSR with full charge ( f p o l y = 1 , f i o n = 1 ), and charge-rescaled OPLSR ( f p o l y = 0.8 , f i o n = 0.55 ) force fields are shown in Figure 7 (the corresponding MSD profiles for anions are shown in Figure S1). Due to the increased dipole, the ion–polymer interactions in the OPLSR model are enhanced. This further limits the ion mobility, resulting in a lower MSD profile of the full-charge OPLSR model compared with the original OPLS force field. In contrast, the MSD profile for the charge-rescaled OPLSR model shows an order of magnitude enhancement over the full-charged model. The calculated D L i + values for all tested systems at 363 K, 333 K, and 298 K are listed in Table 2 in comparison to experimental data. Charge-rescaled OPLSR gives D L i + = 2.40 × 10 8 that is most consistent with the experimental value of 3.68 × 10 8 at 333 K, whereas the original OPLS and full-charged OPLSR underestimate D L i + by one order of magnitude.
Experimentally, the contribution of Li+ mobility to the overall ionic conductivity is characterized by the lithium transference number (t L i + ). In MD simulation, t L i + can be evaluated from the diffusion coefficients of Li+ and counter ions as in NMR measurements [62]:
t L i + = D Li + D Li + + D TFSI
where D Li + and D TFSI denote self-diffusion coefficients of the Li+ and TFSI , respectively, evaluated from the MSD profiles shown in Figure S2–S7. As summarized in Table 2, the original OPLS and full-charged OPLSR give much higher t L i of 0.41 at 333 K than experimental data, suggesting poor descriptions of the dynamics for both Li+ and TFSI in the two force fields. In contrast, charge-rescaled OPLSR predicts t L i + of 0.215 , consistent with the experimental value of 0.24 . In the charge-rescaled OPLSR model, the Coulomb interactions between ions are reduced, leading to larger diffusion coefficients for both cations and anions. However, Li+ was still coordinated with the oxygens of the polymer chain with a larger dipole in OPLSR. Thus, the magnitude of the increase in D L i + is not as great as that in D T F S I . Therefore, the resulting t L i + is reduced and is more in line with the experiment.
The activation energy of Li+ diffusion ( E a ) can be obtained from the diffusion coefficients at various temperatures according to the Arrhenius equation:
D L i + ( T ) = D 0 e x p E a R T ,
which is usually re-written as:
ln D L i + ( T ) = ln D 0 E a R T ,
By plotting ln D L i + ( T ) versus 1 / T , the diffusion activation energy E a can be estimated by the slope of the linear fitted line. The resulting Arrhenius plots and the E a values for the PEO/LiTFSI SPE systems in the OPLS, full-charged OPLSR, and charge-rescaled OPLSR force fields are shown in Figure 8. The calculated E a values for Li+ diffusion are close to the experimental value of ∼0.4 eV for all tested models. This validates the dynamic descriptions in the newly proposed force field. Please note that the Li+ transport within PEO-based SPE mainly depends on the collective motion with polymer chains. According to the structural and thermotropic analyses of PEO melts and SPE systems, the variations in partial charges have greater influences on the interactions between polymer chains than on the Li+ coordination environment. Hence, the activation energy for Li+ diffusion is less affected by the partial charges of polymers. The overall results indicate that the proposed charge-rescaled OPLSR can significantly improve the description of Li+ mobility and correctly balances the dynamics between cations and anions.
To examine the versatility of the charge-scaled OPLSR model, we tested two additional PEO/LiTFSI SPE systems with various O/Li+ ratio of 50 and 25 at 363 K. As shown in Figure 9, all the resulting D L i + values (estimated from the MSD profiles for Li+ shown in Figure S8) are in the same order compared with the experimental data [62]. Additionally, the charge-scaled OPLSR model shows similar effects of salt concentration on the Li+ mobility where D L i + decreases with increasing lithium salt content and converges after O/Li+ = 25. These results demonstrate the applicability of the proposed model on the PEO/LiTFSI SPE systems with a wide O/Li+ range.

4. Conclusions

Revised OPLS parameters with RESP partial charges, OPLSR, were proposed for long-chain PEO polymers. Series of MD simulations were conducted to validate the OPLSR force field in predicting PEO melt properties compared with original OPLS model, the model developed by Barbosa et al. [26], and the experimental data. The re-parameterized RESP charge model gives a larger local dipole within PEO chains, which improves the predicted PEO density of 1170 kg/m3 in OPLSR compared with the experimental value of 1200 kg/m3. Additionally, OPLSR gives thermal expansion coefficients α P more consistent with experimental values both above and below Tm than both the original OPLS and Barbosa models. Furthermore, the static dielectric constant of pure PEO obtained from the OPLSR force field ( ϵ = 9.94 ), compared with the experimental value of 9–11, shows a significant improvement over the default OPLS model ( ϵ = 4.36 ). Combined results indicate that OPLSR with RESP partial charges improves the validity of bulk PEO melt properties while retaining reasonable thermotropic phase behaviors.
The RESP revision of OPLS was further applied to MD simulations of PEO/LiTFSI polymer electrolyte systems with O:Li+ ratio of 16:1. Based on the RESP results, we derived separate charge-scaling factors for ions and polymers ( f p o l y = 0.8 , f i o n = 0.55 ) in the PEO/LiTFSI SPE system. According to RDF analyses, applying the charge-scaling factors has limited effects on the Li+ coordination structures within SPE systems. However, due to the reduced Coulomb interaction, the ion mobilities are greatly enhanced. The diffusion coefficient D L i + of 2.40 × 10 8 at 333 K from charge-rescaled OPLSR is the most consistent with the experimental value of 3.68 × 10 7 among the tested PEO models. The derived lithium transference number and the activation energy of Li+ diffusion in the OPLSR force field are also in good agreement with the reported experimental data. The OPLSR model is also applicable for PEO/LiTFSI SPE systems with a wide O/Li+ range of 16 to 50. These results demonstrate the versatility and the validity of the proposed charge-rescaled OPLSR for the description of Li+ mobility and balances between cation and anion dynamics within SPE systems. The proposed parameterization and the charge-scaling rules can also benefit future simulation studies on polymer electrolyte systems using non-polarizable force fields.

Supplementary Materials

The following are available online at https://www.mdpi.com/article/10.3390/polym13071131/s1, Figure S1: The mean square displacement profiles of TFSI in PEO/LiTFSI SPE system at 333 K for three tested force fields, Figure S2: The mean square displacement profiles of Li+ in PEO/LiTFSI SPE system at different temperature of default OPLS force field, Figure S3: The mean square displacement profiles of Li+ in PEO/LiTFSI SPE system at different temperature of OPLSR force field with scaling factor ( f p o l y = 1 , f i o n = 1 ), Figure S4: The mean square displacement profiles of Li+ in PEO/LiTFSI SPE system at different temperature of OPLSR force field with scaling factor ( f p o l y = 0.8 , f i o n = 0.55 ), Figure S5: The mean square displacement profiles of TFSI in PEO/LiTFSI SPE system at different temperature of default OPLS force field, Figure S6: The mean square displacement profiles of TFSI in PEO/LiTFSI SPE system at different temperature of OPLSR force field with scaling factor ( f p o l y = 1 , f i o n = 1 ), Figure S7: The mean square displacement profiles of TFSI in PEO/LiTFSI SPE system at different temperature of OPLSR force field with scaling factor ( f p o l y = 0.8 , f i o n = 0.55 ), Figure S8: The mean square displacement profiles of Li+ in PEO/LiTFSI SPE system at [EO]/[Li+] ratio of OPLSR force field with scaling factor ( f p o l y = 0.8 , f i o n = 0.55 ), Table S1: Pure PEO systems, Table S2: Electrolyte system ([EO]/[Li+] =16), Table S3: Electrolyte system (OPLSR force field with different [EO]/[Li+] ratio at 363 K).

Author Contributions

Conceptualization, C.S. and C.-C.C.; methodology, C.-E.F. and C.-C.C.; software, C.-E.F., Y.-C.T.; validation, C.-E.F., C.S. and C.-C.C.; formal analysis, C.-E.F. and Y.-C.T.; investigation, C.-E.F., Y.-C.T. and C.-C.C.; resources, C.S. and C.-C.C.; data curation, C.-E.F. and Y.-C.T.; writing—original draft preparation, Y.-C.T. and C.-C.C.; writing—review and editing, C.S. and C.-C.C.; visualization, C.-C.C.; supervision, C.S. and C.-C.C.; project administration, C.S. and C.-C.C.; funding acquisition, C.S. and C.-C.C. All authors have read and agreed to the published version of the manuscript.

Funding

This work was partially supported by the Hierarchical Green-Energy Materials (Hi-GEM) Research Center, from The Featured Areas Research Center Program within the framework of the Higher Education Sprout Project by the Ministry of Education (MOE) in Taiwan. The authors also acknowledge the financial supports by the Ministry of Science and Technology of Taiwan through Grant Nos. MOST 109-3116-F-006-021-CC1, MOST 109-2923-E-006-006, and MOST 108-2221-E-006-150-MY2. C. Scheurer acknowledges funding and support from the German BMBF (Bundesministerium für Bildung und Forschung) within the Project EvaBatt (FKZ 03XP0134D).

Institutional Review Board Statement

Not applicable.

Informed Consent Statement

Not applicable.

Data Availability Statement

The study did not report any data.

Acknowledgments

The authors thank Hsisheng Teng, Jeng-Shiung Jan and Sheng-Shu Hou for fruitful discussions and experimental xinsights.

Conflicts of Interest

The authors declare no conflict of interest. The funders had no role in the design of the study; in the collection, analyses, or interpretation of data; in the writing of the manuscript, or in the decision to publish the results.

Abbreviations

The following abbreviations are used in this manuscript:
MDmolecular dynamics
OPLSoptimized potentials for liquid simulations
RESPthe restrained electrostatic potential
OPLSROPLS model with RESP charges
PEOpolyethylene oxide
PEODMEpoly(ethylene oxide) dimethyl ether
DPdegree of polymerization
SPEsolid polymer electrolyte

References

  1. Mauger, A.; Armand, M.; Julien, C.M.; Zaghib, K. Challenges and issues facing lithium metal for solid-state rechargeable batteries. J. Power Sources 2017, 353, 333–342. [Google Scholar] [CrossRef] [Green Version]
  2. Mindemark, J.; Lacey, M.J.; Bowden, T.; Brandell, D. Beyond PEO—Alternative host materials for Li+-conducting solid polymer electrolytes. Prog. Polym. Sci. 2018, 81, 114–143. [Google Scholar] [CrossRef]
  3. Lopez, J.; Mackanic, D.G.; Cui, Y.; Bao, Z. Designing polymers for advanced battery chemistries. Nat. Rev. Mater. 2019, 4, 312–330. [Google Scholar] [CrossRef] [Green Version]
  4. Su, Y.H.; Lin, Y.H.; Tseng, Y.H.; Lee, Y.L.; Jan, J.S.; Chiu, C.C.; Hou, S.S.; Teng, H. Postinjection gelation of an electrolyte with high storage permittivity and low loss permittivity for electrochemical capacitors. J. Power Sources 2021, 481, 228869. [Google Scholar] [CrossRef]
  5. Li, W.; Pang, Y.; Liu, J.; Liu, G.; Wang, Y.; Xia, Y. A PEO-based gel polymer electrolyte for lithium ion batteries. RSC Adv. 2017, 7, 23494–23501. [Google Scholar] [CrossRef] [Green Version]
  6. Xue, Z.; He, D.; Xie, X. Poly(ethylene oxide)-based electrolytes for lithium-ion batteries. J. Mater. Chem. A 2015, 3, 19218–19253. [Google Scholar] [CrossRef]
  7. Mogurampelly, S.; Borodin, O.; Ganesan, V. Computer Simulations of Ion Transport in Polymer Electrolyte Membranes. Annu. Rev. Chem. Biomol. Eng. 2016, 7, 349–371. [Google Scholar] [CrossRef]
  8. Lin, K.J.; Maranas, J.K. Cation Coordination and Motion in a Poly(ethylene oxide)-Based Single Ion Conductor. Macromolecules 2012, 45, 6230–6240. [Google Scholar] [CrossRef]
  9. Salomon, M.; Xu, M.; Eyring, E.M.; Petrucci, S. Molecular structure and dynamics of LiClO4-polyethylene oxide-400 (dimethyl ether and diglycol systems) at 25 C. J. Phys. Chem. 1994, 98, 8234–8244. [Google Scholar] [CrossRef]
  10. Frech, R.; Huang, W. Conformational Changes in Diethylene Glycol Dimethyl Ether and Poly(ethylene oxide) Induced by Lithium Ion Complexation. Macromolecules 1995, 28, 1246–1251. [Google Scholar] [CrossRef]
  11. Wang, H.; Im, D.; Lee, D.J.; Matsui, M.; Takeda, Y.; Yamamoto, O.; Imanishi, N. A Composite Polymer Electrolyte Protect Layer between Lithium and Water Stable Ceramics for Aqueous Lithium-Air Batteries. J. Electrochem. Soc. 2013, 160, A728. [Google Scholar] [CrossRef]
  12. Saito, S.; Watanabe, H.; Ueno, K.; Mandai, T.; Seki, S.; Tsuzuki, S.; Kameda, Y.; Dokko, K.; Watanabe, M.; Umebayashi, Y. Li+ Local Structure in Hydrofluoroether Diluted Li-Glyme Solvate Ionic Liquid. J. Phys. Chem. D 2016, 120, 3378–3387. [Google Scholar] [CrossRef]
  13. Tsuzuki, S.; Shinoda, W.; Matsugami, M.; Umebayashi, Y.; Ueno, K.; Mandai, T.; Seki, S.; Dokko, K.; Watanabe, M. Structures of [Li(glyme)]+ complexes and their interactions with anions in equimolar mixtures of glymes and Li[TFSA]: Analysis by molecular dynamics simulations. Phys. Chem. Chem. Phys. 2015, 17, 126–129. [Google Scholar] [CrossRef] [PubMed]
  14. Cha, J.H.; Didwal, P.N.; Kim, J.M.; Chang, D.R.; Park, C.J. Poly(ethylene oxide)-based composite solid polymer electrolyte containing Li7La3Zr2O12 and poly(ethylene glycol) dimethyl ether. J. Membr. Sci. 2020, 595, 117538. [Google Scholar] [CrossRef]
  15. Costa, L.T.; Ribeiro, M.C.C. Molecular dynamics simulation of polymer electrolytes based on poly(ethylene oxide) and ionic liquids. I. Structural properties. J. Chem. Phys. 2006, 124, 184902. [Google Scholar] [CrossRef] [PubMed]
  16. Costa, L.T.; Ribeiro, M.C.C. Molecular dynamics simulation of polymer electrolytes based on poly(ethylene oxide) and ionic liquids. II. Dynamical properties. J. Chem. Phys. 2007, 127, 164901. [Google Scholar] [CrossRef] [PubMed]
  17. Costa, L.T.; Lavall, R.L.; Borges, R.S.; Rieumont, J.; Silva, G.G.; Ribeiro, M.C.C. Polymer electrolytes based on poly(ethylene glycol) dimethyl ether and the ionic liquid 1-butyl-3-methylimidazolium hexafluorophosphate: Preparation, physico-chemical characterization, and theoretical study. Electrochim. Acta 2007, 53, 1568–1574. [Google Scholar] [CrossRef]
  18. Maitra, A.; Heuer, A. Cation Transport in Polymer Electrolytes: A Microscopic Approach. Phys. Rev. Lett. 2007, 98, 227802. [Google Scholar] [CrossRef] [Green Version]
  19. Borodin, O.; Smith, G.D. Mechanism of Ion Transport in Amorphous Poly(ethylene oxide)/LiTFSI from Molecular Dynamics Simulations. Macromolecules 2006, 39, 1620–1629. [Google Scholar] [CrossRef]
  20. Sambasivarao, S.V.; Acevedo, O. Development of OPLS-AA Force Field Parameters for 68 Unique Ionic Liquids. J. Chem. Theory Comput. 2009, 5, 1038–1050. [Google Scholar] [CrossRef]
  21. Canongia Lopes, J.N.; Deschamps, J.; Pádua, A.A.H. Modeling Ionic Liquids Using a Systematic All-Atom Force Field. J. Phys. Chem. B 2004, 108, 2038–2047. [Google Scholar] [CrossRef]
  22. Canongia Lopes, J.N.; Pádua, A.A.H. Molecular Force Field for Ionic Liquids Composed of Triflate or Bistriflylimide Anions. J. Phys. Chem. B 2004, 108, 16893–16898. [Google Scholar] [CrossRef]
  23. Doherty, B.; Zhong, X.; Gathiaka, S.; Li, B.; Acevedo, O. Revisiting OPLS Force Field Parameters for Ionic Liquid Simulations. J. Chem. Theory Comput. 2017, 13, 6131–6145. [Google Scholar] [CrossRef]
  24. Costa, L.T.; Sun, B.; Jeschull, F.; Brandell, D. Polymer-ionic liquid ternary systems for Li-battery electrolytes: Molecular dynamics studies of LiTFSI in a EMIm-TFSI and PEO blend. J. Chem. Phys. 2015, 143, 024904. [Google Scholar] [CrossRef] [PubMed]
  25. Raju, S.G.; Hariharan, K.S.; Park, D.H.; Kang, H.R.; Kolake, S.M. Effects of variation in chain length on ternary polymer electrolyte—Ionic liquid mixture—A molecular dynamics simulation study. J. Power Sources 2015, 293, 983–992. [Google Scholar] [CrossRef]
  26. Barbosa, N.S.V.; Zhang, Y.; Lima, E.R.A.; Tavares, F.W.; Maginn, E.J. Development of an AMBER-compatible transferable force field for poly(ethylene glycol) ethers (glymes). J. Mol. Model 2017, 23, 1–14. [Google Scholar] [CrossRef] [PubMed]
  27. Borodin, O.; Douglas, R.; Smith, G.D.; Trouw, F.; Petrucci, S. MD simulations and experimental study of structure, dynamics, and thermodynamics of poly(ethylene oxide) and its oligomers. J. Phys. Chem. B 2003, 107, 6813–6823. [Google Scholar] [CrossRef]
  28. Borodin, O.; Smith, G.D.; Jaffe, R.L. Ab initio quantum chemistry and molecular dynamics simulations studies of LiPF6/poly(ethylene oxide) interactions. J. Comput. Chem. 2001, 22, 641–654. [Google Scholar] [CrossRef]
  29. Borodin, O.; Smith, G.D. Development of many-body polarizable force fields for Li-battery components: 1. Ether, alkane, and carbonate-based solvents. J. Phys. Chem. B 2006, 110, 6279–6292. [Google Scholar] [CrossRef]
  30. Diddens, D.; Heuer, A.; Borodin, O. Understanding the Lithium Transport within a Rouse-Based Model for a PEO/LiTFSI Polymer Electrolyte. Macromolecules 2010, 43, 2028–2036. [Google Scholar] [CrossRef]
  31. Siqueira, L.J.A.; Ribeiro, M.C.C. Molecular dynamics simulation of the polymer electrolyte poly(ethyleneoxide)/LiClO4. I. Structural properties. J. Chem. Phys. 2005, 122, 194911. [Google Scholar] [CrossRef]
  32. Siqueira, L.J.A.; Ribeiro, M.C.C. Molecular dynamics simulation of the polymer electrolyte poly(ethylene oxide)/LiClO[sub 4]. II. Dynamical properties. J. Chem. Phys. 2006, 125, 214903. [Google Scholar] [CrossRef]
  33. van Zon, A.; Mos, B.; Verkerk, P.; de Leeuw, S.W. On the dynamics of PEO-NaI polymer electrolytes. Electrochim. Acta 2001, 46, 1717–1721. [Google Scholar] [CrossRef]
  34. Müller-Plathe, F.; van Gunsteren, W.F. Computer simulation of a polymer electrolyte: Lithium iodide in amorphous poly(ethylene oxide). J. Chem. Phys. 1995, 103, 4745–4756. [Google Scholar] [CrossRef]
  35. Halley, J.W.; Duan, Y.; Curtiss, L.A.; Baboul, A.G. Lithium perchlorate ion pairing in a model of amorphous polyethylene oxide. J. Chem. Phys. 1999, 111, 3302. [Google Scholar] [CrossRef]
  36. Mos, B.; Verkerk, P.; Pouget, S.; van Zon, A.; Bel, G.J.; de Leeuw, S.W.; Eisenbach, C.D. The dynamics in polyethyleneoxide–alkali iodide complexes investigated by neutron spin-echo spectroscopy and molecular dynamics simulations. J. Chem. Phys. 2000, 113, 4. [Google Scholar] [CrossRef] [Green Version]
  37. Liu, Z.; Timmermann, J.; Reuter, K.; Scheurer, C. Benchmarks and Dielectric Constants for Reparametrized OPLS and Polarizable Force Field Models of Chlorinated Hydrocarbons. J. Phys. Chem. B 2018, 122, 770–779. [Google Scholar] [CrossRef] [PubMed] [Green Version]
  38. Jorgensen, W.L.; Maxwell, D.S.; Tirado-Rives, J. Development and Testing of the OPLS All-Atom Force Field on Conformational Energetics and Properties of Organic Liquids. J. Am. Chem. Soc. 1996, 118, 11225–11236. [Google Scholar] [CrossRef]
  39. Caleman, C.; van Maaren, P.J.; Hong, M.; Hub, J.S.; Costa, L.T.; van der Spoel, D. Force field benchmark of organic liquids: Density, enthalpy of vaporization, heat capacities, surface tension, isothermal compressibility, volumetric expansion coefficient, and dielectric constant. J. Chem. Theory Comput. 2012, 8, 61–74. [Google Scholar] [CrossRef]
  40. Bayly, C.I.; Cieplak, P.; Cornell, W.D.; Kollman, P.A. A well-behaved electrostatic potential based method using charge restraints for deriving atomic charges: The RESP model. J. Phys. Chem. 1993, 97, 10269–10280. [Google Scholar] [CrossRef]
  41. Cornell, W.D.; Cieplak, P.; Bayly, C.I.; Kollman, P.A. Application of RESP Charges To Calculate Conformational Energies, Hydrogen Bond Energies, and Free Energies of Solvation. J. Am. Chem. Soc. 1993, 115, 9620–9631. [Google Scholar] [CrossRef]
  42. Martínez, L.; Andrade, R.; Birgin, E.G.; Martínez, J.M. PACKMOL: A package for building initial configurations for molecular dynamics simulations. J. Comput. Chem. 2009, 30, 2157–2164. [Google Scholar] [CrossRef] [PubMed]
  43. Frisch, M.J.; Trucks, G.W.; Schlegel, H.B.; Scuseria, G.E.; Robb, M.A.; Cheeseman, J.R.; Montgomery, J.A., Jr.; Vreven, T.; Kudin, K.N.; Burant, J.C.; et al. Gaussian 03, Revision C.02; Gaussian, Inc.: Wallingford, CT, USA, 2004. [Google Scholar]
  44. Wang, J.; Wolf, R.M.; Caldwell, J.W.; Kollman, P.A.; Case, D.A. Development and testing of a general amber force field. J. Comput. Chem. 2004, 25, 1157–1174. [Google Scholar] [CrossRef]
  45. Wang, J.; Wang, W.; Kollman, P.A.; Case, D.A. Automatic atom type and bond type perception in molecular mechanical calculations. J. Mol. Graph. Model. 2006, 25, 247–260. [Google Scholar] [CrossRef] [PubMed]
  46. Hess, B.; Kutzner, C.; Van Der Spoel, D.; Lindahl, E. GROMACS 4: Algorithms for highly efficient load-balanced, and scalable molecular simulation. J. Chem. Theory Comput. 2008, 4, 435–447. [Google Scholar] [CrossRef] [Green Version]
  47. Pronk, S.; Páll, S.; Schulz, R.; Larsson, P.; Bjelkmar, P.; Apostolov, R.; Shirts, M.R.; Smith, J.C.; Kasson, P.M.; van der Spoel, D.; et al. GROMACS 4.5: A high-throughput and highly parallel open source molecular simulation toolkit. Bioinformatics 2013, 29, 845–854. [Google Scholar] [CrossRef] [PubMed]
  48. Darden, T.; York, D.; Pedersen, L. Particle mesh Ewald An Nlog(N) method for Ewald sums in large systems. J. Chem. Phys. 1993, 98, 10089–10092. [Google Scholar] [CrossRef] [Green Version]
  49. Essmann, U.; Perera, L.; Berkowitz, M.L.; Darden, H.L.T.; Pedersen, L.G. A smooth particle mesh Ewald method. J. Chem. Phys. 1995, 103, 8577–8596. [Google Scholar] [CrossRef] [Green Version]
  50. Nose, S. A molecular dynamics method for simulations in the canonical ensemble. Mol. Phys. 1984, 52, 255–268. [Google Scholar] [CrossRef]
  51. Nose, S. A unified formulation of the constant temperature molecular dynamics methods. J. Chem. Phys. 1984, 81, 511–519. [Google Scholar] [CrossRef] [Green Version]
  52. Hoover, W.G. Canonical dynamics: Equilibrium phase-space distributions. Phys. Rev. 1985, 31, 1695–1697. [Google Scholar] [CrossRef] [Green Version]
  53. Parrinello, M.; Rahman, A. Polymorphic transitions in single crystals: A new molecular dynamics. J. Appl. Phys. 1981, 52, 7182–7190. [Google Scholar] [CrossRef]
  54. Humphrey, W.; Dalke, A.; Schulten, K. VMD: Visual molecular dynamics. J. Mol. Graph. 1996, 14, 33–38. [Google Scholar] [CrossRef]
  55. Polyethylene glycol [MAK Value Documentation, 1998]. In The MAK-Collection for Occupational Health and Safety; American Cancer Society: Atlanta, GA, USA, 2012; pp. 248–270.
  56. Allen, M.P.; Tildesley, D.J. Computer Simulation of Liquids; Clarendon Press: New York, NY, USA, 1989. [Google Scholar]
  57. Tsujita, Y.; Nose, T.; Hata, T. Thermodynamic Properties of Poly(ethylene glycol) and Poly(tetrahydrofuran). I. P—V—T Relations and Internal Pressure. Polym. J. 1973, 5, 201–207. [Google Scholar] [CrossRef] [Green Version]
  58. Koizumi, N.; Hanai, T. Dielectric Properties of Polyethylene Glycols: Dielectric Relaxation in Solid State (Special Issue on Polymer Chemistry, I). Bull. Inst. Chem. Res. Kyoto Univ. 1964, 42, 115–127. [Google Scholar]
  59. Neumann, M. Dipole moment fluctuation formulas in computer simulations of polar systems. Mol. Phys. 1983, 50, 841–858. [Google Scholar] [CrossRef]
  60. Diddens, D.; Heuer, A. Simulation Study of the Lithium Ion Transport Mechanism in Ternary Polymer Electrolytes: The Critical Role of the Segmental Mobility. J. Phys. Chem. B 2014, 118, 1113–1125. [Google Scholar] [CrossRef]
  61. Mao, G.; Saboungi, M.L.; Price, D.L.; Armand, M.B.; Howells, W.S. Structure of Liquid PEO-LiTFSI Electrolyte. Phys. Rev. Lett. 2000, 84, 5536. [Google Scholar] [CrossRef]
  62. Timachova, K.; Watanabe, H.; Balsara, N.P. Effect of molecular weight and salt concentration on ion transport and the transference number in polymer electrolytes. Macromolecules 2015, 48, 7882–7888. [Google Scholar] [CrossRef] [Green Version]
Figure 1. (a) The PEO dimethyl ether molecule as representative PEO used in this work, where n (degree of polymerization) was 10 or 20. The atomic partial charges (unit: e-) for PEO with (b) default OPLS, (c) Barbosa model, and (d) reparametrized OPLSR models. The blue and black numbers denote the partial charges for carbon and hydrogen atoms, respectively, in the CH2 or CH3 groups.
Polymers 13 01131 g001
Figure 2. Comparison of experimental (cyan diamonds, data from [55]) and computed densities of pure PEO system as functions of temperature. The black data is the results of the OPLS model; the red and green curves correspond to the Barbosa and OPLSR models, respectively. Dashed lines are fitted lines in high- and low-temperature ranges for determining the transition temperature as shown later in Figure 3.
Polymers 13 01131 g002
Figure 3. Heat capacity profiles of pure PEO systems in three different force fields as functions of temperature. The profile with black circles is the result of the OPLS model, and the ones with red squares and green triangles are the results of the Barbosa and the OPLSR models, respectively. The orange dashed line denotes the experimental Tm value from [55].
Polymers 13 01131 g003
Figure 4. Thermal expansion coefficient of pure PEO system versus temperature. The black circles are the results of the OPLS model, the red squares and green triangles correspond to the Barbosa and the OPLSR models, respectively. The cyan and orange dashed lines represent the experimental results in low and high-temperature regions, respectively. The dotted lines are the guiding sigmoidal curves fitted with logistic functions.
Polymers 13 01131 g004
Figure 5. The schematics of 1 LiTFSI molecule and 1 PEO polymer chain (DP = 16). PEO polymer is illustrated using ball-and-stick representation, TFSI molecule is presented via stick model, and the pink sphere represents a lithium ion. The Li+ coordinating oxygen atoms of PEO are emphasized with larger size for their partial charges reduced by 0.55. The atom color codes are: oxygen in red, carbon in turquoise, nitrogen in blue, sulfur in yellow and fluoride in fluorine.
Polymers 13 01131 g005
Figure 6. The radial distribution functions between pairs of (a) Li+-Li+, (b) TFSI -TFSI and (c) Li+-PEO oxygen for PEO/LiTFSI system at 333 K in different force fields.
Polymers 13 01131 g006
Figure 7. The mean square displacement profiles of Li+ in PEO/LiTFSI SPE system at 333 K for three tested force fields.
Polymers 13 01131 g007
Figure 8. Arrhenius plot of D L i + versus inverted temperature for PEO/LiTFSI SPE systems in OPLS, full-charged OPLSR and charge-rescaled OPLSR force fields, along with the corresponding Li+ diffusion activation energy E a values.
Polymers 13 01131 g008
Figure 9. Li+ diffusion coefficients for PEO/LiTFSI SPE systems in charge-rescaled OPLSR force field with O/Li+ ratio of 50, 25 and 16, corresponding to [Li+]/[EO] = 0.02, 0.04, and 0.0625, respectively, in comparison with experimental data from [62].
Polymers 13 01131 g009
Table 1. Thermal expansion coefficient α P above and below Tm and the dielectric constant evaluated at 298 K for the PEO melt systems in the three tested force fields compared with experimental values (data from [57,58]).
α P (T > Tm) (K 1 ) α P (T < Tm) (K 1 )Dielectric Constant (F/m)
Experiment [57,58] 7 × 10 4 2 × 10 4 9–11
OPLS 1.04 ( ± 0.07 ) × 10 3 3.65 ( ± 0.84 ) × 10 4 4.36 ( ± 0.11 )
Barbosa 1.85 ( ± 0.21 ) × 10 4 8.08 ( ± 0.67 )
OPLSR 8.43 ( ± 0.45 ) × 10 4 2.23 ( ± 0.22 ) × 10 4 9.94 ( ± 0.56 )
Table 2. Diffusion coefficient for Li+, and lithium transference number (t L i ) for PEO/LiTFSI SPE system in OPLS, full-charged OPLSR and charge-rescaled OPLSR force fields compared with experimental data. The reported experimental values were measured for the PEO/LiTFSI SPE systems with O/Li+ ratio of 18 at 333 K (data from [11]) and 16.7 at 363K (data from [62]).
Unit: cm 2 s 1 363 K333 K298 Kt L i + (333 K)
Experiment 1.40 × 10 7 3.68 × 10 8 0.24
OPLS 5.27 × 10 9 1.70 × 10 9 5.85 × 10 10 0.41
OPLSR ( f p o l y = 1.0 , f i o n = 1.0 ) 2.78 × 10 9 1.34 × 10 9 2.43 × 10 10 0.363
OPLSR ( f p o l y = 0.8 , f i o n = 0.55 ) 5.76 × 10 8 2.40 × 10 8 3.73 × 10 9 0.215
Publisher’s Note: MDPI stays neutral with regard to jurisdictional claims in published maps and institutional affiliations.

