
Effect of Polymer Viscosity and Polymerization Kinetics on the Electrical Response of Carbon Nanotube Yarn/Vinyl Ester Monofilament Composites


Abstract
1. Introduction
2. Materials and Methods
2.1. Materials
2.2. Specimen Preparation and Setup
2.3. Rheometry and Gel Time Measurements
2.4. Electron Microscopy
3. Results
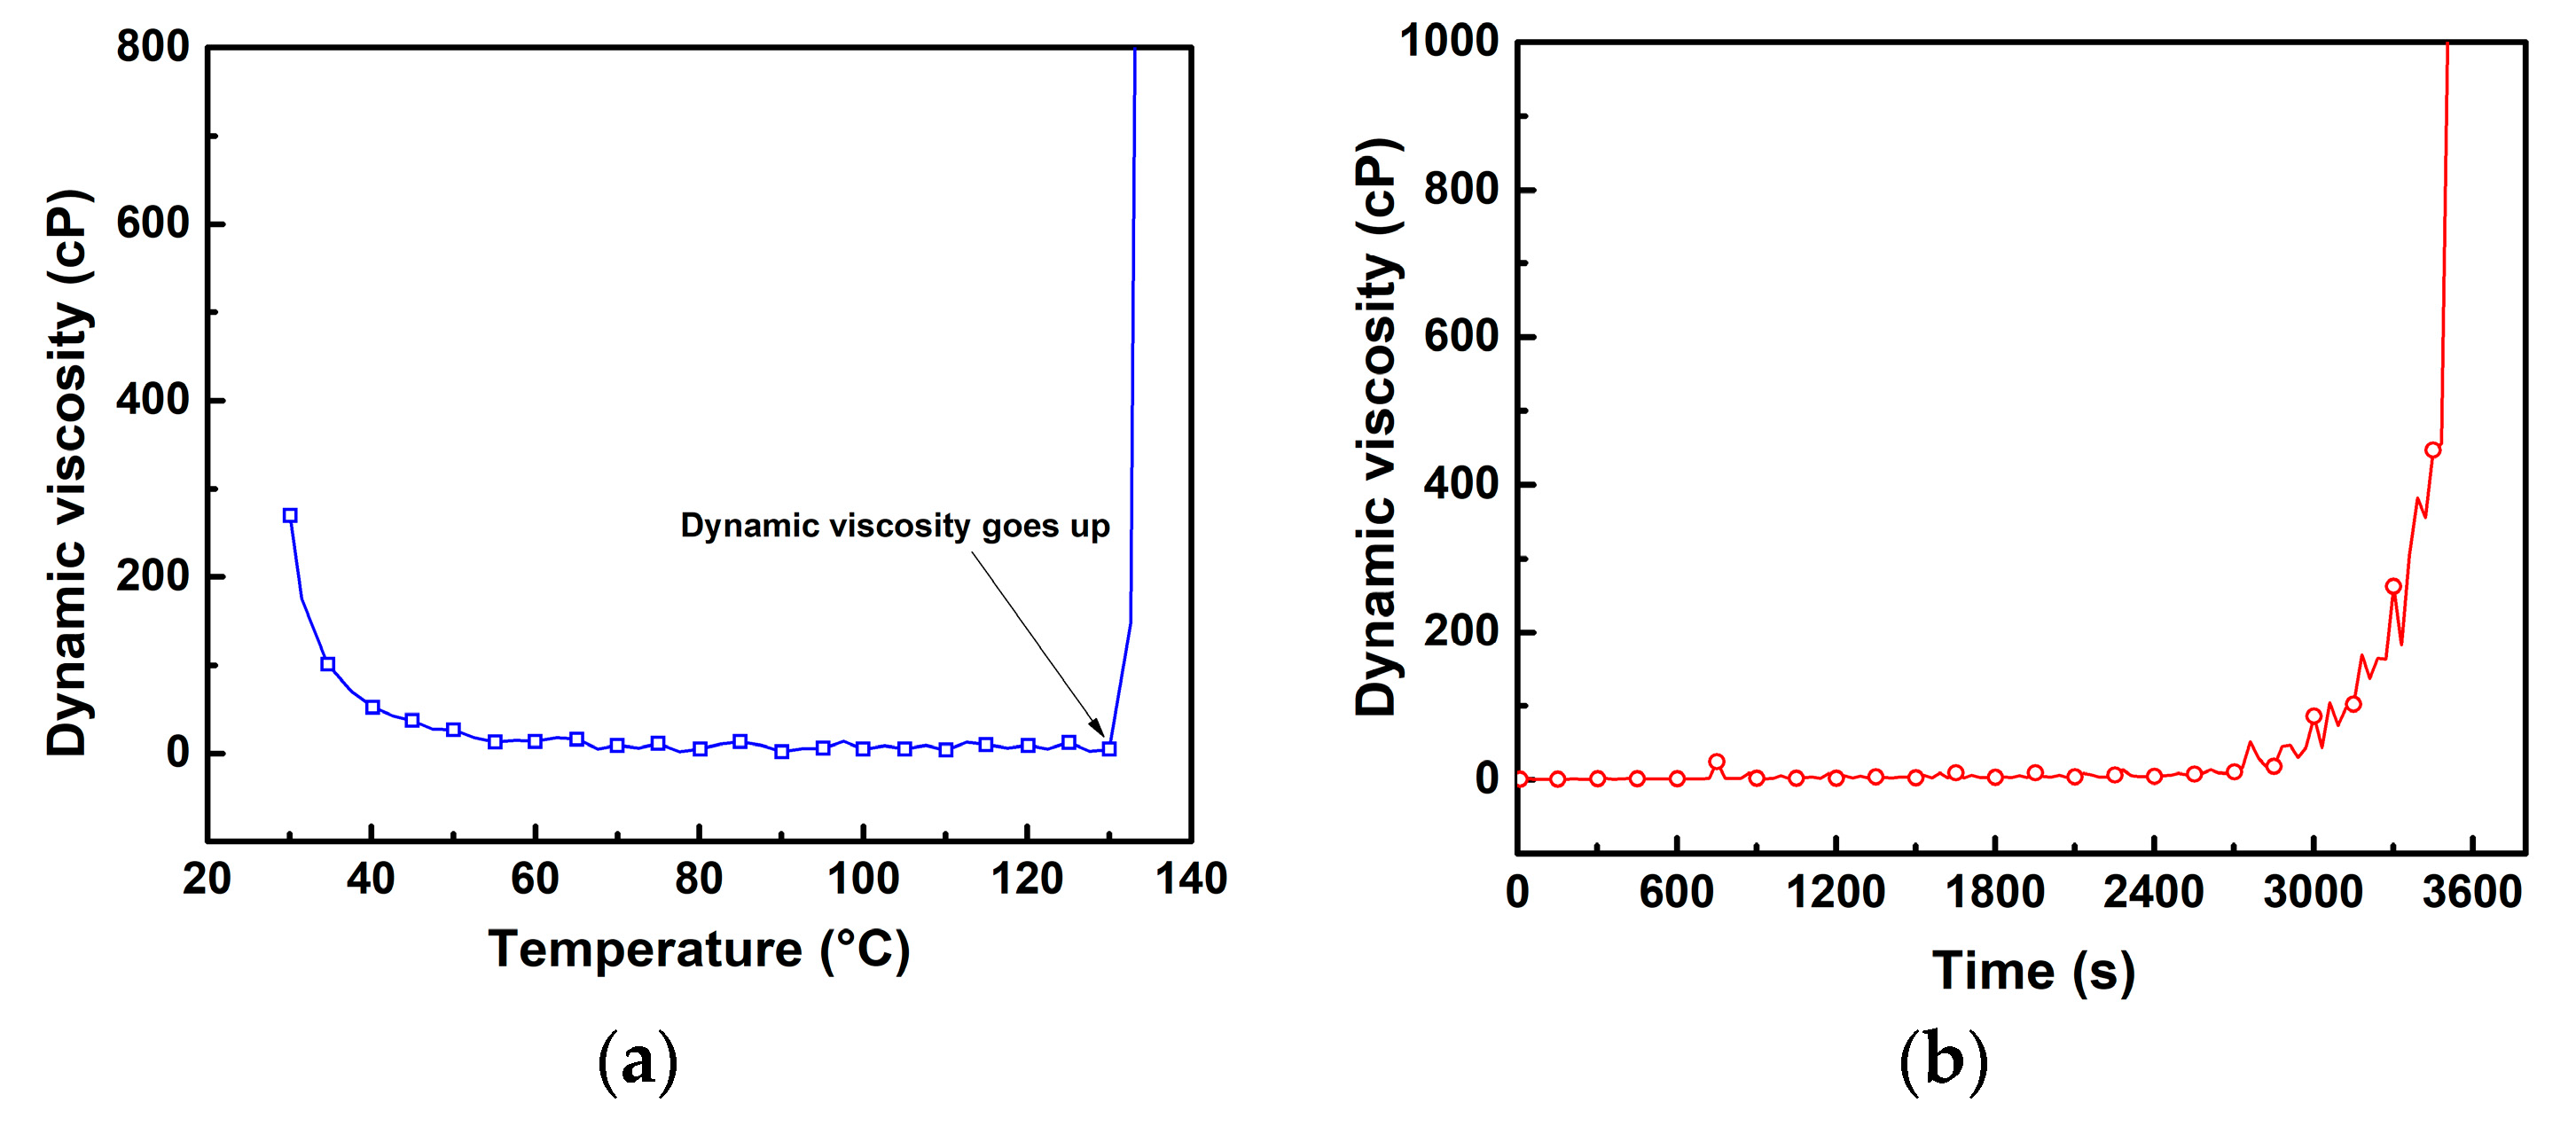
3.1. Curing Characterization of Vinyl Ester Resin
3.2. Effect of Polymerization Kinetics on the Electrical Response of the CNTY
3.3. Effect of Polymer Viscosity on the Electrical Response of the CNTY
3.4. Scanning Electron Microscopy
4. Conclusions
Supplementary Materials
Author Contributions
Funding
Data Availability Statement
Acknowledgments
Conflicts of Interest
References
- Duong, H.M. Post-Spinning Treatment to Carbon Nanotube Fibers. Carbon Nanotube Fibers and Yarns; Elsevier: Amsterdam, The Netherlands, 2020; pp. 103–134. [Google Scholar] [CrossRef]
- Can-Ortiz, A.; Abot, J.L.; Avilés, F. Electrical characterization of carbon-based fibers and their application for sensing relaxation- induced piezoresistivity in polymer composites. Carbon 2019, 145, 119–130. [Google Scholar] [CrossRef]
- Fernández–Toribio, J.C.; Iñiguez-Rábago, A.; Vilá, J.; González, C.; Ridruejo, A.; Vilatela, J.J. A composite fabrication sensor based on electrochemical doping of carbon nanotube yarns. Adv. Funct. Mater. 2016, 26, 7139–7147. [Google Scholar] [CrossRef]
- Sui, X.; Greenfeld, I.; Cohen, H.; Zhang, X.; Li, Q.; Wagner, H.D. Multilevel composite using carbon nanotube fibers (CNTF). Compos. Sci. Technol. 2016, 137, 35–43. [Google Scholar] [CrossRef]
- Zhao, H.; Zhang, Y.; Bradford, P.D.; Zhou, Q.; Jia, Q.; Yuan, F.G.; Zhu, Y. Carbon nanotube yarn strain sensors. Nanotechnology 2010, 21, 305502. [Google Scholar] [CrossRef]
- Koziol, K.; Vilatela, J.J.; Moisala, A.; Motta, M.; Cunniff, P.; Sennett, M.; Windle, A.H. High performance carbon nanotube fiber. Science 2007, 318, 1892–1895. [Google Scholar] [CrossRef]
- Le, H.; Brodeur, G.E.; Cen-Puc, M.; Ku-Herrera, J.J.; Avilés, F.; Abot, J.L. Piezoresistive and thermopiezoresistive response of constrained carbon nanotube yarns towards their use as integrated sensors. In Proceedings of the 31st American Society for Composites Conference, Williamsburg, VA, USA, 19–22 September 2016; pp. 1227–1249. [Google Scholar]
- Balam, A.; Cen-Puc, M.; Rodriguez-Uicab, O.; Abot, J.L.; Avilés, F. Cyclic thermoresistivity of freestanding and polymer embedded carbon nanotube yarns. Adv. Eng. Mater. 2020, 22, 2000220. [Google Scholar] [CrossRef]
- Miao, M. Yarn spun from carbon nanotube forest: Production, structure, properties and applications. Particuology 2013, 11, 378–393. [Google Scholar] [CrossRef]
- Behabtu, N.; Young, C.C.; Tsentalovich, D.E.; Kleinerman, O.; Wang, X.; Ma, A.W.; Bengio, E.A.; Waarbeek, R.F.T.; de Jong, J.J.; Hoogerwerf, R.E. Strong, light, multifunctional fibers of carbon nanotubes with ultrahigh conductivity. Science 2013, 339, 182–186. [Google Scholar] [CrossRef]
- Abot, J.L.; Alosh, T.; Belay, K. Strain dependence of electrical resistance in carbon nanotube yarns. Carbon 2014, 70, 95–102. [Google Scholar] [CrossRef]
- Anike, J.C.; Abot, J.L. Sensors Based on CNTY Yarns, Carbon Nanotube Fibers and Yarns; Elsevier: Amsterdam, The Netherlands, 2020; pp. 213–241. [Google Scholar]
- Cai, L.; Song, L.; Luan, P.; Zhang, Q.; Zhang, N.; Giao, Q.; Zhao, D.; Zhang, X.; Tu, M.; Yang, F. Super stretchable, transparent carbon nanotube based capacitive strain sensors for human motion detection. Sci. Rep. 2013, 3, 1–9. [Google Scholar] [CrossRef]
- Hu, N.; Fukunaga, H.; Atobe, S.; Liu, Y.; Li, J. Piezoresistive strain sensors made from carbon nanotubes based polymer composites. Sensors 2011, 11, 10691–10723. [Google Scholar] [CrossRef]
- Berger, C.; Poncharal, P.; Yi, Y.; de Heer, W. Ballistic conduction in multiwalled carbon nanotubes. J. Nanosci. Nanotechnol. 2003, 3, 171–177. [Google Scholar] [CrossRef]
- Kang, I.; Schulz, M.J.; Kim, J.H.; Shanov, V.; Shi, D. A carbon nanotube strain sensor for structural health monitoring. Smart Mater. Struct. 2006, 15, 737. [Google Scholar] [CrossRef]
- Qi, P.; Vermesh, O.; Grecu, M.; Javey, A.; Wang, Q.; Dai, H.; Peng, S.; Cho, K. Toward large arrays of multiplex functionalized carbon nanotube sensors for highly sensitive and selective molecular detection. Nano Lett. 2003, 3, 347–351. [Google Scholar] [CrossRef]
- Li, C.; Thostenson, E.T.; Chou, T.-W. Sensors and actuators based on carbon nanotubes and their composites: A review. Compos. Sci. Technol. 2008, 68, 1227–1249. [Google Scholar] [CrossRef]
- Ryu, S.; Lee, P.; Chou, J.B.; Xu, R.; Zhao, R.; Hart, A.J.; Kim, S.G. Extremely elastic wearable carbon nanotube fiber strain sensor for monitoring of human motion. ACS Nano 2015, 9, 5929–5936. [Google Scholar] [CrossRef] [PubMed]
- Zhu, Z.; Garcia-Gancedo, L.; Flewitt, A.J.; Moussy, F.; Li, Y.; Milne, W.I. Design of carbon nanotube fiber microelectrode for glucose biosensing. J. Chem. Tech. Biotechnol. 2012, 87, 256–262. [Google Scholar] [CrossRef]
- Foroughi, J.; Spinks, G.M.; Aziz, S.; Mirabedini, A.; Jeiranikhameneh, A.; Wallace, G.G.; Kozlov, M.E.; Baughman, R.H. Knitted carbon nanotube sheath/spandex core elastomeric yarns for artificial muscles and strain sensing. ACS Nano 2016, 10, 9129–9135. [Google Scholar] [CrossRef] [PubMed]
- Suzuki, K.; Yataka, K.; Okumiya, Y.; Sakakibara, S.; Sako, K.; Mimura, H.; Inoue, Y. Rapid response, widely stretchable sensor of aligned MWCNT/elastomer composites for human motion detection. ACS Sens. 2016, 1, 817–825. [Google Scholar] [CrossRef]
- Muñoz, E.; Dalton, A.B.; Collins, S.; Kozlov, M.; Razal, J.; Coleman, J.N.; Kim, B.G.; Ebron, V.H.; Selvidge, M.; Ferraris, J.P. Multifunctional carbon nanotube composites fibers. Adv. Eng. Mater. 2004, 6, 801–804. [Google Scholar] [CrossRef]
- Shang, Y.; He, X.; Wang, C.; Zhu, L.; Peng, Q.; Shi, E.; Wu, S.; Yang, Y.; Xu, W.; Wang, R.; et al. Large deformation, multifunctional artificial muscles based on single walled carbon nanotube yarns. Adv. Eng. Mater. 2015, 17, 14–20. [Google Scholar] [CrossRef]
- Sun, Y.; Li, S.; Shang, Y.; Hou, S.; Chang, S.; Shi, E.; Cao, A. Highly stretchable carbon nanotube fibers with tunable and stable light emission. Adv. Eng. Mater. 2019, 21, 1801126. [Google Scholar] [CrossRef]
- Miao, M.; McDonnell, J.; Vuckovic, L.; Hawkins, S.C. Poisson´s ratio and porosity of carbon nanotube dry spun yarns. Carbon 2010, 48, 2802–2811. [Google Scholar] [CrossRef]
- Miao, M. The role of twist in dry spun carbon nanotube yarns. Carbon 2016, 96, 819–826. [Google Scholar] [CrossRef]
- Anike, J.C.; Belay, K.; Abot, J.L. Effect of twist on the electromechanical properties of carbon nanotube yarns. Carbon 2019, 142, 491–503. [Google Scholar] [CrossRef]
- Terrones, J.; Elliot, J.A.; Vilatela, J.J.; Windle, A.H. Electric field modulated non ohmic behavior of carbon nanotube fibers in polar liquids. ACS Nano 2014, 8, 8497–8504. [Google Scholar] [CrossRef][Green Version]
- Qiu, J.; Terrones, J.; Vilatela, J.J.; Vickers, M.E.; Elliot, J.A.; Windle, A.H. Liquid infiltration into carbon nanotube fibers: Effect on structure and electrical properties. ACS Nano 2013, 7, 8412–8422. [Google Scholar] [CrossRef]
- Sayago, I.; Santos, H.; Horrillo, M.C.; Aleixandre, M.; Fernández, M.J.; Terrado, E.; Tacchini, I.; Aroz, R.; Maser, W.K.; Benito, A.M. Carbon nanotube networks as gas sensors for NO2 detection. Talanta 2008, 2, 758–764. [Google Scholar] [CrossRef]
- Wang, J. Electroanalysis: An International Journal Devoted to Fundamental and Practical Aspects of Electroanalysis; Wiley-VCH: New York, NY, USA, 2005; pp. 107–115. [Google Scholar]
- Kissa, E. Wetting and wicking. Tex. Res. J. 1996, 66, 660–668. [Google Scholar] [CrossRef]
- Jung, Y.; Kim, T.; Park, C.R. Effect of polymer infiltration on structure and properties of carbon nanotube yarns. Carbon 2015, 88, 60–69. [Google Scholar] [CrossRef]
- Miao, M. Electrical conductivity of pure carbon nanotube yarns. Carbon 2011, 49, 3755–3761. [Google Scholar] [CrossRef]
- ASTM International. Standard Test Method For Gel Time and Peak Exothermic Temperature of Reacting Thermosetting Resins; ASTM D2471-99; ASTM International: West Conshohocken, PA, USA, 1999. [Google Scholar]
- Ashland Global Specialty Chemicals, Derakane Momentum 470-300 Epoxy Vinyl Ester Resin Technical Datasheet. 2011. Available online: https://3.imimg.com/data3/IU/GR/MY-3370540/derakane-momentum-470-300.pdf (accessed on 1 February 2021).
- Odian, G. Principles of Polymerization; John Wiley & Sons Inc.: New York, NY, USA, 2004; p. 102. [Google Scholar]
- Matyjaszewski, K.; Davis, T.P. Handbook of Radical Polymerization; John Wiley & Sons Inc.: New York, NY, USA, 2002. [Google Scholar]
- Guo, Q. Thermosets: Structure, Properties and Applications; Woodhead Publishing: Sawston, UK, 2017; pp. 200–217. [Google Scholar]
- Ram, A. Fundamentals of Polymer Engineering; Springer Science & Business Media: Berlin/Heidelberg, Germany, 1997. [Google Scholar]
- Kuppusamy, R.R.P.; Neogi, S. Influence of curing agents on gelation and exotherm behavior of an unsaturated polyester resin. Bull. Mater. Sci. 2013, 36, 1217–1224. [Google Scholar] [CrossRef]
- Cook, W.D.; Lau, M.; Mehrabi, M.; Dean, K.; Zipper, M. Control of gel time and exotherm behavior during cure of unsaturated polyester resins. Polym. Int. 2001, 50, 129–134. [Google Scholar] [CrossRef]
- Douglas, J.F.; Johnson, H.E.; Granick, S. A simple kinetic model of polymer adsorption and desorption. Science 1993, 262, 2010–2012. [Google Scholar] [CrossRef] [PubMed]
- Crasto, A.; Kim, R. Using carbon fiber piezoresistivity to measure residual stresses in composites. In Proceedings of the 8th American Society for Composites Conference, Cleveland, OH, USA, 19–21 October 1993; pp. 162–173. [Google Scholar]
- Miao, M. Carbon Nanotube Yarn Structures and Properties, Carbon Nanotube Fibers and Yarns; Elsevier: Amsterdam, The Netherlands, 2020; pp. 37–45. [Google Scholar]
- Lu, W.; Zu, M.; Byun, J.H.; Kim, B.S.; Chou, T.-W. State of the art of carbon nanotube fibers: Opportunities and challenges. Adv. Mat. 2012, 24, 1805–1833. [Google Scholar] [CrossRef]
- Cameo Chemicals. Styrene Monomer, Technical Datasheet. Available online: https://cameochemicals.noaa.gov/chemical/4553 (accessed on 1 February 2021).
- Sears, K.; Skourtis, C.; Atkinson, K.; Finn, N.; Humphries, W. Focused ion beam milling of carbon nanotube yarns to study the relationship between structure and strength. Carbon 2010, 48, 4450–4456. [Google Scholar] [CrossRef]


| Component | Low Initiator Concentration | Nominal Initiator Concentration | High Initiator Concentration | |||
|---|---|---|---|---|---|---|
| Mass (g) | Concentration (wt.%) | Mass (g) | Concentration (wt.%) | Mass (g) | Concentration (wt.%) | |
| Derakane | 29.6 | 98.8 | 29.6 | 98.5 | 29.5 | 98.2 |
| CoNap | 0.18 | 0.60 | 0.18 | 0.60 | 0.18 | 0.60 |
| MEKP | 0.18 | 0.60 | 0.27 | 0.90 | 0.36 | 1.20 |
| Viscosity Label | Derakane (g) | Added Styrene (g) | Total Styrene (g) | Total Styrene (wt.%) |
|---|---|---|---|---|
| Nominal | 29.6 | 0.0 | 9.75 | 33 |
| Low | 29.6 | 3.28 | 13.0 | 40 |
| Parameter | MEKP Initiator | ||
|---|---|---|---|
| 0.6 wt.% | 0.9 wt.% | 1.2 wt.% | |
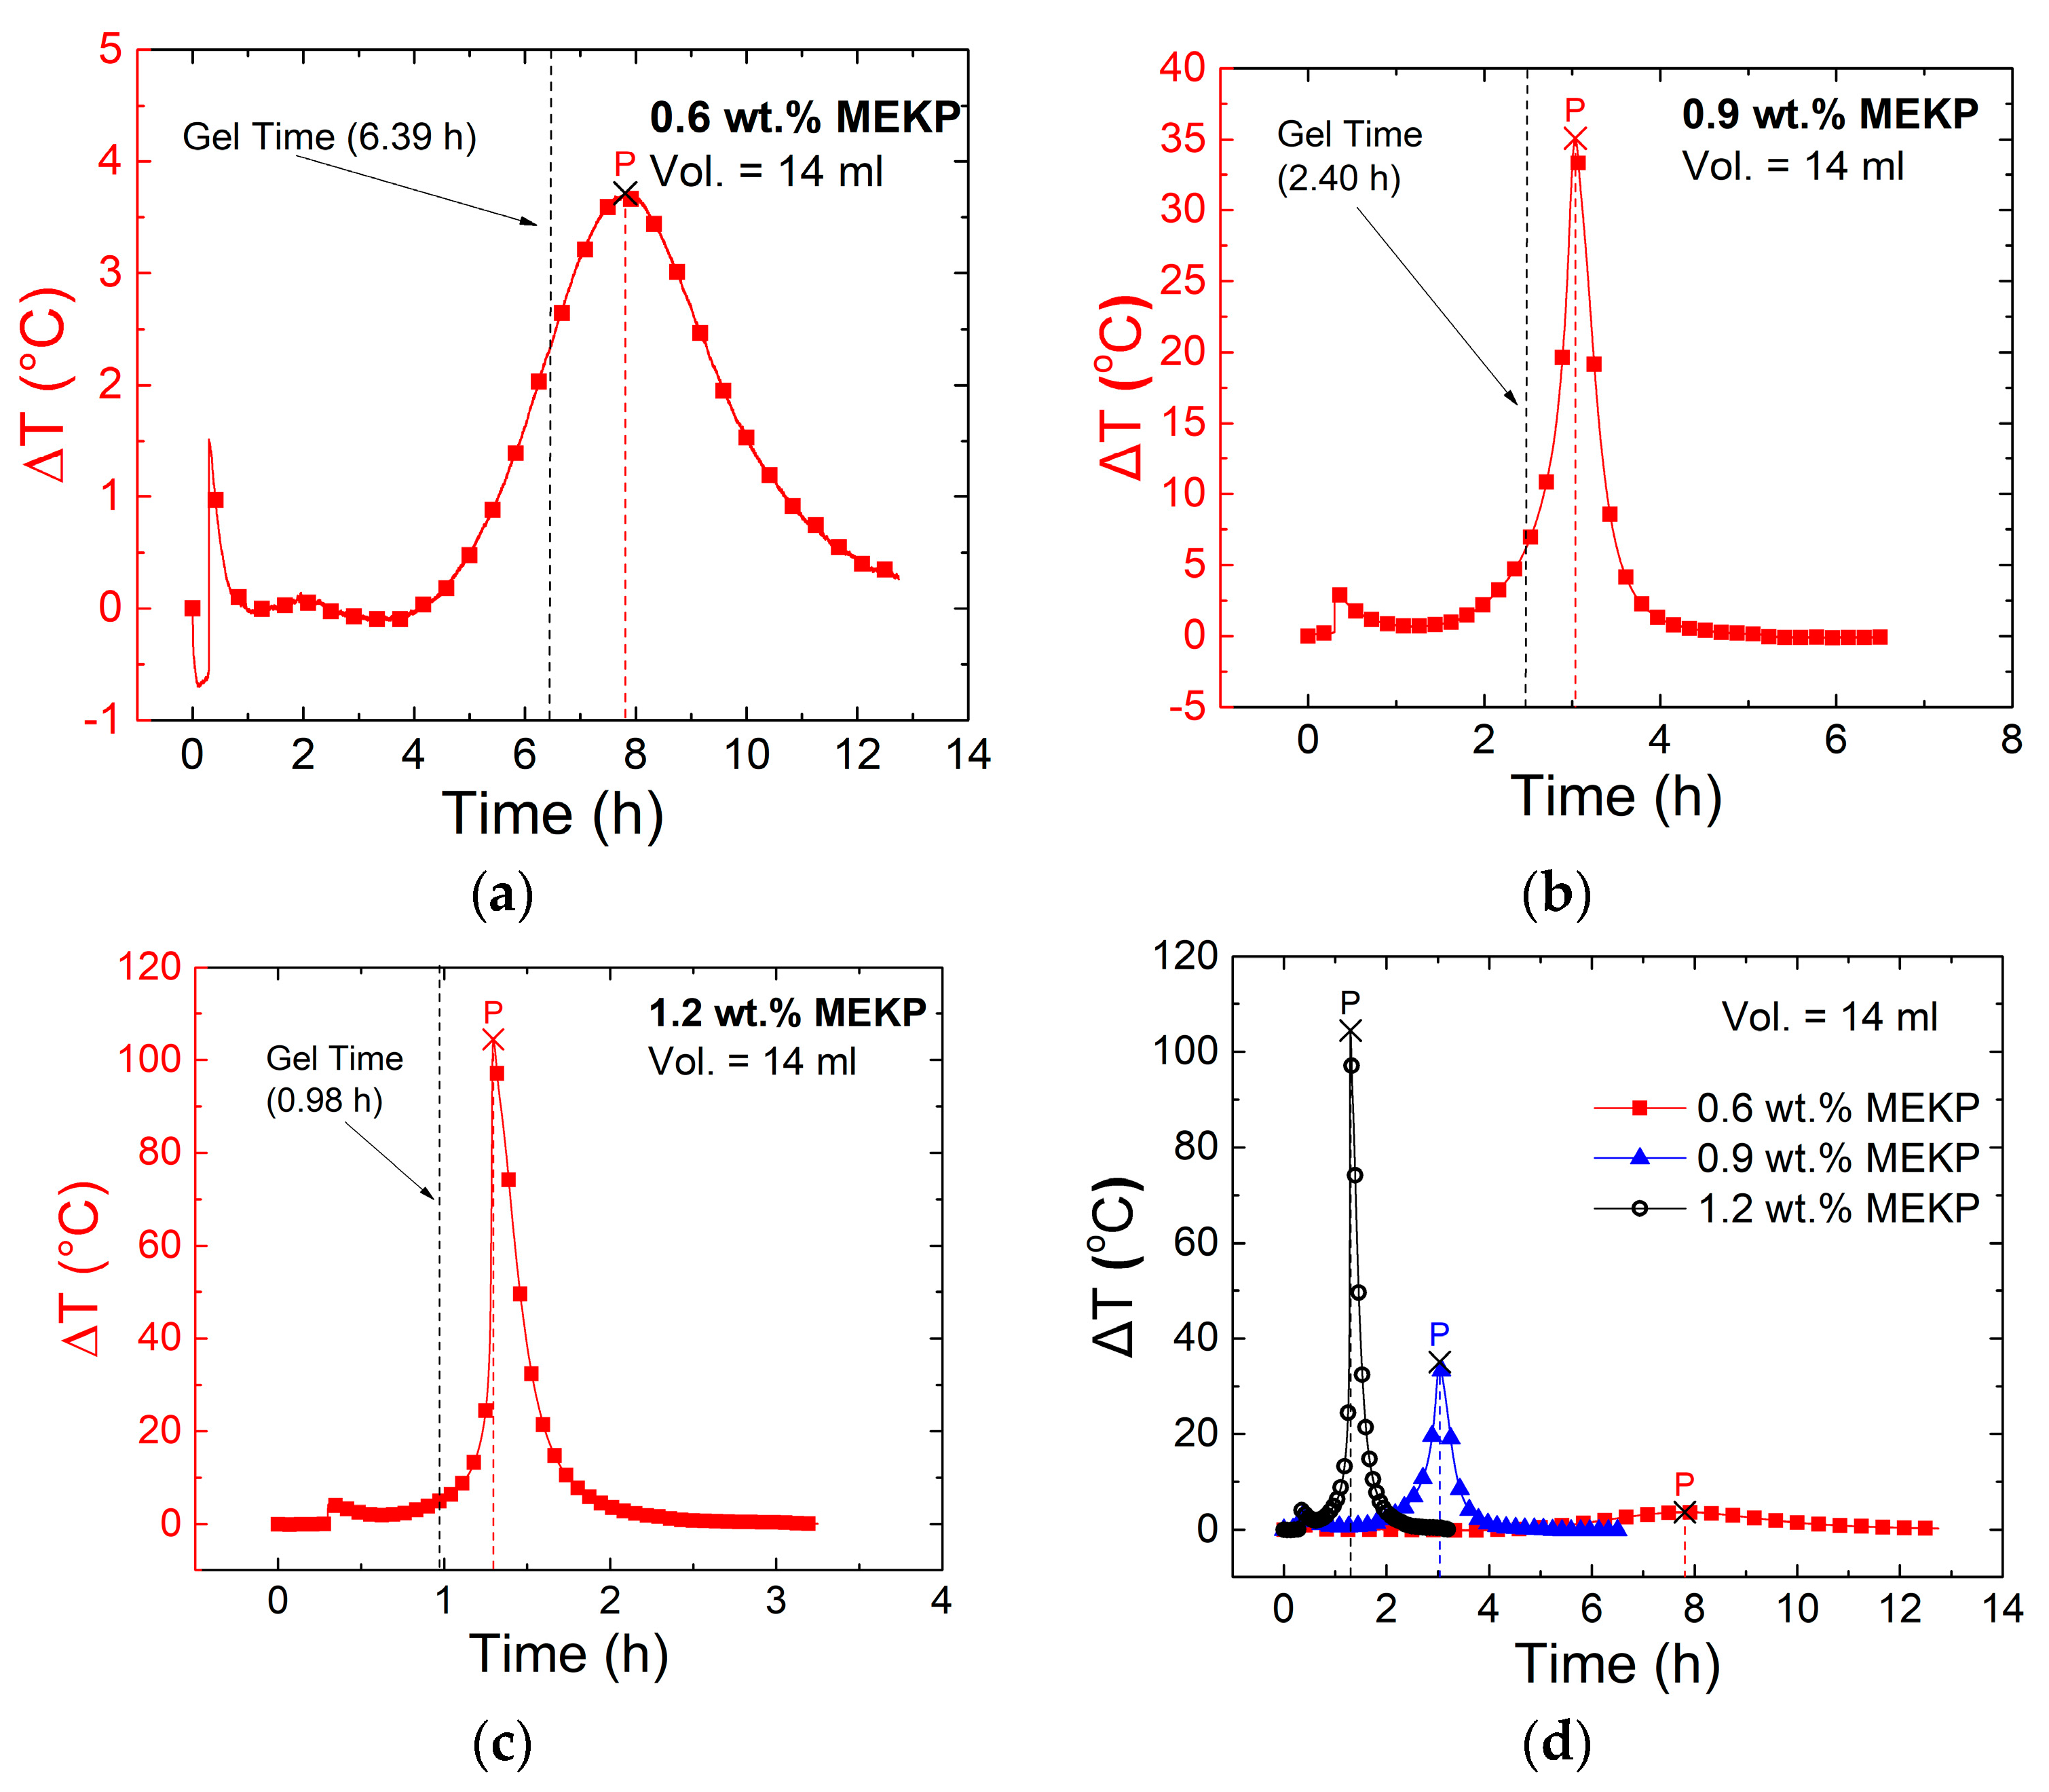
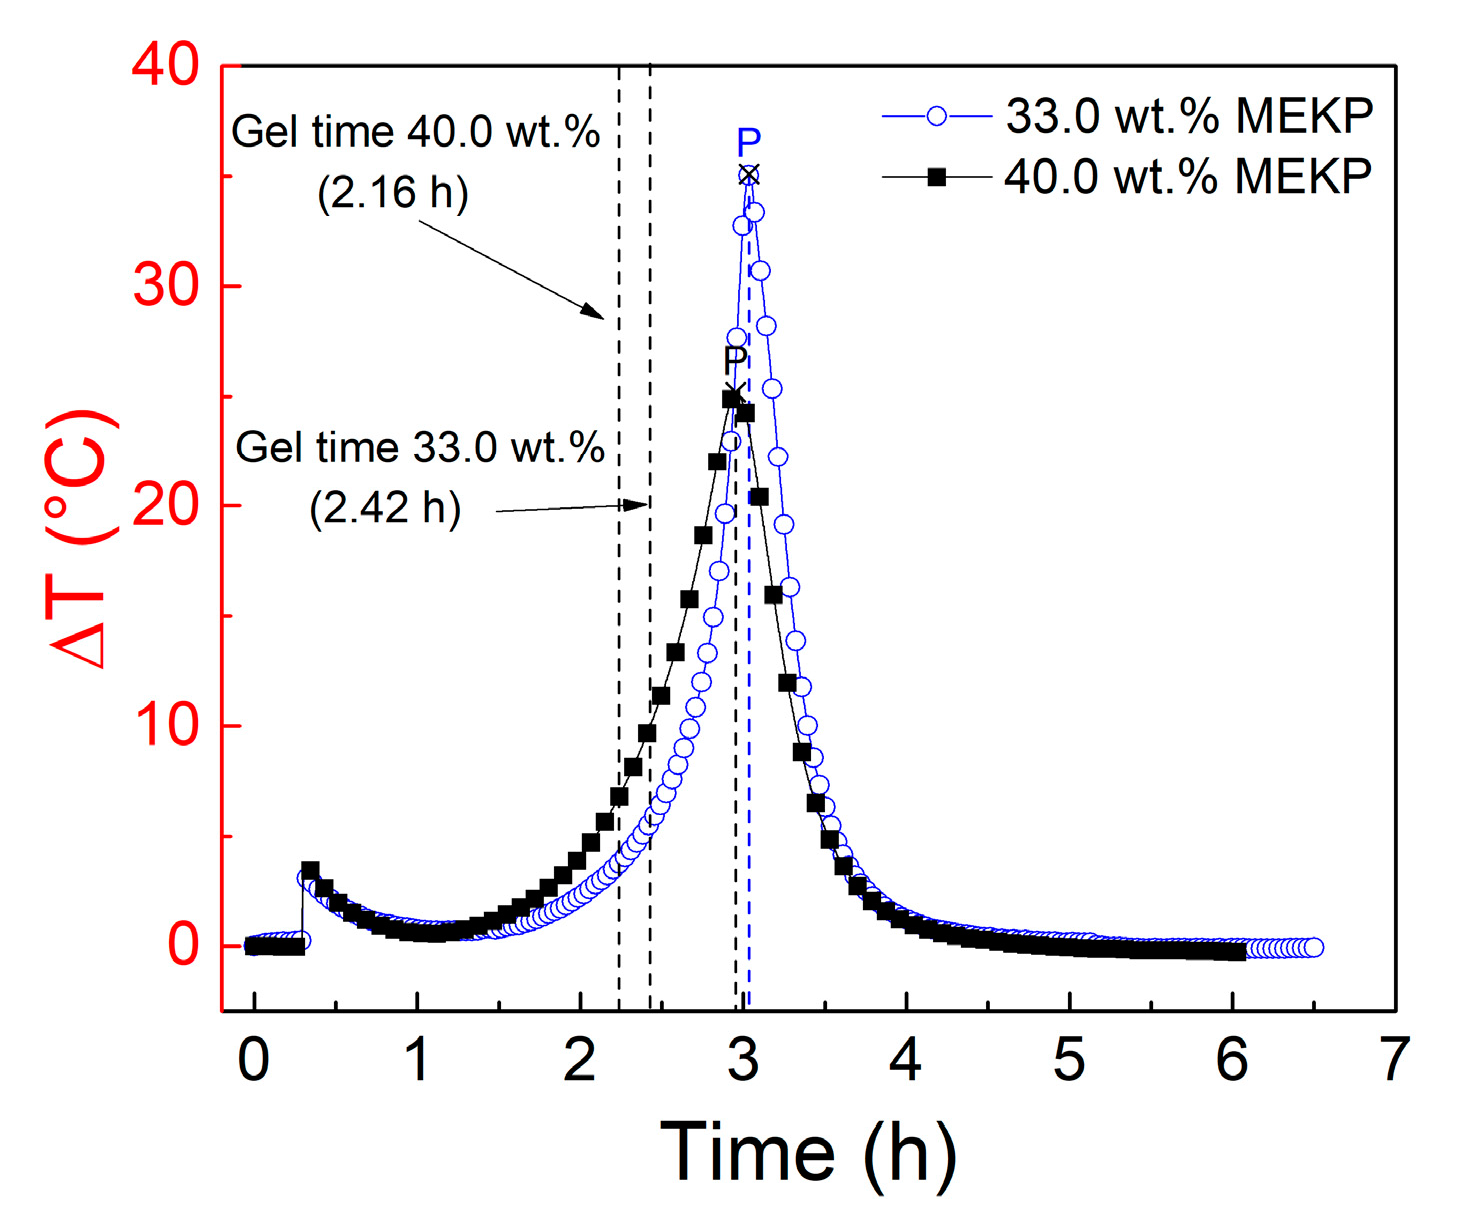
| Gel time (h) | 6.39 ± 0.06 | 2.40 ± 0.01 | 0.98 ± 0.03 |
| ΔT peak position (h) | 7.81 ± 0.39 | 3.0 ± 0.06 | 1.30 ± 0.05 |
| ΔT peak exotherm (°C) | 2.61 ± 1.32 | 35.7 ± 4.60 | 104 ± 2.78 |
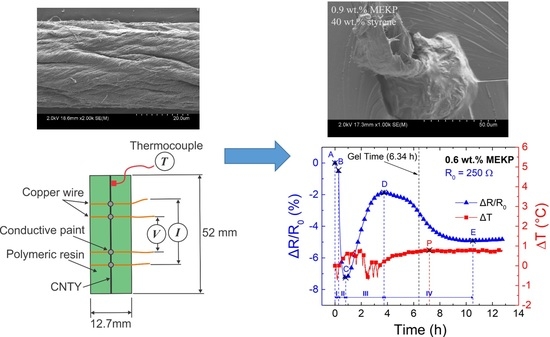
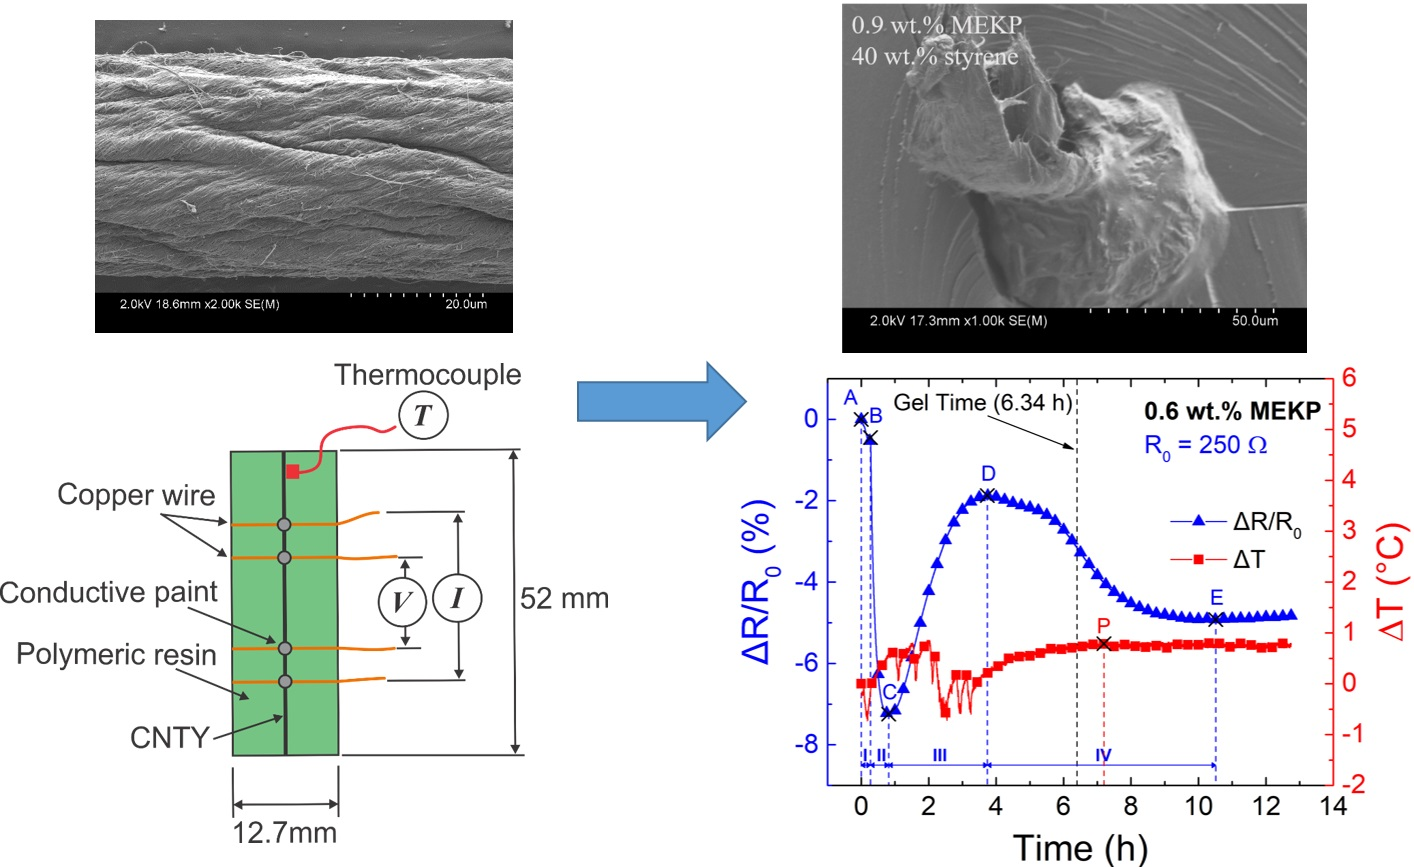
| Zone | Points | Description | Electrical Resistance Change |
|---|---|---|---|
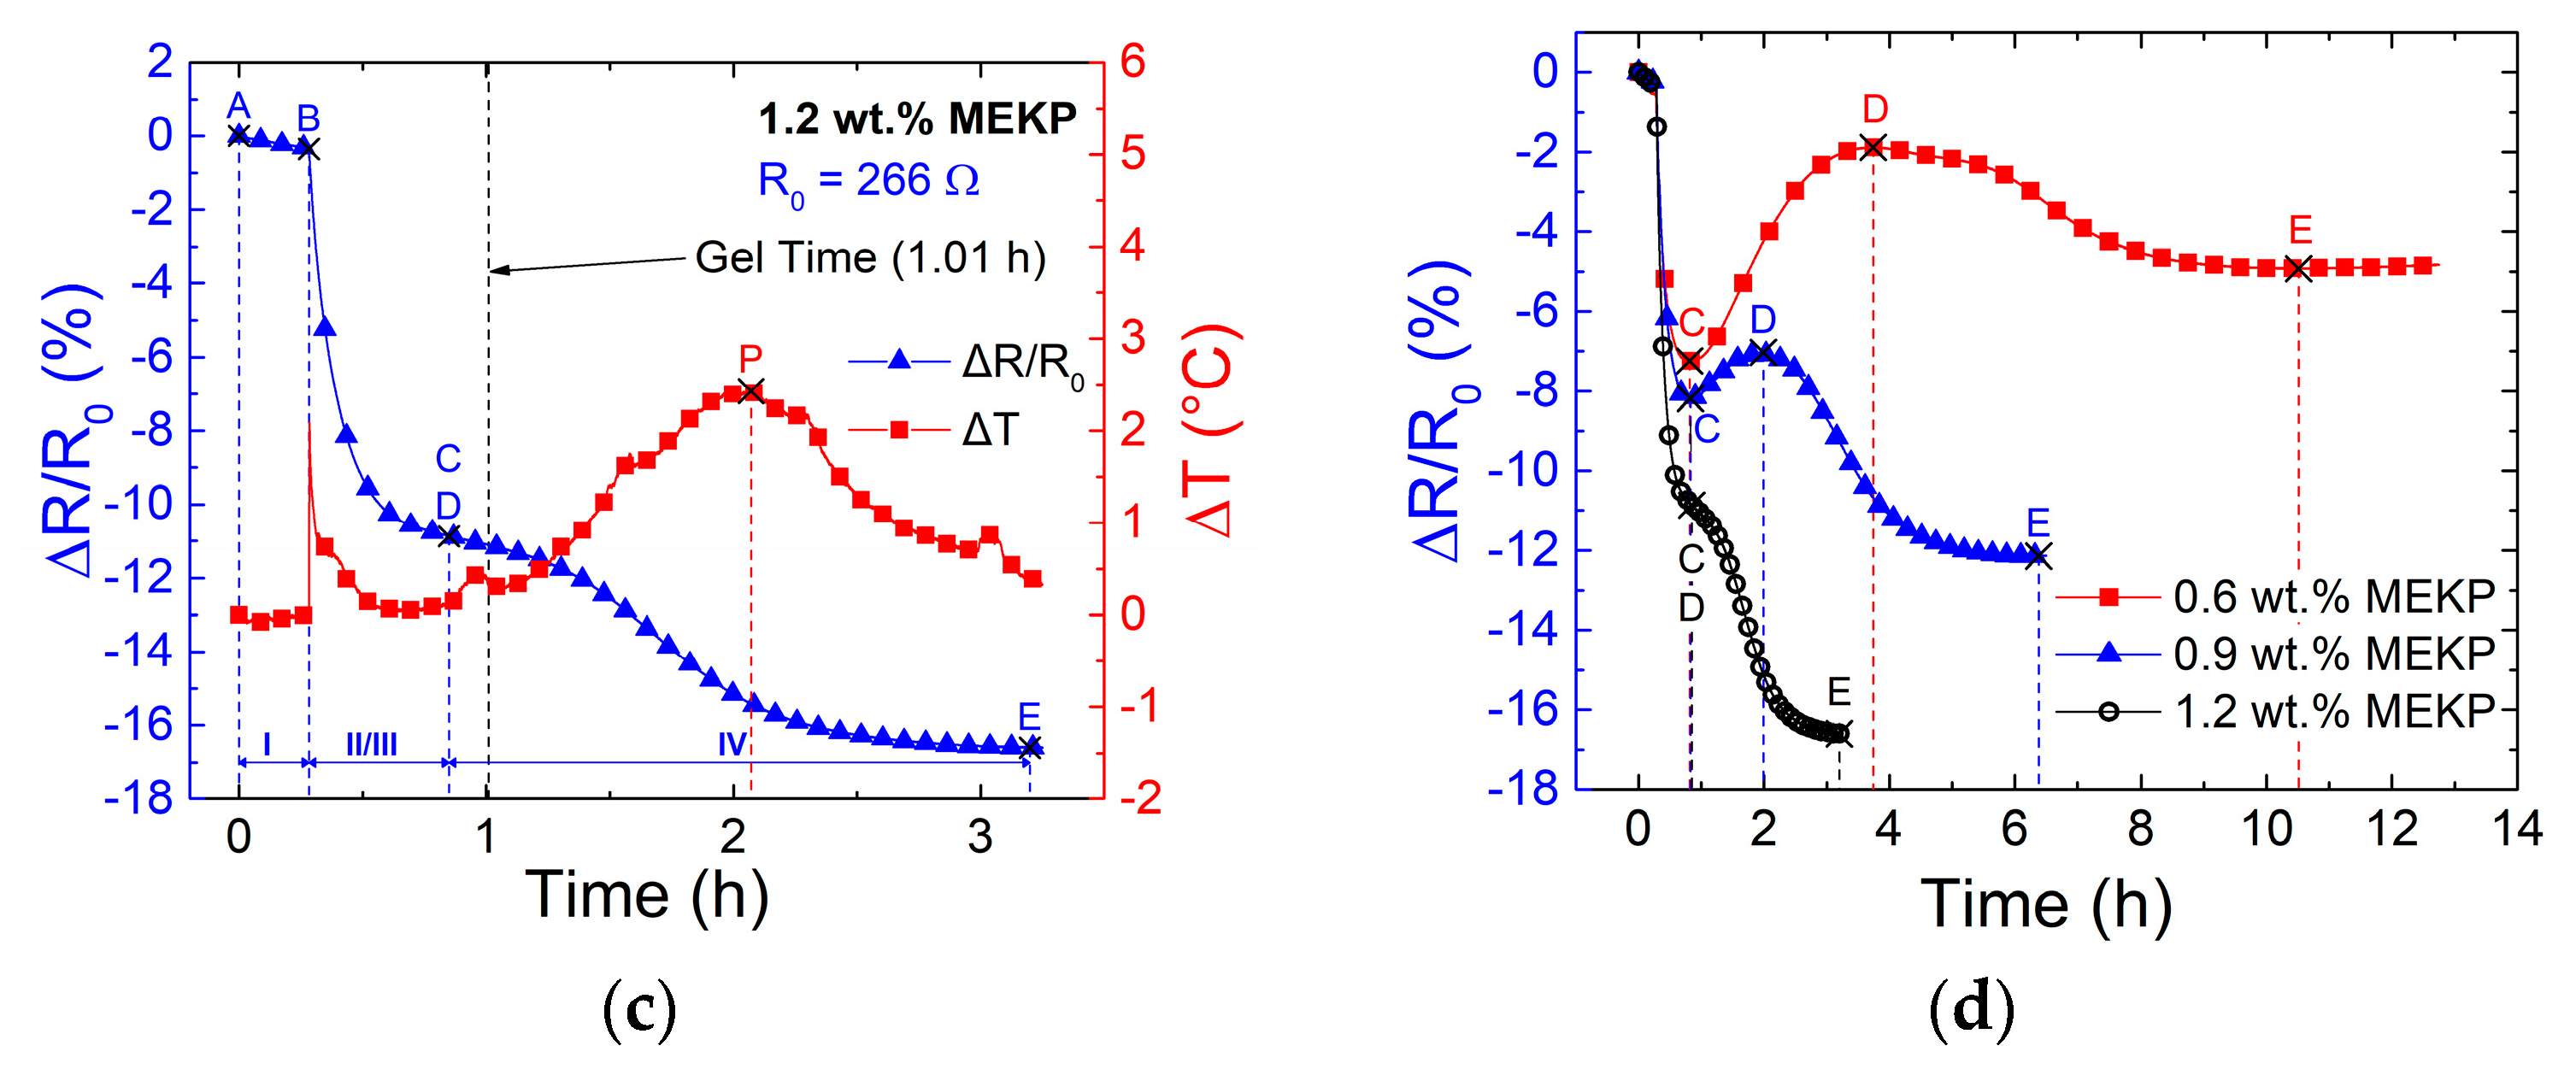
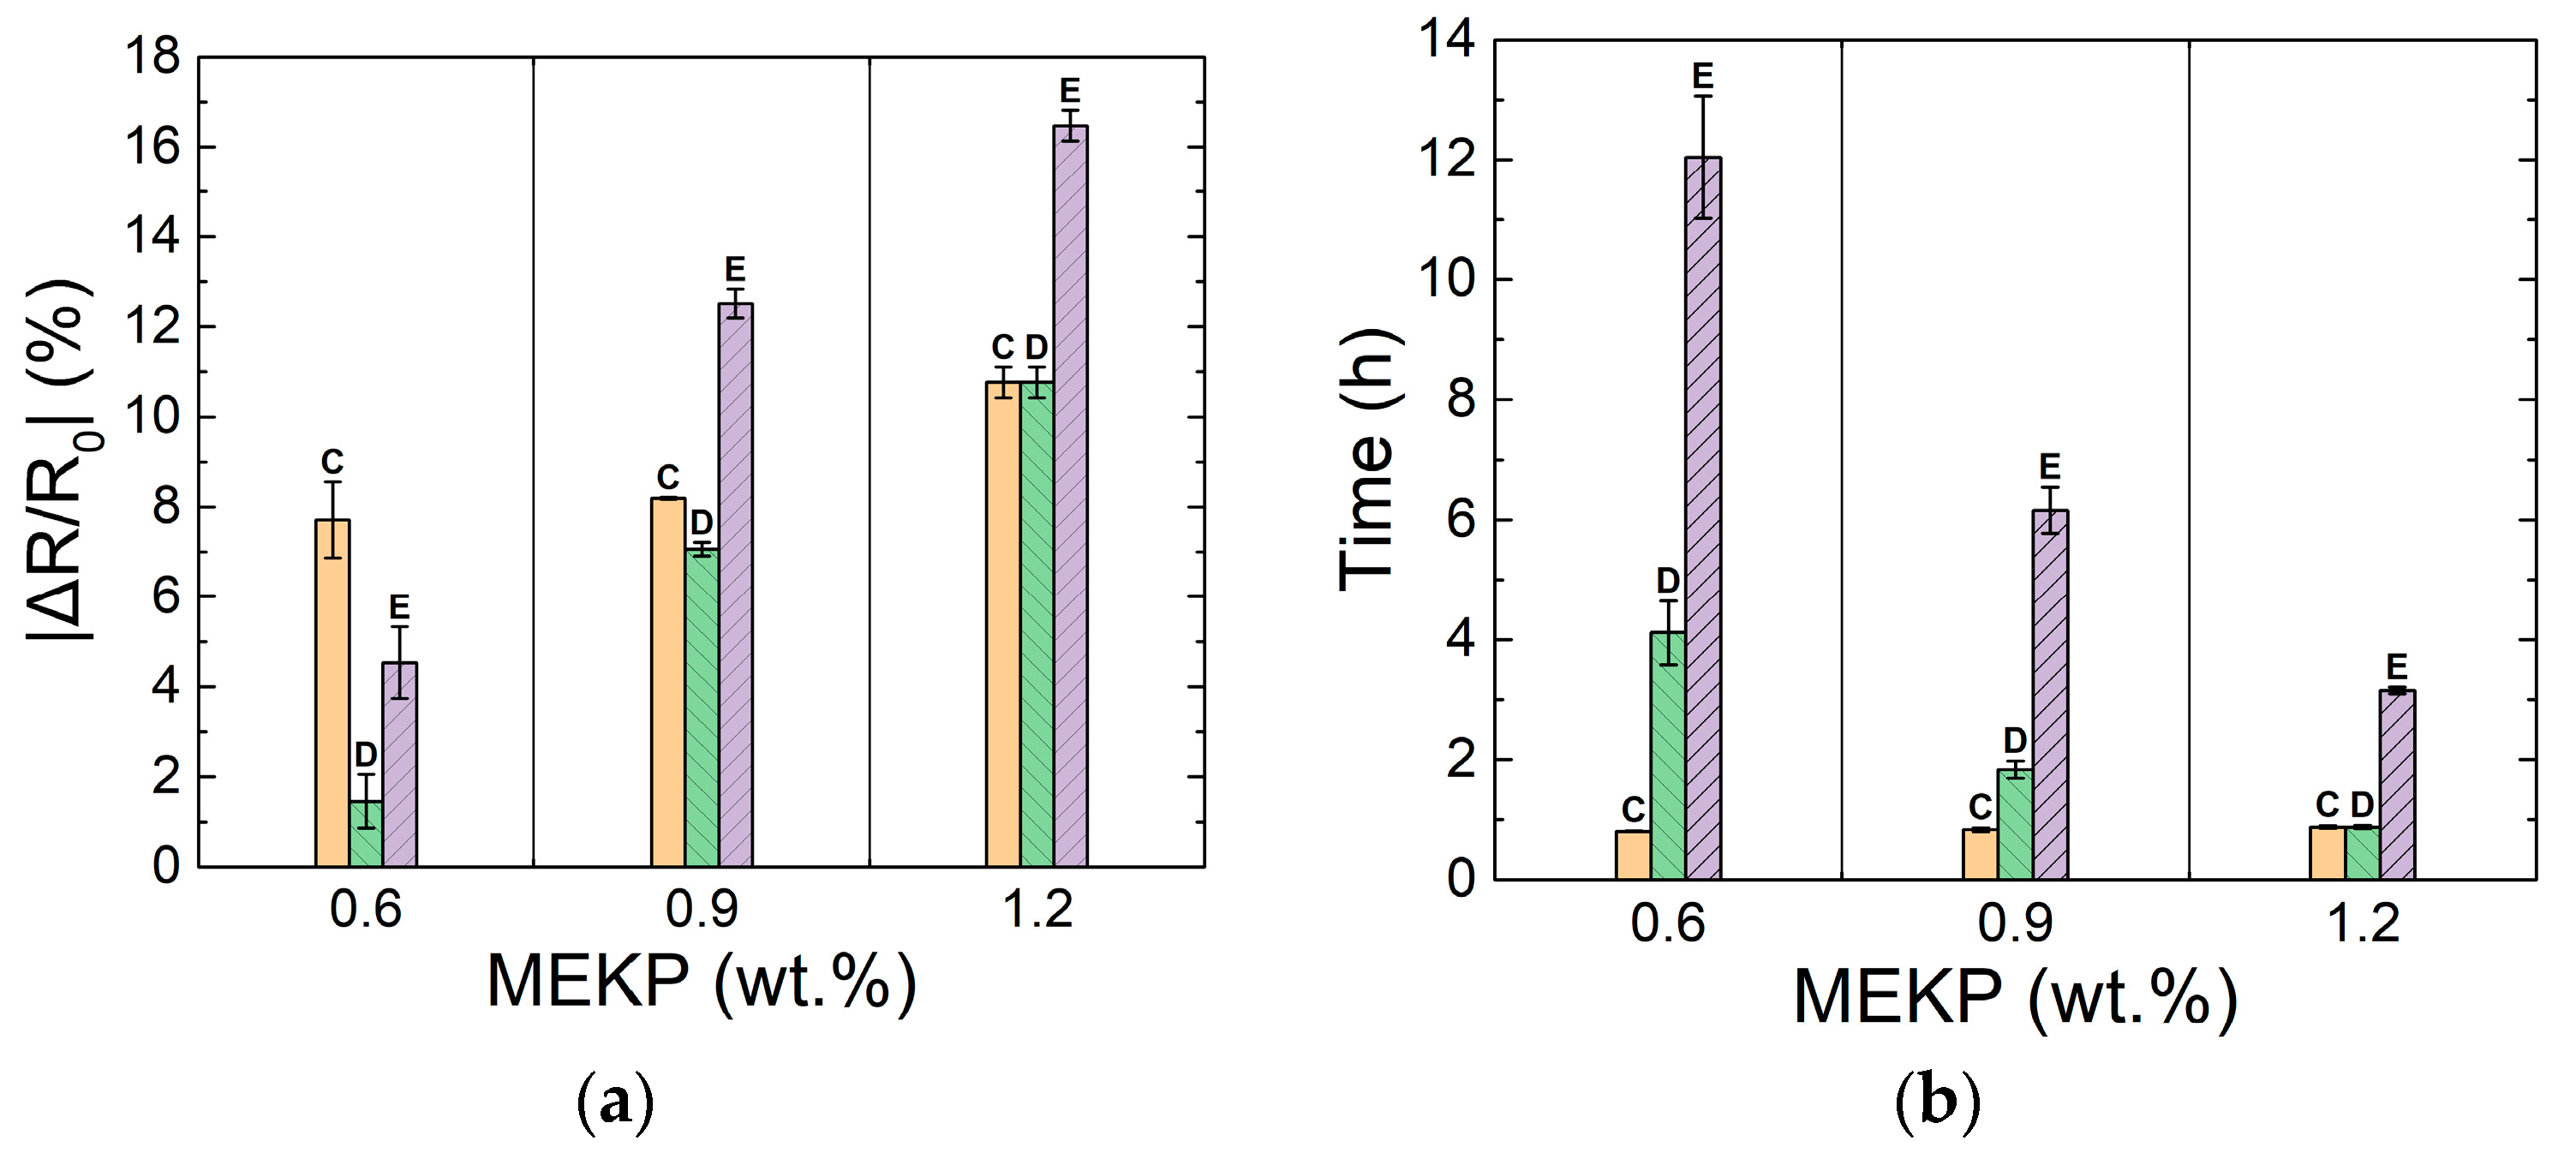
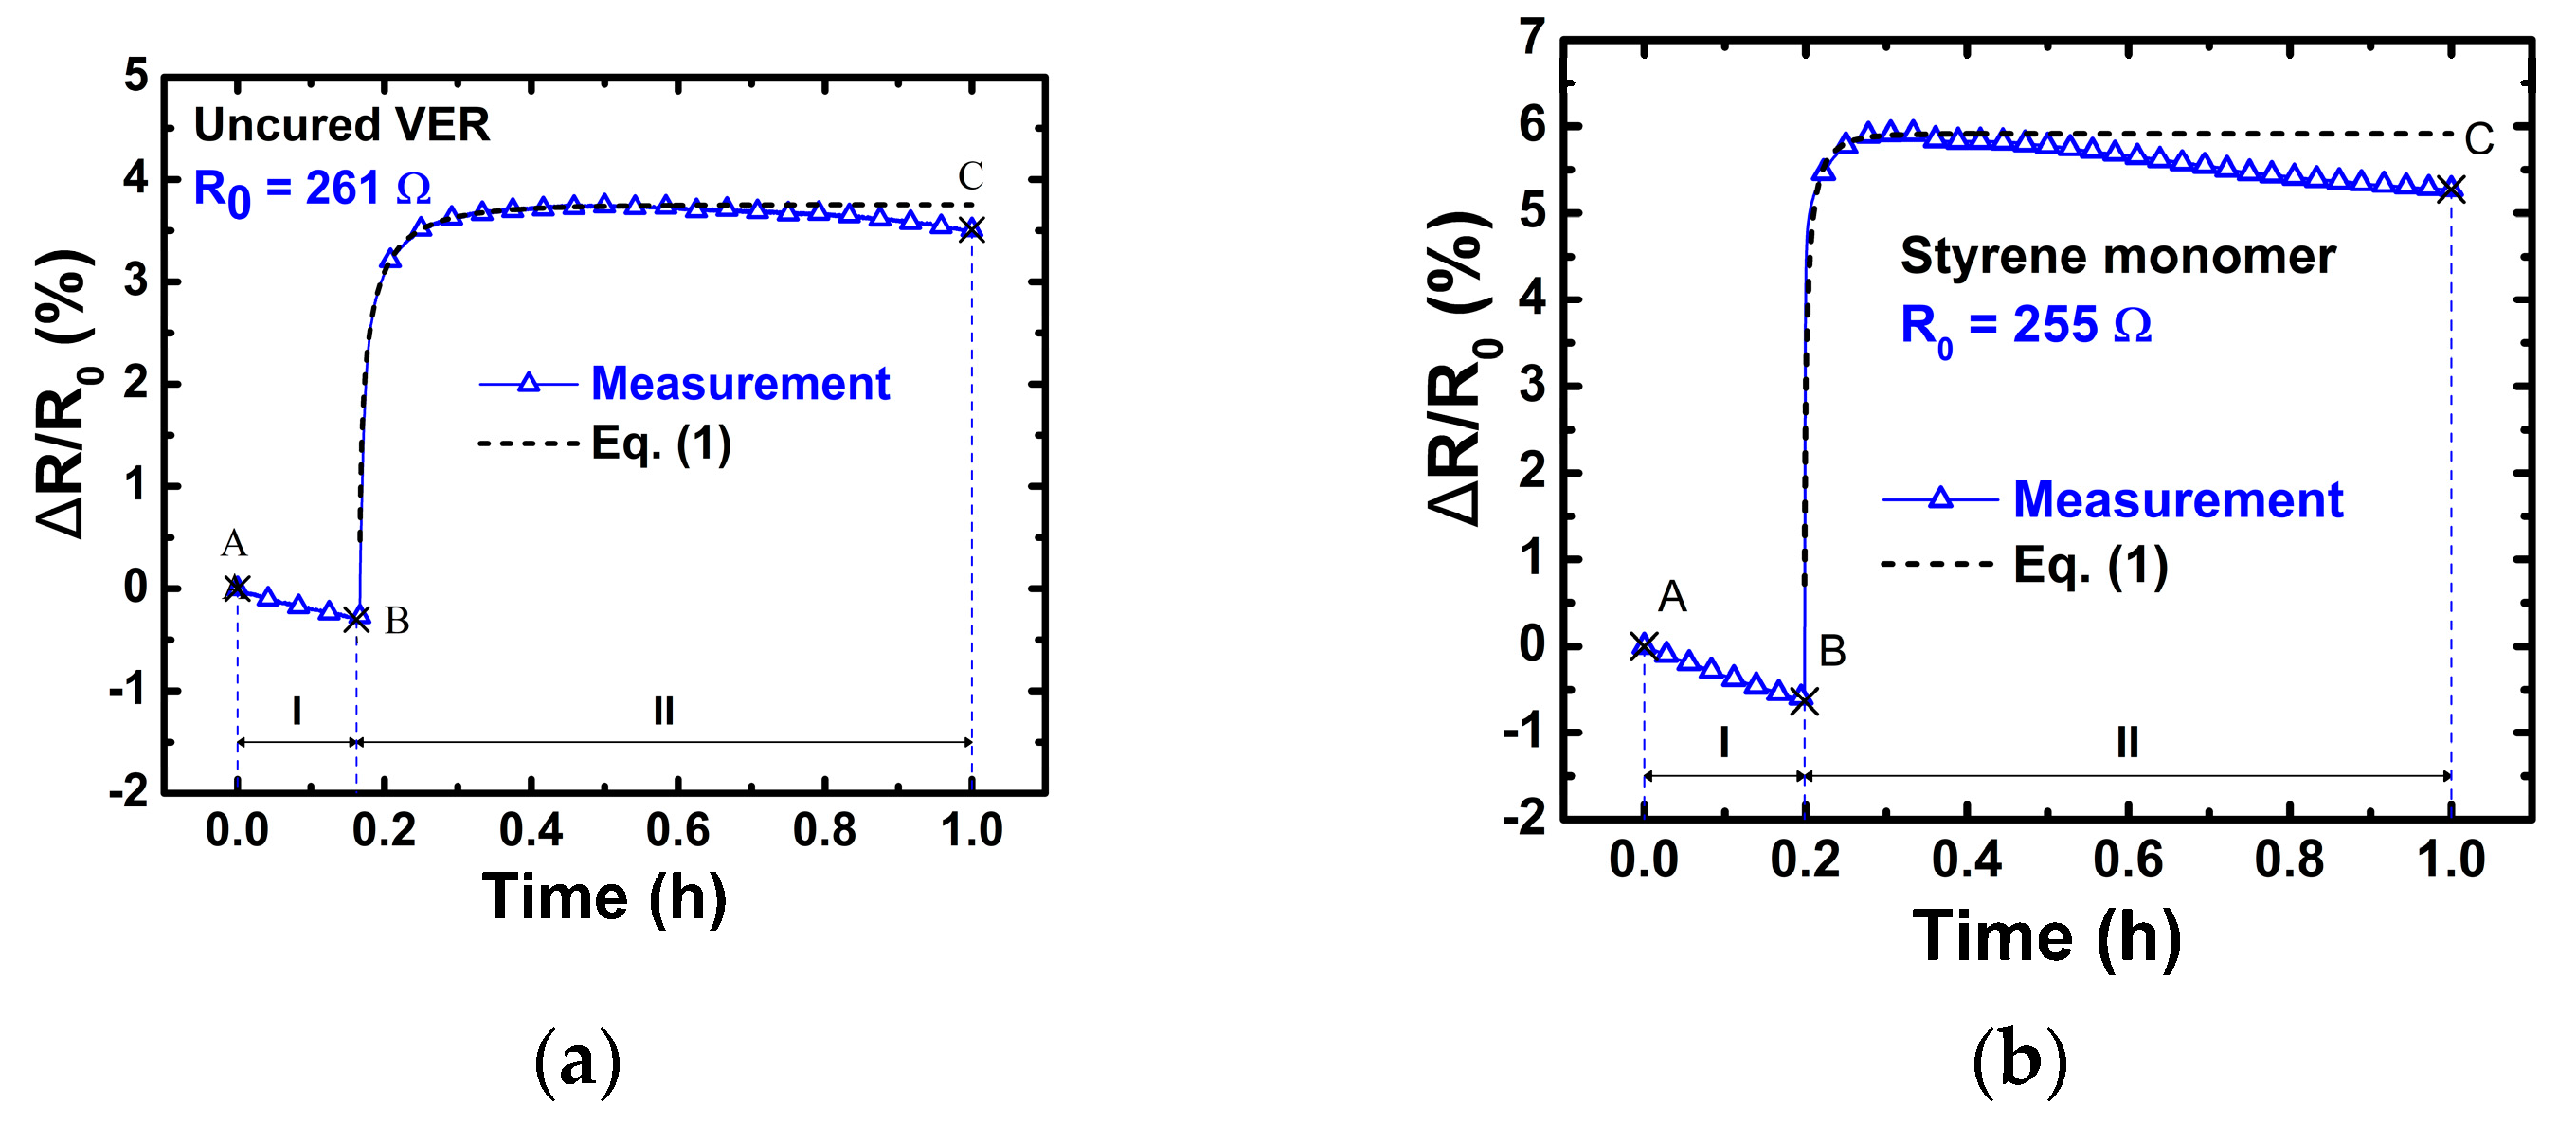
| I | A-B | Dry pre-stressed CNTY within mold. | Small decrease in ΔR/R0, attributed to yarn stress relaxation. |
| II | B-C | Liquid VER mixture poured into mold, wetting and wicking into the CNTY. | Transient decrease in ΔR/R0, attributed to free radical electron donors competing with initial wicking. |
| III | C-D | Viscosity of the liquid reaction mixture increases to point of gelation. | Increase in ΔR/R0, attributed to resin wicking and depletion of free radicals due to monomer conversion. |
| IV | D-E | Gelled VER crosslinks and shrinks around the CNTY. | Decrease in ΔR/R0, attributed to an increase in contact point density and a decrease in yarn porosity from the radial compressive stresses upon shrinking. |
| Immersion Liquid | Dynamic Viscosity (cP) ~25 °C | r2 | (ΔR/R0)Eq (%) | γ (Exponent Factor) | D (cm2/s) ×10−3 |
|---|---|---|---|---|---|
| Uncured VER | 325 | 0.97 | 4.31 | 0.66 | 20.0 |
| Styrene monomer | 0.76 | 0.47 | 5.41 | 0.63 | 195 |
Publisher’s Note: MDPI stays neutral with regard to jurisdictional claims in published maps and institutional affiliations. |
© 2021 by the authors. Licensee MDPI, Basel, Switzerland. This article is an open access article distributed under the terms and conditions of the Creative Commons Attribution (CC BY) license (http://creativecommons.org/licenses/by/4.0/).
Share and Cite
Rodríguez-Uicab, O.; Guay, I.; Abot, J.L.; Avilés, F. Effect of Polymer Viscosity and Polymerization Kinetics on the Electrical Response of Carbon Nanotube Yarn/Vinyl Ester Monofilament Composites. Polymers 2021, 13, 783. https://doi.org/10.3390/polym13050783
Rodríguez-Uicab O, Guay I, Abot JL, Avilés F. Effect of Polymer Viscosity and Polymerization Kinetics on the Electrical Response of Carbon Nanotube Yarn/Vinyl Ester Monofilament Composites. Polymers. 2021; 13(5):783. https://doi.org/10.3390/polym13050783
Chicago/Turabian StyleRodríguez-Uicab, Omar, Ian Guay, Jandro L. Abot, and Francis Avilés. 2021. "Effect of Polymer Viscosity and Polymerization Kinetics on the Electrical Response of Carbon Nanotube Yarn/Vinyl Ester Monofilament Composites" Polymers 13, no. 5: 783. https://doi.org/10.3390/polym13050783
APA StyleRodríguez-Uicab, O., Guay, I., Abot, J. L., & Avilés, F. (2021). Effect of Polymer Viscosity and Polymerization Kinetics on the Electrical Response of Carbon Nanotube Yarn/Vinyl Ester Monofilament Composites. Polymers, 13(5), 783. https://doi.org/10.3390/polym13050783