Processability of Different Polymer Fractions Recovered from Mixed Wastes and Determination of Material Properties for Recycling

 ,
,  , ,
, , 

Abstract

1. Introduction
2. Materials and Methods
2.1. Materials and Sampling
2.2. Methods
C.) Material Characterisation
3. Results
3.1. Total Composition of the Mixed Wastes and Plastic Type Content
3.2. Thermal Material Properties
3.3. Melt Mass Flow Rate
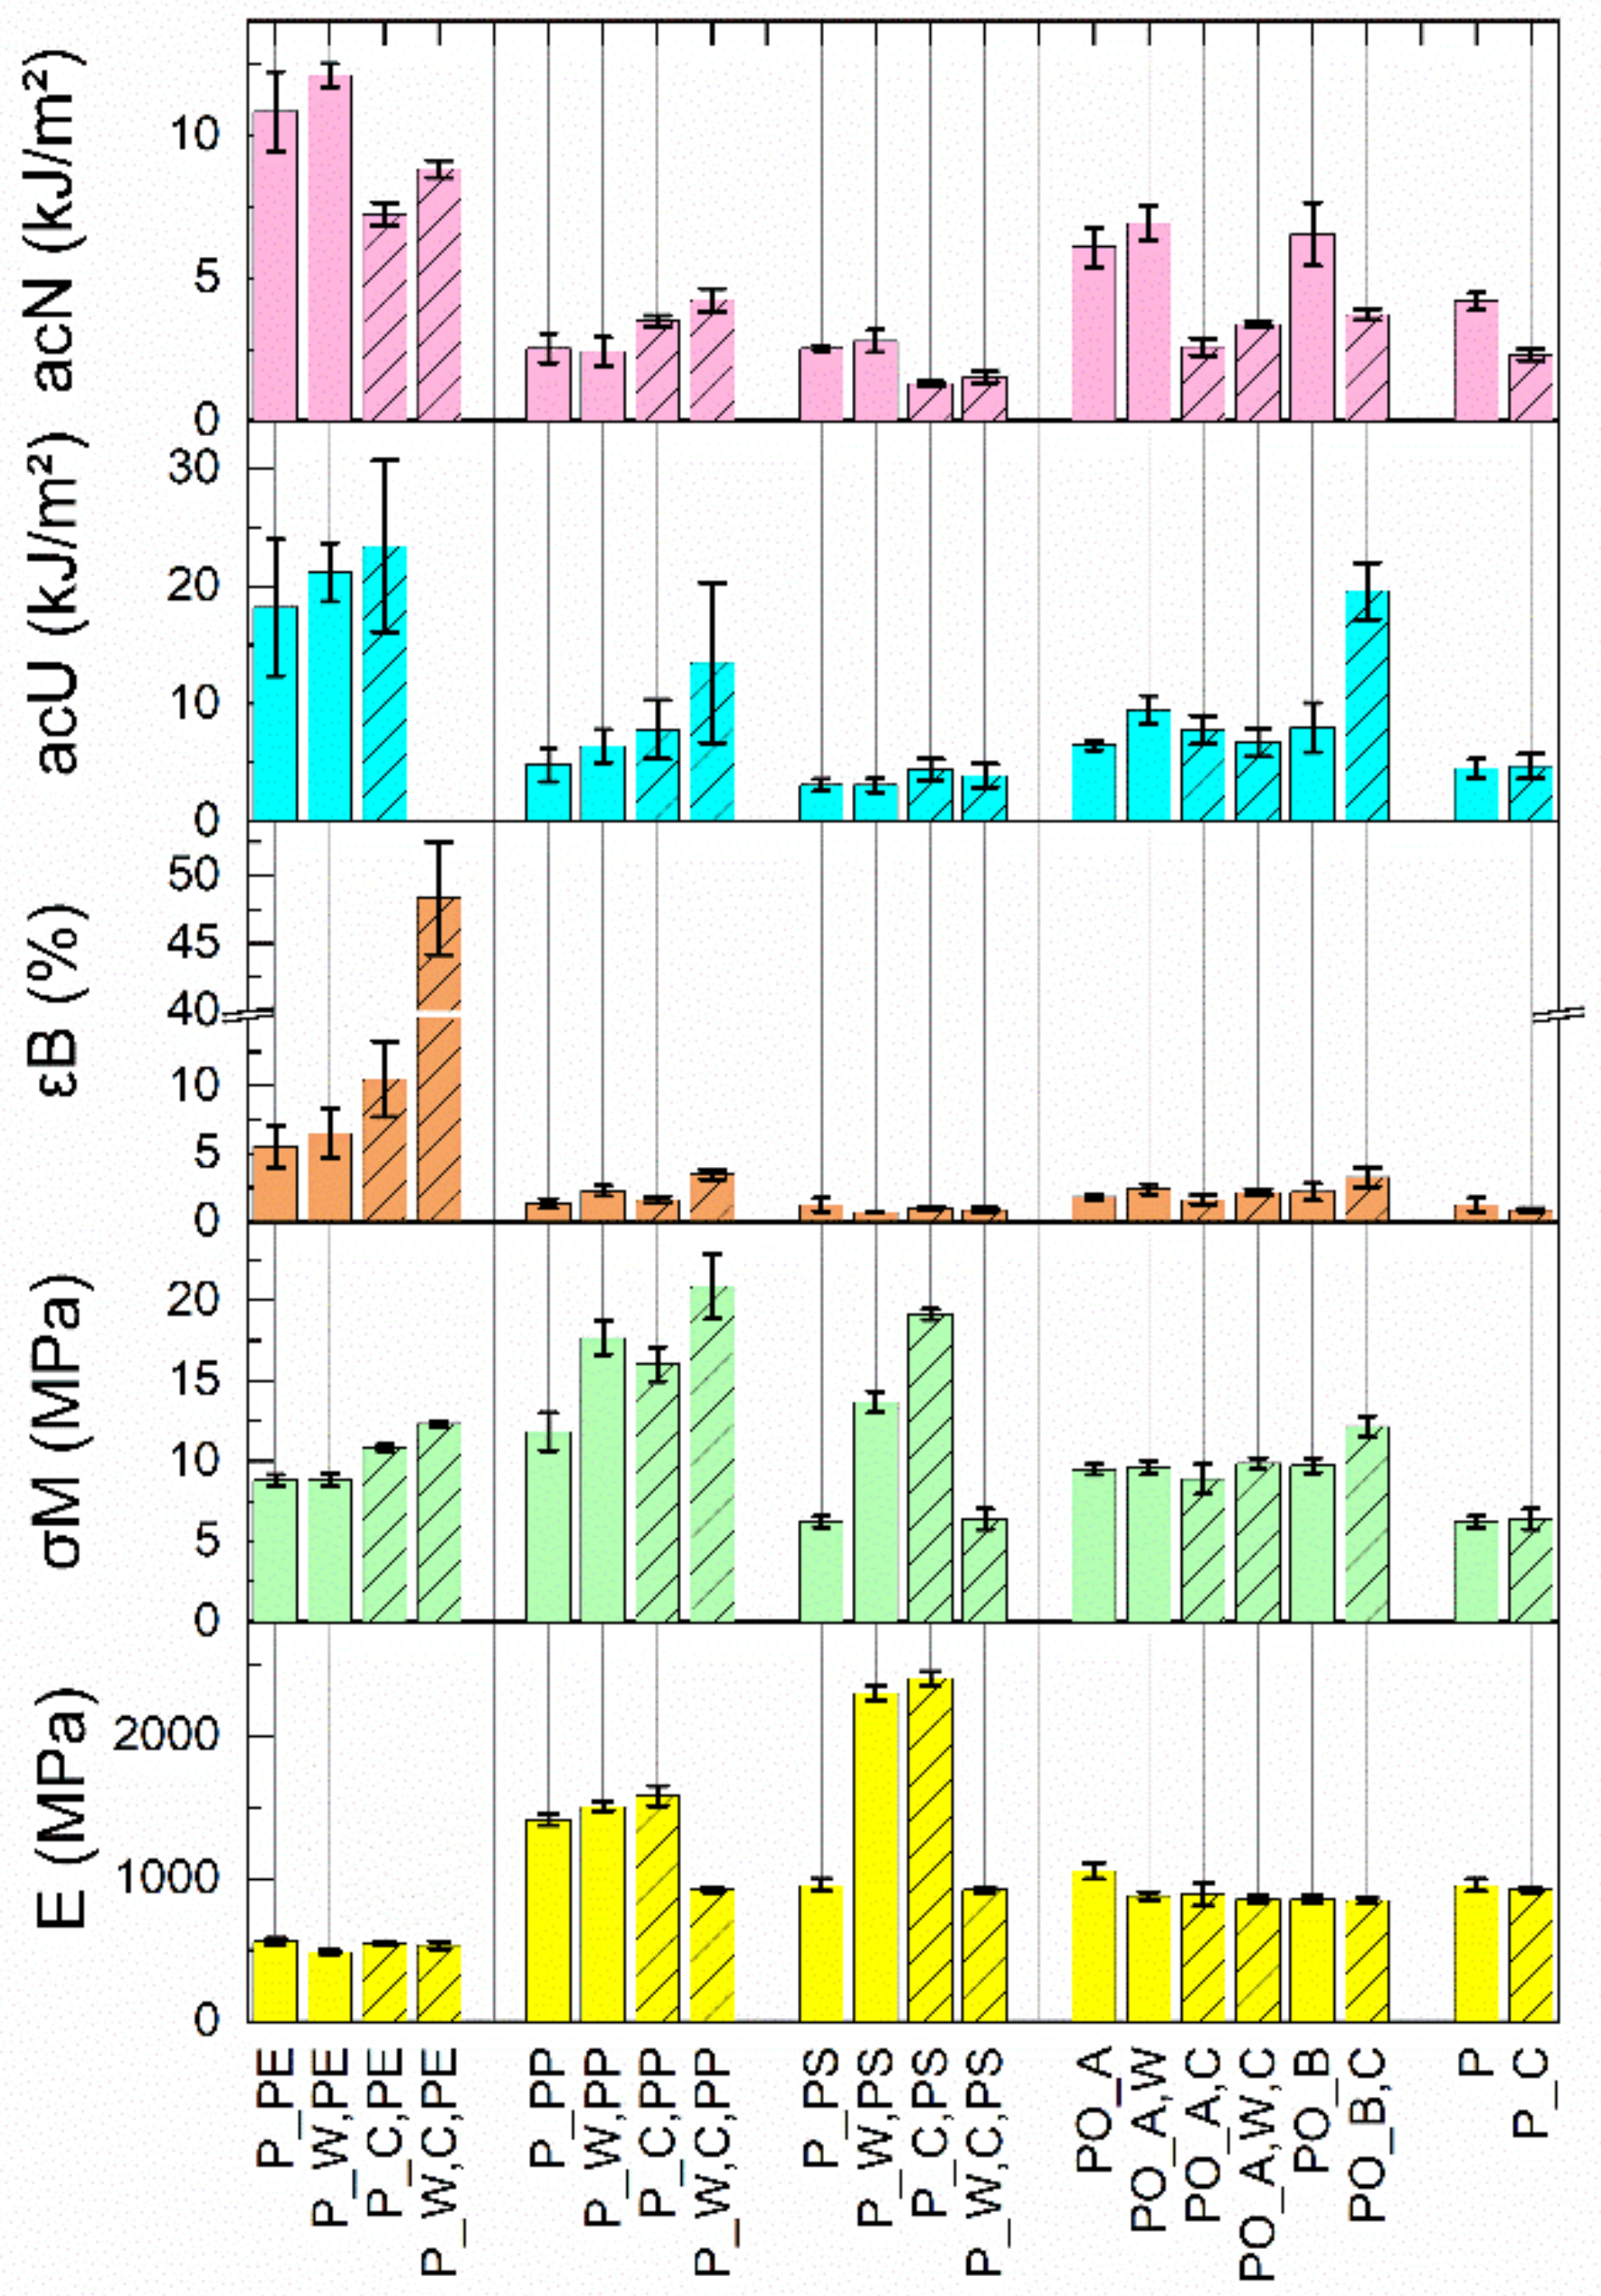
3.4. Mechanical Material Properties
3.5. Ash Content
3.6. Bulk Densities
3.6.1. Flakes
3.6.2. Granulates
4. Discussion
5. Conclusions
Author Contributions
Funding
Institutional Review Board Statement
Informed Consent Statement
Data Availability Statement
Acknowledgments
Conflicts of Interest
Abbreviations
| Abbreviation | Description |
| ΔHC | crystallisation enthalpy |
| ΔHm | melting enthalpy |
| εB | elongation at break |
| εM | maximum elongation at the yield point |
| σB | tensile strength at break |
| σM | maximum tensile strength |
| AC | ash content |
| acN | notched impact strength |
| acU | impact strength |
| C | homogenised |
| CO2 | carbon dioxide—greenhouse gas |
| D | screw diameter |
| DS | dry substance |
| DSC | differential scanning calorimetry |
| E | Young’s modulus |
| e.g., | for example |
| EPS | expanded polystyrene |
| EU | European Union |
| FTIR | Fourier-transform infrared |
| HDPE | high-density polyethylene |
| LDPE | low-density polyethylene |
| LLDPE | linear low-density polyethylene |
| min | minutes |
| MFR | melt (mass) flow rate |
| Mt | million tonnes |
| NIR | near-infrared |
| OS | original substance |
| P | plastics |
| P&C | paper and cardboard |
| PO | polyolefins |
| (v)PE | (virgin) polyethylene |
| PET | polyethylene terephthalate |
| PP | polypropylene |
| PS | polystyrene |
| PVC | polyvinyl chloride |
| rpm | revolutions per minute |
| SRF | solid recovered fuel |
| TC | crystallisation temperature |
| Tg | glass transition temperature |
| Tm | melting temperature |
| TSE | twin-screw extruder |
| v | virgin |
| W | washed |
Appendix A. Total Composition of SRF and Plastic Type Content

| Fraction | Mass (kg) | Mass (%) |
|---|---|---|
| Plastics | 150.4 | 86.5 |
| Metals | 1.01 | 0.6 |
| P&C 1 | 10.03 | 5.8 |
| Inert | 1.04 | 0.6 |
| Wood | 0.17 | 0.1 |
| Other | 11.27 | 6.5 |
| Total | 173.92 | 100 |
| Fraction | Mass (kg) | Mass (%) |
|---|---|---|
| PE | 44.64 | 36.42 |
| PP | 19.19 | 15.66 |
| PET | 25.34 | 20.67 |
| PS | 7.41 | 6.04 |
| Other | 26 | 21.21 |
| Total | 122.58 | 100 |
Appendix B. DSC Measurements


Appendix C. Processing Conditions
| Materials: | P_PE; P_W,PE; P_PP; P_W,PP; P_PS; P_W,PS | |||
|---|---|---|---|---|
| Zones | Zone 1 | Zone 2 | Zone 3 | Zone 4 |
| Temperature (°C) | 150 | 170 | 170 | 170 |
| Materials: | PO_A; PO_A,W; PO_B | |||
| Zone 1 | Zone 2 | Zone 3 | Zone 4 | |
| Temperature (°C) | 150 | 180 | 200 | 205 |
| Materials: | P_PE | P_W,PE | |||
| Phases | Phase 1 | Phase 2 | Phase 3 | Phase 4 | Phase 5 |
| Temperature (°C) | 210 | 210 | 210 | 210 | 30 |
| Pressure (bar) | 1 | 10 | 50 | 100 | 100 |
| Time (min) | 8 | 5 | 4 | 4 | 15 |
| Materials: | P_C,PE | P_W,C,PE | |||
| Phases | Phase 1 | Phase 2 | Phase 3 | Phase 4 | Phase 5 |
| Temperature (°C) | 200 | 200 | 200 | 200 | 30 |
| Pressure (bar) | 1 | 10 | 50 | 100 | 100 |
| Time (min) | 10 | 5 | 4 | 4 | 15 |
| Materials: | P_PP | P_W,PP | P_C,PP | P_W,C,PP | |
| Phases | Phase 1 | Phase 2 | Phase 3 | Phase 4 | Phase 5 |
| Temperature (°C) | 200 | 200 | 200 | 200 | 30 |
| Pressure (bar) | 1 | 10 | 50 | 100 | 100 |
| Time (min) | 14 | 5 | 4 | 4 | 15 |
| Materials: | P_PS | P_W,PS | P_C,PS | P_W,C,PS | |
| Phases | Phase 1 | Phase 2 | Phase 3 | Phase 4 | Phase 5 |
| Temperature (°C) | 207 | 205 | 205 | 205 | 30 |
| Pressure (bar) | 5 | 10 | 50 | 100 | 100 |
| Time (min) | 10 | 5 | 4 | 4 | 15 |
| Materials: PO_A | PO_A,W | PO_A,C | PO_A,W,C | PO_B | PO_B,C |
| Phases | Phase 1 | Phase 2 | Phase 3 | Phase 4 | Phase 5 |
| Temperature (°C) | 210 | 210 | 210 | 210 | 30 |
| Pressure (bar) | 1 | 10 | 50 | 100 | 100 |
| Time (min) | 8 | 5 | 4 | 4 | 15 |
| Materials: | P | P_C | |||
| Phases | Phase 1 | Phase 2 | Phase 3 | Phase 4 | Phase 5 |
| Temperature (°C) | 210 | 210 | 210 | 210 | 30 |
| Pressure (bar) | 1 | 10 | 50 | 100 | 100 |
| Time (min) | 8 | 5 | 4 | 4 | 15 |
Appendix D. MFR Measurements
| Sample Identification | Sample Number | Total Mass (g) | Time Interval (min) | MFR (g/10 min) | Mean Value (g/10 min) | Standard Deviation (g/10 min) |
|---|---|---|---|---|---|---|
| P_PE | P1 | 2.10 | 10 | 2.571 | 2.479 | 0.130 |
| P_PE | P2 | 2.09 | 10 | 2.387 | ||
| P_W,PE | P1 | 2.71 | 10 | 2.586 | 2.641 | 0.078 |
| P_W,PE | P2 | 3.08 | 10 | 2.696 | ||
| P_C,PE | P1 | 2.38 | 10 | 2.184 | 2.147 | 0.053 |
| P_C,PE | P2 | 2.31 | 15 | 2.110 | ||
| P_W,C,PE | P1 | 2.41 | 20 | 1.794 | 1.820 | 0.037 |
| P_W,C,PE | P2 | 2.40 | 20 | 1.846 | ||
| P_PP | P1 | 2.20 | 5 | 1.805 | 1.304 | 0.708 |
| P_PP | P2 | 2.18 | 10 | 0.803 | ||
| P_W,PP | P1 | 2.78 | 10 | 11.801 | 12.286 | 0.687 |
| P_W,PP | P2 | 3.35 | 5 | 12.772 | ||
| P_C,PP | P1 | 2.53 | 10 | 3.932 | 4.178 | 0.130 |
| P_C,PP | P2 | 2.62 | 10 | 4.029 | ||
| P_W,C,PP | P1 | 2.31 | 10 | 7.114 | 7.273 | 0.225 |
| P_W,C,PP | P2 | 3.19 | 10 | 7.432 | ||
| P_PS | P1 | 2.82 | 20 | 0.218 | 0.927 | 1.003 |
| P_PS | P2 | 2.56 | 10 | 1.636 | ||
| P_W,PS | P1 | 3.21 | 20 | 1.744 | 1.217 | 0.746 |
| P_W,PS | P2 | 2.94 | 20 | 0.689 | ||
| P_C,PS | P1 | 2.00 | 10 | 5.673 | 5.026 | 0.914 |
| P_C,PS | P2 | 2.00 | 10 | 4.380 | ||
| P_W,C,PS | P1 | 2.78 | 10 | 3.526 | 2.891 | 0.898 |
| P_W,C,PS | P2 | 2.73 | 10 | 2.255 | ||
| PO_A | P1 | 2.67 | 20 | 0.936 | 0.920 | 0.023 |
| PO_A | P2 | 2.72 | 20 | 0.904 | ||
| PO_A,W | P1 | 2.56 | 20 | 0.410 | 0.855 | 0.630 |
| PO_A,W | P2 | 2.50 | 20 | 1.301 | ||
| PO_A,C | P1 | 2.23 | 20 | 1.934 | 2.042 | 0.153 |
| PO_A,C | P2 | 2.56 | 20 | 2.150 | ||
| PO_A,W,C | P1 | 2.34 | 15 | 2.220 | 2.280 | 0.085 |
| PO_A,W,C | P2 | 2.71 | 15 | 2.341 | ||
| PO_B | P1 | 2.40 | 10 | 3.012 | 3.338 | 0.460 |
| PO_B | P2 | 2.44 | 10 | 3.663 | ||
| PO_B,C | P1 | 2.64 | 10 | 2.690 | 2.700 | 0.013 |
| PO_B,C | P2 | 2.39 | 10 | 2.709 | ||
| P | P1 | 2.32 | 10 | 2.798 | 2.319 | 0.677 |
| P | P2 | 2.94 | 10 | 1.840 | ||
| P_C | P1 | 2.35 | 10 | 3.333 | 3.676 | 0.485 |
| P_C | P2 | 2.50 | 10 | 4.019 |
Appendix E. Impact Tests
| Sample Number | l (mm) | bB (mm) | d (mm) | A (m2) | W (J) | Wempty (J) | Wcorr (kJ) | acN (kJ/m2) | Note |
|---|---|---|---|---|---|---|---|---|---|
| P1 | 78.54 | 10.10 | 3.51 | 0.000035 | 0.988 | 0.004 | 0.000984 | 27.8 | partially broken |
| P2 | 78.35 | 10.09 | 3.40 | 0.000034 | 0.500 | 0.004 | 0.000496 | 14.5 | partially broken |
| P3 | 78.50 | 10.07 | 3.42 | 0.000034 | 0.596 | 0.004 | 0.000592 | 17.2 | partially broken |
| P4 | 78.62 | 10.09 | 3.42 | 0.000035 | 0.452 | 0.004 | 0.000448 | 13.0 | |
| P5 | 78.26 | 10.08 | 3.48 | 0.000035 | 0.660 | 0.004 | 0.000656 | 18.7 | |
| P6 | 78.62 | 8.12 | 3.51 | 0.000029 | 0.322 | 0.007 | 0.000315 | 11.1 | |
| P7 | 78.64 | 8.15 | 3.51 | 0.000029 | 0.298 | 0.007 | 0.000291 | 10.2 | |
| P8 | 78.72 | 7.89 | 3.48 | 0.000027 | 0.357 | 0.007 | 0.000350 | 12.7 | |
| P9 | 78.55 | 8.00 | 3.53 | 0.000028 | 0.324 | 0.007 | 0.000317 | 11.2 | |
| P10 | 78.71 | 7.95 | 3.49 | 0.000028 | 0.255 | 0.007 | 0.000248 | 8.9 |
| Sample Number | l (mm) | bB (mm) | d (mm) | A (m2) | W (J) | Wempty (J) | Wcorr (kJ) | acN (kJ/m2) | Note |
|---|---|---|---|---|---|---|---|---|---|
| P1 | 78.94 | 10.08 | 3.50 | 0.000035 | 0.808 | 0.004 | 0.000804 | 22.8 | partially broken |
| P2 | 79.04 | 10.04 | 3.52 | 0.000035 | 0.732 | 0.004 | 0.000728 | 20.6 | partially broken |
| P3 | 79.03 | 9.95 | 3.49 | 0.000035 | 0.604 | 0.004 | 0.000600 | 17.3 | partially broken |
| P4 | 78.58 | 10.03 | 3.51 | 0.000035 | 0.844 | 0.004 | 0.000840 | 23.9 | partially broken |
| P5 | 79.10 | 10.15 | 3.51 | 0.000036 | 0.772 | 0.004 | 0.000768 | 21.6 | partially broken |
| P6 | 77.55 | 7.90 | 3.70 | 0.000029 | 0.348 | 0.007 | 0.000341 | 11.7 | |
| P7 | 78.45 | 7.94 | 3.53 | 0.000028 | 0.337 | 0.007 | 0.000330 | 11.8 | |
| P8 | 78.46 | 7.84 | 3.54 | 0.000028 | 0.345 | 0.007 | 0.000338 | 12.2 | partially broken |
| P9 | 78.30 | 8.03 | 3.49 | 0.000028 | 0.348 | 0.007 | 0.000341 | 12.2 | |
| P10 | 77.60 | 7.79 | 3.60 | 0.000028 | 0.364 | 0.007 | 0.000357 | 12.7 | partially broken |
| Scheme Number | l (mm) | bB (mm) | d (mm) | A (m2) | W (J) | Wempty (J) | Wcorr (kJ) | acN (kJ/m2) | Note |
|---|---|---|---|---|---|---|---|---|---|
| P1 | 79.17 | 10.14 | 3.69 | 0.000037 | 0.764 | 0.004 | 0.000760 | 20.3 | |
| P2 | 79.06 | 10.15 | 3.72 | 0.000038 | 1.068 | 0.004 | 0.001064 | 28.2 | |
| P3 | 79.17 | 10.18 | 3.75 | 0.000038 | 0.604 | 0.004 | 0.000600 | 15.7 | |
| P4 | 79.03 | 10.17 | 3.65 | 0.000037 | 0.716 | 0.004 | 0.000712 | 19.2 | |
| P5 | 78.08 | 10.14 | 3.64 | 0.000037 | 1.240 | 0.004 | 0.001236 | 33.5 | |
| P6 | 78.13 | 7.96 | 3.58 | 0.000028 | 0.213 | 0.007 | 0.000206 | 7.2 | |
| P7 | 78.04 | 7.95 | 3.55 | 0.000028 | 0.213 | 0.007 | 0.000206 | 7.3 | |
| P8 | 78.03 | 8.01 | 3.56 | 0.000029 | 0.230 | 0.007 | 0.000223 | 7.8 | |
| P9 | 78.10 | 8.00 | 3.68 | 0.000029 | 0.206 | 0.007 | 0.000199 | 6.8 | |
| P10 | 78.10 | 8.01 | 3.61 | 0.000029 | 0.214 | 0.007 | 0.000207 | 7.2 |
| Sample Number | l (mm) | bB (mm) | d (mm) | A (m2) | W (J) | Wempty (J) | Wcorr (kJ) | acN (kJ/m2) | Note |
|---|---|---|---|---|---|---|---|---|---|
| P1 | 78.52 | 10.18 | 3.59 | 0.000037 | 2.080 | 0.030 | 0.002050 | 56.1 | not broken |
| P2 | 78.18 | 10.16 | 3.54 | 0.000036 | 1.260 | 0.030 | 0.001230 | 34.2 | not broken |
| P3 | 78.37 | 10.19 | 3.53 | 0.000036 | 3.250 | 0.030 | 0.003220 | 89.5 | not broken |
| P4 | 78.25 | 10.22 | 3.55 | 0.000036 | 2.770 | 0.030 | 0.002740 | 75.5 | not broken |
| P5 | 78.49 | 10.15 | 3.53 | 0.000036 | 3.000 | 0.030 | 0.002970 | 82.9 | not broken |
| P6 | 78.67 | 8.00 | 3.57 | 0.000029 | 0.270 | 0.007 | 0.000263 | 9.2 | |
| P7 | 78.72 | 7.90 | 3.58 | 0.000028 | 0.251 | 0.007 | 0.000244 | 8.6 | |
| P8 | 78.77 | 7.82 | 3.56 | 0.000028 | 0.255 | 0.007 | 0.000248 | 8.9 | |
| P9 | 78.74 | 8.05 | 3.60 | 0.000029 | 0.267 | 0.007 | 0.000260 | 9.0 | |
| P10 | 78.79 | 8.06 | 3.59 | 0.000029 | 0.252 | 0.007 | 0.000245 | 8.5 |
| Sample Number | l (mm) | bB (mm) | d (mm) | A (m2) | W (J) | Wempty (J) | Wcorr (kJ) | acN (kJ/m2) | Note |
|---|---|---|---|---|---|---|---|---|---|
| P1 | 78.60 | 10.24 | 3.81 | 0.000039 | 0.188 | 0.008 | 0.000180 | 4.6 | |
| P2 | 77.92 | 10.25 | 3.62 | 0.000037 | 0.258 | 0.008 | 0.000250 | 6.7 | |
| P3 | 77.94 | 10.25 | 3.62 | 0.000037 | 0.126 | 0.008 | 0.000118 | 3.2 | |
| P4 | 77.92 | 10.25 | 3.63 | 0.000037 | 0.152 | 0.008 | 0.000144 | 3.9 | |
| P5 | 77.91 | 10.25 | 3.62 | 0.000037 | 0.213 | 0.008 | 0.000205 | 5.5 | |
| P6 | 78.80 | 8.37 | 3.59 | 0.000030 | 0.084 | 0.007 | 0.000077 | 2.6 | |
| P7 | 79.26 | 8.29 | 3.63 | 0.000030 | 0.073 | 0.007 | 0.000066 | 2.2 | |
| P8 | 78.20 | 8.20 | 3.60 | 0.000030 | 0.097 | 0.007 | 0.000090 | 3.0 | |
| P9 | 78.06 | 8.13 | 3.63 | 0.000030 | 0.095 | 0.007 | 0.000088 | 3.0 | |
| P10 | 77.68 | 8.57 | 3.67 | 0.000031 | 0.069 | 0.007 | 0.000062 | 2.0 |
| Sample Number | l (mm) | bB (mm) | d (mm) | A (m2) | W (J) | Wempty (J) | Wcorr (kJ) | acN (kJ/m2) | Note |
|---|---|---|---|---|---|---|---|---|---|
| P1 | 77.24 | 10.25 | 3.65 | 0.000037 | 0.220 | 0.004 | 0.000216 | 5.8 | |
| P2 | 77.65 | 10.30 | 3.60 | 0.000037 | 0.180 | 0.004 | 0.000176 | 4.7 | |
| P3 | 77.40 | 10.24 | 3.58 | 0.000037 | 0.312 | 0.004 | 0.000308 | 8.4 | |
| P4 | 77.88 | 10.18 | 3.60 | 0.000037 | 0.216 | 0.004 | 0.000212 | 5.8 | |
| P5 | 77.59 | 10.20 | 3.55 | 0.000036 | 0.264 | 0.004 | 0.000260 | 7.2 | |
| P6 | 79.02 | 7.96 | 3.65 | 0.000029 | 0.068 | 0.007 | 0.000061 | 2.1 | |
| P7 | 77.68 | 7.96 | 3.80 | 0.000030 | 0.064 | 0.007 | 0.000057 | 1.9 | |
| P8 | 77.86 | 8.38 | 3.76 | 0.000032 | 0.106 | 0.007 | 0.000099 | 3.1 | |
| P9 | 77.92 | 8.01 | 3.77 | 0.000030 | 0.072 | 0.007 | 0.000065 | 2.2 | |
| P10 | 79.02 | 8.22 | 3.80 | 0.000031 | 0.096 | 0.007 | 0.000089 | 2.8 |
| Sample Number | l (mm) | bB (mm) | d (mm) | A (m2) | W (J) | Wempty (J) | Wcorr (kJ) | acN (kJ/m2) | Note |
|---|---|---|---|---|---|---|---|---|---|
| P1 | 77.61 | 10.35 | 3.88 | 0.000040 | 0.197 | 0.008 | 0.000189 | 4.7 | |
| P2 | 78.07 | 10.25 | 3.70 | 0.000038 | 0.221 | 0.008 | 0.000213 | 5.6 | |
| P3 | 77.84 | 10.10 | 3.70 | 0.000037 | 0.357 | 0.008 | 0.000349 | 9.3 | |
| P4 | 78.05 | 10.22 | 3.73 | 0.000038 | 0.363 | 0.008 | 0.000355 | 9.3 | |
| P5 | 77.47 | 10.02 | 3.69 | 0.000037 | 0.382 | 0.008 | 0.000374 | 10.1 | |
| P6 | 77.77 | 8.06 | 3.68 | 0.000030 | 0.121 | 0.007 | 0.000114 | 3.8 | |
| P7 | 78.08 | 8.24 | 3.64 | 0.000030 | 0.116 | 0.007 | 0.000109 | 3.6 | |
| P8 | 77.89 | 8.37 | 3.66 | 0.000031 | 0.106 | 0.007 | 0.000099 | 3.2 | |
| P9 | 77.85 | 8.14 | 3.69 | 0.000030 | 0.108 | 0.007 | 0.000101 | 3.4 | |
| P10 | 77.94 | 8.43 | 3.92 | 0.000033 | 0.119 | 0.007 | 0.000112 | 3.4 |
| Sample Number | l (mm) | bB (mm) | d (mm) | A (m2) | W (J) | Wempty (J) | Wcorr (kJ) | acN (kJ/m2) | Note |
|---|---|---|---|---|---|---|---|---|---|
| P1 | 77.87 | 10.25 | 3.70 | 0.000038 | 0.948 | 0.004 | 0.000944 | 24.9 | |
| P2 | 77.85 | 10.20 | 3.71 | 0.000038 | 0.464 | 0.004 | 0.000460 | 12.2 | |
| P3 | 77.49 | 10.25 | 3.80 | 0.000039 | 0.508 | 0.004 | 0.000504 | 12.9 | |
| P4 | 77.50 | 10.25 | 3.63 | 0.000037 | 0.244 | 0.004 | 0.000240 | 6.5 | |
| P5 | 77.47 | 10.00 | 3.65 | 0.000037 | 0.412 | 0.004 | 0.000408 | 11.2 | |
| P6 | 77.74 | 8.14 | 3.65 | 0.000030 | 0.131 | 0.007 | 0.000124 | 4.2 | |
| P7 | 77.68 | 8.02 | 3.65 | 0.000029 | 0.133 | 0.007 | 0.000126 | 4.3 | |
| P8 | 77.74 | 8.22 | 3.65 | 0.000030 | 0.113 | 0.007 | 0.000106 | 3.5 | |
| P9 | 77.78 | 7.99 | 3.67 | 0.000029 | 0.139 | 0.007 | 0.000132 | 4.5 | |
| P10 | 77.63 | 8.28 | 3.61 | 0.000030 | 0.147 | 0.007 | 0.000140 | 4.7 |
| Sample Number | l (mm) | bB (mm) | d (mm) | A (m2) | W (J) | Wempty (J) | Wcorr (kJ) | acN (kJ/m2) | Note |
|---|---|---|---|---|---|---|---|---|---|
| P1 | 79.32 | 10.30 | 3.88 | 0.000040 | 0.121 | 0.006 | 0.000115 | 2.9 | |
| P2 | 79.54 | 10.30 | 3.86 | 0.000040 | 0.098 | 0.006 | 0.000092 | 2.3 | |
| P3 | 79.24 | 10.30 | 3.85 | 0.000040 | 0.129 | 0.006 | 0.000123 | 3.1 | |
| P4 | 79.75 | 10.30 | 3.91 | 0.000040 | 0.143 | 0.006 | 0.000137 | 3.4 | |
| P5 | 79.59 | 10.10 | 3.90 | 0.000039 | 0.149 | 0.006 | 0.000143 | 3.6 | |
| P6 | 79.10 | 8.03 | 3.93 | 0.000032 | 0.091 | 0.006 | 0.000085 | 2.7 | |
| P7 | 78.58 | 7.93 | 3.98 | 0.000032 | 0.085 | 0.006 | 0.000079 | 2.5 | |
| P8 | 78.46 | 7.83 | 3.96 | 0.000031 | 0.083 | 0.006 | 0.000077 | 2.5 | |
| P9 | 78.62 | 7.95 | 3.98 | 0.000032 | 0.085 | 0.006 | 0.000079 | 2.5 | |
| P10 | 78.78 | 8.01 | 3.95 | 0.000032 | 0.088 | 0.006 | 0.000082 | 2.6 |
| Sample Number | l (mm) | bB (mm) | d (mm) | A (m2) | W (J) | Wempty (J) | Wcorr (kJ) | acN (kJ/m2) | Note |
|---|---|---|---|---|---|---|---|---|---|
| P1 | 79.61 | 10.29 | 3.89 | 0.000040 | 0.101 | 0.008 | 0.000093 | 2.3 | |
| P2 | 79.39 | 10.18 | 3.88 | 0.000039 | 0.152 | 0.008 | 0.000144 | 3.6 | |
| P3 | 80.18 | 10.21 | 3.85 | 0.000039 | 0.109 | 0.008 | 0.000101 | 2.6 | |
| P4 | 79.55 | 10.27 | 3.95 | 0.000041 | 0.145 | 0.008 | 0.000137 | 3.4 | |
| P5 | 79.47 | 10.35 | 3.87 | 0.000040 | 0.157 | 0.008 | 0.000149 | 3.7 | |
| P6 | 78.44 | 7.88 | 3.89 | 0.000031 | 0.110 | 0.007 | 0.000103 | 3.4 | |
| P7 | 78.31 | 8.17 | 3.93 | 0.000032 | 0.109 | 0.007 | 0.000102 | 3.2 | |
| P8 | 79.49 | 8.39 | 3.84 | 0.000032 | 0.092 | 0.007 | 0.000085 | 2.6 | |
| P9 | 79.65 | 8.18 | 3.85 | 0.000031 | 0.079 | 0.007 | 0.000072 | 2.3 | |
| P10 | 79.74 | 8.50 | 3.86 | 0.000033 | 0.091 | 0.007 | 0.000084 | 2.6 |
| Sample Number | l (mm) | bB (mm) | d (mm) | A (m2) | W (J) | Wempty (J) | Wcorr (kJ) | acN (kJ/m2) | Note |
|---|---|---|---|---|---|---|---|---|---|
| P1 | 79.92 | 10.40 | 3.99 | 0.000041 | 0.157 | 0.008 | 0.000149 | 3.6 | |
| P2 | 79.79 | 10.40 | 4.03 | 0.000042 | 0.230 | 0.008 | 0.000222 | 5.3 | |
| P3 | 78.26 | 10.36 | 3.95 | 0.000041 | 0.175 | 0.008 | 0.000167 | 4.1 | |
| P4 | 79.78 | 10.40 | 4.02 | 0.000042 | 0.157 | 0.008 | 0.000149 | 3.6 | |
| P5 | 79.92 | 10.14 | 3.99 | 0.000040 | 0.222 | 0.008 | 0.000214 | 5.3 | |
| P6 | 78.64 | 8.26 | 3.97 | 0.000033 | 0.050 | 0.007 | 0.000043 | 1.3 | |
| P7 | 78.68 | 8.12 | 3.96 | 0.000032 | 0.048 | 0.007 | 0.000041 | 1.3 | |
| P8 | 78.73 | 8.07 | 3.98 | 0.000032 | 0.047 | 0.007 | 0.000040 | 1.2 | |
| P9 | 78.72 | 8.01 | 3.99 | 0.000032 | 0.052 | 0.007 | 0.000045 | 1.4 | |
| P10 | 78.85 | 7.95 | 4.02 | 0.000032 | 0.047 | 0.007 | 0.000040 | 1.3 |
| Sample Number | l (mm) | bB (mm) | d (mm) | A (m2) | W (J) | Wempty (J) | Wcorr (kJ) | acN (kJ/m2) | Note |
|---|---|---|---|---|---|---|---|---|---|
| P1 | 79.42 | 10.30 | 4.04 | 0.000042 | 0.155 | 0.008 | 0.000147 | 3.5 | |
| P2 | 79.09 | 10.25 | 4.00 | 0.000041 | 0.114 | 0.008 | 0.000106 | 2.6 | |
| P3 | 79.28 | 10.35 | 3.95 | 0.000041 | 0.163 | 0.008 | 0.000155 | 3.8 | |
| P4 | 79.44 | 10.30 | 3.91 | 0.000040 | 0.179 | 0.008 | 0.000171 | 4.2 | |
| P5 | 79.45 | 10.31 | 3.90 | 0.000040 | 0.217 | 0.008 | 0.000209 | 5.2 | |
| P6 | 79.08 | 8.02 | 3.94 | 0.000032 | 0.067 | 0.007 | 0.000060 | 1.9 | |
| P7 | 79.12 | 8.04 | 3.87 | 0.000031 | 0.055 | 0.007 | 0.000048 | 1.5 | |
| P8 | 79.36 | 8.08 | 3.99 | 0.000032 | 0.054 | 0.007 | 0.000047 | 1.5 | |
| P9 | 79.29 | 7.88 | 3.98 | 0.000031 | 0.049 | 0.007 | 0.000042 | 1.3 | |
| P10 | 79.37 | 8.20 | 3.89 | 0.000032 | 0.055 | 0.007 | 0.000048 | 1.5 |
| Sample Number | l (mm) | bB (mm) | d (mm) | A (m2) | W (J) | Wempty (J) | Wcorr (kJ) | acN (kJ/m2) | Note |
|---|---|---|---|---|---|---|---|---|---|
| P1 | 79.36 | 10.03 | 3.76 | 0.000038 | 0.276 | 0.008 | 0.000268 | 7.1 | partially broken |
| P2 | 79.57 | 10.06 | 3.73 | 0.000038 | 0.245 | 0.008 | 0.000237 | 6.3 | partially broken |
| P3 | 79.46 | 10.13 | 3.76 | 0.000038 | 0.252 | 0.008 | 0.000244 | 6.4 | partially broken |
| P4 | 79.66 | 10.06 | 3.75 | 0.000038 | 0.242 | 0.008 | 0.000234 | 6.2 | partially broken |
| P5 | 79.38 | 10.03 | 3.80 | 0.000038 | 0.247 | 0.008 | 0.000239 | 6.3 | partially broken |
| P6 | 78.64 | 8.13 | 3.79 | 0.000031 | 0.200 | 0.007 | 0.000193 | 6.3 | |
| P7 | 78.57 | 8.00 | 3.80 | 0.000030 | 0.203 | 0.007 | 0.000196 | 6.4 | partially broken |
| P8 | 78.63 | 8.08 | 3.78 | 0.000031 | 0.159 | 0.007 | 0.000152 | 5.0 | |
| P9 | 78.61 | 8.15 | 3.83 | 0.000031 | 0.193 | 0.007 | 0.000186 | 6.0 | partially broken |
| P10 | 78.59 | 8.13 | 3.78 | 0.000031 | 0.215 | 0.007 | 0.000208 | 6.8 |
| Sample Number | l (mm) | bB (mm) | d (mm) | A (m2) | W (J) | Wempty (J) | Wcorr (kJ) | acN (kJ/m2) | Note |
|---|---|---|---|---|---|---|---|---|---|
| P1 | 78.52 | 10.11 | 3.68 | 0.000037 | 0.316 | 0.004 | 0.000312 | 8.4 | |
| P2 | 78.98 | 10.11 | 3.82 | 0.000039 | 0.388 | 0.004 | 0.000384 | 9.9 | partially broken |
| P3 | 78.64 | 10.10 | 3.70 | 0.000037 | 0.308 | 0.004 | 0.000304 | 8.1 | partially broken |
| P4 | 78.66 | 10.20 | 3.68 | 0.000038 | 0.396 | 0.004 | 0.000392 | 10.4 | partially broken |
| P5 | 78.70 | 10.15 | 3.65 | 0.000037 | 0.396 | 0.004 | 0.000392 | 10.6 | partially broken |
| P6 | 78.85 | 8.01 | 3.67 | 0.000029 | 0.234 | 0.007 | 0.000227 | 7.7 | |
| P7 | 78.86 | 8.30 | 3.61 | 0.000030 | 0.219 | 0.007 | 0.000212 | 7.1 | |
| P8 | 78.85 | 8.13 | 3.62 | 0.000029 | 0.191 | 0.007 | 0.000184 | 6.3 | |
| P9 | 78.75 | 8.15 | 3.65 | 0.000030 | 0.217 | 0.007 | 0.000210 | 7.1 | |
| P10 | 78.70 | 8.09 | 3.64 | 0.000029 | 0.200 | 0.007 | 0.000193 | 6.6 |
| Sample Number | l (mm) | bB (mm) | d (mm) | A (m2) | W (J) | Wempty (J) | Wcorr (kJ) | acN (kJ/m2) | Note |
|---|---|---|---|---|---|---|---|---|---|
| P1 | 79.55 | 10.05 | 3.87 | 0.000039 | 0.234 | 0.008 | 0.000226 | 5.8 | |
| P2 | 78.61 | 10.03 | 3.61 | 0.000036 | 0.289 | 0.008 | 0.000281 | 7.8 | |
| P3 | 78.66 | 9.96 | 3.75 | 0.000037 | 0.311 | 0.008 | 0.000303 | 8.1 | |
| P4 | 78.37 | 9.95 | 3.63 | 0.000036 | 0.318 | 0.008 | 0.000310 | 8.6 | |
| P5 | 78.59 | 9.81 | 3.65 | 0.000036 | 0.325 | 0.008 | 0.000317 | 8.9 | |
| P6 | 78.56 | 8.35 | 3.65 | 0.000030 | 0.073 | 0.007 | 0.000066 | 2.2 | |
| P7 | 78.51 | 8.21 | 3.65 | 0.000030 | 0.097 | 0.007 | 0.000090 | 3.0 | |
| P8 | 78.75 | 8.62 | 3.59 | 0.000031 | 0.084 | 0.007 | 0.000077 | 2.5 | |
| P9 | 78.21 | 8.35 | 3.68 | 0.000031 | 0.086 | 0.007 | 0.000079 | 2.6 | |
| P10 | 78.60 | 8.18 | 3.63 | 0.000030 | 0.088 | 0.007 | 0.000081 | 2.7 |
| Sample Number | l (mm) | bB (mm) | d (mm) | A (m2) | W (J) | Wempty (J) | Wcorr (kJ) | acN (kJ/m2) | Note |
|---|---|---|---|---|---|---|---|---|---|
| P1 | 78.96 | 9.90 | 3.61 | 0.000036 | 0.232 | 0.007 | 0.000225 | 6.3 | |
| P2 | 79.11 | 9.89 | 3.85 | 0.000038 | 0.245 | 0.007 | 0.000238 | 6.3 | |
| P3 | 78.71 | 9.97 | 3.59 | 0.000036 | 0.231 | 0.007 | 0.000224 | 6.3 | |
| P4 | 78.62 | 9.98 | 3.61 | 0.000036 | 0.214 | 0.007 | 0.000207 | 5.7 | |
| P5 | 78.48 | 10.04 | 3.57 | 0.000036 | 0.321 | 0.007 | 0.000314 | 8.8 | |
| P6 | 79.21 | 7.94 | 3.54 | 0.000028 | 0.105 | 0.007 | 0.000098 | 3.5 | |
| P7 | 79.15 | 8.14 | 3.53 | 0.000029 | 0.106 | 0.007 | 0.000099 | 3.4 | |
| P8 | 79.42 | 8.02 | 3.88 | 0.000031 | 0.106 | 0.007 | 0.000099 | 3.2 | |
| P9 | 79.10 | 8.00 | 3.57 | 0.000029 | 0.105 | 0.007 | 0.000098 | 3.4 | |
| P10 | 79.20 | 8.08 | 3.57 | 0.000029 | 0.105 | 0.007 | 0.000098 | 3.4 |
| Sample Number | l (mm) | bB (mm) | d (mm) | A (m2) | W (J) | Wempty (J) | Wcorr (kJ) | acN (kJ/m2) | Note |
|---|---|---|---|---|---|---|---|---|---|
| P1 | 78.79 | 9.96 | 3.61 | 0.000036 | 0.202 | 0.008 | 0.000194 | 5.4 | partially broken |
| P2 | 78.55 | 9.96 | 3.57 | 0.000036 | 0.342 | 0.008 | 0.000334 | 9.4 | partially broken |
| P3 | 78.90 | 9.92 | 3.56 | 0.000035 | 0.284 | 0.008 | 0.000276 | 7.8 | partially broken |
| P4 | 78.42 | 9.97 | 3.61 | 0.000036 | 0.390 | 0.008 | 0.000382 | 10.6 | |
| P5 | 78.49 | 10.02 | 3.53 | 0.000035 | 0.245 | 0.008 | 0.000237 | 6.7 | partially broken |
| P6 | 78.46 | 8.08 | 3.69 | 0.000030 | 0.206 | 0.007 | 0.000199 | 6.7 | |
| P7 | 78.41 | 7.95 | 3.50 | 0.000028 | 0.183 | 0.007 | 0.000176 | 6.3 | partially broken |
| P8 | 78.55 | 7.92 | 3.59 | 0.000028 | 0.147 | 0.007 | 0.000140 | 4.9 | partially broken |
| P9 | 78.53 | 7.94 | 3.52 | 0.000028 | 0.195 | 0.007 | 0.000188 | 6.7 | |
| P10 | 78.39 | 7.85 | 3.77 | 0.000030 | 0.245 | 0.007 | 0.000238 | 8.0 |
| Sample Number | l (mm) | bB (mm) | d (mm) | A (m2) | W (J) | Wempty (J) | Wcorr (kJ) | acN (kJ/m2) | Note |
|---|---|---|---|---|---|---|---|---|---|
| P1 | 78.64 | 9.99 | 3.51 | 0.000035 | 0.708 | 0.004 | 0.000704 | 20.1 | |
| P2 | 78.58 | 9.93 | 3.52 | 0.000035 | 0.820 | 0.004 | 0.000816 | 23.3 | |
| P3 | 78.72 | 10.00 | 3.56 | 0.000036 | 0.676 | 0.004 | 0.000672 | 18.9 | |
| P4 | 78.72 | 9.95 | 3.60 | 0.000036 | 0.680 | 0.004 | 0.000676 | 18.9 | |
| P5 | 78.61 | 9.99 | 3.54 | 0.000035 | 0.596 | 0.004 | 0.000592 | 16.7 | |
| P6 | 78.68 | 8.08 | 3.56 | 0.000029 | 0.121 | 0.007 | 0.000114 | 4.0 | |
| P7 | 78.70 | 7.95 | 3.58 | 0.000028 | 0.111 | 0.007 | 0.000104 | 3.7 | |
| P8 | 78.72 | 7.92 | 3.57 | 0.000028 | 0.106 | 0.007 | 0.000099 | 3.5 | |
| P9 | 78.70 | 7.94 | 3.55 | 0.000028 | 0.113 | 0.007 | 0.000106 | 3.8 | |
| P10 | 78.81 | 7.85 | 3.56 | 0.000028 | 0.112 | 0.007 | 0.000105 | 3.8 |
| Sample Number | l (mm) | bB (mm) | d (mm) | A (m2) | W (J) | Wleer (J) | Wempty (kJ) | acN (kJ/m2) | Note |
|---|---|---|---|---|---|---|---|---|---|
| P1 | 78.72 | 10.07 | 4.08 | 0.000041 | 0.162 | 0.008 | 0.000154 | 3.7 | parcially broken |
| P2 | 79.23 | 10.16 | 3.87 | 0.000039 | 0.214 | 0.008 | 0.000206 | 5.2 | parcially broken |
| P3 | 79.14 | 10.32 | 3.88 | 0.000040 | 0.189 | 0.008 | 0.000181 | 4.5 | parcially broken |
| P4 | 79.20 | 10.15 | 3.87 | 0.000039 | 0.151 | 0.008 | 0.000143 | 3.6 | parcially broken |
| P5 | 79.10 | 10.17 | 4.15 | 0.000042 | 0.231 | 0.008 | 0.000223 | 5.3 | parcially broken |
| P6 | 79.00 | 8.43 | 3.88 | 0.000033 | 0.129 | 0.007 | 0.000122 | 3.7 | |
| P7 | 79.17 | 8.05 | 3.95 | 0.000032 | 0.155 | 0.007 | 0.000148 | 4.7 | |
| P8 | 79.28 | 8.01 | 3.93 | 0.000031 | 0.135 | 0.007 | 0.000128 | 4.1 | |
| P9 | 79.24 | 8.02 | 3.89 | 0.000031 | 0.143 | 0.007 | 0.000136 | 4.4 | |
| P10 | 79.20 | 8.01 | 3.97 | 0.000032 | 0.138 | 0.007 | 0.000131 | 4.1 |
| Sample Number | l (mm) | bB (mm) | d (mm) | A (m2) | W (J) | Wempty (J) | Wcorr (kJ) | acN (kJ/m2) | Note |
|---|---|---|---|---|---|---|---|---|---|
| P1 | 79.23 | 9.92 | 3.65 | 0.000036 | 0.184 | 0.008 | 0.000176 | 4.9 | |
| P2 | 78.38 | 10.05 | 3.72 | 0.000037 | 0.132 | 0.008 | 0.000124 | 3.3 | |
| P3 | 78.42 | 10.01 | 3.69 | 0.000037 | 0.235 | 0.008 | 0.000227 | 6.1 | |
| P4 | 78.42 | 9.97 | 3.65 | 0.000036 | 0.169 | 0.008 | 0.000161 | 4.4 | |
| P5 | 78.19 | 9.95 | 3.66 | 0.000036 | 0.188 | 0.008 | 0.000180 | 4.9 | |
| P6 | 79.47 | 7.98 | 3.70 | 0.000030 | 0.077 | 0.007 | 0.000070 | 2.4 | |
| P7 | 78.38 | 8.00 | 3.67 | 0.000029 | 0.074 | 0.007 | 0.000067 | 2.3 | |
| P8 | 79.41 | 7.97 | 3.69 | 0.000029 | 0.078 | 0.007 | 0.000071 | 2.4 | |
| P9 | 79.55 | 7.96 | 3.70 | 0.000029 | 0.066 | 0.007 | 0.000059 | 2.0 | |
| P10 | 79.35 | 8.06 | 3.67 | 0.000030 | 0.083 | 0.007 | 0.000076 | 2.6 |
Appendix F. Tensile Tests
| Sample Number | Curve Type | Et (MPa) | sy (MPa) | Fy (N) | ey (%) | eY (mm) | sm (MPa) | sM (N) | em (%) | eM (mm) | sb (MPa) | sB (N) | eb (%) | eB (mm) | b (mm) | h (mm) | A0 (mm2) |
|---|---|---|---|---|---|---|---|---|---|---|---|---|---|---|---|---|---|
| P1 | c | 532.0 | 9.12 | 325.6 | 6.06 | 3.028 | 9.12 | 325.6 | 6.06 | 3.028 | 8.227 | 293.7 | 7.08 | 3.54 | 9.89 | 3.61 | 35.70 |
| P2 | a | 560.6 | − | − | − | − | 8.67 | 320.9 | 4.44 | 2.219 | 8.393 | 310.6 | 4.93 | 2.47 | 10 | 3.7 | 37.00 |
| P3 | c | 579.0 | 9.19 | 329.4 | 5.43 | 2.714 | 9.19 | 329.4 | 5.43 | 2.714 | 1.836 | 65.9 | 7.36 | 3.68 | 9.88 | 3.63 | 35.86 |
| P4 | a | 550.6 | − | − | − | − | 8.30 | 292.5 | 3.48 | 1.738 | 7.969 | 281.0 | 3.81 | 1.90 | 9.85 | 3.58 | 35.26 |
| P5 | c | 593.3 | − | − | − | − | 8.61 | 315.9 | 3.79 | 1.897 | 8.404 | 308.4 | 3.93 | 1.96 | 9.89 | 3.71 | 36.69 |
| P6 | c | 551.5 | 9.01 | 321.2 | 5.17 | 2.586 | 9.01 | 321.2 | 5.17 | 2.586 | 8.320 | 296.5 | 6.13 | 3.07 | 9.9 | 3.6 | 35.64 |
| Mean value | 561.2 | 9.11 | 325.4 | 5.55 | 2.776 | 8.82 | 317.6 | 4.73 | 2.363 | 7.192 | 259.3 | 5.54 | 2.77 | ||||
| Standard deviation | 21.9 | 0.09 | 4.1 | 0.45 | 0.227 | 0.35 | 13.1 | 1.00 | 0.499 | 2.628 | 95.4 | 1.55 | 0.77 | ||||
| Relative deviation [%] | 3.91 | 0.97 | 1.27 | 8.18 | 8.18 | 3.93 | 4.13 | 21.10 | 21.10 | 36.55 | 36.78 | 27.94 | 27.95 | ||||
| Sample Number | Curve Type | Et (MPa) | sm (MPa) | FM (N) | em (%) | eM (mm) | sb (MPa) | sB (N) | eb (%) | eB (mm) | b (mm) | h (mm) | A0 (mm2) |
|---|---|---|---|---|---|---|---|---|---|---|---|---|---|
| P1 | c | 486.5 | 9.04 | 321.2 | 7.21 | 3.604 | 6.472 | 230.0 | 9.75 | 4.87 | 10.04 | 3.54 | 35.54 |
| P2 | c | 498.6 | 9.13 | 324.5 | 5.68 | 2.842 | 8.884 | 315.7 | 6.00 | 3.00 | 10.01 | 3.55 | 35.54 |
| P3 | c | 459.6 | 9.16 | 330.1 | 6.70 | 3.352 | 9.163 | 330.1 | 6.70 | 3.35 | 9.98 | 3.61 | 36.03 |
| P4 | c | 494.7 | 8.82 | 314.8 | 6.63 | 3.316 | 8.824 | 314.8 | 6.63 | 3.32 | 10.05 | 3.55 | 35.68 |
| P5 | c | 483.5 | 8.12 | 291.8 | 3.95 | 1.973 | 7.898 | 284.0 | 4.16 | 2.08 | 10.1 | 3.56 | 35.96 |
| P6 | c | 497.0 | 8.75 | 306.7 | 5.94 | 2.970 | 8.753 | 306.7 | 5.94 | 2.97 | 10.04 | 3.49 | 35.04 |
| Mean value | 486.6 | 8.84 | 314.9 | 6.02 | 3.010 | 8.33 | 296.9 | 6.53 | 3.265 | ||||
| Standard deviation | 14.5 | 0.39 | 13.9 | 1.16 | 0.578 | 1.01 | 36.1 | 1.82 | 0.912 | ||||
| Relative deviation [%] | 2.98 | 4.42 | 4.41 | 19.20 | 19.20 | 12.08 | 12.16 | 27.93 | 27.93 | ||||
| Sample Number | Curve Type | Et (MPa) | sm (MPa) | FM (N) | em (%) | eM (mm) | sb (MPa) | sB (N) | eb (%) | eB (mm) | b (mm) | h (mm) | A0 (mm2) |
|---|---|---|---|---|---|---|---|---|---|---|---|---|---|
| P1 | a | 540.2 | 10.89 | 389.8 | 9.03 | 4.513 | 10.621 | 380.0 | 10.30 | 5.15 | 9.94 | 3.6 | 35.78 |
| P2 | a | 537.2 | 11.10 | 397.3 | 11.82 | 5.911 | 10.593 | 379.3 | 15.06 | 7.53 | 9.89 | 3.62 | 35.80 |
| P3 | a | 574.2 | 10.71 | 388.4 | 8.67 | 4.337 | 10.406 | 377.4 | 9.42 | 4.71 | 9.91 | 3.66 | 36.27 |
| P4 | a | 557.6 | 10.58 | 378.8 | 6.22 | 3.111 | 10.481 | 375.2 | 6.41 | 3.21 | 9.89 | 3.62 | 35.80 |
| P5 | a | 533.2 | 10.90 | 390.8 | 9.78 | 4.890 | 10.517 | 377.0 | 11.20 | 5.60 | 9.93 | 3.61 | 35.85 |
| P6 | a | 540.8 | 10.91 | 391.0 | 9.70 | 4.850 | 10.611 | 380.3 | 10.73 | 5.36 | 10.01 | 3.58 | 35.84 |
| Mean value | 547.2 | 10.85 | 389.4 | 9.20 | 4.602 | 10.538 | 378.2 | 10.52 | 5.26 | ||||
| Standard deviation | 15.6 | 0.18 | 6.0 | 1.82 | 0.912 | 0.085 | 2.0 | 2.80 | 1.40 | ||||
| Relative deviation [%] | 2.86 | 1.66 | 1.54 | 19.82 | 19.82 | 0.81 | 0.52 | 26.64 | 26.64 | ||||
| Sample Number | Curve Type | Et (MPa) | sy (MPa) | Fy (N) | ey (%) | eY (mm) | sm (MPa) | sM (N) | em (%) | eM (mm) | sb (MPa) | sB (N) | eb (%) | eB (mm) | b (mm) | h (mm) | A0 (mm2) |
|---|---|---|---|---|---|---|---|---|---|---|---|---|---|---|---|---|---|
| P1 | c | 499.2 | 12.14 | 429.7 | 11.45 | 5.727 | 12.14 | 429.7 | 11.45 | 5.727 | 9.511 | 336.8 | 44.26 | 22.13 | 9.89 | 3.58 | 35.41 |
| P2 | c | 533.9 | 12.26 | 435.7 | 11.56 | 5.781 | 12.26 | 435.7 | 11.56 | 5.781 | 8.435 | 299.7 | 49.63 | 24.82 | 9.87 | 3.6 | 35.53 |
| P3 | c | 526.4 | 12.23 | 435.4 | 12.30 | 6.150 | 12.23 | 435.4 | 12.30 | 6.150 | 5.915 | 210.6 | 53.86 | 26.93 | 9.86 | 3.61 | 35.59 |
| P4 | c | 539.7 | 12.36 | 436.6 | 12.39 | 6.193 | 12.36 | 436.6 | 12.39 | 6.193 | 4.356 | 153.9 | 43.94 | 21.97 | 9.84 | 3.59 | 35.33 |
| P5 | c | 535.3 | 12.34 | 431.0 | 11.57 | 5.784 | 12.34 | 431.0 | 11.57 | 5.784 | 3.918 | 136.9 | 46.26 | 23.13 | 9.84 | 3.55 | 34.93 |
| P6 | c | 578.9 | 12.56 | 449.8 | 12.31 | 6.154 | 12.56 | 449.8 | 12.31 | 6.154 | 4.634 | 166.0 | 52.04 | 26.02 | 9.87 | 3.63 | 35.83 |
| Mean value | 535.6 | 12.31 | 436.4 | 11.93 | 5.965 | 12.31 | 436.4 | 11.93 | 5.965 | 6.128 | 217.3 | 48.33 | 24.17 | − | − | − | |
| Standard deviation | 25.7 | 0.14 | 7.2 | 0.44 | 0.221 | 0.14 | 7.2 | 0.44 | 0.221 | 2.327 | 82.7 | 4.15 | 2.08 | − | − | − | |
| Relative deviation [%] | 4.80 | 1.16 | 1.64 | 3.71 | 3.71 | 1.16 | 1.64 | 3.71 | 3.71 | 37.97 | 38.07 | 8.59 | 8.59 | − | − | − | |
| Sample Number | Curve Type | Et (MPa) | sm (MPa) | FM (N) | em (%) | eM (mm) | sb (MPa) | sB (N) | eb (%) | eB (mm) | b (mm) | h (mm) | A0 (mm2) |
|---|---|---|---|---|---|---|---|---|---|---|---|---|---|
| P1 | a | 1373.1 | 13.09 | 469.8 | 1.69 | 0.843 | 12.596 | 452.2 | 1.84 | 0.92 | 10 | 3.59 | 35.90 |
| P2 | a | 1435.4 | 13.19 | 473.4 | 1.64 | 0.820 | 13.186 | 473.4 | 1.64 | 0.82 | 10 | 3.59 | 35.90 |
| P3 | a | 1399.6 | 11.65 | 418.2 | 1.30 | 0.648 | 11.648 | 418.2 | 1.30 | 0.65 | 10 | 3.59 | 35.90 |
| P4 | a | 1414.2 | 11.88 | 426.7 | 1.24 | 0.620 | 11.884 | 426.7 | 1.24 | 0.62 | 10 | 3.59 | 35.90 |
| P5 | a | 1380.5 | 10.16 | 364.8 | 0.97 | 0.487 | 10.035 | 360.3 | 0.99 | 0.50 | 10 | 3.59 | 35.90 |
| P6 | a | 1467.9 | 11.01 | 395.4 | 1.02 | 0.508 | 11.014 | 395.4 | 1.02 | 0.51 | 10 | 3.59 | 35.90 |
| Mean value | 1411.8 | 11.83 | 424.7 | 1.31 | 0.655 | 11.727 | 421.0 | 1.34 | 0.67 | - | - | - | |
| Standard deviation | 35.6 | 1.17 | 42.2 | 0.30 | 0.151 | 1.121 | 40.3 | 0.34 | 0.17 | - | - | - | |
| Relative deviation [%] | 2.52 | 9.93 | 9.93 | 23.01 | 23.01 | 9.56 | 9.56 | 25.35 | 25.35 | - | - | - | |
| Sample Number | Curve Type | Et (MPa) | sm (MPa) | FM (N) | em (%) | eM (mm) | sb (MPa) | sB (N) | eb (%) | eB (mm) | b (mm) | h (mm) | A0 (mm2) |
|---|---|---|---|---|---|---|---|---|---|---|---|---|---|
| P1 | a | 1509.3 | 15.69 | 555.8 | 1.50 | 0.748 | 15.690 | 555.8 | 1.50 | 0.75 | 10.15 | 3.49 | 35.42 |
| P2 | a | 1517.7 | 18.16 | 657.4 | 2.50 | 1.250 | 18.160 | 657.4 | 2.50 | 1.25 | 10.14 | 3.57 | 36.20 |
| P3 | a | 1508.4 | 18.65 | 678.4 | 2.48 | 1.242 | 18.654 | 678.4 | 2.48 | 1.24 | 10.13 | 3.59 | 36.37 |
| P4 | a | 1552.9 | 17.90 | 644.2 | 2.30 | 1.150 | 17.897 | 644.2 | 2.30 | 1.15 | 10.14 | 3.55 | 36.00 |
| P5 | a | 1452.3 | 17.58 | 642.2 | 2.30 | 1.150 | 17.579 | 642.2 | 2.30 | 1.15 | 10.29 | 3.55 | 36.53 |
| P6 | a | 1502.7 | 18.21 | 652.6 | 2.58 | 1.292 | 18.213 | 652.6 | 2.58 | 1.29 | 10.18 | 3.52 | 35.83 |
| Mean value | 1507.2 | 17.70 | 638.4 | 2.28 | 1.139 | 17.699 | 638.4 | 2.28 | 1.14 | - | - | - | |
| Standard deviation | 32.4 | 1.05 | 42.5 | 0.40 | 0.200 | 1.047 | 42.5 | 0.40 | 0.20 | - | - | - | |
| Relative deviation [%] | 2.15 | 5.92 | 6.66 | 17.54 | 17.54 | 5.92 | 6.66 | 17.54 | 17.54 | - | - | - | |
| Sample Number | Curve Type | Et (MPa) | sm (MPa) | FM (N) | em (%) | eM (mm) | sb (MPa) | sB (N) | eb (%) | eB (mm) | b (mm) | h (mm) | A0 (mm2) |
|---|---|---|---|---|---|---|---|---|---|---|---|---|---|
| P1 | a | 1697.3 | 14.46 | 525.1 | 1.24 | 0.620 | 14.455 | 525.1 | 1.24 | 0.62 | 9.98 | 3.64 | 36.33 |
| P2 | a | 1573.2 | 16.34 | 592.8 | 1.74 | 0.872 | 16.345 | 592.8 | 1.74 | 0.87 | 9.91 | 3.66 | 36.27 |
| P3 | a | 1599.2 | 17.61 | 618.4 | 1.99 | 0.995 | 17.614 | 618.4 | 1.99 | 1.00 | 9.78 | 3.59 | 35.11 |
| P4 | a | 1481.3 | 16.23 | 576.5 | 1.59 | 0.794 | 16.137 | 573.3 | 1.59 | 0.79 | 9.68 | 3.67 | 35.53 |
| P5 | a | 1589.4 | 15.35 | 551.9 | 1.44 | 0.720 | 15.352 | 551.9 | 1.44 | 0.72 | 9.69 | 3.71 | 35.95 |
| P6 | a | 1549.7 | 16.31 | 599.0 | 1.60 | 0.798 | 16.276 | 597.6 | 1.60 | 0.80 | 9.87 | 3.72 | 36.72 |
| Mean value | 1581.7 | 16.05 | 577.3 | 1.60 | 0.800 | 16.030 | 576.5 | 1.60 | 0.80 | - | - | - | |
| Standard deviation | 70.6 | 1.06 | 34.0 | 0.26 | 0.128 | 1.060 | 33.8 | 0.26 | 0.13 | - | - | - | |
| Relative deviation [%] | 4.46 | 6.63 | 5.89 | 16.01 | 16.01 | 6.61 | 5.87 | 16.01 | 16.01 | - | - | - | |
| Sample Number | Curve Type | Et (MPa) | sy (MPa) | Fy (N) | ey (%) | eY (mm) | sm (MPa) | sM (N) | em (%) | eM (mm) | sb (MPa) | sB (N) | eb (%) | eB (mm) | b (mm) | h (mm) | A0 (mm2) |
|---|---|---|---|---|---|---|---|---|---|---|---|---|---|---|---|---|---|
| P1 | a | 1484.0 | - | - | - | - | 23.88 | 869.9 | 3.88 | 1.942 | 23.880 | 869.9 | 3.88 | 1.94 | 9.98 | 3.65 | 36.43 |
| P2 | a | 1556.5 | - | - | - | - | 21.07 | 765.5 | 3.28 | 1.638 | 21.069 | 765.5 | 3.28 | 1.64 | 9.9 | 3.67 | 36.33 |
| P3 | c | 1542.1 | 17.54 | 638.0 | 2.14 | 1.071 | 17.54 | 638.0 | 2.14 | 1.071 | 10.456 | 380.3 | 2.89 | 1.45 | 9.91 | 3.67 | 36.37 |
| P4 | a | 1282.4 | - | - | - | - | 21.20 | 778.5 | 3.57 | 1.783 | 21.202 | 778.5 | 3.57 | 1.78 | 9.87 | 3.72 | 36.72 |
| P5 | a | 2039.3 | - | - | - | - | 20.64 | 746.1 | 3.50 | 1.749 | 19.999 | 722.9 | 3.72 | 1.86 | 9.93 | 3.64 | 36.15 |
| P6 | a | 1616.8 | - | - | - | - | 20.87 | 758.9 | 3.55 | 1.776 | 20.867 | 758.9 | 3.55 | 1.78 | 9.91 | 3.67 | 36.37 |
| Mean value | 1586.9 | 17.54 | 638.0 | 2.14 | 1.071 | 20.87 | 759.5 | 3.32 | 1.660 | 19.579 | 712.7 | 3.48 | 1.74 | - | - | - | |
| Standard deviation | 249.7 | - | - | - | - | 2.02 | 74.2 | 0.61 | 0.304 | 4.657 | 170.0 | 0.35 | 0.18 | - | - | - | |
| Relative deviation [%] | 15.74 | - | - | - | - | 9.66 | 9.77 | 18.34 | 18.34 | 23.78 | 23.86 | 10.09 | 10.07 | - | - | - | |
| Sample Number | Curve Type | Et (MPa) | sy (MPa) | Fy (N) | ey (%) | eY (mm) | sm (MPa) | sM (N) | em (%) | eM (mm) | sb (MPa) | sB (N) | eb (%) | eB (mm) | b (mm) | h (mm) | A0 (mm2) |
|---|---|---|---|---|---|---|---|---|---|---|---|---|---|---|---|---|---|
| P1 | a | 924.8 | - | - | - | - | 5.83 | 216.3 | 0.78 | 0.391 | 5.664 | 210.1 | 0.79 | 0.40 | 10 | 3.71 | 37.10 |
| P2 | a | 914.5 | - | - | - | - | 6.01 | 223.4 | 0.93 | 0.464 | 5.663 | 210.3 | 1.01 | 0.50 | 10.01 | 3.71 | 37.14 |
| P3 | c | 1005.8 | 6.24 | 227.9 | 0.86 | 0.429 | 6.24 | 227.9 | 0.86 | 0.429 | 1.246 | 45.5 | 1.82 | 0.91 | 9.95 | 3.67 | 36.52 |
| P4 | c | 909.4 | 6.25 | 229.0 | 1.02 | 0.510 | 6.25 | 229.0 | 1.02 | 0.510 | 1.248 | 45.8 | 1.90 | 0.95 | 9.91 | 3.7 | 36.67 |
| P5 | a | 983.7 | - | - | - | - | 6.89 | 259.1 | 1.13 | 0.565 | 6.647 | 249.9 | 1.19 | 0.60 | 10 | 3.76 | 37.60 |
| P6 | a | 990.5 | - | - | - | - | 6.12 | 219.6 | 0.78 | 0.389 | 5.959 | 213.8 | 0.80 | 0.40 | 9.91 | 3.62 | 35.87 |
| Mean value | 954.8 | 6.24 | 228.5 | 0.94 | 0.469 | 6.22 | 229.2 | 0.92 | 0.458 | 4.404 | 162.6 | 1.25 | 0.63 | - | - | - | |
| Standard deviation | 43.1 | 0.00 | 0.8 | 0.11 | 0.057 | 0.36 | 15.4 | 0.14 | 0.070 | 2.472 | 91.8 | 0.50 | 0.25 | - | - | - | |
| Relative deviation [%] | 4.52 | 0.06 | 0.35 | 12.11 | 12.11 | 5.80 | 6.71 | 15.19 | 15.19 | 56.13 | 56.48 | 39.55 | 39.55 | - | - | - | |
| Sample Number | Curve Type | Et (MPa) | sm (MPa) | FM (N) | em (%) | eM (mm) | sb (MPa) | sB (N) | eb (%) | eB (mm) | b (mm) | h (mm) | A0 (mm2) |
|---|---|---|---|---|---|---|---|---|---|---|---|---|---|
| P1 | a | 2265.6 | 12.65 | 483.4 | 0.64 | 0.318 | 12.545 | 479.2 | 0.64 | 0.32 | 10 | 3.82 | 38.20 |
| P2 | a | 2336.9 | 13.34 | 511.0 | 0.69 | 0.346 | 12.800 | 490.4 | 0.72 | 0.36 | 10.03 | 3.82 | 38.31 |
| P3 | a | 2309.6 | 14.40 | 547.8 | 0.74 | 0.370 | 14.402 | 547.8 | 0.74 | 0.37 | 10.01 | 3.8 | 38.04 |
| P4 | a | 2244.1 | 13.65 | 527.9 | 0.69 | 0.343 | 13.436 | 519.6 | 0.68 | 0.34 | 10.07 | 3.84 | 38.67 |
| P5 | a | 2267.7 | 14.25 | 559.5 | 0.78 | 0.391 | 14.246 | 559.5 | 0.78 | 0.39 | 10.2 | 3.85 | 39.27 |
| P6 | a | 2379.6 | 13.81 | 536.7 | 0.65 | 0.323 | 13.785 | 535.5 | 0.65 | 0.32 | 10.09 | 3.85 | 38.85 |
| Mean value | 2300.6 | 13.68 | 527.7 | 0.70 | 0.348 | 13.536 | 522.0 | 0.70 | 0.35 | - | - | - | |
| Standard deviation | 51.3 | 0.64 | 27.3 | 0.06 | 0.028 | 0.755 | 31.9 | 0.06 | 0.03 | - | - | - | |
| Relative deviation [%] | 2.23 | 4.66 | 5.18 | 8.05 | 8.05 | 5.58 | 6.11 | 8.04 | 8.04 | - | - | - | |
| Sample Number | Curve Type | Et (MPa) | sm (MPa) | FM (N) | em (%) | eM (mm) | sb (MPa) | sB (N) | eb (%) | eB (mm) | b (mm) | h (mm) | A0 (mm2) |
|---|---|---|---|---|---|---|---|---|---|---|---|---|---|
| P1 | a | 2453.1 | 19.15 | 771.9 | 0.95 | 0.474 | 18.830 | 759.1 | 1.03 | 0.51 | 10.18 | 3.96 | 40.31 |
| P2 | a | 2438.1 | 19.44 | 773.0 | 0.96 | 0.480 | 19.041 | 757.2 | 1.08 | 0.54 | 10.17 | 3.91 | 39.76 |
| P3 | a | 2374.3 | 19.21 | 786.4 | 0.95 | 0.474 | 17.708 | 725.1 | 1.19 | 0.59 | 10.16 | 4.03 | 40.94 |
| P4 | a | 2351.4 | 18.78 | 769.8 | 0.90 | 0.451 | 18.776 | 769.8 | 0.90 | 0.45 | 10.25 | 4 | 41.00 |
| P5 | a | 2446.2 | 19.51 | 782.2 | 0.93 | 0.467 | 19.461 | 780.2 | 0.95 | 0.48 | 10.15 | 3.95 | 40.09 |
| P6 | a | 2363.5 | 18.75 | 755.2 | 0.86 | 0.429 | 18.751 | 755.2 | 0.86 | 0.43 | 10.17 | 3.96 | 40.27 |
| Mean value | 2404.4 | 19.14 | 773.1 | 0.92 | 0.462 | 18.761 | 757.8 | 1.00 | 0.50 | - | - | - | |
| Standard deviation | 46.1 | 0.32 | 10.9 | 0.04 | 0.019 | 0.580 | 18.6 | 0.12 | 0.06 | - | - | - | |
| Relative deviation [%] | 1.92 | 1.67 | 1.41 | 4.12 | 4.12 | 3.09 | 2.45 | 12.23 | 12.23 | - | - | - | |
| Sample Number | Curve Type | Et (MPa) | sm (MPa) | FM (N) | em (%) | eM (mm) | sb (MPa) | sB (N) | eb (%) | eB (mm) | b (mm) | h (mm) | A0 (mm2) |
|---|---|---|---|---|---|---|---|---|---|---|---|---|---|
| P1 | a | 930.4 | 6.80 | 248.6 | 0.86 | 0.432 | 6.729 | 245.9 | 0.87 | 0.43 | 9.85 | 3.71 | 36.54 |
| P2 | a | 923.3 | 7.33 | 266.0 | 1.04 | 0.519 | 6.714 | 243.8 | 1.09 | 0.55 | 9.84 | 3.69 | 36.31 |
| P3 | a | 936.5 | 5.46 | 196.1 | 0.67 | 0.334 | 4.349 | 156.1 | 0.64 | 0.32 | 9.78 | 3.67 | 35.89 |
| P4 | a | 896.6 | 6.33 | 227.0 | 0.85 | 0.425 | 6.333 | 227.0 | 0.85 | 0.42 | 9.82 | 3.65 | 35.84 |
| P5 | a | 945.8 | 6.12 | 222.7 | 0.76 | 0.381 | 6.119 | 222.7 | 0.76 | 0.38 | 9.89 | 3.68 | 36.40 |
| P6 | a | 904.8 | 6.38 | 229.3 | 0.88 | 0.438 | 6.378 | 229.3 | 0.88 | 0.44 | 9.85 | 3.65 | 35.95 |
| Mean value | 922.9 | 6.40 | 231.6 | 0.84 | 0.422 | 6.104 | 220.8 | 0.85 | 0.42 | - | - | - | |
| Standard deviation | 18.9 | 0.63 | 23.8 | 0.12 | 0.062 | 0.891 | 33.0 | 0.15 | 0.08 | - | - | - | |
| Relative deviation [%] | 2.05 | 9.83 | 10.28 | 14.71 | 14.71 | 14.60 | 14.96 | 17.72 | 17.72 | - | - | - | |
| Sample Number | Curve Type | Et (MPa) | sm (MPa) | FM (N) | em (%) | eM (mm) | sb (MPa) | sB (N) | eb (%) | eB (mm) | b (mm) | h (mm) | A0 (mm2) |
|---|---|---|---|---|---|---|---|---|---|---|---|---|---|
| P1 | a | 994.1 | 8.87 | 352.3 | 1.74 | 0.872 | 8.847 | 351.4 | 1.81 | 0.91 | 10.03 | 3.96 | 39.72 |
| P2 | a | 1043.2 | 9.59 | 360.6 | 1.68 | 0.838 | 8.960 | 337.1 | 1.82 | 0.91 | 10.06 | 3.74 | 37.62 |
| P3 | a | 1113.7 | 9.44 | 356.1 | 1.70 | 0.852 | 9.283 | 350.2 | 1.79 | 0.89 | 9.98 | 3.78 | 37.72 |
| P4 | a | 1115.3 | 9.50 | 359.0 | 1.47 | 0.733 | 9.368 | 354.0 | 1.50 | 0.75 | 9.97 | 3.79 | 37.79 |
| P5 | a | 986.5 | 9.79 | 371.1 | 1.80 | 0.901 | 9.449 | 358.3 | 1.97 | 0.99 | 9.98 | 3.8 | 37.92 |
| P6 | a | 1066.1 | 9.67 | 361.7 | 1.78 | 0.889 | 9.241 | 345.5 | 1.95 | 0.98 | 9.97 | 3.75 | 37.39 |
| Mean value | 1053.2 | 9.48 | 360.2 | 1.70 | 0.848 | 9.191 | 349.4 | 1.81 | 0.90 | - | - | - | |
| Standard deviation | 56.1 | 0.32 | 6.4 | 0.12 | 0.061 | 0.237 | 7.4 | 0.17 | 0.09 | - | - | - | |
| Relative deviation [%] | 5.32 | 3.39 | 1.76 | 7.14 | 7.14 | 2.58 | 2.11 | 9.43 | 9.43 | - | - | - | |
| Sample Number | Curve Type | Et (MPa) | sm (MPa) | FM (N) | em (%) | eM (mm) | sb (MPa) | sB (N) | eb (%) | eB (mm) | b (mm) | h (mm) | A0 (mm2) |
|---|---|---|---|---|---|---|---|---|---|---|---|---|---|
| P1 | a | 845.8 | 9.29 | 341.8 | 2.19 | 1.096 | 8.707 | 320.4 | 9.92 | 3.71 | 36.80 | ||
| P2 | a | 896.9 | 10.07 | 358.5 | 2.66 | 1.331 | 9.856 | 351.0 | 2.83 | 1.41 | 9.92 | 3.59 | 35.61 |
| P3 | a | 855.9 | 9.77 | 350.7 | 2.11 | 1.054 | 9.581 | 343.9 | 2.17 | 1.09 | 9.97 | 3.6 | 35.89 |
| P4 | a | 908.6 | 9.98 | 358.3 | 2.54 | 1.268 | 9.763 | 350.4 | 2.76 | 1.38 | 9.97 | 3.6 | 35.89 |
| P5 | a | 905.5 | 9.55 | 342.7 | 1.87 | 0.934 | 9.289 | 333.1 | 1.99 | 0.99 | 9.99 | 3.59 | 35.86 |
| P6 | a | 860.9 | 8.95 | 325.2 | 2.04 | 1.018 | 8.746 | 317.7 | 2.20 | 1.10 | 9.98 | 3.64 | 36.33 |
| Mean value | 878.9 | 9.60 | 346.2 | 2.23 | 1.117 | 9.324 | 336.1 | 2.39 | 1.19 | - | - | - | |
| Standard deviation | 27.8 | 0.43 | 12.5 | 0.31 | 0.153 | 0.502 | 14.7 | 0.38 | 0.19 | - | - | - | |
| Relative deviation [%] | 3.16 | 4.44 | 3.62 | 13.65 | 13.65 | 5.38 | 4.37 | 15.86 | 15.86 | - | - | - | |
| Sample Number | Curve Type | Et (MPa) | sm (MPa) | FM (N) | em (%) | eM (mm) | sb (MPa) | sB (N) | eb (%) | eB (mm) | b (mm) | h (mm) | A0 (mm2) |
|---|---|---|---|---|---|---|---|---|---|---|---|---|---|
| P1 | a | 1037.3 | 10.16 | 350.1 | 1.96 | 0.980 | 10.158 | 350.1 | 1.96 | 0.98 | 9.82 | 3.51 | 34.47 |
| P2 | a | 920.6 | 8.65 | 306.6 | 1.43 | 0.713 | 8.555 | 303.2 | 1.42 | 0.71 | 9.9 | 3.58 | 35.44 |
| P3 | a | 835.9 | 9.37 | 344.9 | 2.06 | 1.029 | 9.366 | 344.9 | 2.06 | 1.03 | 9.82 | 3.75 | 36.83 |
| P4 | a | 873.2 | 9.16 | 322.3 | 1.56 | 0.779 | 9.161 | 322.3 | 1.56 | 0.78 | 9.8 | 3.59 | 35.18 |
| P5 | a | 825.4 | 7.34 | 258.4 | 1.11 | 0.556 | 7.224 | 254.3 | 1.12 | 0.56 | 9.78 | 3.6 | 35.21 |
| P6 | a | 840.7 | 8.70 | 307.7 | 1.52 | 0.760 | 8.541 | 302.0 | 1.53 | 0.77 | 9.85 | 3.59 | 35.36 |
| Mean value | 888.9 | 8.90 | 315.0 | 1.61 | 0.803 | 8.834 | 312.8 | 1.61 | 0.80 | - | - | - | |
| Standard deviation | 80.5 | 0.94 | 33.2 | 0.35 | 0.175 | 0.990 | 35.1 | 0.35 | 0.17 | - | - | - | |
| Relative deviation [%] | 9.06 | 10.55 | 10.54 | 21.85 | 21.85 | 11.21 | 11.20 | 21.68 | 21.68 | - | - | - | |
| Sample Number | Curve Type | Et (MPa) | sm (MPa) | FM (N) | em (%) | eM (mm) | sb (MPa) | sB (N) | eb (%) | eB (mm) | b (mm) | h (mm) | A0 (mm2) |
|---|---|---|---|---|---|---|---|---|---|---|---|---|---|
| P1 | a | 814.3 | 9.52 | 338.5 | 1.85 | 0.925 | 9.351 | 332.6 | 1.87 | 0.93 | 9.88 | 3.6 | 35.57 |
| P2 | a | 884.0 | 10.31 | 367.3 | 2.43 | 1.217 | 10.310 | 367.3 | 2.43 | 1.22 | 9.84 | 3.62 | 35.62 |
| P3 | a | 876.0 | 9.93 | 352.6 | 2.05 | 1.027 | 9.499 | 337.4 | 2.12 | 1.06 | 9.84 | 3.61 | 35.52 |
| P4 | a | 860.8 | 10.19 | 364.3 | 2.35 | 1.174 | 10.037 | 358.8 | 2.40 | 1.20 | 9.82 | 3.64 | 35.74 |
| P5 | a | 855.1 | 9.66 | 343.3 | 1.97 | 0.983 | 9.663 | 343.3 | 1.97 | 0.98 | 9.95 | 3.57 | 35.52 |
| P6 | a | 840.7 | 9.58 | 338.5 | 2.03 | 1.015 | 9.449 | 333.7 | 2.08 | 1.04 | 9.92 | 3.56 | 35.32 |
| Mean value | 855.1 | 9.87 | 350.7 | 2.11 | 1.057 | 9.718 | 345.5 | 2.15 | 1.07 | - | - | - | |
| Standard deviation | 25.2 | 0.33 | 12.8 | 0.23 | 0.114 | 0.377 | 14.3 | 0.23 | 0.11 | - | - | - | |
| Relative deviation [%] | 2.95 | 3.36 | 3.64 | 10.77 | 10.77 | 3.88 | 4.15 | 10.61 | 10.61 | - | - | - | |
| Sample Number | Curve Type | Et (MPa) | sy (MPa) | Fy (N) | ey (%) | eY (mm) | sm (MPa) | sM (N) | em (%) | eM (mm) | sb (MPa) | sB (N) | eb (%) | eB (mm) | b (mm) | h (mm) | A0 (mm2) |
|---|---|---|---|---|---|---|---|---|---|---|---|---|---|---|---|---|---|
| P1 | c | 830.6 | - | - | - | - | 9.47 | 332.6 | 1.85 | 0.925 | 9.368 | 329.0 | 1.86 | 0.93 | 10.15 | 3.46 | 35.12 |
| P2 | c | 830.7 | - | - | - | - | 10.35 | 384.5 | 2.52 | 1.260 | 10.120 | 375.8 | 2.67 | 1.34 | 10.2 | 3.64 | 37.13 |
| P3 | c | 877.0 | - | - | - | - | 9.48 | 333.7 | 1.81 | 0.903 | 9.302 | 327.6 | 1.85 | 0.92 | 10.18 | 3.46 | 35.22 |
| P4 | c | 837.6 | - | - | - | - | 9.35 | 338.8 | 1.82 | 0.910 | 9.174 | 332.5 | 1.85 | 0.93 | 10.21 | 3.55 | 36.25 |
| P5 | c | 847.8 | 10.21 | 369.3 | 2.53 | 1.263 | 10.21 | 369.3 | 2.53 | 1.263 | 7.597 | 274.7 | 3.20 | 1.60 | 10.3 | 3.51 | 36.15 |
| P6 | c | 904.5 | - | - | - | - | 9.47 | 350.5 | 1.58 | 0.788 | 9.347 | 345.9 | 1.62 | 0.81 | 10.25 | 3.61 | 37.00 |
| Mean value | 854.7 | 10.21 | 369.3 | 2.53 | 1.263 | 9.72 | 351.6 | 2.02 | 1.008 | 9.151 | 330.9 | 2.18 | 1.09 | - | - | - | |
| Standard deviation | 29.9 | - | - | - | - | 0.44 | 21.2 | 0.40 | 0.202 | 0.832 | 32.9 | 0.62 | 0.31 | - | - | - | |
| Relative deviation [%] | 3.50 | - | - | - | - | 4.53 | 6.02 | 20.05 | 20.05 | 9.09 | 9.95 | 28.47 | 28.47 | - | - | - | |
| Sample Number | Curve Type | Et (MPa) | sy (MPa) | Fy (N) | ey (%) | eY (mm) | sm (MPa) | sM (N) | em (%) | eM (mm) | sb (MPa) | sB (N) | eb (%) | eB (mm) | b (mm) | h (mm) | A0 (mm2) |
|---|---|---|---|---|---|---|---|---|---|---|---|---|---|---|---|---|---|
| P1 | a | 836.5 | - | - | - | - | 12.51 | 435.6 | 3.64 | 1.818 | 12.512 | 435.6 | 3.64 | 1.82 | 9.89 | 3.52 | 34.81 |
| P2 | a | 845.2 | - | - | - | - | 11.75 | 415.5 | 2.79 | 1.393 | 11.689 | 413.3 | 2.82 | 1.41 | 9.96 | 3.55 | 35.36 |
| P3 | a | 845.3 | - | - | - | - | 12.43 | 428.7 | 3.20 | 1.600 | 12.178 | 419.9 | 3.34 | 1.67 | 9.88 | 3.49 | 34.48 |
| P4 | c | 864.0 | 12.92 | 447.9 | 3.66 | 1.829 | 12.92 | 447.9 | 3.66 | 1.829 | 12.453 | 431.8 | 4.27 | 2.13 | 9.85 | 3.52 | 34.67 |
| P5 | a | 814.7 | - | - | - | - | 11.07 | 384.1 | 2.23 | 1.113 | 11.066 | 384.1 | 2.23 | 1.11 | 9.86 | 3.52 | 34.71 |
| P6 | a | 870.5 | - | - | - | - | 12.35 | 432.6 | 3.27 | 1.636 | 12.043 | 421.7 | 3.35 | 1.68 | 9.92 | 3.53 | 35.02 |
| Mean value | 846.0 | 12.92 | 447.9 | 3.66 | 1.829 | 12.17 | 424.0 | 3.13 | 1.565 | 11.990 | 417.7 | 3.27 | 1.64 | - | - | - | |
| Standard deviation | 20.0 | - | - | - | - | 0.66 | 22.2 | 0.55 | 0.273 | 0.542 | 18.4 | 0.70 | 0.35 | - | - | - | |
| Relative deviation [%] | 2.36 | - | - | - | - | 5.42 | 5.24 | 17.48 | 17.48 | 4.52 | 4.40 | 21.31 | 21.31 | - | - | - | |
| Sample Number | Curve Type | Et (MPa) | sy (MPa) | Fy (N) | ey (%) | eY (mm) | sm (MPa) | sM (N) | em (%) | eM (mm) | sb (MPa) | sB (N) | eb (%) | eB (mm) | b (mm) | h (mm) | A0 (mm2) |
|---|---|---|---|---|---|---|---|---|---|---|---|---|---|---|---|---|---|
| P1 | a | 924.8 | - | - | - | - | 5.83 | 216.3 | 0.78 | 0.391 | 5.664 | 210.1 | 0.79 | 0.40 | 10 | 3.71 | 37.10 |
| P2 | a | 914.5 | - | - | - | - | 6.01 | 223.4 | 0.93 | 0.464 | 5.663 | 210.3 | 1.01 | 0.50 | 10.01 | 3.71 | 37.14 |
| P3 | c | 1005.8 | 6.24 | 227.9 | 0.86 | 0.429 | 6.24 | 227.9 | 0.86 | 0.429 | 1.246 | 45.5 | 1.82 | 0.91 | 9.95 | 3.67 | 36.52 |
| P4 | c | 909.4 | 6.25 | 229.0 | 1.02 | 0.510 | 6.25 | 229.0 | 1.02 | 0.510 | 1.248 | 45.8 | 1.90 | 0.95 | 9.91 | 3.7 | 36.67 |
| P5 | c | 983.7 | - | - | - | - | 6.89 | 259.1 | 1.13 | 0.565 | 6.647 | 249.9 | 1.19 | 0.60 | 10 | 3.76 | 37.60 |
| P6 | a | 990.5 | − | - | - | - | 6.12 | 219.6 | 0.78 | 0.389 | 5.959 | 213.8 | 0.80 | 0.40 | 9.91 | 3.62 | 35.87 |
| Mean value | 954.8 | 6.24 | 228.5 | 0.94 | 0.469 | 6.22 | 229.2 | 0.92 | 0.458 | 4.404 | 162.6 | 1.25 | 0.63 | − | − | − | |
| Standard deviation | 43.1 | 0.00 | 0.8 | 0.11 | 0.057 | 0.36 | 15.4 | 0.14 | 0.070 | 2.472 | 91.8 | 0.50 | 0.25 | − | − | − | |
| Relative deviation [%] | 4.52 | 0.06 | 0.35 | 12.11 | 12.11 | 5.80 | 6.71 | 15.19 | 15.19 | 56.13 | 56.48 | 39.55 | 39.55 | − | − | − | |
| Sample Number | Curve Type | Et (MPa) | sm (MPa) | FM (N) | em (%) | eM (mm) | sb (MPa) | sB (N) | eb (%) | eB (mm) | b (mm) | h (mm) | A0 (mm2) |
|---|---|---|---|---|---|---|---|---|---|---|---|---|---|
| P1 | a | 930.4 | 6.80 | 248.6 | 0.86 | 0.432 | 6.803 | 248.6 | 0.86 | 0.43 | 9.85 | 3.71 | 36.54 |
| P2 | a | 923.3 | 7.33 | 266.0 | 1.04 | 0.519 | 7.327 | 266.0 | 1.04 | 0.52 | 9.84 | 3.69 | 36.31 |
| P3 | a | 936.5 | 5.46 | 196.1 | 0.67 | 0.334 | 5.465 | 196.1 | 0.67 | 0.33 | 9.78 | 3.67 | 35.89 |
| P4 | a | 896.6 | 6.33 | 227.0 | 0.85 | 0.425 | 6.333 | 227.0 | 0.85 | 0.42 | 9.82 | 3.65 | 35.84 |
| P5 | a | 945.8 | 6.12 | 222.7 | 0.76 | 0.381 | 6.119 | 222.7 | 0.76 | 0.38 | 9.89 | 3.68 | 36.40 |
| P6 | a | 904.8 | 6.38 | 229.3 | 0.88 | 0.438 | 6.378 | 229.3 | 0.88 | 0.44 | 9.85 | 3.65 | 35.95 |
| Mean value | 922.9 | 6.40 | 231.6 | 0.84 | 0.422 | 6.404 | 231.6 | 0.84 | 0.42 | − | − | − | |
| Standard deviation | 18.9 | 0.63 | 23.8 | 0.12 | 0.062 | 0.629 | 23.8 | 0.12 | 0.06 | − | − | − | |
| Relative deviation [%] | 2.05 | 9.83 | 10.28 | 14.71 | 14.71 | 9.83 | 10.28 | 14.71 | 14.71 | − | − | − | |
Appendix G. Bulk Densities
| Material | P_PE | P_C,PE | P_W,PE | P_W,C,PE | ||||
|---|---|---|---|---|---|---|---|---|
| Sample Number | Net Mass (g) | Bulk Density (g/cm3) | Net Mass (g) | Bulk Density (g/cm3) | Net Mass (g) | Bulk Density (g/cm3) | Net Mass (g) | Bulk Density (g/cm3) |
| P1 | 8.486 | 0.0849 | 48.996 | 0.4900 | 7.272 | 0.0727 | 48.983 | 0.4898 |
| P2 | 8.237 | 0.0824 | 48.538 | 0.4854 | 7.373 | 0.0737 | 48.992 | 0.4899 |
| P3 | 8.178 | 0.0818 | 49.016 | 0.4902 | 7.466 | 0.0747 | 49.069 | 0.4907 |
| P4 | 8.211 | 0.0821 | 48.050 | 0.4805 | 7.192 | 0.0719 | 50.302 | 0.5030 |
| P5 | 7.854 | 0.0785 | 48.420 | 0.4842 | 6.891 | 0.0689 | 49.531 | 0.4953 |
| Material | P_PP | P_C,PP | P_W,PP | P_W,C,PP | ||||
|---|---|---|---|---|---|---|---|---|
| Sample Number | Net Mass (g) | Bulk Density (g/cm3) | Net Mass (g) | Bulk Density (g/cm3) | Net Mass (g) | Bulk Density (g/cm3) | Net Mass (g) | Bulk Density (g/cm3) |
| P1 | 16.825 | 0.1683 | 43.877 | 0.4388 | 15.463 | 0.1546 | 46.074 | 0.4607 |
| P2 | 16.368 | 0.1637 | 44.926 | 0.4493 | 15.625 | 0.1563 | 47.104 | 0.4710 |
| P3 | 17.537 | 0.1754 | 43.697 | 0.4370 | 15.075 | 0.1508 | 46.296 | 0.4630 |
| P4 | 15.492 | 0.1549 | 44.057 | 0.4406 | 15.196 | 0.1520 | 47.222 | 0.4722 |
| P5 | 15.415 | 0.1542 | 43.769 | 0.4377 | 14.955 | 0.1496 | 46.712 | 0.4671 |
| Material | P_PS | P_W,PS | P_W,PS | PS_W,C,PS | ||||
|---|---|---|---|---|---|---|---|---|
| Sample Number | Net Mass (g) | Bulk Density (g/cm3) | Net Mass (g) | Bulk Density (g/cm3) | Net Mass (g) | Bulk Density (g/cm3) | Net Mass (g) | Bulk Density (g/cm3) |
| P1 | 16.986 | 0.1699 | 26.825 | 0.2683 | 16.369 | 0.1637 | 28.51 | 0.2851 |
| P2 | 16.08 | 0.1608 | 27.184 | 0.2718 | 17.167 | 0.1717 | 28.062 | 0.2806 |
| P3 | 16.506 | 0.1651 | 26.986 | 0.2699 | 14.616 | 0.1462 | 27.355 | 0.2736 |
| P4 | 15.464 | 0.1546 | 27.859 | 0.2786 | 16.297 | 0.1630 | 27.326 | 0.2733 |
| P5 | 16.216 | 0.1622 | 27.357 | 0.2736 | 14.762 | 0.1476 | 28.576 | 0.2858 |
| Material | PO_A | PO_A,C | PO_A,W | PO_A,W,C | ||||
|---|---|---|---|---|---|---|---|---|
| Sample Number | Net Mass (g) | Bulk Density (g/cm3) | Net Mass (g) | Bulk Density (g/cm3) | Net Mass (g) | Bulk Density (g/cm3) | Net Mass (g) | Bulk Density (g/cm3) |
| P1 | 6.955 | 0.0696 | 40.454 | 0.4045 | 7.046 | 0.0705 | 46.537 | 0.4654 |
| P2 | 7.202 | 0.0720 | 39.489 | 0.3949 | 6.758 | 0.0676 | 45.656 | 0.4566 |
| P3 | 7.133 | 0.0713 | 40.002 | 0.4000 | 6.483 | 0.0648 | 45.822 | 0.4582 |
| P4 | 6.671 | 0.0667 | 39.872 | 0.3987 | 6.574 | 0.0657 | 45.478 | 0.4548 |
| P5 | 7.091 | 0.0709 | 40.090 | 0.4009 | 6.640 | 0.0664 | 44.83 | 0.4483 |
| Material | PO_B | PO_B,C | P | P_C | ||||
|---|---|---|---|---|---|---|---|---|
| Sample Number | Net Mass (g) | Bulk Density (g/cm3) | Net Mass (g) | Bulk Density (g/cm3) | Net Mass (g) | Bulk Density (g/cm3) | Net Mass (g) | Bulk Density (g/cm3) |
| P1 | 8.944 | 0.0894 | 47.328 | 0.4733 | 10.362 | 0.1036 | 44.022 | 0.4402 |
| P2 | 8.805 | 0.0881 | 48.663 | 0.4866 | 11.124 | 0.1112 | 44.705 | 0.4471 |
| P3 | 9.143 | 0.0914 | 48.607 | 0.4861 | 11.679 | 0.1168 | 44.073 | 0.4407 |
| P4 | 9.586 | 0.0959 | 47.541 | 0.4754 | 12.066 | 0.1207 | 44.469 | 0.4447 |
| P5 | 9.452 | 0.0945 | 47.759 | 0.4776 | 11.326 | 0.1133 | 44.847 | 0.4485 |
| Material | P_PET | P_W,PET | ||
|---|---|---|---|---|
| Sample Number | Net Mass (g) | Bulk Density (g/cm3) | Net Mass (g) | Bulk Density (g/cm3) |
| P1 | 24.481 | 0.2448 | 18.762 | 0.1876 |
| P2 | 24.018 | 0.2402 | 16.966 | 0.1697 |
| P3 | 23.101 | 0.2310 | 19.372 | 0.1937 |
| P4 | 24.342 | 0.2434 | 18.594 | 0.1859 |
| P5 | 24.587 | 0.2459 | 17.674 | 0.1767 |
| Mean value | 0.2411 | 0.1827 | ||
| Standard deviation | 0.0060 | 0.0095 | ||
Appendix H. Ash Contents
| Sample Identification | Crucible Empty (g) | Crucible and Sample (g) | Crucible Containing Ash (g) | Ignition Residue (g) | Ash Content (AC) (%) | Mean Value AC (%) | Relative Deviation (%) |
|---|---|---|---|---|---|---|---|
| P_PE | 36.81 | 38.90 | 36.89 | 0.086 | 4.08 | 4.40 | 0.37 |
| P_PE | 38.59 | 40.46 | 38.67 | 0.081 | 4.32 | ||
| P_PE | 36.51 | 38.92 | 36.62 | 0.116 | 4.81 | ||
| P_W,PE | 34.33 | 36.30 | 34.37 | 0.046 | 2.31 | 2.40 | 0.08 |
| P_W,PE | 38.15 | 40.07 | 38.19 | 0.048 | 2.48 | ||
| P_W,PE | 33.20 | 34.84 | 33.24 | 0.039 | 2.40 | ||
| P_C,PE | 32.97 | 34.58 | 33.03 | 0.063 | 3.89 | 3.93 | 0.14 |
| P_C,PE | 38.04 | 39.99 | 38.12 | 0.080 | 4.09 | ||
| P_C,PE | 36.40 | 38.01 | 36.46 | 0.061 | 3.81 | ||
| P_W,C,PE | 32.72 | 34.60 | 32.77 | 0.044 | 2.32 | 2.40 | 0.08 |
| P_W,C,PE | 39.22 | 40.96 | 39.26 | 0.043 | 2.47 | ||
| P_W,C,PE | 34.45 | 36.01 | 34.48 | 0.038 | 2.43 | ||
| P_PP | 34.92 | 37.02 | 34.96 | 0.045 | 2.16 | 2.41 | 0.23 |
| P_PP | 34.89 | 36.85 | 34.94 | 0.051 | 2.60 | ||
| P_PP | 35.70 | 38.24 | 35.76 | 0.063 | 2.48 | ||
| P_W,PP | 32.67 | 34.59 | 32.72 | 0.045 | 2.37 | 2.39 | 0.59 |
| P_W,PP | 35.33 | 37.33 | 35.39 | 0.060 | 3.00 | ||
| P_W,PP | 37.50 | 39.66 | 37.53 | 0.040 | 1.82 | ||
| P_C,PP | 34.98 | 37.00 | 35.04 | 0.059 | 2.91 | 2.67 | 0.23 |
| P_C,PP | 39.22 | 41.00 | 39.26 | 0.044 | 2.46 | ||
| P_C,PP | 31.23 | 32.67 | 31.27 | 0.038 | 2.63 | ||
| P_W,C,PP | 34.86 | 36.70 | 34.89 | 0.032 | 1.72 | 1.68 | 0.10 |
| P_W,C,PP | 34.98 | 36.63 | 35.01 | 0.026 | 1.57 | ||
| P_W,C,PP | 35.64 | 37.28 | 35.67 | 0.029 | 1.77 | ||
| P_PS | 39.17 | 41.17 | 39.25 | 0.083 | 4.17 | 4.59 | 0.50 |
| P_PS | 32.72 | 34.65 | 32.81 | 0.086 | 4.46 | ||
| P_PS | 39.48 | 40.96 | 39.55 | 0.076 | 5.14 | ||
| P_W,PS | 33.10 | 35.11 | 33.17 | 0.071 | 3.53 | 3.36 | 0.60 |
| P_W,PS | 39.98 | 40.94 | 40.01 | 0.026 | 2.69 | ||
| P_W,PS | 37.68 | 39.95 | 37.77 | 0.088 | 3.85 | ||
| P_C,PS | 39.48 | 41.24 | 39.56 | 0.088 | 4.97 | 4.98 | 0.05 |
| P_C,PS | 39.04 | 41.02 | 39.14 | 0.100 | 5.04 | ||
| P_C,PS | 31.23 | 33.28 | 31.33 | 0.101 | 4.94 | ||
| P_W,C,PS | 38.81 | 40.94 | 38.88 | 0.078 | 3.63 | 3.63 | 0.11 |
| P_W,C,PS | 39.81 | 41.94 | 39.88 | 0.075 | 3.53 | ||
| P_W,C,PS | 33.64 | 35.25 | 33.70 | 0.060 | 3.74 | ||
| PO_A | 34.55 | 36.60 | 34.67 | 0.127 | 6.18 | 6.25 | 0.07 |
| PO_A | 33.56 | 35.43 | 33.68 | 0.118 | 6.32 | ||
| PO_A | 39.06 | 41.03 | 39.18 | 0.124 | 6.27 | ||
| PO_A,W | 36.39 | 38.37 | 36.47 | 0.082 | 4.13 | 4.15 | 0.01 |
| PO_A,W | 34.48 | 36.53 | 34.56 | 0.085 | 4.16 | ||
| PO_A,W | 32.13 | 34.51 | 32.23 | 0.099 | 4.15 | ||
| PO_A,C | 33.17 | 35.05 | 33.28 | 0.110 | 5.90 | 5.81 | 0.08 |
| PO_A,C | 34.10 | 35.73 | 34.19 | 0.094 | 5.76 | ||
| PO_A,C | 39.17 | 40.54 | 39.25 | 0.079 | 5.78 | ||
| PO_A,W,C | 37.67 | 39.67 | 37.76 | 0.082 | 4.12 | 3.92 | 0.21 |
| PO_A,W,C | 40.03 | 41.28 | 40.08 | 0.050 | 3.96 | ||
| PO_A,W,C | 33.37 | 34.51 | 33.42 | 0.042 | 3.70 | ||
| PO_B | 38.58 | 40.23 | 38.62 | 0.036 | 2.20 | 2.21 | 0.10 |
| PO_B | 33.44 | 35.33 | 33.48 | 0.040 | 2.12 | ||
| PO_B | 37.67 | 39.87 | 37.72 | 0.051 | 2.31 | ||
| PO_B,C | 39.04 | 40.77 | 39.08 | 0.043 | 2.46 | 2.45 | 0.05 |
| PO_B,C | 34.44 | 36.07 | 34.48 | 0.040 | 2.48 | ||
| PO_B,C | 35.64 | 36.95 | 35.67 | 0.031 | 2.40 | ||
| P | 33.41 | 35.43 | 33.59 | 0.176 | 8.71 | 8.41 | 0.41 |
| P | 34.53 | 36.85 | 34.72 | 0.184 | 7.95 | ||
| P | 33.53 | 36.45 | 33.78 | 0.251 | 8.57 | ||
| P_C | 36.54 | 38.42 | 36.67 | 0.122 | 6.47 | 6.19 | 0.51 |
| P_C | 38.43 | 40.20 | 38.54 | 0.115 | 6.48 | ||
| P_C | 38.59 | 39.76 | 38.66 | 0.065 | 5.60 |
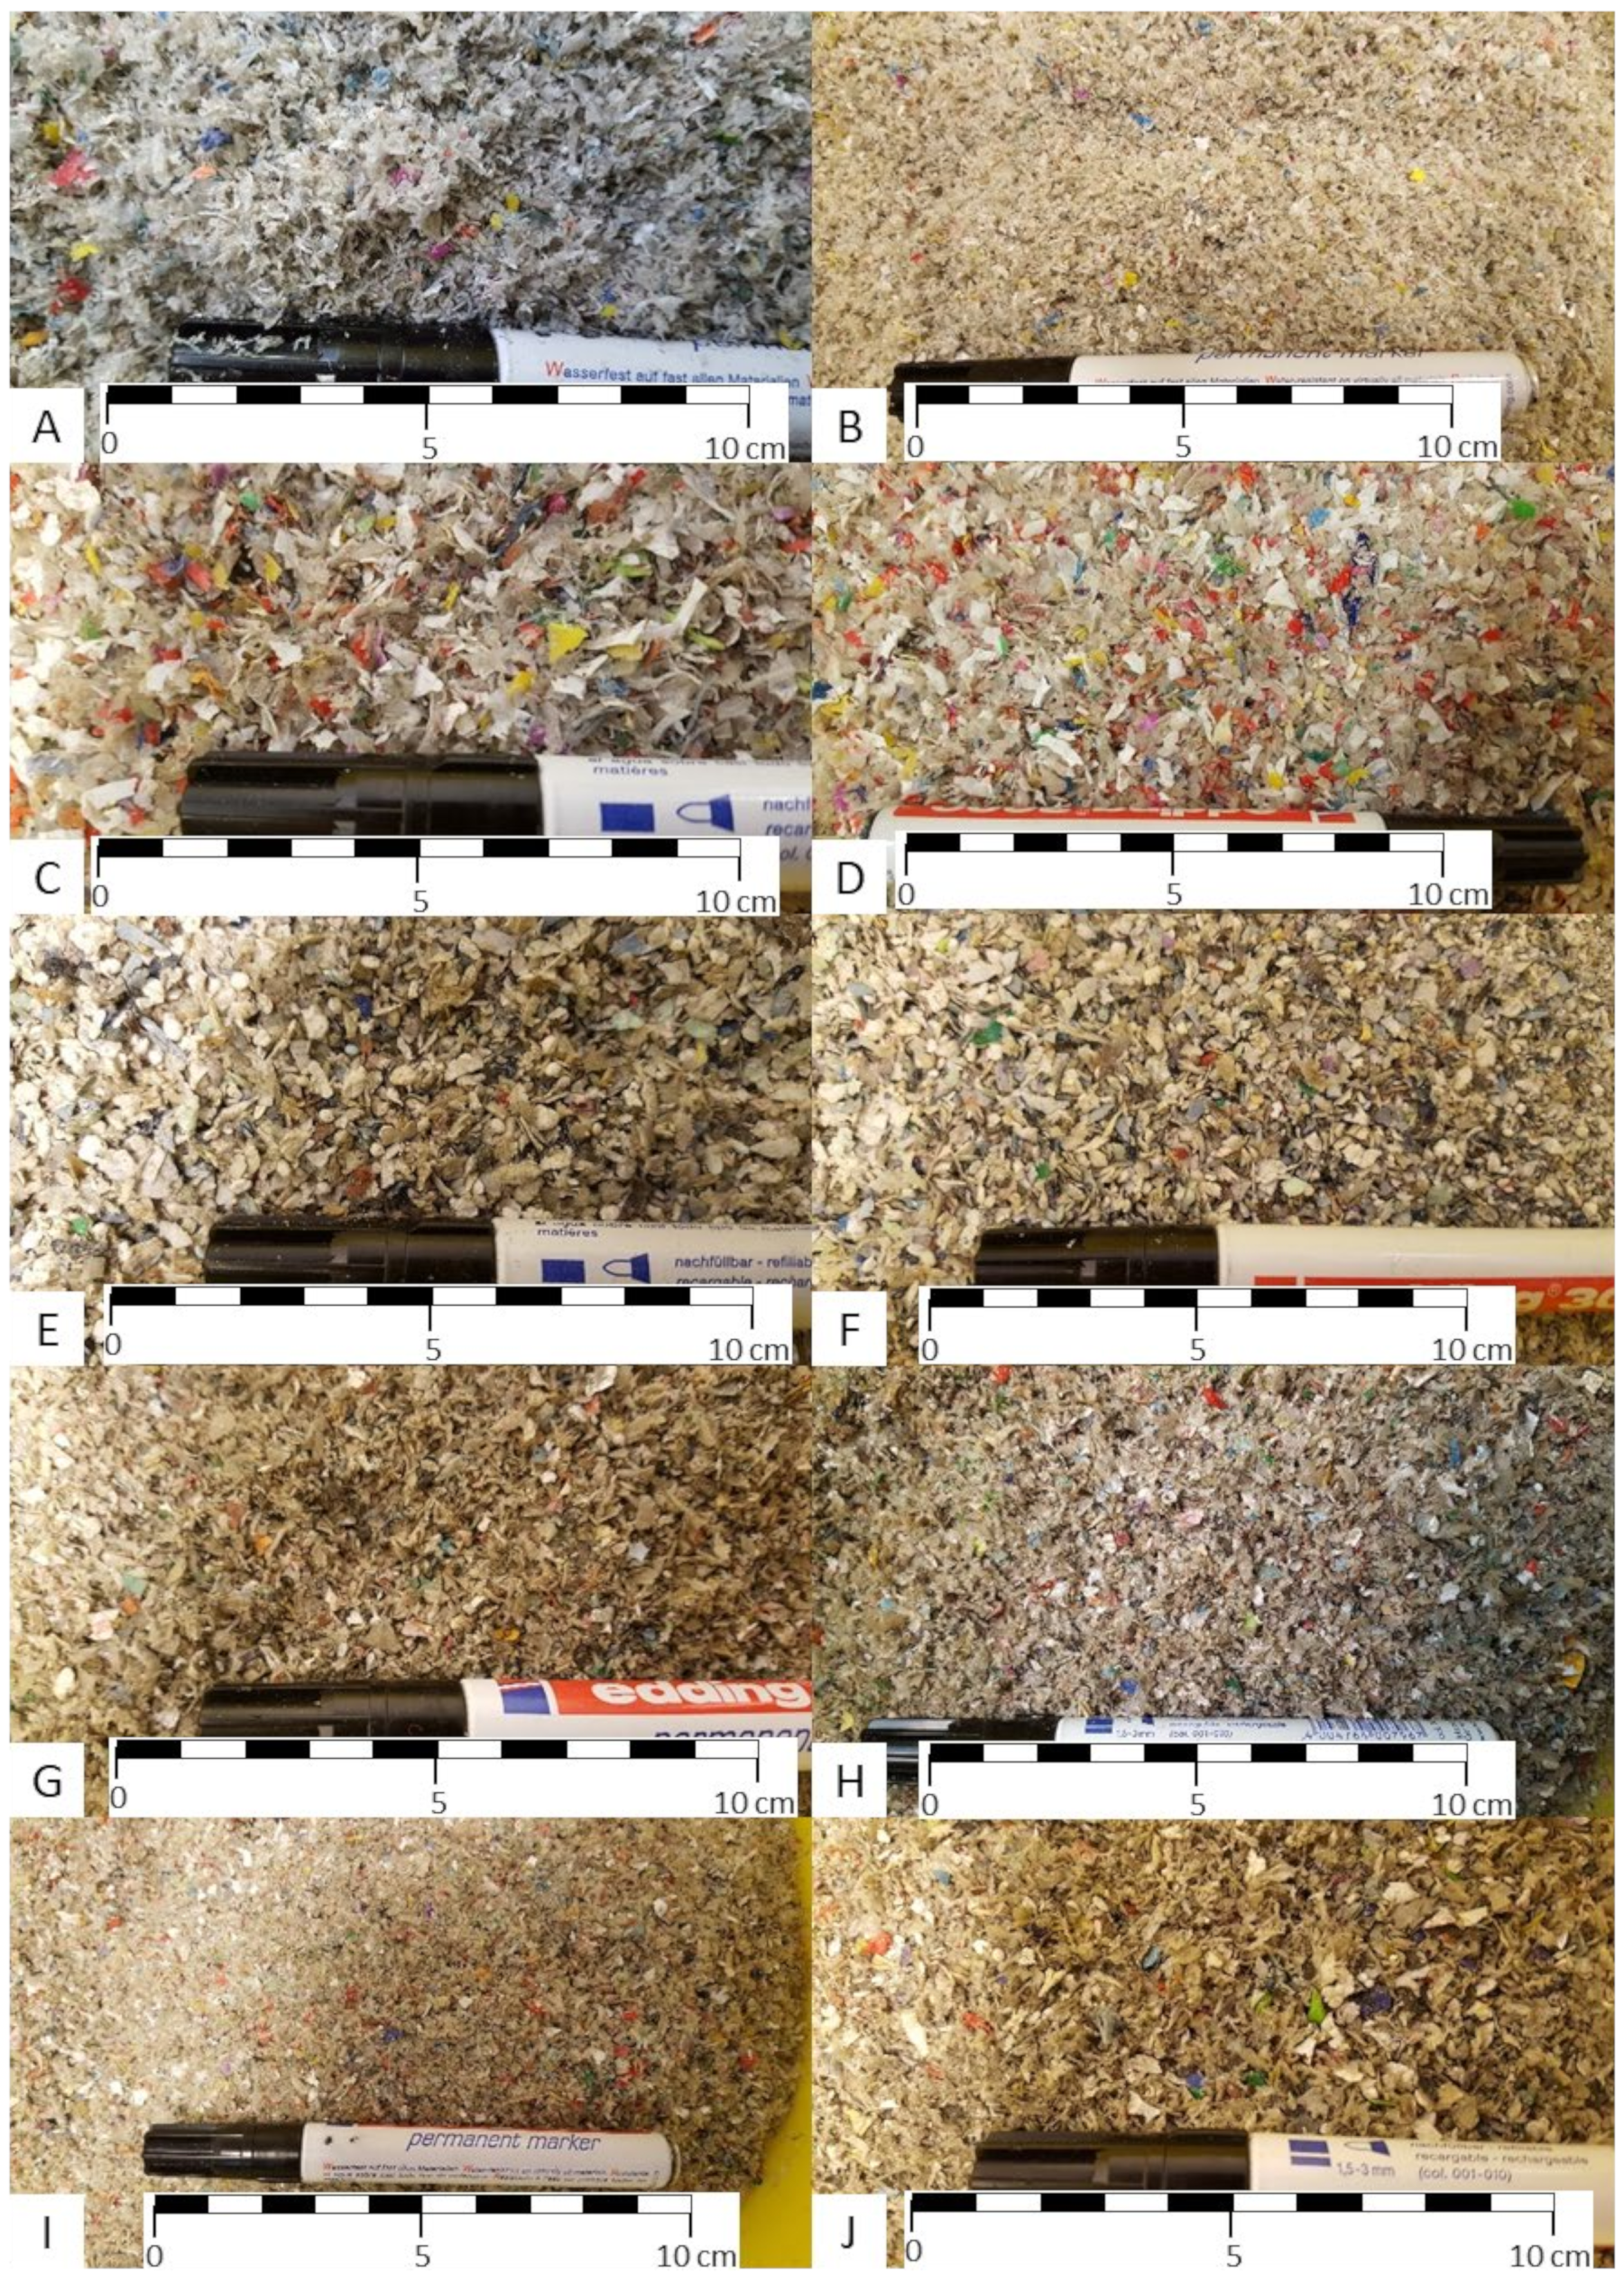
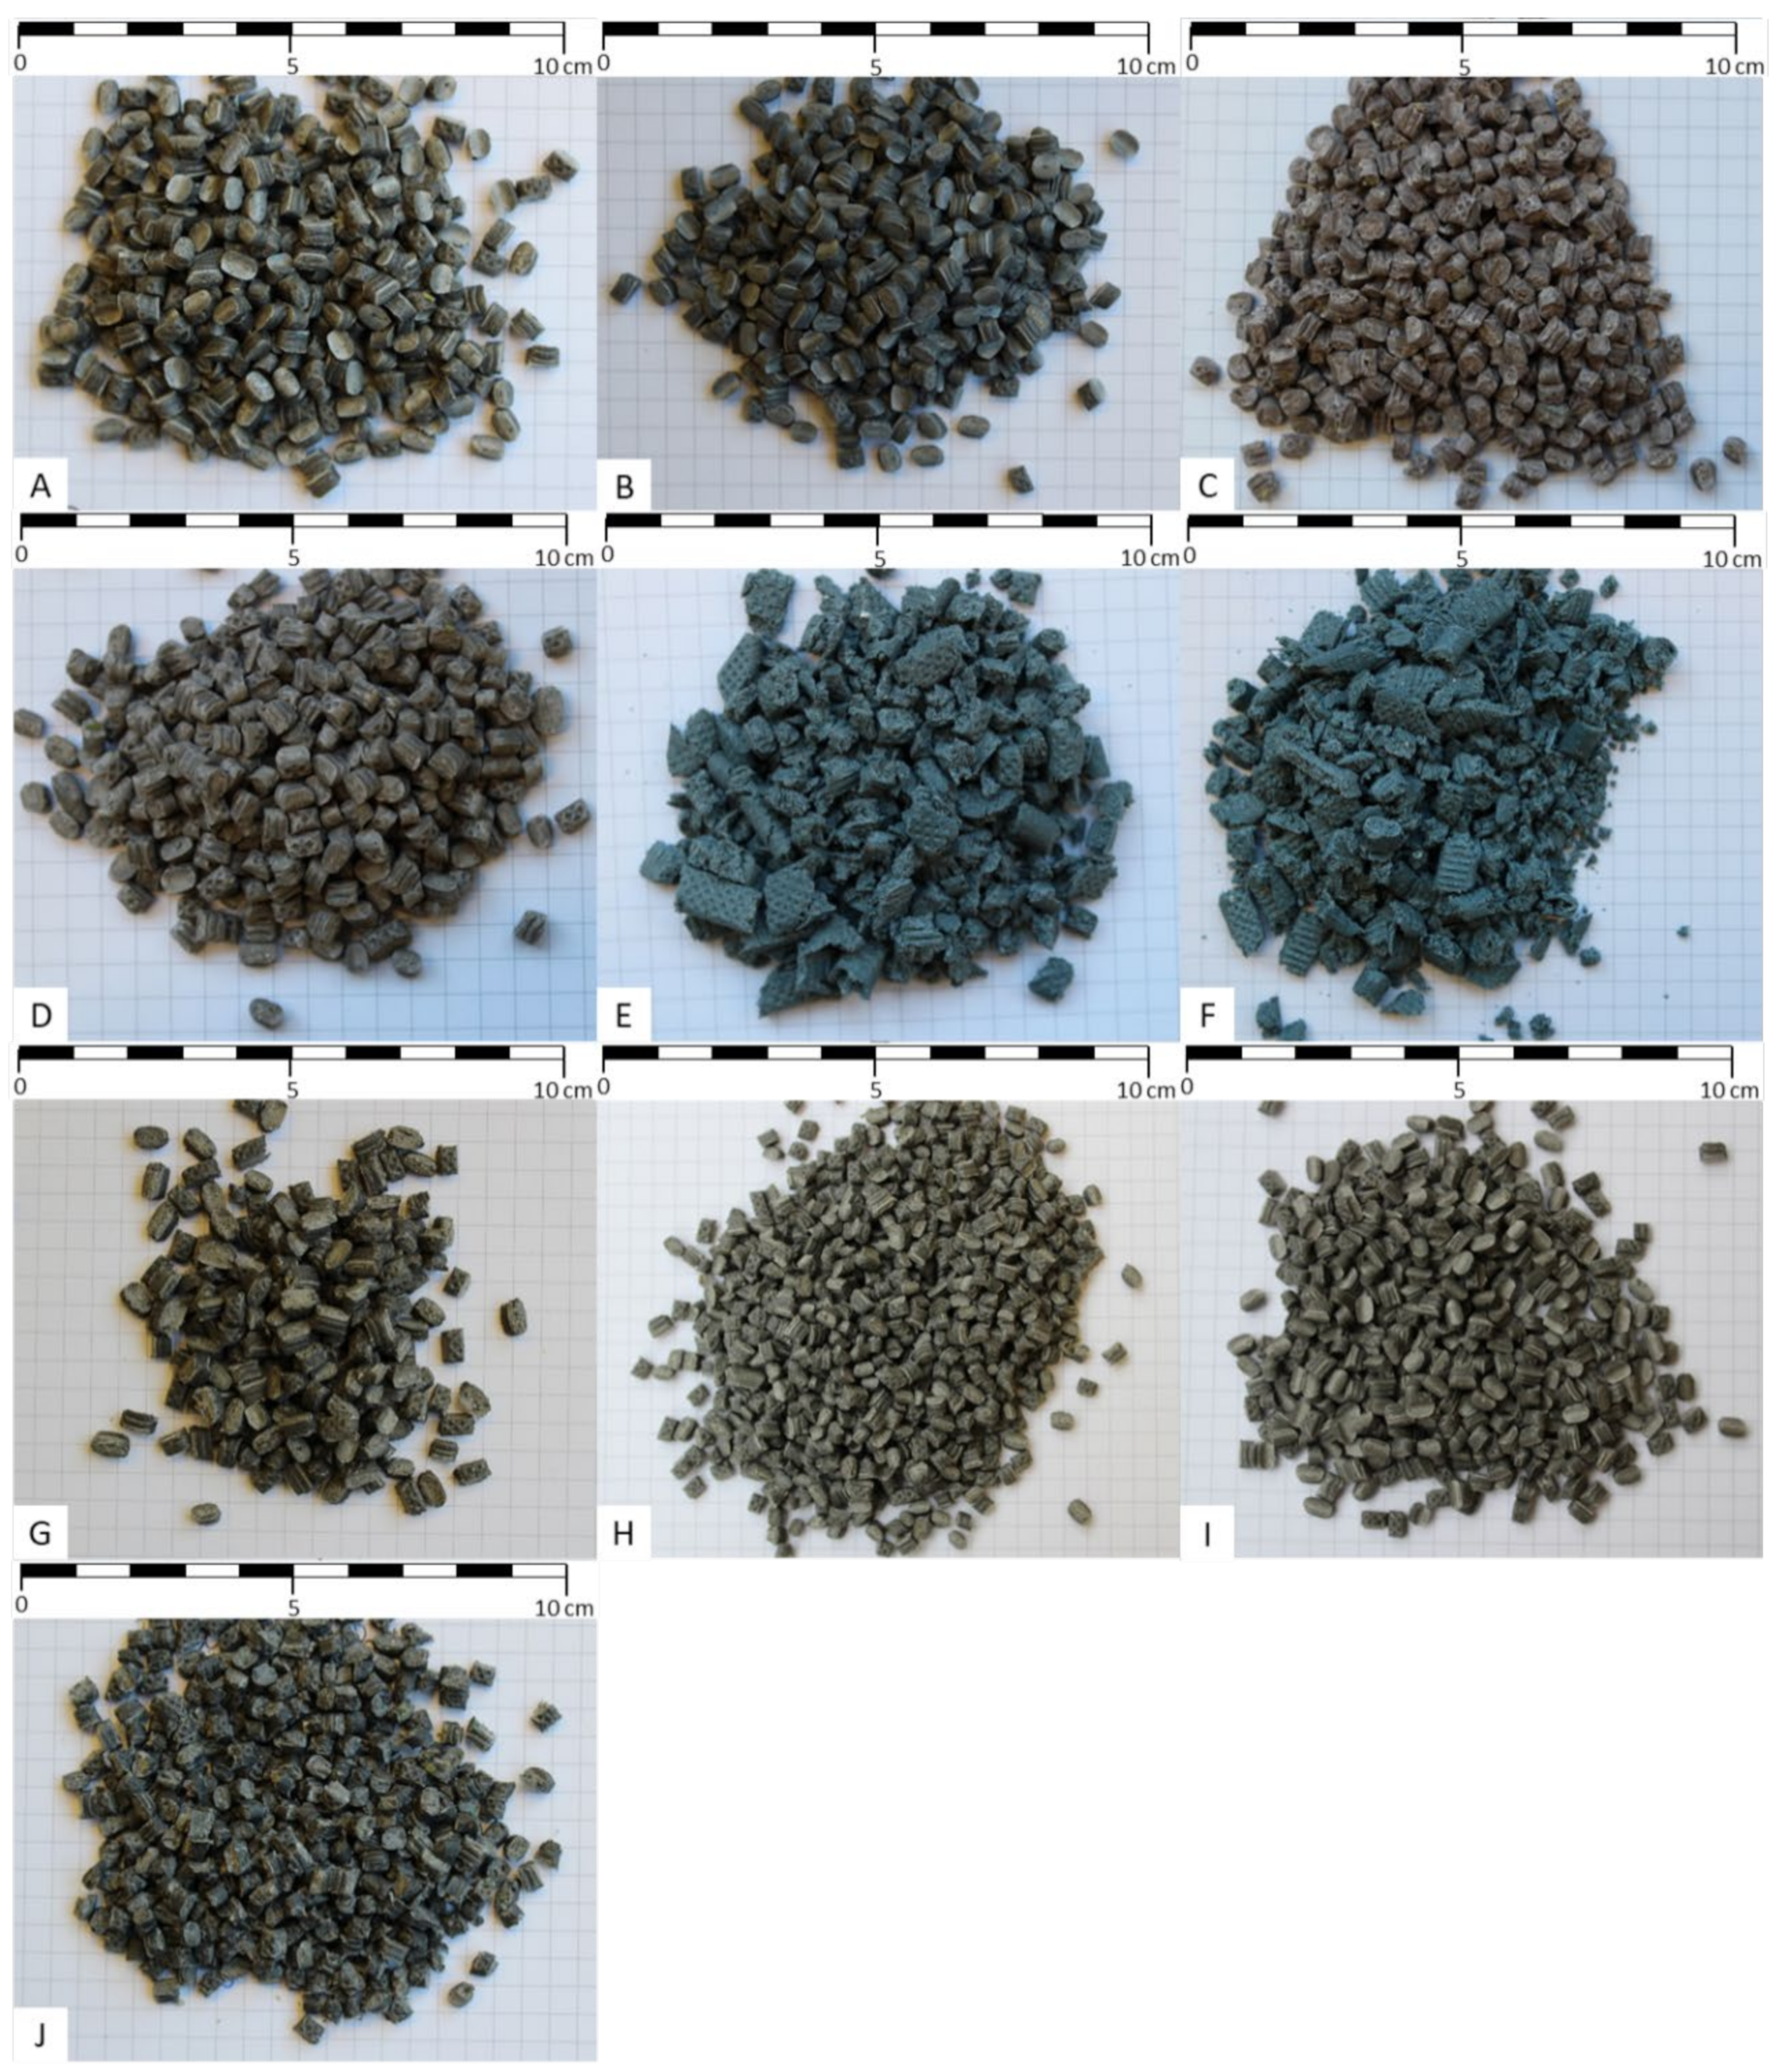
Appendix I. Exemplary Material Photos


Appendix J. Application Options
| Material | Processability | Potential Products for Application |
|---|---|---|
| P_PE | compression moulding | distribution pallets [33], bins, pails, roofing [36] and fencing [35] sheets [37], plates for impact sound and thermal insulation, lawn stones |
| P_W,PE | compression moulding | distribution pallets [33], bins, pails, roofing [36] and fencing [35] sheets [37], plates for impact sound and thermal insulation, lawn stones |
| P_C,PE | extrusion | Round, square and flat profiles [38], sheets, plates for in-and outdoor applications |
| P_W,C,PE | extrusion | Round, square and flat profiles [38], sheets, plates for in-and outdoor applications |
| P_PP | compression moulding | distribution pallets [33], bins, pails, roofing [36] and fencing [35] sheets [37], plates for impact sound and thermal insulation, lawn stones |
| P_W,PP | compression moulding | distribution pallets [33], bins, pails, roofing [36] and fencing [35] sheets [37], plates for impact sound and thermal insulation, lawn stones |
| P_C,PP | extrusion | Round, square and flat profiles [38], sheets, plates for in-and outdoor applications |
| P_W,C,PP | extrusion | Round, square and flat profiles [38], sheets, plates for in-and outdoor applications |
| P_PET | No processing possible | No application |
| P_W,PET | No processing possible | No application |
| P_C,PET | No processing possible | No application |
| P_W,C,PET | No processing possible | No application |
| P_PS | compression moulding | roofing and fencing sheets, plates for thermal insulation, office equipment, cases, plant pots, desk items [39] |
| P_W,PS | compression moulding | roofing and fencing sheets, plates for thermal insulation, office equipment, cases, plant pots, desk items [39] |
| P_C,PS | extrusion | Round, square and flat profiles [38], sheets, plates for in and outdoor applications |
| P_W,C,PS | extrusion | Round, square and flat profiles [38], sheets, plates for in and outdoor applications |
| PO_A | compression moulding | distribution pallets [33], bins, pails, roofing [36] and fencing [35] sheets [37], plates for impact sound and thermal insulation, lawn stones |
| PO_A,W | compression moulding | distribution pallets [33], bins, pails, roofing [36] and fencing [35] sheets [37], plates for impact sound and thermal insulation, lawn stones |
| PO_A,C | extrusion | Round, square and flat profiles [38], sheets, plates for in-and outdoor applications |
| PO_A,W,C | extrusion | Round, square and flat profiles [38], sheets, plates for in- and outdoor applications |
| PO_B | compression moulding | distribution pallets [33], bins, pails, roofing [36] and fencing [35] sheets [37], plates for impact sound and thermal insulation, lawn stones |
| PO_B,C | extrusion | Round, square and flat profiles [38], sheets, plates for in-and outdoor applications |
| P | compression moulding | distribution pallets [33], bins, pails, roofing [36] and fencing [35] sheets [37], plates for impact sound and thermal insulation, lawn stones |
| P_C | extrusion | Round, square and flat profiles [38], sheets, plates for in-and outdoor applications |
References
- Ignatyev, I.A.; Thielemans, W.; Beke, B.V. Recycling of Polymers: A Review. ChemSusChem 2014, 7, 1579–1593. [Google Scholar] [CrossRef] [PubMed]
- Ragaert, K.; Delva, L.; Van Geem, K. Mechanical and chemical recycling of solid plastic waste. Waste Manag. 2017, 69, 24–58. [Google Scholar] [CrossRef] [PubMed]
- Al-Salem, S.M.; Lettieri, P.; Baeyens, J. Recycling and recovery routes of plastic solid waste (PSW): A review. Waste Manag. 2009, 29, 2625–2643. [Google Scholar] [CrossRef] [PubMed]
- Plastics Europe. Plastics—the Facts 2020: An Analysis of European Plastics Production, Demand and Waste Data. Available online: https://www.plasticseurope.org/en/resources/publications/4312-plastics-facts-2020 (accessed on 16 December 2020).
- Pomberger, R.; Sarc, R.; Lorber, K. Dynamic visualisation of municipal waste management performance in the EU using Ternary Diagram method. Waste Manag. 2017, 61, 558–571. [Google Scholar] [CrossRef] [PubMed]
- Bauer, M.; Lehner, M. Post-consumer plastics in Austria and their potential for chemical recycling. In Proceedings of the ISWA World Congress, Vienna, Austria, 7–11 October 2013. [Google Scholar]
- European Union (EU). Directive 2008/98/EC of the European Parliament and of the Council of 19 November 2008 on Waste and Repealing Certain Directives; European Union: Brussels, Belgium, 2018. [Google Scholar]
- Federal Ministry for Climate Protection, Environment, Energy, Mobility, Innovation and Technology. Die Bestandsaufnahme der Abfallwirtschaft in Österreich-Statusbericht 2020 (Referenzjahr 2018); Federal Ministry for Climate Protection, Environment, Energy, Mobility, Innovation and Technology: Vienna, Austria, 2020. Available online: https://www.bmk.gv.at/en/topics/climate-environment.html (accessed on 30 December 2020).
- Friedrich, K.; Möllnitz, S.; Holzschuster, S.; Pomberger, R.; Vollprecht, D.; Sarc, R. Benchmark Analysis for Plastic Recyclates in Austrian Waste Management. Detritus 2019, 9, 105–112. [Google Scholar] [CrossRef]
- Letcher, T.M. Platic Waste and Recycling—Environmental Impact, Societal Issues, Prevention, and Solutions; Elsevier: London, UK, 2020. [Google Scholar]
- Austrian Standards Institute. ÖNORM S 2123-3: Sampling Plans for Waste—Part 3: Sampling of Solid Waste out of Material Streams; Austrian Standards Institute: Vienna, Austria, 2003. [Google Scholar]
- Bauer, M.; Lehner, M.; Schwabl, D.; Flachberger, H.; Kranzinger, L.; Pomberger, R.; Hofer, W. Sink–float density separation of post-consumer plastics for feedstock recycling. J. Mater. Cycles Waste Manag. 2018, 20, 1781–1791. [Google Scholar] [CrossRef]
- Wunderlich, B. Materials Properties. Structure and Properties of Materials. In Thermal Analysis of Polymeric Materials; Springer: Berlin/Heidelberg, Germany, 2005; pp. 512–516. [Google Scholar]
- Van Krevelen, D.W.; te Nijenhuis, K. Properties of Polymers:Their Correlation with Chemical Structure; Their Numerical Estimation and Prediction from Additive Group Contributions, 4th ed.; Elsevier: Amsterdam, The Netherlands, 2008. [Google Scholar]
- DIN EN ISO 11357-1:2016. Plastics—Differential Scanning Calorimetry (DSC) Part 1: General Principles; Beuth: Berlin, Germany, 2017. [Google Scholar]
- DIN EN ISO 179-1:2010. Plastics—Determination of Charpy Impact Properties—Part 1: Non-Instrumented Impact Test; Beuth: Berlin, Germany, 2011. [Google Scholar]
- Austrian Standards Institute (ASI). ÖNORM EN ISO 527-1:2012 05 15: Plastics—Determination of Tensile Properties—Part 1: General Principles; Beuth: Vienna, Austria, 2012. [Google Scholar]
- Austrian Standards Institute (ASI). ÖNORM EN ISO 527-2:2012 05 15: Plastics—Determination of Tensile Properties—Part 2: Test Conditions for Moulding and Extrusion Plastics; Beuth: Vienna, Austria, 2012. [Google Scholar]
- DIN EN ISO 3451-1:2019. Plastics—Determination of ash—Part 1: General Methods; Beuth: Berlin, Germany, 2019. [Google Scholar]
- DIN EN ISO 60:1999. Plastics—Determination of Apparent Density of Material That Can Be Poured from a Specified Funnel; Beuth: Berlin, Germany, 2000. [Google Scholar]
- DIN EN ISO 1133-1:2011. Plastics—Determination of the Melt Mass-Flow Rate (MFR) and Melt Volume-Flow Rate (MVR) of Thermoplastics—Part 1: Standard Method; Beuth: Berlin, Germany, 2012. [Google Scholar]
- Sarc, R.; E Lorber, K.; Pomberger, R.; Rogetzer, M.; Sipple, E.M. Design, quality, and quality assurance of solid recovered fuels for the substitution of fossil feedstock in the cement industry. Waste Manag. Res. 2014, 32, 565–585. [Google Scholar] [CrossRef] [PubMed]
- Ehrenstein, G.W.; Theriault, R.P. Thermomechanical Properties. In Polymeric Materials: Structure, Properties, Applications; Hanser: Munich, Germany, 2001; pp. 143–165. [Google Scholar]
- Domininghaus, H.; Elsner, P.; Eyerer, P.; Hirth, T. Thermoplastische Polymere. In Kunststoffe—Eigenschaften und Anwendungen, 7th ed.; Springer: Berlin/Heidelberg, Germany, 2012; pp. 163–629. [Google Scholar]
- Karger-Kocsis, J. Crystalline structures of polypropylene homo and copolymers. In Polypropylene Structure, Blends and Composites—Volume 1 Structure and Morphology; Springer: Berlin, Germany, 1995; pp. 31–56. [Google Scholar]
- Ehrenstein, G.W.; Riedel, G.; Trawiel, P. Grundlagen der Dynamischen Differenzkaloriemetrie. In Praxis der Thermischen Analyse von Kunststoffen, 2nd ed.; Hanser: Munich, Germany, 2003; pp. 1–35. [Google Scholar]
- Koltzenburg, S.; Maskos, M.; Nuyken, O. Polymere: Synthese, Eigenschaften und Anwendungen; Springer: Berlin, Germany, 2014. [Google Scholar]
- Pina-Estany, J.; García-Granada, A.A. Computational analysis of polymer molecular structure effect on nanocavities replication via injection moulding. Afinidad Barc. 2018, 75, 3–8. [Google Scholar]
- Kies, T. Entwicklung und Anwendung Eines Technologischen Vergleichsverfahrens zur Abschätzung der Verarbeitungseigenschaften von Thermoplast-Recyclaten beim Spritzgießen [Development and Application of a Technological Comparison Method for Estimating the Processing Properties of Thermoplastic Recyclates during Injection Moulding]. Ph.D. Thesis, Martin-Luther-Universität Halle-Wittenberg, Halle-Wittenberg, Germany, 2002. [Google Scholar]
- Moll, S. Untersuchung der Auswirkungen einer Thermisch-oxidativen Beanspruchung auf das Emissionsverhalten von ABS und PP und der Korrelation mit dem Alterungsgrad [Investigation of the Effects of Thermal Oxidative Stress on the Emission Behaviour of ABS and PP and the Correlation with the Degree of Ageing]. Ph.D. Thesis, Friedrich-Alexander-Universität Erlangen-Nürnberg, Erlangen-Nürnberg, Germany, 2017. [Google Scholar]
- Grellmann, W.; Seidler, S. Kunststoffprüfung—2. Auflage; Carl Hanser: Munich, Germany, 2011. [Google Scholar]
- Shrivastava, A. Chapter 3—Plastic Properties and Testing. In Introduction to Plastics Engineering, Plastics Design Library; William Andrew Publishing: Oxford, UK, 2018; pp. 49–110. [Google Scholar]
- Mark, J.E. Physical Properties of Polymers Handbook, 2nd ed.; Springer Science+Business Media: New York, NY, USA, 2007. [Google Scholar]
- Retting, W. Chapter: Verformungs- und Bruchverhalten von Kunststoffen. In Mechanik der Kunststoffe: Die Mechanischen Eigenschaften von Polymer-Werkstoffen; Hanser: Munich, Germany, 1991; pp. 44–62. [Google Scholar]
- Verdu, J. Effect of Aging on the Mechanical Properties of Polymeric Materials. J. Macromol. Sci. Part A 1994, 31, 1383–1398. [Google Scholar] [CrossRef]
- Oswald, T.A. Understanding Polymer Processing—Processes and Governing Equations; Carl Hanser: Munich, Germany, 2017. [Google Scholar]
- TranPak Inc. Proteus Distribution Pallet. Available online: https://www.tranpak.com/wp-content/uploads/2019/02/114218_SPEC-48x48.pdf (accessed on 24 January 2021).
- IndiaMART. Recycled Plastic Roofing Sheet. Available online: https://www.indiamart.com/proddetail/recycled-plastic-roofing-sheet-16254450733.html (accessed on 24 January 2021).
- RictonPanels. Ricton Corrugated Eco-Fence. Available online: https://pdf.indiamart.com/impdf/22365236291/MY-22045255/corrugated-eco-fencing.pdf (accessed on 24 January 2021).


| Parameters | TC | ΔHc | Tm1 | ΔHm1 | Tm2 | ΔHm2 | Tg |
|---|---|---|---|---|---|---|---|
| Material | (°C) | (J/g) | (°C) | (J/g) | (°C) | (J/g) | (°C) |
| P_PE | 110.3 ± 2.2 | 115.8 ± 18.6 | 129.3 ± 2.8 | 94.4 ± 18.6 | 162.8 ± 1.2 | 4.8 ± 4 | − |
| P_W,PE | 105.1 ± 1.8 | 118.9 ± 8.2 | 125.4 ± 0.7 | 97.1 ± 10.4 | 161.5 ± 0.6 | 4 ± 1.4 | − |
| P_C,PE | 107.6 ± 0.3 | 109.7 ± 4.8 | 127.6 ± 0.2 | 80.9 ± 2.3 | 162.7 ± 0.1 | 4.5 ± 0.2 | − |
| P_W,C,PE | 108.8 ± 1.3 | 128.3 ± 3 | 127.1 ± 0.8 | 98.7 ± 1.8 | − | − | − |
| P_PP | 116 ± 2.9 | 86.7 ± 8.8 | 165.3 ± 0.8 | 74.2 ± 11.2 | − | − | − |
| P_W,PP | 115.5 ± 2.5 | 91.8 ± 2.7 | 166.3 ± 1 | 79.6 ± 6.9 | − | − | − |
| P_C,PP | 119.4 ± 1.6 | 83.5 ± 4.1 | 164 ± 1 | 47.6 ± 18.3 | 128.1 ± 0.6 | 6.1±0.2 | − |
| P_W,C,PP | 119 ± 0.8 | 83.5 ± 2.1 | 163.8 ± 0.7 | 63.6 ± 0.5 | − | − | − |
| P_PS | 119.6 ± 3.9 | 10.4 ± 8.9 | 163.5 ± 1.4 | 7.7 ± 9.5 | − | − | 99.5 ± 0.9 |
| P_W,PS | 113.4 ± 3.5 | 5.2 ± 2.4 | 162.2 ± 0.9 | 2.8 ± 2.2 | − | − | 98.9 ± 1.6 |
| P_C,PS | 114 ± 0.3 | 7.7 ± 0.9 | 161.5 ± 0.1 | 4.5 ± 0.3 | − | − | 98.3 ± 0.2 |
| P_W,C,PS | − | − | 161.9 ± 0.1 | 3.6 ± 0.2 | − | − | 98.9 ± 0.4 |
| PO_A | 108.7 ± 4.6 | 74.1 ± 18.9 | 124.2 ± 1.2 | 46.1 ± 14.9 | 163.1 ± 1.1 | 13.7 ± 4.2 | − |
| PO_A,W | 107.9 ± 2.4 | 81.1 ± 4.6 | 125.4 ± 0.8 | 50.8 ± 4.8 | 163.5 ± 1.3 | 15 ± 4.6 | − |
| PO_A,C | 108.3 ± 1.1 | 83.8 ± 0.3 | 125.4 ± 0.3 | 50.2 ± 2.9 | 162 ± 0.5 | 15.1 ± 0.2 | − |
| PO_A,W,C | 107.8 ± 1.5 | 86.6 ± 3.2 | 125.4 ± 0.6 | 51 ± 0.5 | 162 ± 0.7 | 17.5 ± 1.4 | − |
| PO_B | 110.4 ± 3.9 | 105 ± 10.3 | 129 ± 4.9 | 54.6 ± 12.4 | 163.7 ± 1 | 18.8 ± 3.9 | − |
| PO_B,C | 110.4 ± 1.4 | 110 ± 1.5 | 126.7 ± 0.3 | 61.9 ± 3.1 | 162 ± 0.6 | 22.1 ± 0.9 | − |
| P | 111.2 ± 1.8 | 52.2 ± 10.6 | 128.2 ± 6.9 | 31.5 ± 9.4 | 164.2 ± 1.2 | 12 ± 7.1 | − |
| P_C | 110.6 ± 0.5 | 67.3 ± 2.4 | 126.4 ± 0.3 | 39.6 ± 3.1 | 161.1 ± 0.4 | 13.1 ± 0.3 | − |
Publisher’s Note: MDPI stays neutral with regard to jurisdictional claims in published maps and institutional affiliations. |
© 2021 by the authors. Licensee MDPI, Basel, Switzerland. This article is an open access article distributed under the terms and conditions of the Creative Commons Attribution (CC BY) license (http://creativecommons.org/licenses/by/4.0/).
Share and Cite
Möllnitz, S.; Feuchter, M.; Duretek, I.; Schmidt, G.; Pomberger, R.; Sarc, R. Processability of Different Polymer Fractions Recovered from Mixed Wastes and Determination of Material Properties for Recycling. Polymers 2021, 13, 457. https://doi.org/10.3390/polym13030457
Möllnitz S, Feuchter M, Duretek I, Schmidt G, Pomberger R, Sarc R. Processability of Different Polymer Fractions Recovered from Mixed Wastes and Determination of Material Properties for Recycling. Polymers. 2021; 13(3):457. https://doi.org/10.3390/polym13030457
Chicago/Turabian StyleMöllnitz, Selina, Michael Feuchter, Ivica Duretek, Gerald Schmidt, Roland Pomberger, and Renato Sarc. 2021. "Processability of Different Polymer Fractions Recovered from Mixed Wastes and Determination of Material Properties for Recycling" Polymers 13, no. 3: 457. https://doi.org/10.3390/polym13030457
APA StyleMöllnitz, S., Feuchter, M., Duretek, I., Schmidt, G., Pomberger, R., & Sarc, R. (2021). Processability of Different Polymer Fractions Recovered from Mixed Wastes and Determination of Material Properties for Recycling. Polymers, 13(3), 457. https://doi.org/10.3390/polym13030457