Article

Effect of Ultra-High-Molecular-Weight Molecular Chains on the Morphology, Crystallization, and Mechanical Properties of Polypropylene

1
Japan Advanced Institute of Science and Technology, School of Materials Science, 1-1 Asahidai, Nomi 9231292, Japan
2
Petrochemical and Polymer Science, Faculty of Science, Chulalongkorn University, Pathumwan, Bangkok 10330, Thailand
3
Packaging and Industrial Materials Laboratory, Prime Polymer Co., Ltd., 3 Chigusa-Kaigan, Ichihara 2990108, Japan
*
Author to whom correspondence should be addressed.
Polymers 2021, 13(23), 4222; https://doi.org/10.3390/polym13234222
Submission received: 12 November 2021 / Revised: 25 November 2021 / Accepted: 27 November 2021 / Published: 1 December 2021
(This article belongs to the Special Issue Advanced Thermoplastic Polymers and Composites)

Abstract

:
The effects of the ultra-high-molecular-weight (UHMW) component of polypropylene (PP) on its rheological properties, crystallization behavior, and solid-state mechanical properties were investigated using various measurement techniques. The terminal relaxation time—determined by measuring the linear viscoelasticity—was increased by adding the UHMW component. The increase in the melt elasticity produced by adding the UHMW component was observed by measuring the steady-state shear flow, although the shear viscosity was not greatly affected. Owing to the long characteristic time of the Rouse relaxation of the UHMW component, PP with the UHMW component formed highly oriented structures through a shear-induced crystallization process. The addition of the UHMW component enhanced the orientation and regularity of crystalline structure for extruded films. Therefore, the Young′s modulus, yield stress, and strength were higher in the PP film containing the UHMW component than in one without the UHMW component, irrespective of the direction of tensile deformation.

Graphical Abstract

1. Introduction

Molecular weight and molecular weight distribution strongly affect various properties of polymeric materials [1] as well as branch structure [2,3] and the addition of nanofillers [4,5,6,7]. The physical and mechanical properties of polymeric materials such as viscosity, diffusion coefficient, drawability, and toughness are strongly influenced by the molecular weight and its distribution [8,9,10,11]. In particular, the processability and strength of a polymer are drastically improved by the addition of an ultra-high-molecular-weight (UHMW) component compared with samples with a monodispersed molecular weight distribution. Consequently, the influences of the UHMW component on the physical and mechanical properties of polymeric materials have been studied intensively [12,13,14,15,16].
The addition of UHMW chains significantly enhances strain hardening during the elongational flow process in various polymer melts [17,18,19,20]. The relaxation time of the Rouse mode (τR), which corresponds to the characteristic time for chain contraction, strongly depends on the molecular weight described as τRM2. Therefore, the stretching of the UHMW chains cannot be relaxed during elongational flow. This results in significant strain hardening. Moreover, it is well known that UHMW chains form the “shish” of a shish–kebab structure. The shish–kebab structure is composed of extended-chain crystals (shish) and folded-chain crystals (kebab) grown from the shish. This shish-kebab structure often appears by flow-induced crystallization, because the stretching of the UHMW chains remains during the crystallization process [21,22]. The formation of the shish structure by UHMW chains has been observed by small-angle neutron scattering in blends of low-molecular-weight hydrogenated polyethylene and UHMW deuterated polyethylene [23,24]. Because the formation of the shish–kebab structure results in significant improvements in the modulus and strength [25,26], the addition of UHMW chains is one of the most effective methods of modifying the mechanical properties of semi-crystalline polymers. However, the effects of UHMW chains on the morphology, crystallization behavior, and mechanical properties of such polymers have been investigated separately. In particular, the effects of the addition of a UHMW component on the structure–mechanical properties relationship of the products obtained by a conventional processing operation such as film formation have not yet been elucidated.
In the present study, the effects of a UHMW component on the rheological properties, crystallization behavior, and mechanical properties of PP samples were systematically investigated. The Rouse time of UHMW chains is considerably longer than the characteristic time of the flow process, resulting in the enhancement of the shish formation and the promotion of a highly oriented structure. Included herein is a discussion of the effects of a UHMW component on the structure and mechanical properties of a solid-state PP film based on its rheological properties and crystallization behavior.

2. Experimental

2.1. Materials

A commercially available low-molecular-weight PP (LPP) having an unimodal molecular weight distribution (Mn = 0.43 × 10⁵, Mw = 3.1 × 10⁵, and Mz = 1.3 × 10⁶) with a melt flow rate (MFR) at 230 °C under 2.16 kgf of 7 g/10 min, and high-molecular-weight PP (HPP) having a bimodal molecular weight distribution (Mn = 0.33 × 10⁵, Mw = 7.2 × 10⁵, and Mz = 7.1 × 10⁶) with an MFR of 3 g/10 min, were acquired from Prime Polymer Co., Ltd. It should be noted that the melting temperatures of LPP and HPP were 161 and 163 °C, respectively, suggesting that the isotacticity of the PP samples were almost the same. LPP and HPP were blended with a weight fraction of HPP of 15 wt% using a 50 mm single-screw extruder at 220 °C. All samples included phosphate and hindered phenol compounds as antioxidants. The MFR of the blend was 6.3 g/10 min.
LPP and LPP/HPP films (approximately 25 μm thick) were prepared using a 75 mm single-screw extruder with a T-shaped die at 250 °C. The screw torques were 37% and 36% of the maximum for LPP and LPP/HPP, respectively. The die width was 600 mm, and the die gap was 0.8 mm. The extruded film was stretched in the air gap (10 mm) at 150 m min−1 by winding rolls. The chill rolls were maintained at 30 °C. The shear rate on the die wall ( γ wa ˙ ), calculated using the following equation, was 590 s−1:
γ wa ˙ = 6 Q H 2 W ,
where Q is the volume flow rate, H is the die gap, and W is the width of the die.
The film density (ρ) values of LPP and LPP/HPP, which were measured using a density-gradient column at 23 °C, were 892 and 900 kg/m3, respectively.
Pellets of LPP and LPP/HPP were melt-pressed at 180 °C and 15 MPa for 5 min, then quenched at 25 °C to prepare sample sheets (approximately 0.8 mm thick) for melt-rheology measurements.

2.2. Measurements

The melt-state viscoelasticity values were measured using a stress-control rheometer (AR2000ex, TA Instruments, Inc., New Castle, DE, USA) equipped with a cone-and-plate system with a diameter of 25 mm and a cone angle of 4°. The frequency sweep was performed from 0.01 to 628.3 rad s−1 at 180, 200, and 230 °C under a nitrogen atmosphere. The storage and loss moduli (G′ and G″, respectively) measured at various temperatures were horizontally shifted to construct the master curves using time–temperature superposition. The reference temperature (Tr) was set to 180 °C, which is above the melting temperature of PP samples. The shear stress and primary normal stress difference under a steady-state shear flow were also measured at different shear rates under the same conditions at 190 °C.
The transient elongational viscosity was measured using the stress-control rheometer with an extensional viscosity accessory (SER2-G, Xpansion Instruments, Tallmadge, OH, USA) under constant Hencky strain rates from 0.1 to 3.2 s−1 at 190 °C. Rectangular specimens (10 mm wide, 15 mm length, and 0.8 mm thick) prepared by compression molding were used for the measurements.
Capillary extrusion was performed using a capillary rheometer (140 SAS-2002, Yasuda Seiki Seisakusho, Ltd., Nishinomiya, Japan) at 190 °C to determine the steady-state shear viscosity. Circular-shaped dies with length (L)-to-diameter (D) ratios of 40/1 and 10/1 were used. The flow curve during the capillary extrusion was calculated using Bagley–Rabinowitsch corrections. The drawdown force defined as the force required to stretch a molten strand extrudate from a capillary rheometer [27] was evaluated using a tension detector (DT-413 G-04-3, Nidec-Shimpo, Kyoto, Japan) and a set of rotating rolls at 190 °C with draw ratios of 10 and 30.
The crystallization behaviors of the samples with/without shear history were evaluated using a home-made machine comprising a polarized microscope (DM2700P, Leica Microsystems GmbH, Wetzlar, Germany), a shear stage with a temperature controller (CSS450, Linkam Scientific Instruments, Tadworth, Surrey, UK), and a photodetector (PM16-121, Thorlabs Inc., Newton, NJ, USA). A beam of light, which passed through the polarizer, the shear stage, and the analyzer, was directed into the photo detector, as shown in Figure 1. Parallel plates made of quartz were set in the stage, in which a circular window (2 mm in diameter) was provided to transmit the light. The center of this window was 10 mm from the center of the plate. A shear rate of 100 s−1, which was calculated from the rotation speed of the bottom plate and the gap between the plates, was applied. The angle between the flow direction in the plates and the transmission axis of the polarizer was π/4. After passing through the analyzer at the crossed polar configuration, the light intensity was measured by the photo detector mounted in one of the eyepieces of the polarized microscope. A camera was set at another eyepiece to observe the morphology of the samples. The light transmittance (T) was calculated as follows:
T = I I I | | I
where I and I|| are the light intensities without a sample under crossed polars and parallel polars, and I is the light intensity passing through the sample under crossed polars.
The melting and crystallization temperatures were evaluated using a differential scanning calorimetry (DSC) system (DSC8500, PerkinElmer Co., Ltd., Waltham, MA, USA) under a nitrogen atmosphere. A 5 mg piece of each sample film was heated from 25 to 230 °C at a rate of 10 °C min−1 and was maintained at the isothermal temperature for 10 min. The sample was then cooled to 25 °C at a rate of 30 °C min−1. The crystallinity was calculated using the following equation:
χ DSC = Δ H f Δ H f 0 ,
where ΔHf is the fusion enthalpy of the sample and ΔHf0 is the fusion enthalpy of a perfect sample of crystalline iPP (209 J g−1) [28]. It should be noted that the DSC curves were measured in the first heating and cooling processes to evaluate the influences of the morphology of film samples on the melting and crystallization behaviors. The rigid amorphous fraction (χRA) was evaluated by temperature-modulated DSC measurements (step-scan mode) using the DSC8500 system. The step-scan procedure consisted of heating steps of 2 °C at 40 °C min−1 and isothermal steps of 0.4 min. The heat capacity during the heating process was obtained using step-scan software. The specific heat capacity increment at Tgcp) was estimated from the reversible specific heat capacity curve obtained from the step-scan measurement. χRA was calculated using the following equation [29,30]:
χ RA = 1 χ DSC Δ c p Δ c p , a ,
where Δcp,a is the specific heat capacity increment at Tg of the fully amorphous iPP. The value of Δcp,a was taken from the ATHAS database and from previous studies [31,32]. It should be noted that the value of χDSC obtained from the step-scan measurement was almost the same as that from the conventional measurement using Equation (3).
Two-dimensional wide-angle X-ray diffraction (WAXD) and small-angle X-ray scattering (SAXS) patterns of the sample films were measured using an XRD machine (SmartLab, Rigaku Corp., Akishima, Japan). A graphite-monochromatized Cu Kα radiation beam (45 kV and 200 mA) was directed into the sample film, and the diffraction patterns were collected with a detector (HyPix-400, Rigaku, Corp., Akishima, Japan). The exposure time for both the WAXD and SAXS measurements was 15 min. The crystallinity of each film was calculated using the following equation:
χ WAXD = i I c i i I c i + I a ,
where Ici and Ia are the integrated areas of the crystalline and amorphous peaks, respectively. The integrated area of each peak was obtained by fitting the sum of the Gaussian functions to the experimental integrated intensity profile. The Hermans’ orientation function (fWAXD) defined by the following equation was used to evaluate the orientation of the crystalline structure:
f WAXD = 3 cos 2 φ 1 2 ,
where φ is the angle between the crystalline axis and the machine, i.e., the flow direction (MD). Based on the Wilchinsky method [33], cos 2 φ is described as:
cos 2 φ = 1 1.090 cos 2 ϕ 110 0.901 cos 2 ϕ 040 ,
where cos 2 ϕ 110 and cos 2 ϕ 040 are calculated using the following equation: [34,35]
cos 2 ϕ h k l = 0 π I ϕ h k l cos 2 ϕ h k l sin ϕ h k l d ϕ h k l 0 π I ϕ h k l sin ϕ h k l d ϕ h k l .
Here, I (ϕhkl) is the intensity distribution of the (hkl) plane at the azimuthal angle ϕ.
The polarized infrared (IR) spectrum of each film was measured using a Fourier-transform IR (FT-IR) spectrometer (Spectrum100, PerkinElmer Co., Ltd., Waltham, MA, USA) at 25 °C. The polarization direction of the incident laser was tuned to parallel and perpendicular to the MD using a polarizer. Each IR spectrum was accumulated 16 times with an exposure time of 2 s. The integrated intensity of each IR band was calculated by fitting the sum of the Voigt functions using Igor Pro software. The Hermans’ orientation functions of the crystalline and amorphous chains were calculated using the following equation [36,37]:
f IR = 2 3 cos 2 α 1 D 1 D + 2 ,
where α is the angle between the molecular chain axis and the transition moment of each molecular vibration, and D is the IR dichroic ratio defined as D = A||/A, where A|| is the IR absorbance parallel to the stretching direction and A is the IR absorbance perpendicular to the stretching direction. In the present study, IR bands at 841 and 973 cm−1 assigned to the crystalline helical chains and the amorphous chains, respectively, were used to evaluate the orientation functions of the crystalline and amorphous chains (fIR,c and fIR,a). It should be noted that the values of α of these IR bands are known to be 0° and 7.31° for 841 and 973 cm−1, respectively [37,38]. The crystallinity was calculated using the following equation: [39]
χ IR = 0.614 A 998 A 973 ,
where A998 and A973 are the integrated intensities of the IR bands at 998 and 973 cm−1, respectively.
Dynamic mechanical analysis (DMA) was performed using a DMA machine (Rheogel-E4000, UBM Co., Ltd., Muko, Japan) to evaluate the temperature dependences of the loss and storage moduli (E′ and E″) in the tensile mode. The measurements were performed at 10 Hz in the temperature range from −80 to 160 °C at a constant heating rate of 2 °C min−1. Rectangular specimens (width 4 mm and length 10 mm), which were cut from the films, were used for the measurements. Oscillatory strain was applied parallel and perpendicular to the MD and the transverse direction (TD) of the films to evaluate mechanical anisotropy.
Tensile tests were performed using a tensile machine (EZ-LX HS, Shimadzu Corp., Kyoto, Japan) at a constant crosshead speed of 10 mm min−1 at 25 °C to evaluate the stress–strain behavior of the films. Dumbbell-shaped specimens (gauge length 10 mm, width 4 mm, and thickness approximately 25 μm) were cut from the films along the MD and TD and used for the measurements. Drawn specimens were prepared by the following procedure: each film specimen was drawn up to a strain of 1.5 and subjected to stress relaxation for 15 min; the drawn specimen was then removed from the tensile machine and kept for 1 day.

3. Results and Discussion

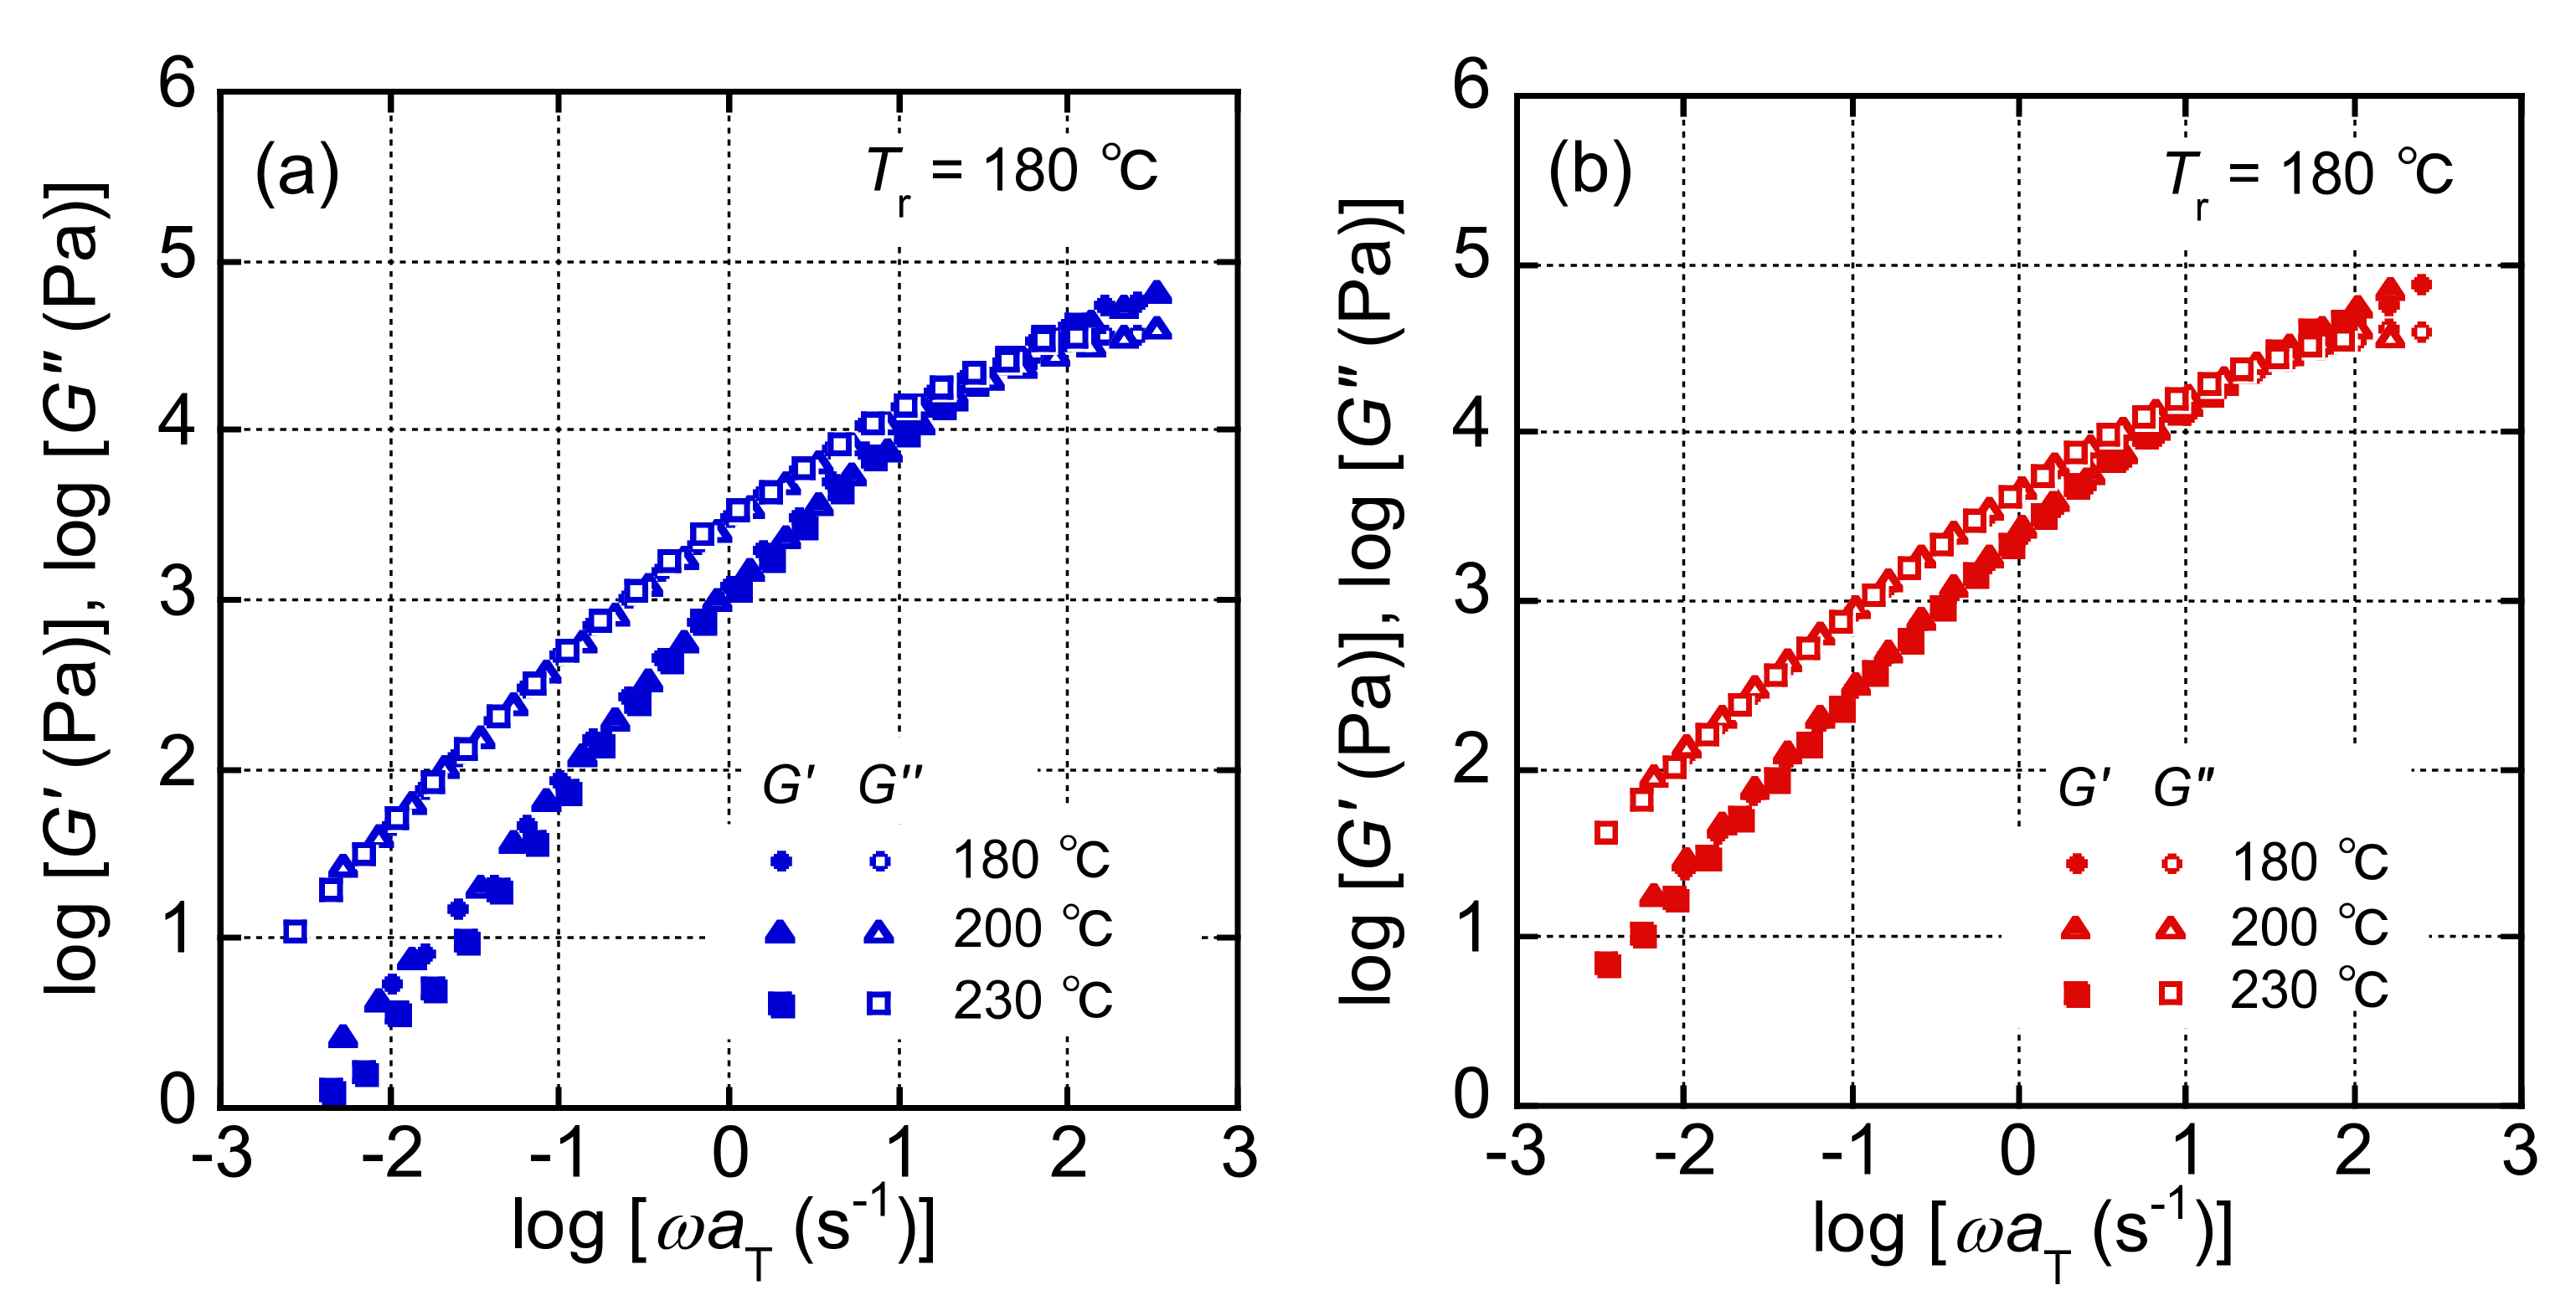
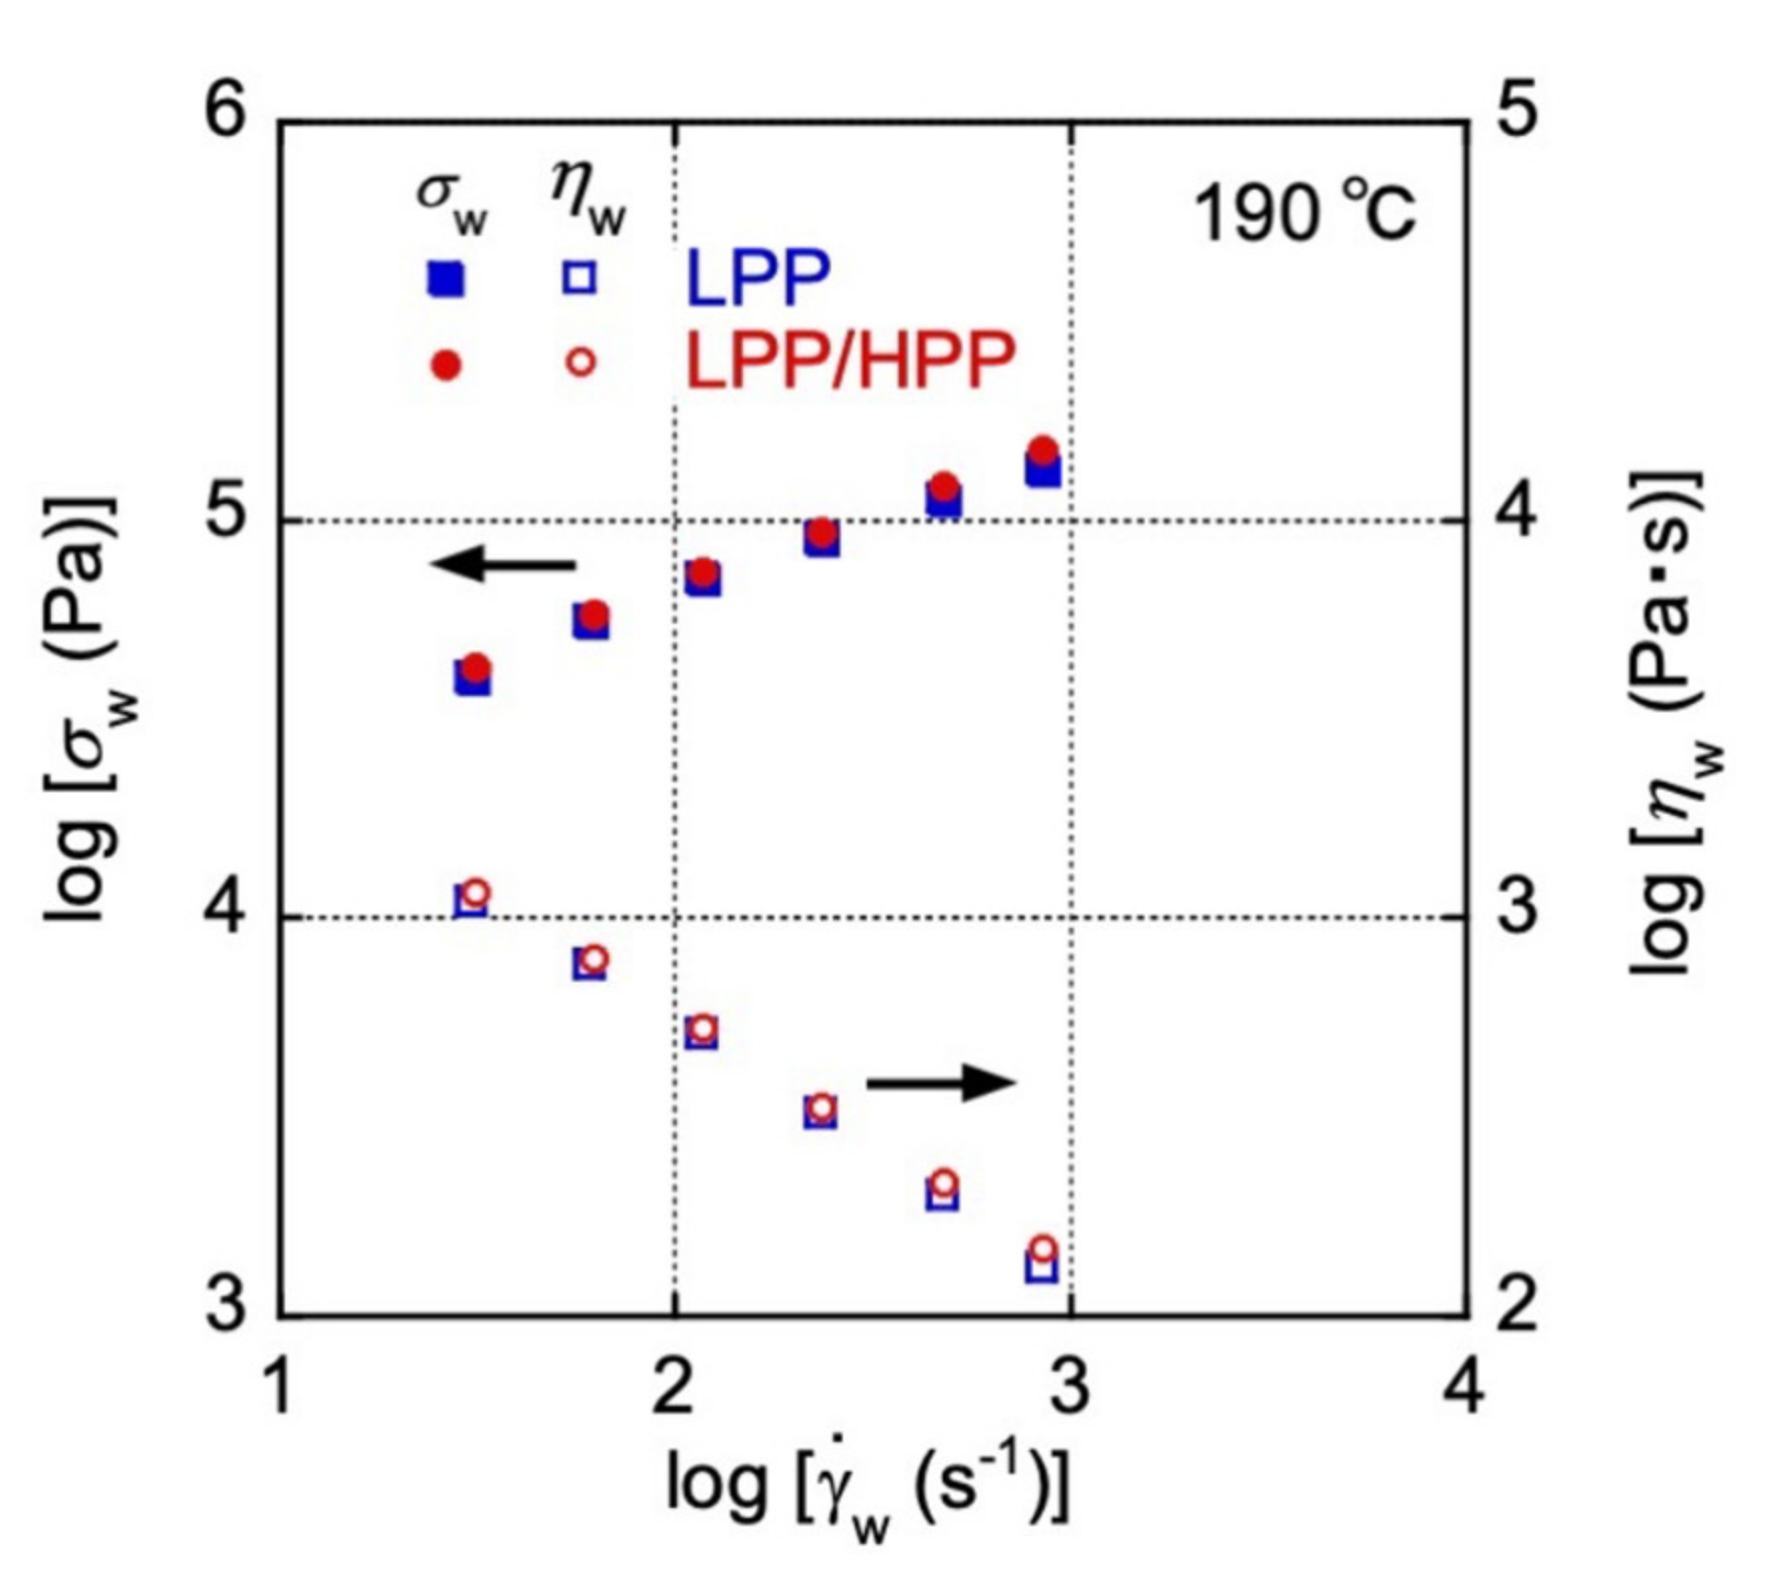
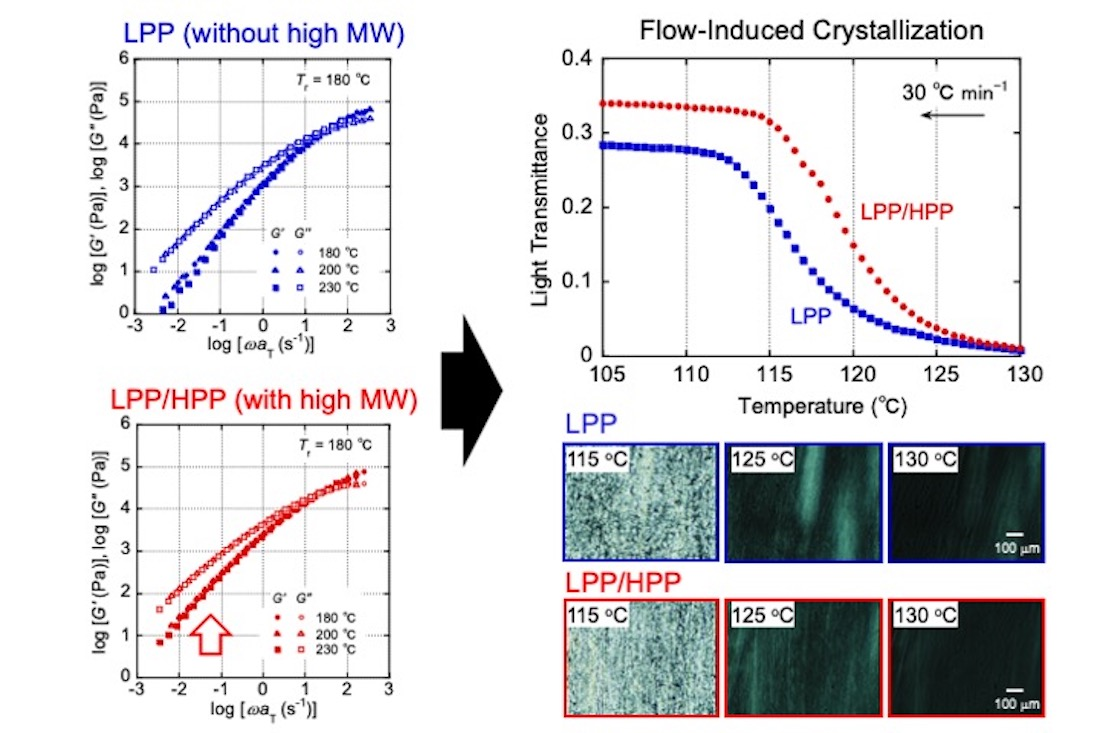
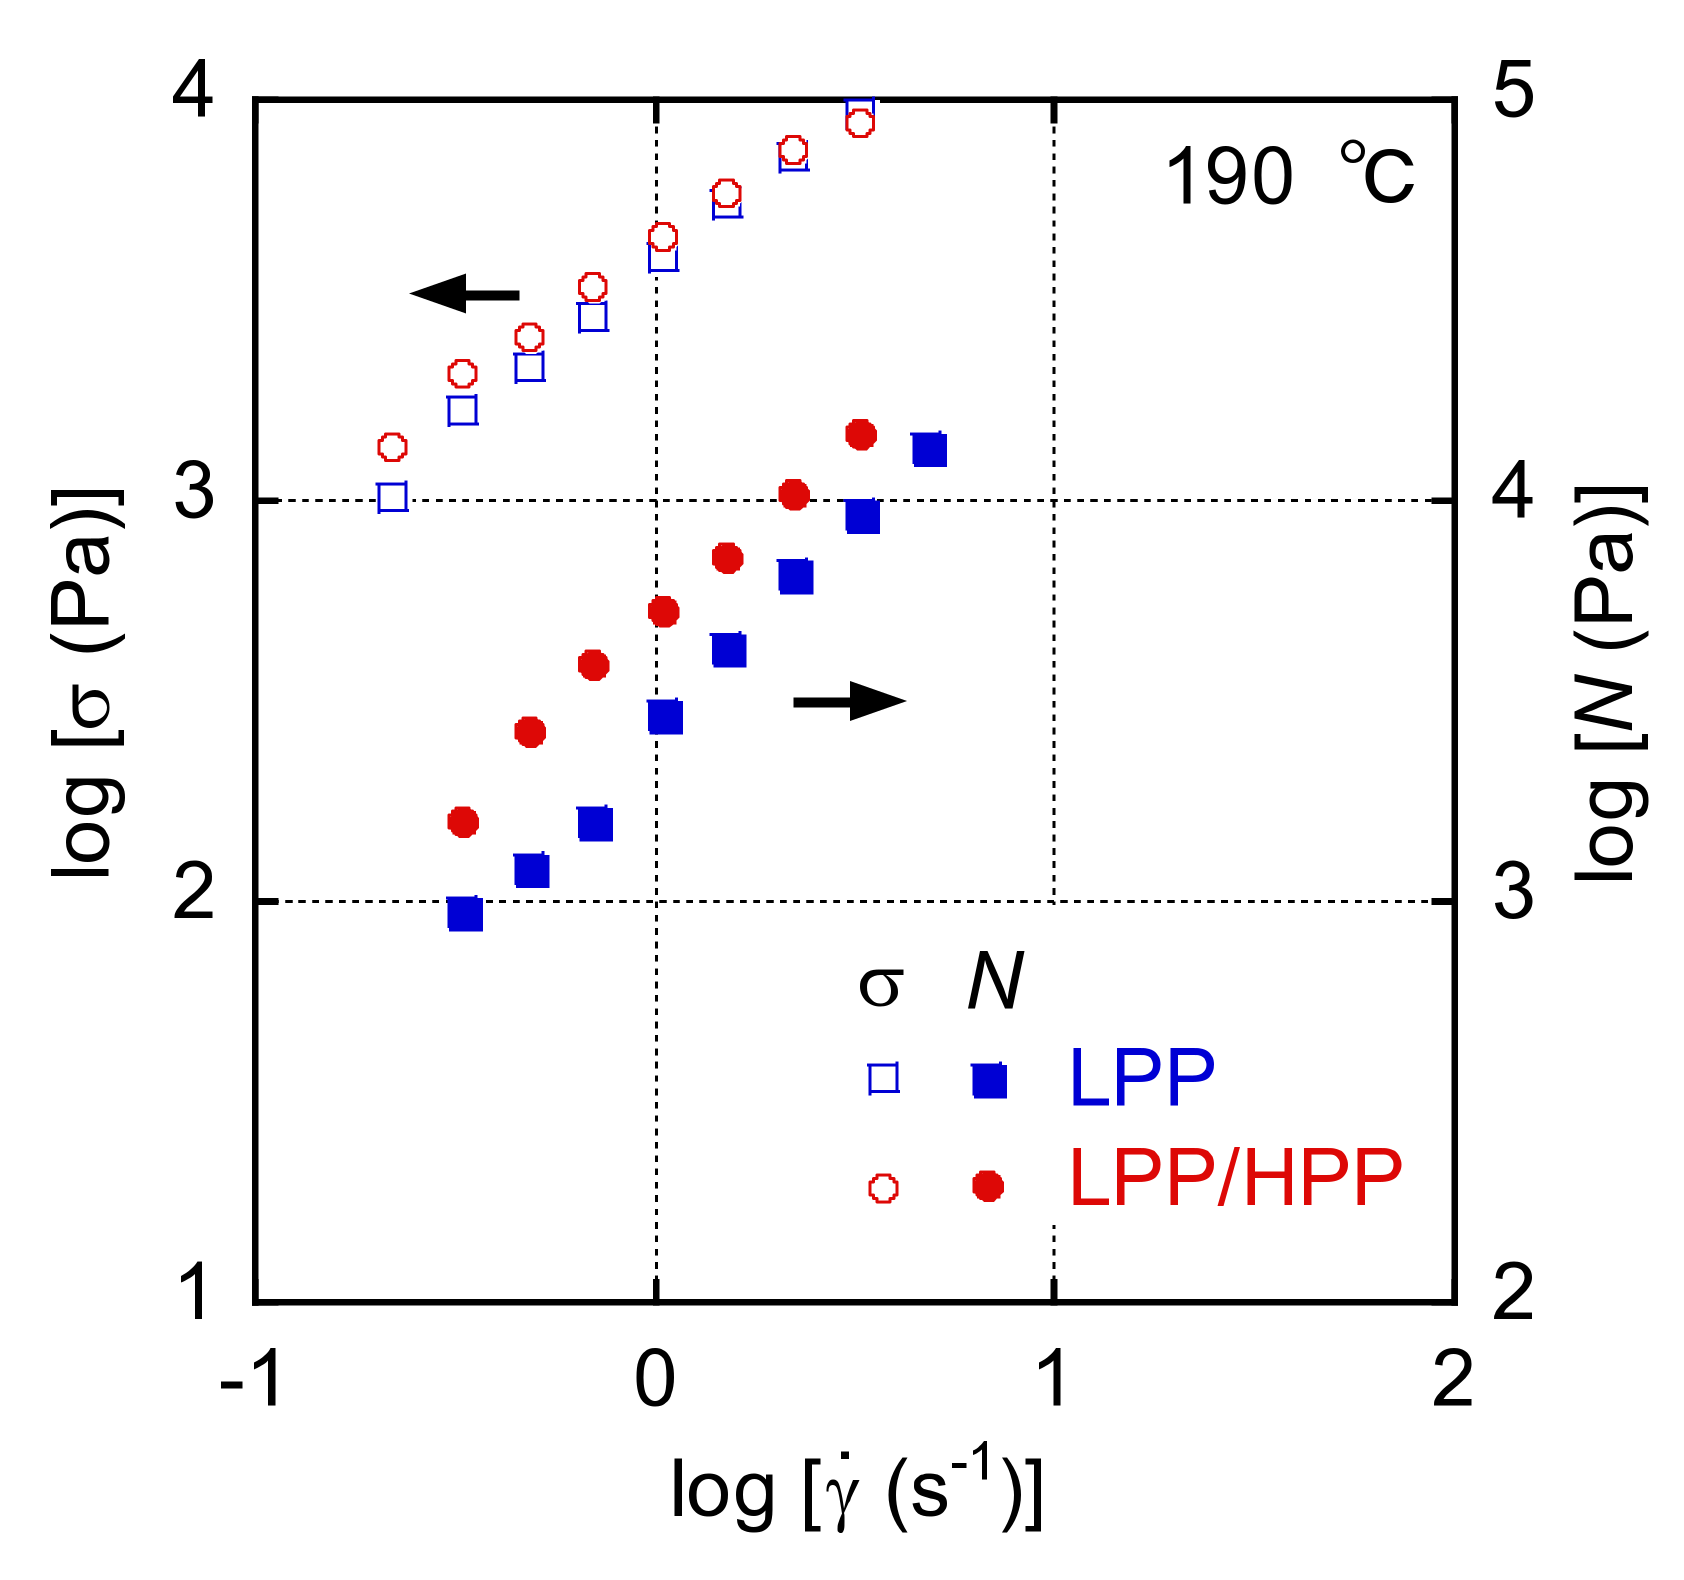
3.1. Rheological Properties

Figure 2 shows the angular frequency dependences of G′ and G″ of LPP and LPP/HPP. Both G′ and G″ decreased with decreasing the angular frequency and showed a cross point. The cross point for LPP/HPP was located at a lower frequency than that for LPP, suggesting that LPP/HPP has a longer relaxation time than LPP. Moreover, the modulus at the cross point for LPP/HPP was higher than for LPP. This is reasonable because LPP/HPP has a broad distribution of relaxation time. The slopes of G′ and G″ in the terminal relaxation region were almost 1 and 2, respectively. This is typical viscoelastic behavior of a simple polymer melt. However, the slopes of G′ and G″ in the low-frequency region of LPP/HPP were lower than those of LPP with an intense fashion of G′. This result was due to the long terminal relaxation time ascribed to the UHMW component of HPP. The broadening of the terminal relaxation region is a well-known effect of a UHMW component on rheological behavior [18]. Furthermore, the shift factors of both samples were almost the same, indicating both samples show a similar flow activation energy (≅45 kJ/mol).
The shear-rate ( γ ˙ ) dependences of the shear stress (σ) and the primary normal stress difference (N) under steady-state shear flow are shown in Figure 3. Both σ and N increased with increasing γ ˙ for LPP and LPP/HPP. The values of σ were slightly higher for LPP/HPP than those for LPP in the low γ ˙ region, whereas the γ ˙ dependence of σ in the high γ ˙ region was almost the same for both PP samples. However, the values of N were higher for LPP/HPP than those for LPP over the whole γ ˙ region. This suggests that the increase in melt-state elasticity was caused by the addition of the UHMW component. These results corroborate those pertaining to linear viscoelasticity shown in Figure 2.
Figure 4 shows the ratio of the diameter of the extruded strand (d) to the diameter of the die (D) plotted against the apparent shear rate on the wall ( γ ˙ wa ) when a die with a length of 40 mm was used. The d/D ratio increased monotonously as γ ˙ wa increased in both samples, and the d/D ratio of LPP/HPP was obviously higher than that of LPP. This is attributed to the enhanced primary normal stress difference with a prolonged relaxation time.
The end-pressure drop (ΔPe) at 190 °C evaluated using a Bagley plot is plotted against the apparent wall shear rate ( γ ˙ wa ) in Figure 5. ΔPe increased with increasing γ ˙ wa , which is typical capillary extrusion behavior. Moreover, the ΔPe value of LPP/HPP was higher than that of LPP in the γ ˙ wa range, although σ was almost the same for both PPs, as shown in Figure 3. Considering that ΔPe is determined by σ and N [40,41], this result is attributed to the enhancement of N by the addition of the UHMW component, as shown in Figure 3.
The γ ˙ w dependences of σw and ηw after Bagley–Rabinowitsch corrections are shown in Figure 6. Both σw and ηw showed almost the same γ ˙ · dependence for LPP and LPP/HPP, and the values of σw for LPP/HPP were very close to those for LPP, corroborating the results for σ in the high shear-rate region during steady-state shear flow shown in Figure 3. This result corresponds to the extrusion torque during T-die extrusion; both PP samples showed the same torque values.
The elongational viscosity growth curves at various strain rates under uniaxial elongational flow for both PP samples are shown in Figure 7. The solid line in Figure 7 represents 3η+(t) calculated from G′ and G″ shown in Figure 2 using the following equation [42,43]:
η + t = t G ω + 1.12 G ω 2 0.200 G ω ω 1 / t .
The upward deviation of ηE+(t, ε ˙ ) from 3η+(t) suggests the strain hardening. LPP showed almost no strain hardening during elongational flow because the flow curves were close to 3η+(t) at all strain rates. On the other hand, LPP/HPP showed weak strain hardening at the strain rates from 0.4 to 3.2 s−1, indicating that strain hardening was promoted by the stretching of the UHMW chains. The promotion of strain hardening by the addition of UHMW chains has been reported for various polymeric materials [17,18,19,20,44]. It has been well known that the strain hardening is responsible for good processability at various processing operations. For example, the stability of tubular blown film is improved greatly, which makes it possible to produce a thin film [45,46].
The values of the drawdown force during the capillary extrusion of both PP samples at draw ratios (DRs) of 10 and 30 are listed in Table 1. At both draw ratios, the values of the drawdown force were considerably higher for LPP/HPP than those for LPP. The markedly high drawdown force for LPP/HPP should be attributed to strain hardening during uniaxial elongation at the high strain rate, as shown in Figure 7, and/or the strain-induced crystallization of the UHMW chains [7,27].

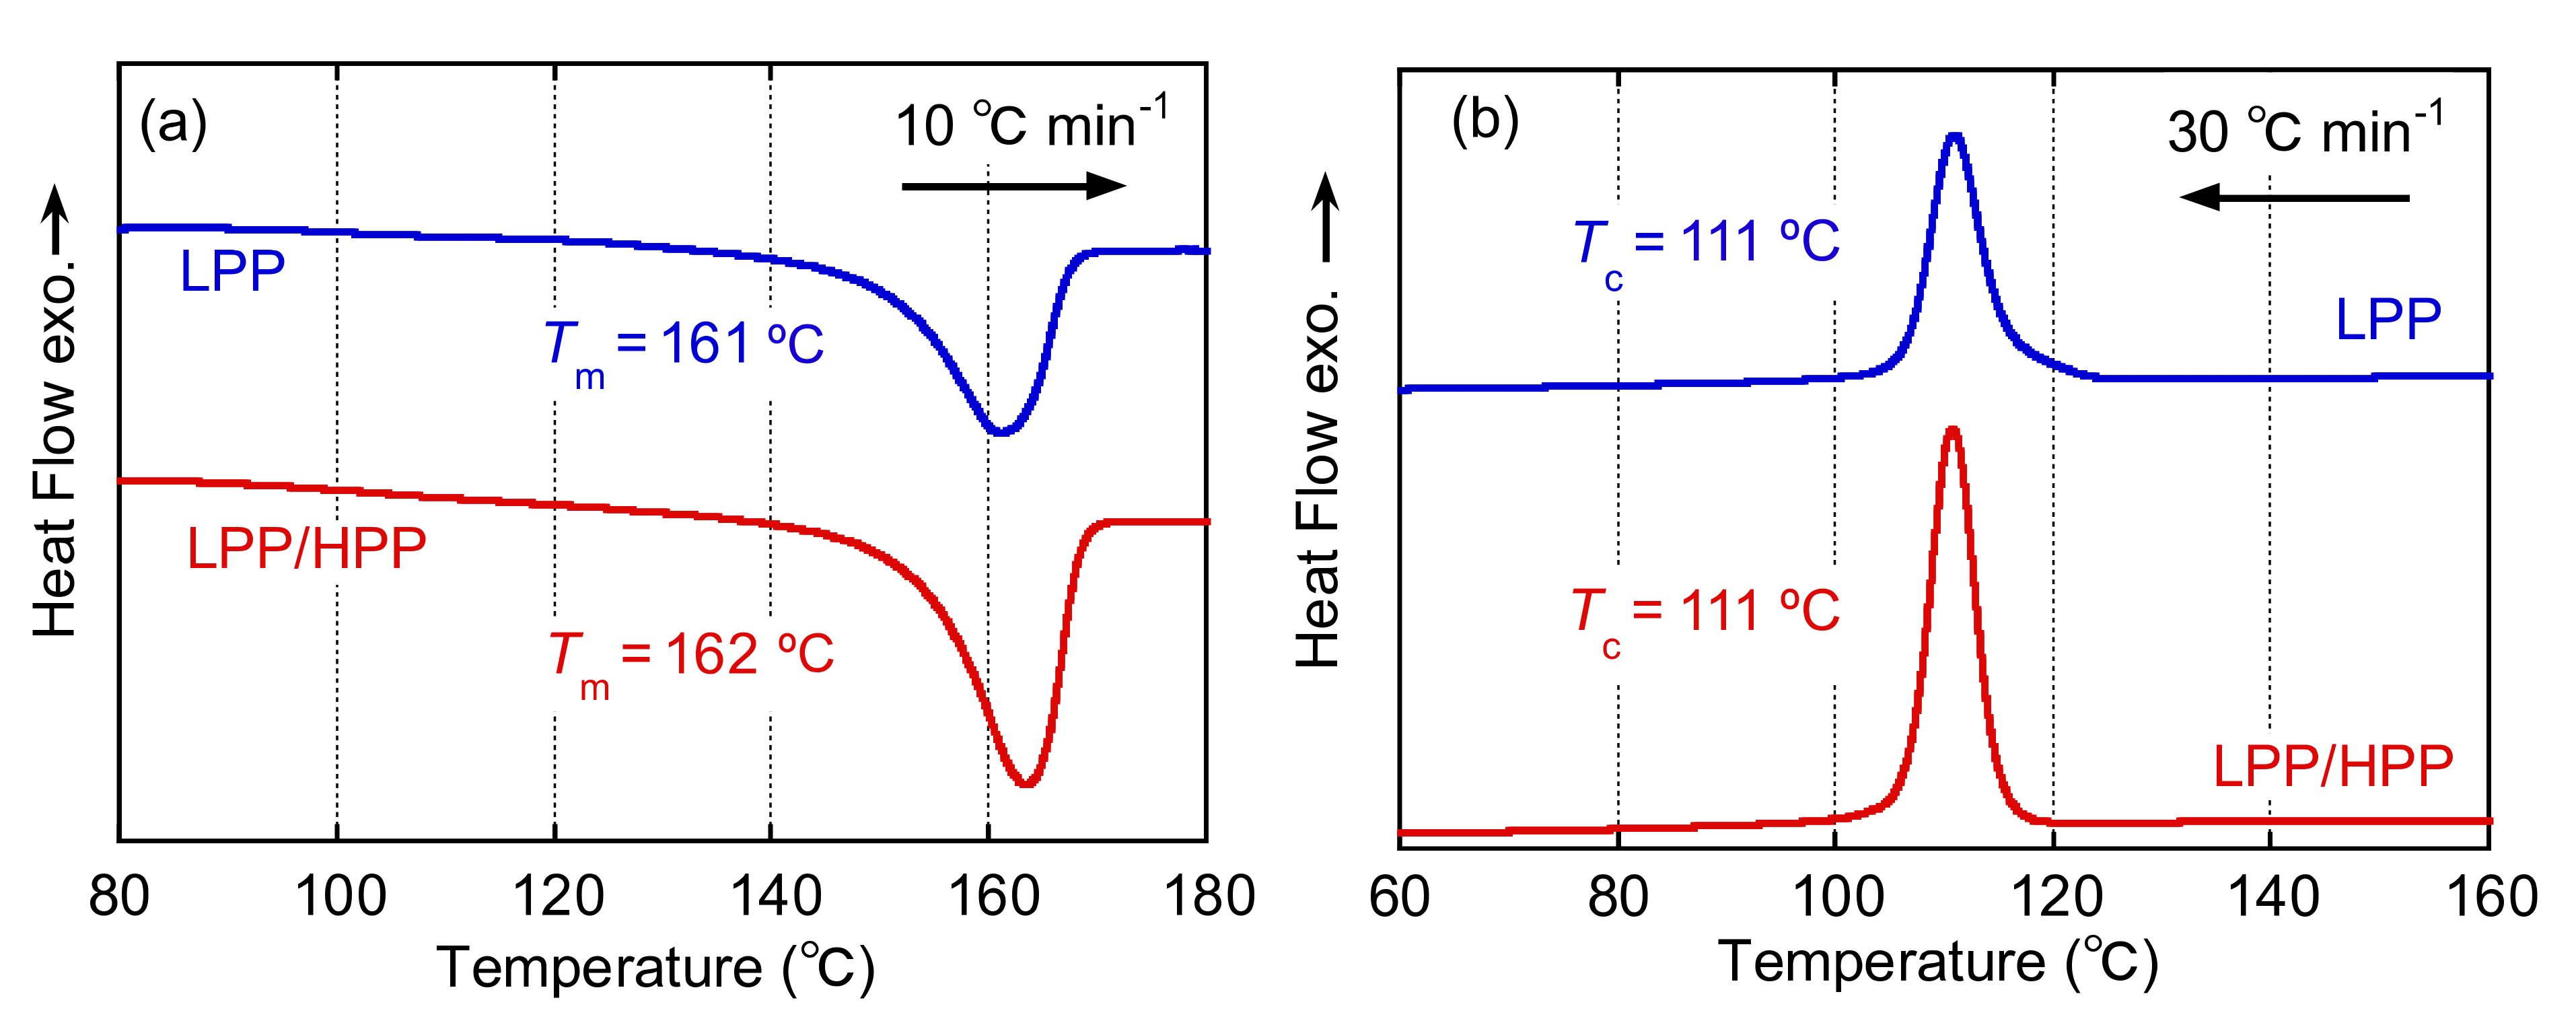
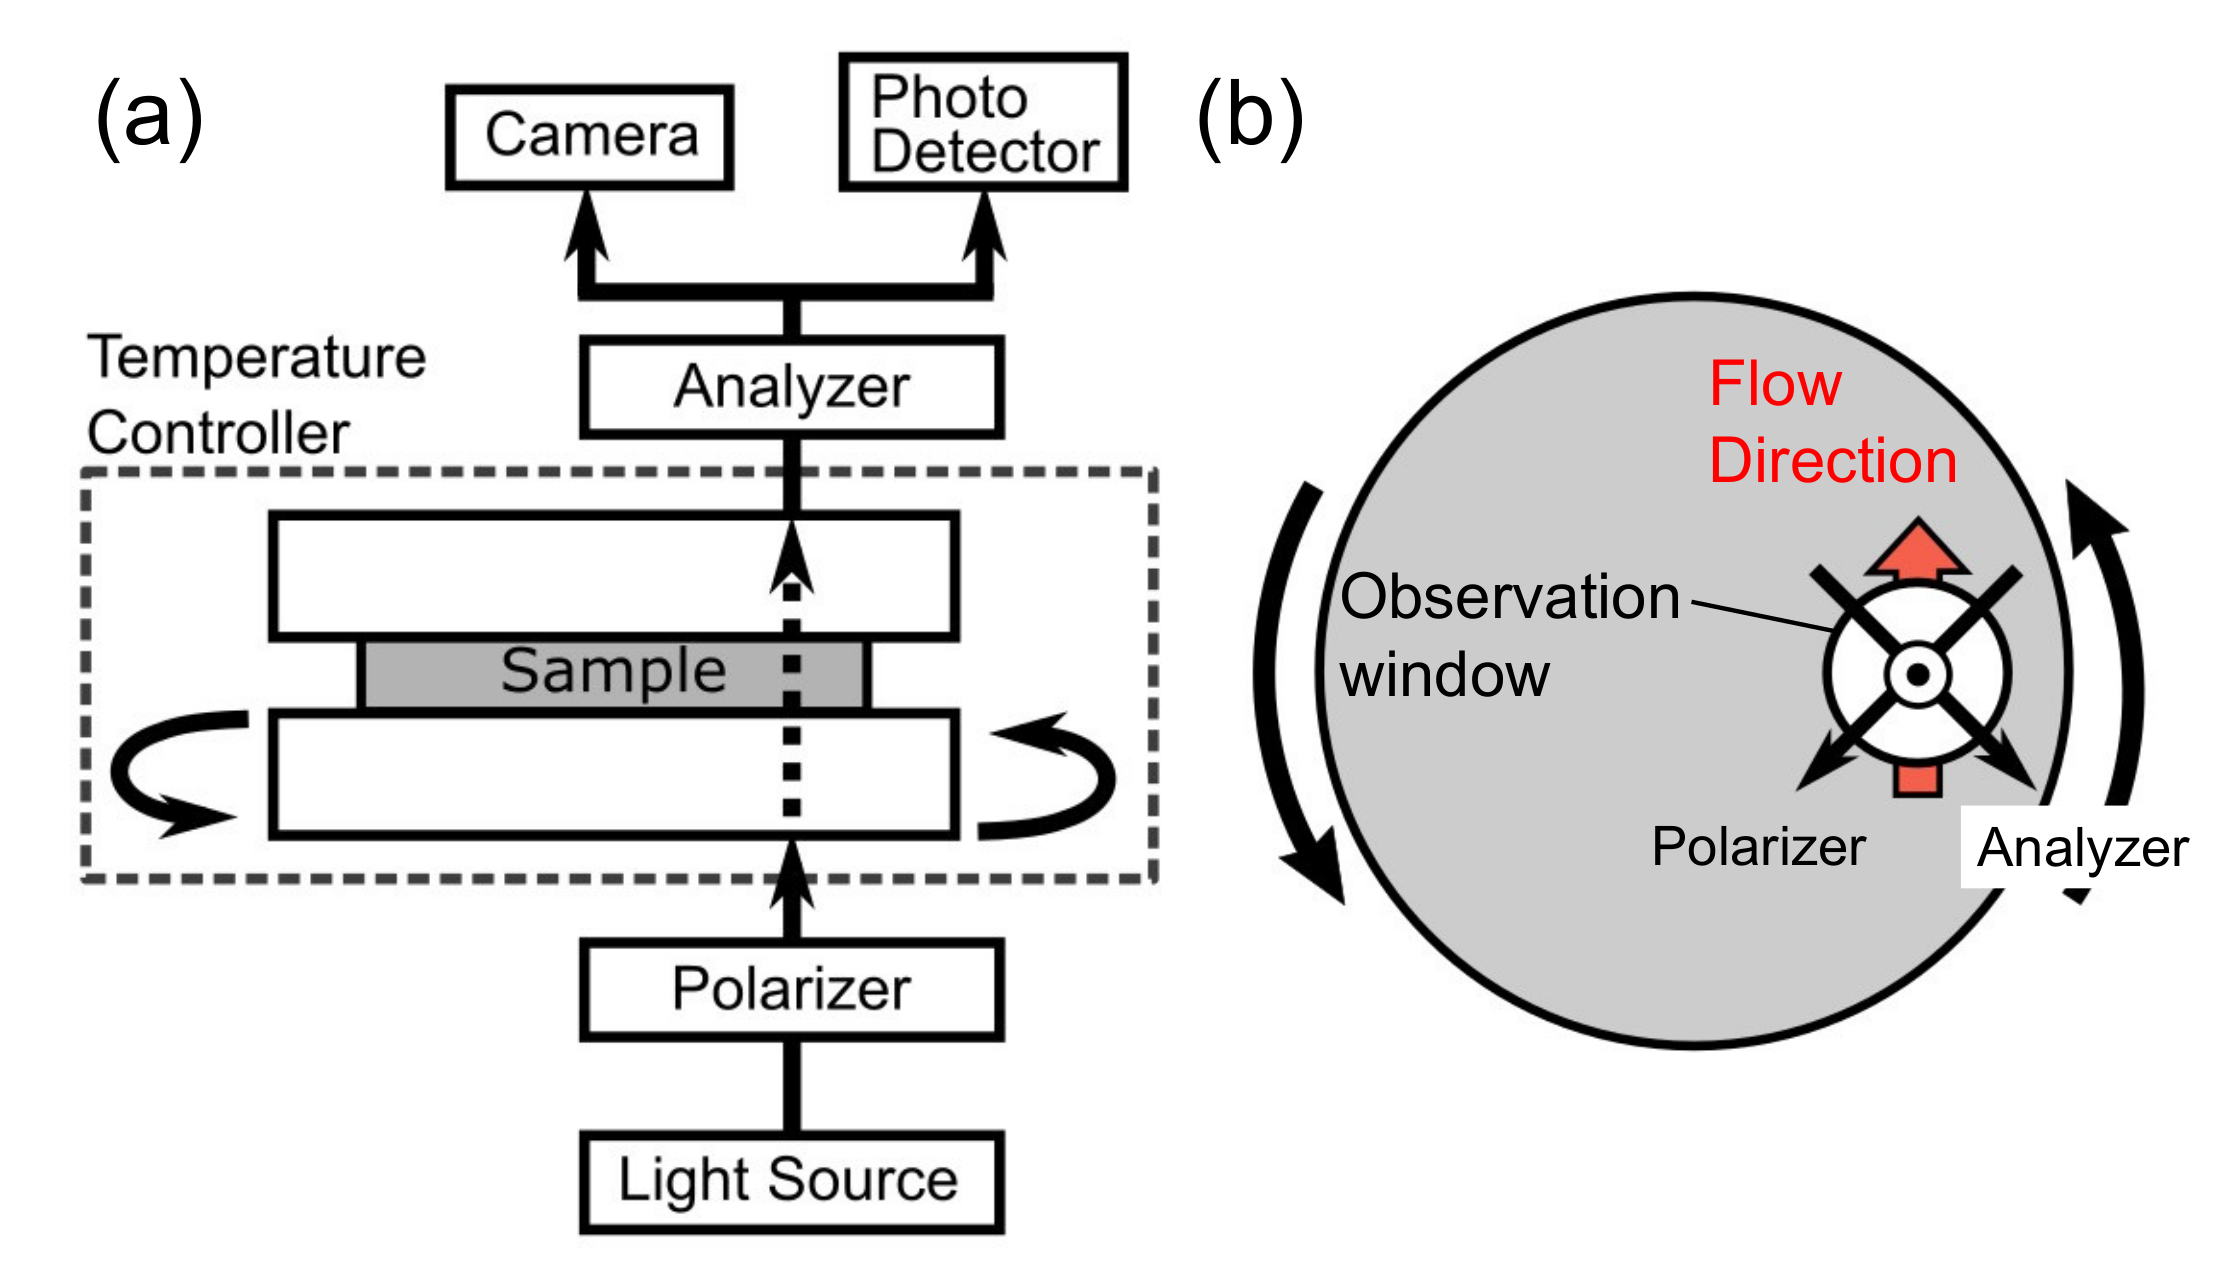
3.2. Crystallization Behavior

The temperature dependence of light transmittance during non-isothermal crystallization without shear flow is shown in Figure 8. Each sample was initially heated to 230 °C for 10 min to erase its thermal history. The samples were then cooled at 30 °C min−1, i.e., the same rate used for the DSC measurements. In each sample, the light intensity increased drastically at approximately 117 °C and reached an asymptotic value at below 107 °C, in good agreement with the DSC results discussed later, i.e., both PP samples had almost the same crystallization temperature at approximately 117 °C. Moreover, spherulites were observed in the polarized optical microscopy (POM) images of both PP samples at below 117 °C. These results are typical crystallization behavior for a semi-crystalline polymer in the absence of shear flow [47,48].
Figure 9 shows the temperature dependence of light transmittance after exposure to shear flow during cooling from 230 to 160 °C. The shear rate was 100 s−1. After the cessation of shear, the samples were cooled at the same rate. Therefore, the applied thermal history was the same as in Figure 8. Although it is not clear from the figure, light transmittance was unchanged at 160 °C, suggesting that flow-induced birefringence in the molten state was negligible. The onset crystallization temperature after the applied shear flow was obviously higher than that in the absence of shear for both PP samples, which is consistent with previous results of the flow-induced crystallization of PP [47]. Moreover, streak-like patterns caused by molecular orientation in the flow direction were observed in the POM images at 125 °C for both samples. These results indicate that the oriented molecular chains acted as nuclei for the formation of the shish-like structure, resulting in enhanced crystallization compared with crystallization in the absence of shear flow. When crystallization was almost completed (<115 °C), both highly oriented crystals and spherulites were observed in the POM image of LPP. However, highly oriented structure such as the shish–kebab structure was clearly observed in the LPP/HPP sample, owing to the strong orientation of the UHMW chains. The strong orientation of the molecular chains of LPP/HPP compared with those of LPP is consistent with the marked light transmittance below 115 °C for LPP/HPP. Reduced light scattering originating from the spherulite texture as well as a long correlation length resulted in high light transmittance.
The Weissenberg number associated with the Rouse mode (WiR), defined as Wi R = γ ˙ τ R , is used as a critical factor for forming flow-induced crystalline structure [22]. It is known that the flow-induced crystalline structure is formed at which WiR is larger than unity. The WiR values of both PP samples for the flow-induced crystallization process were calculated using the following equation [49]:
Wi R = γ ˙ τ e M M e 2 ,
where τe is the Rouse time of an entanglement strand and Me is the entanglement molecular weight. For iPP, WiR was calculated using τe = 1.5 × 10⁻⁷ s and Me = 5.25 kg mol−1 at 170 °C [50]. In the case of the present crystallization process, the critical molecular weight for flow-induced crystallization was approximately 1.3 × 10⁶, calculated using Equation (12). Considering that both PP samples included a small number of UHMW chains, the highly oriented crystalline structure observed in the POM image shown in Figure 9 was caused by stretching of the UHMW component. In particular, the LPP/HPP sample included a larger amount of the UHMW component than the LPP sample, which resulted in a significant degree of orientation in the flow direction and numerous highly oriented crystals in LPP/HPP compared with LPP.

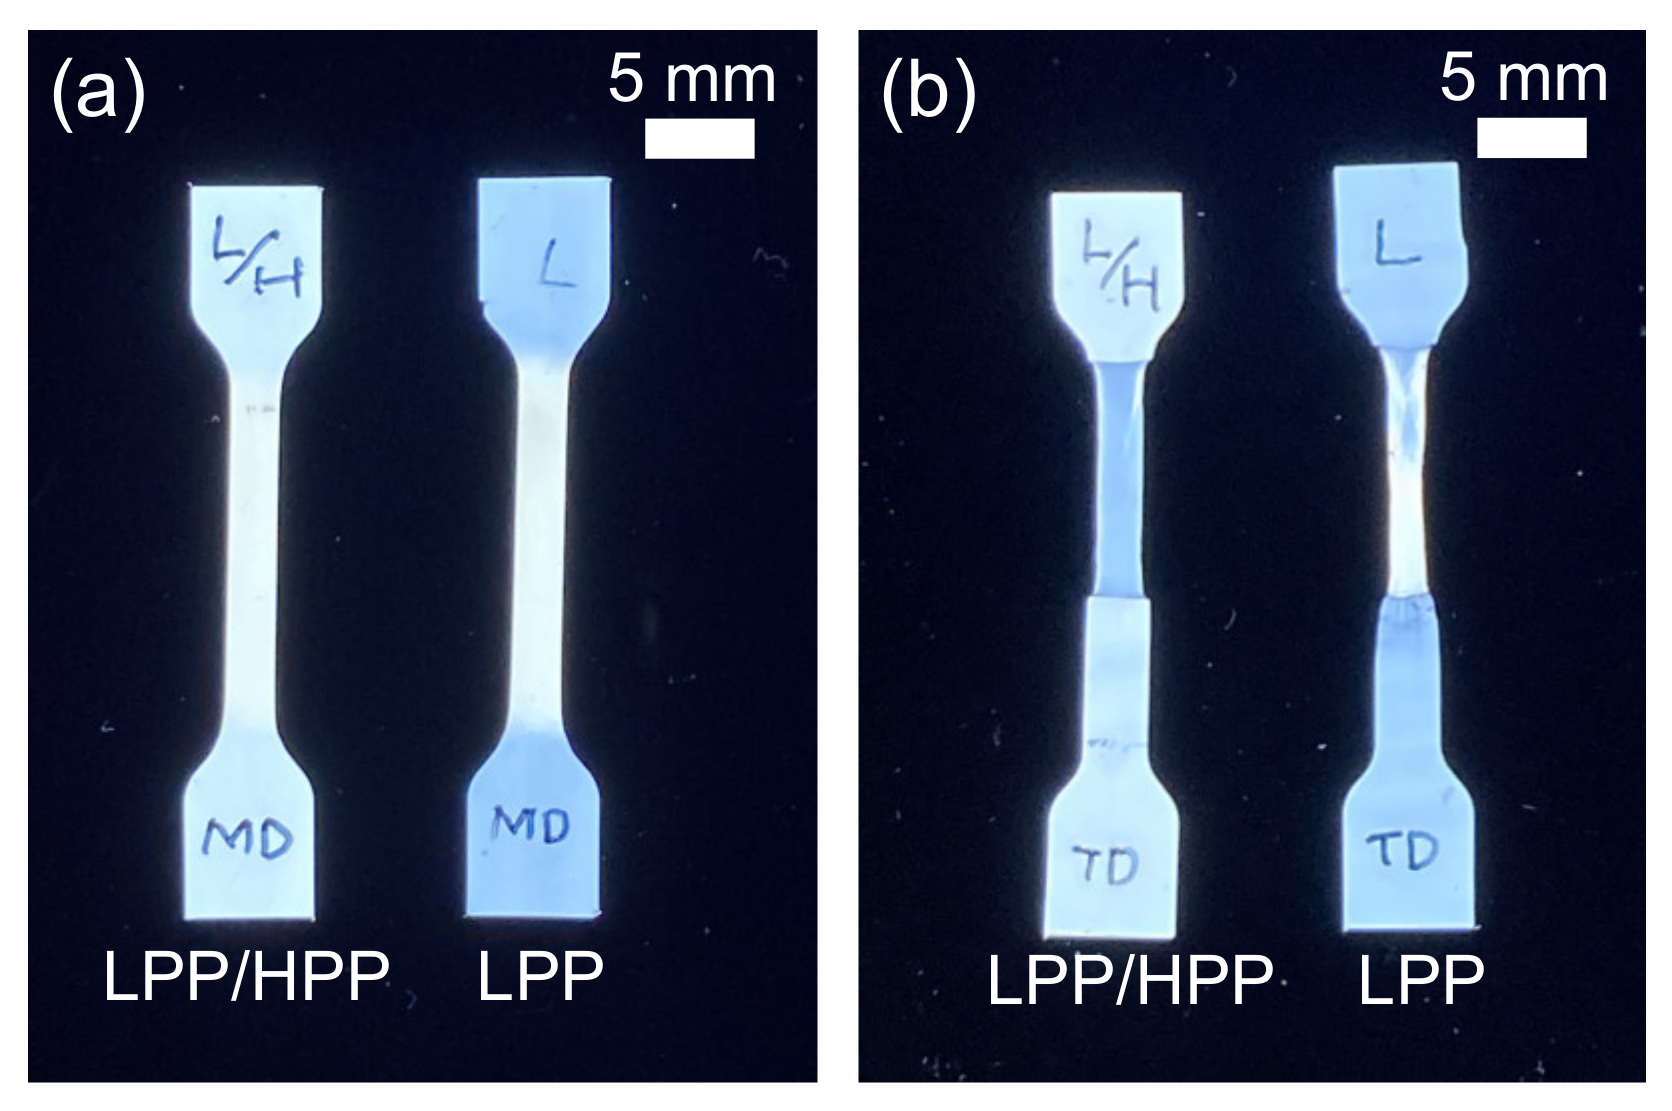
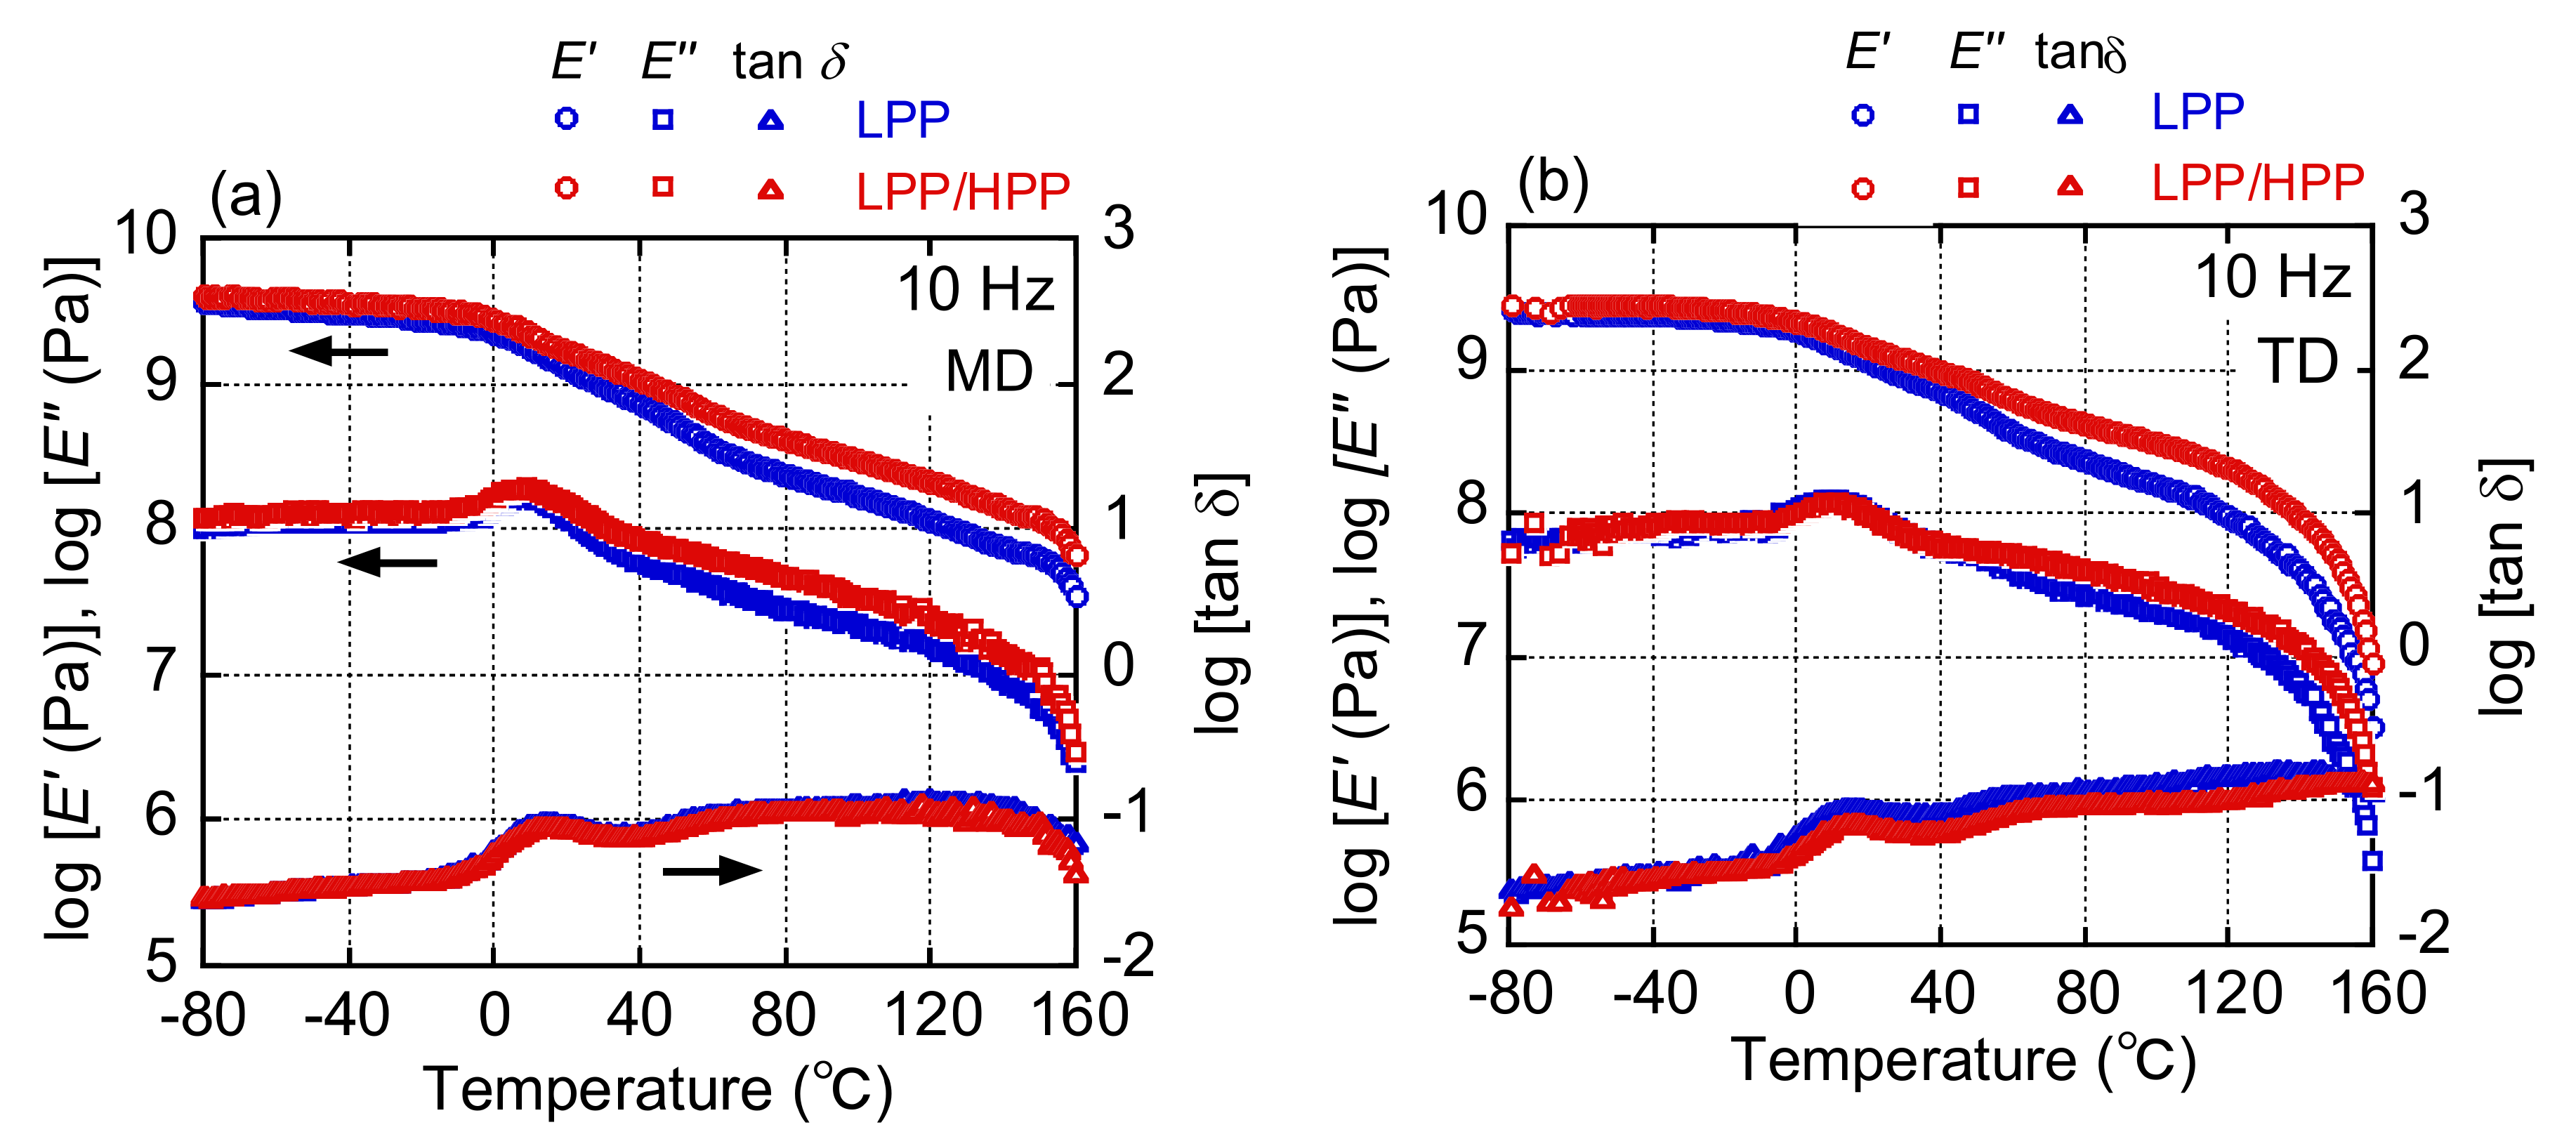
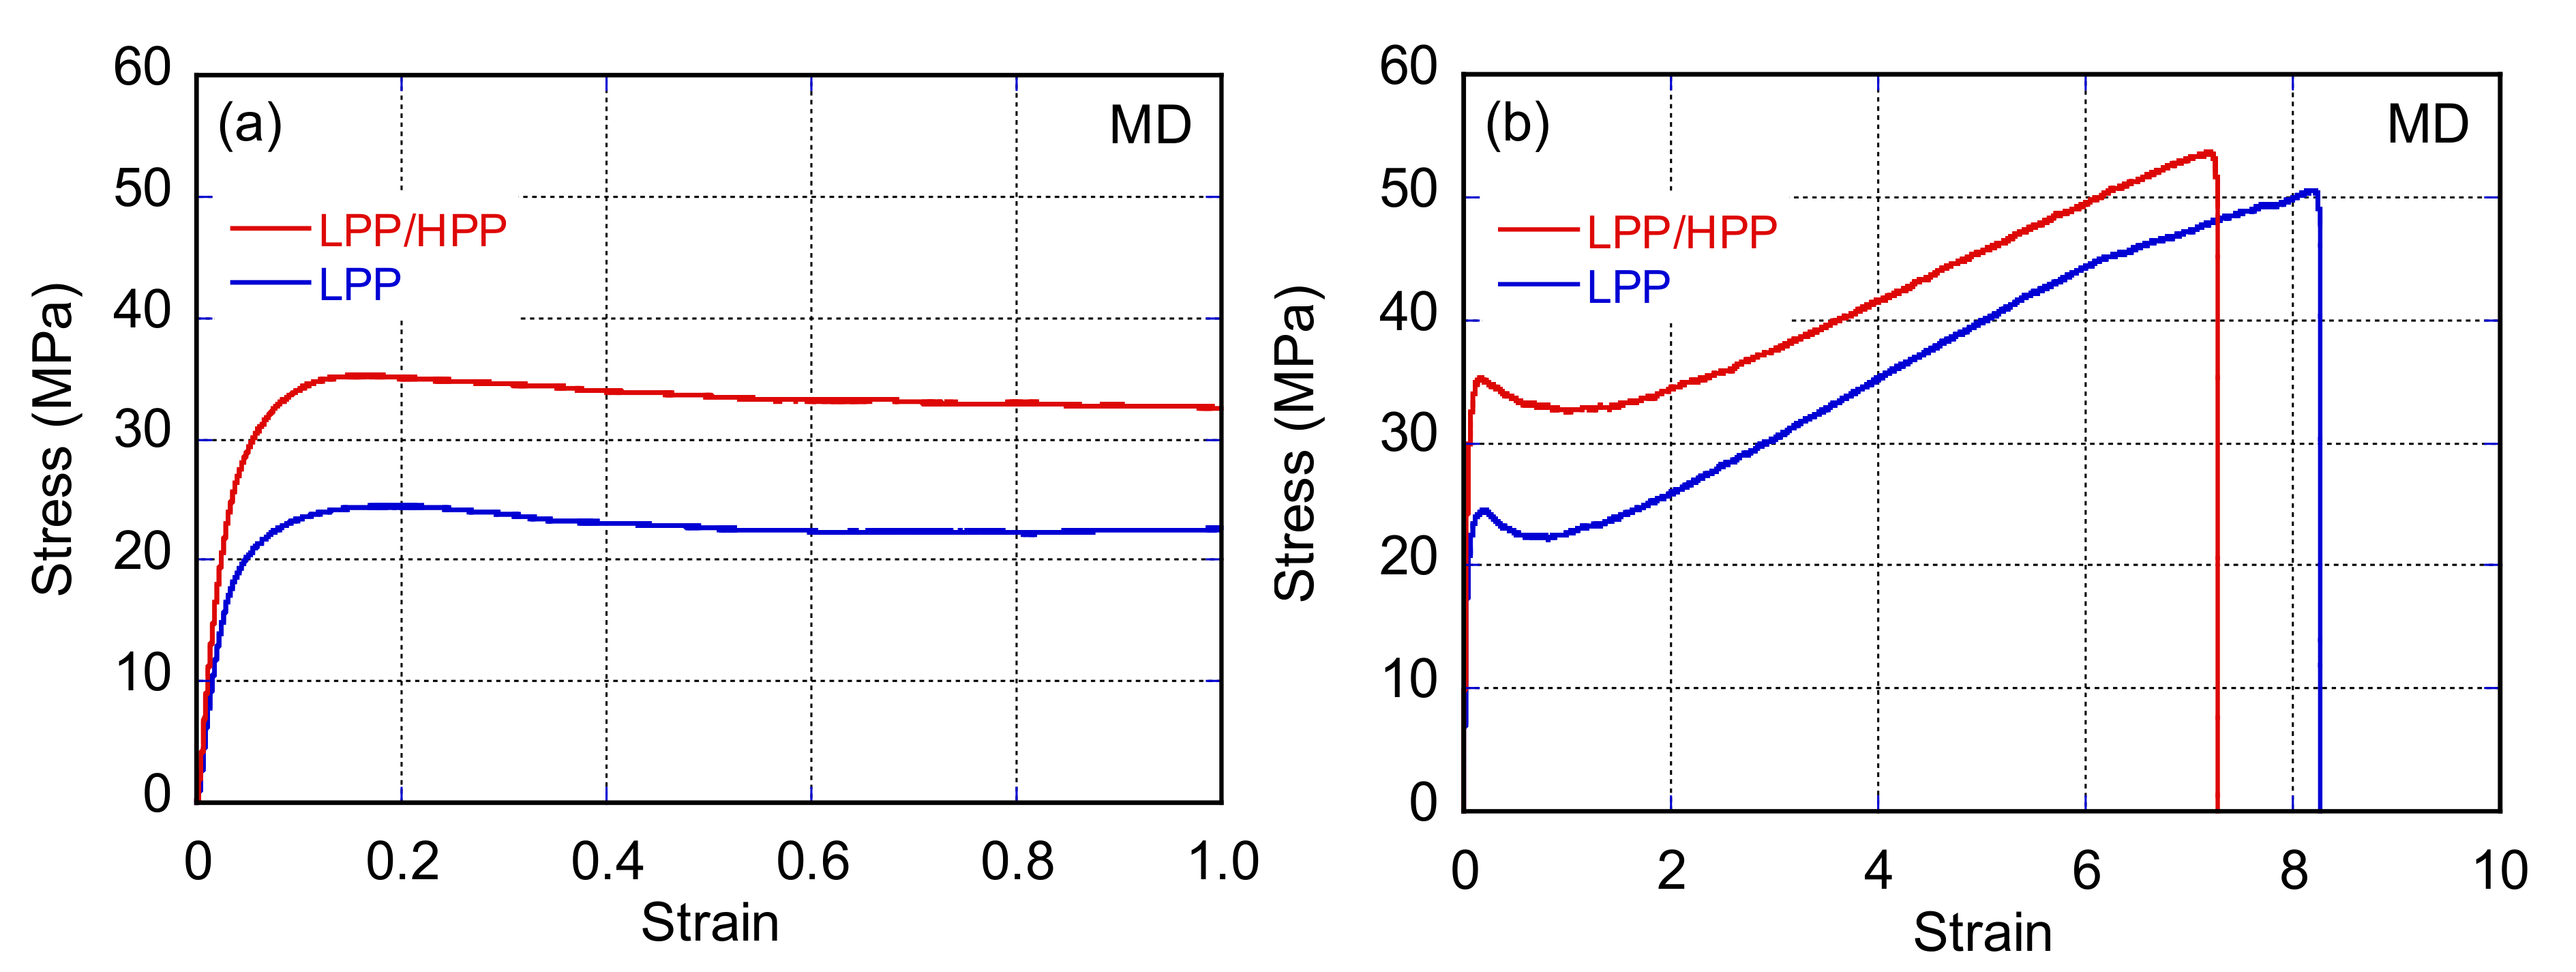
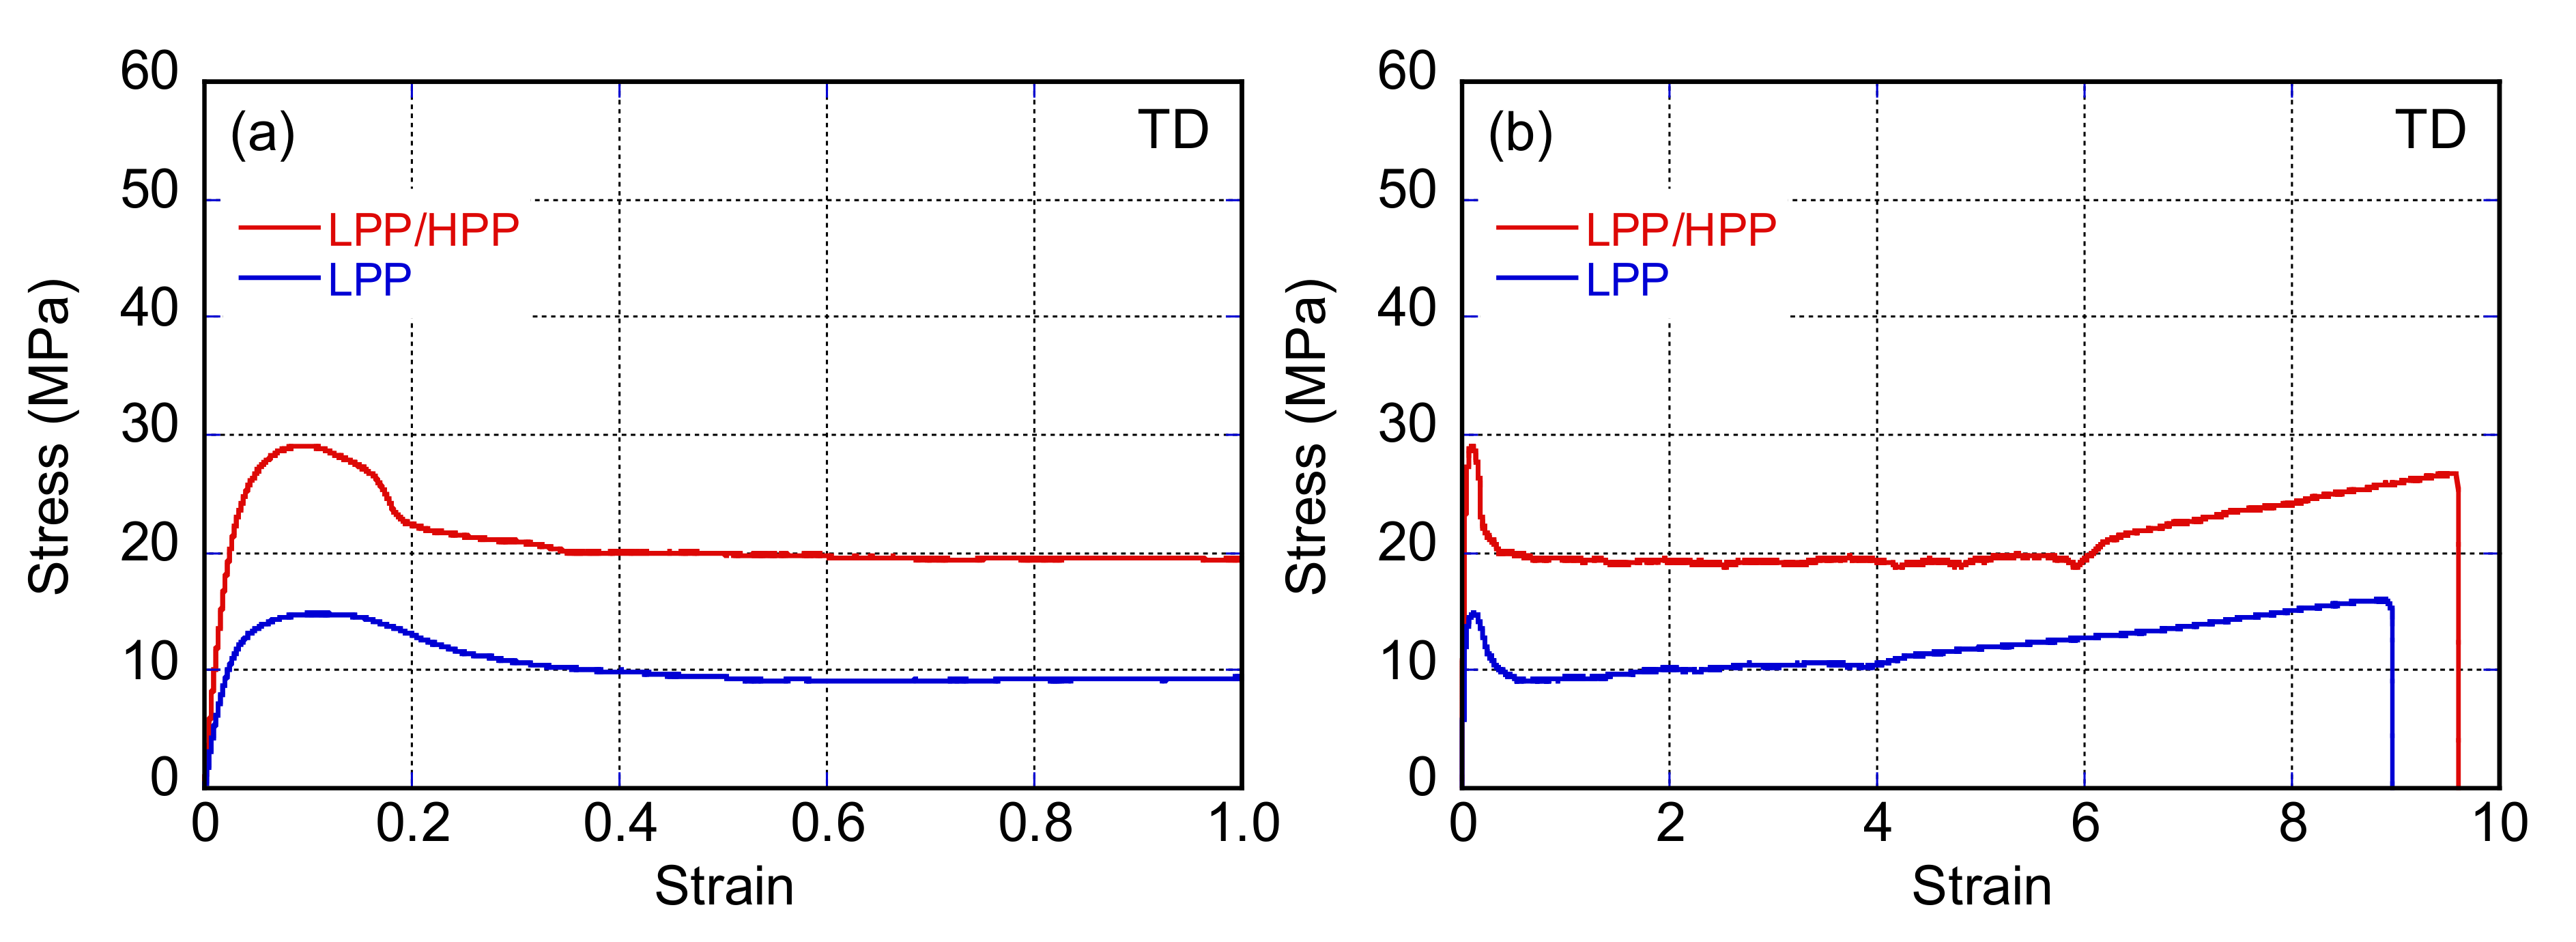
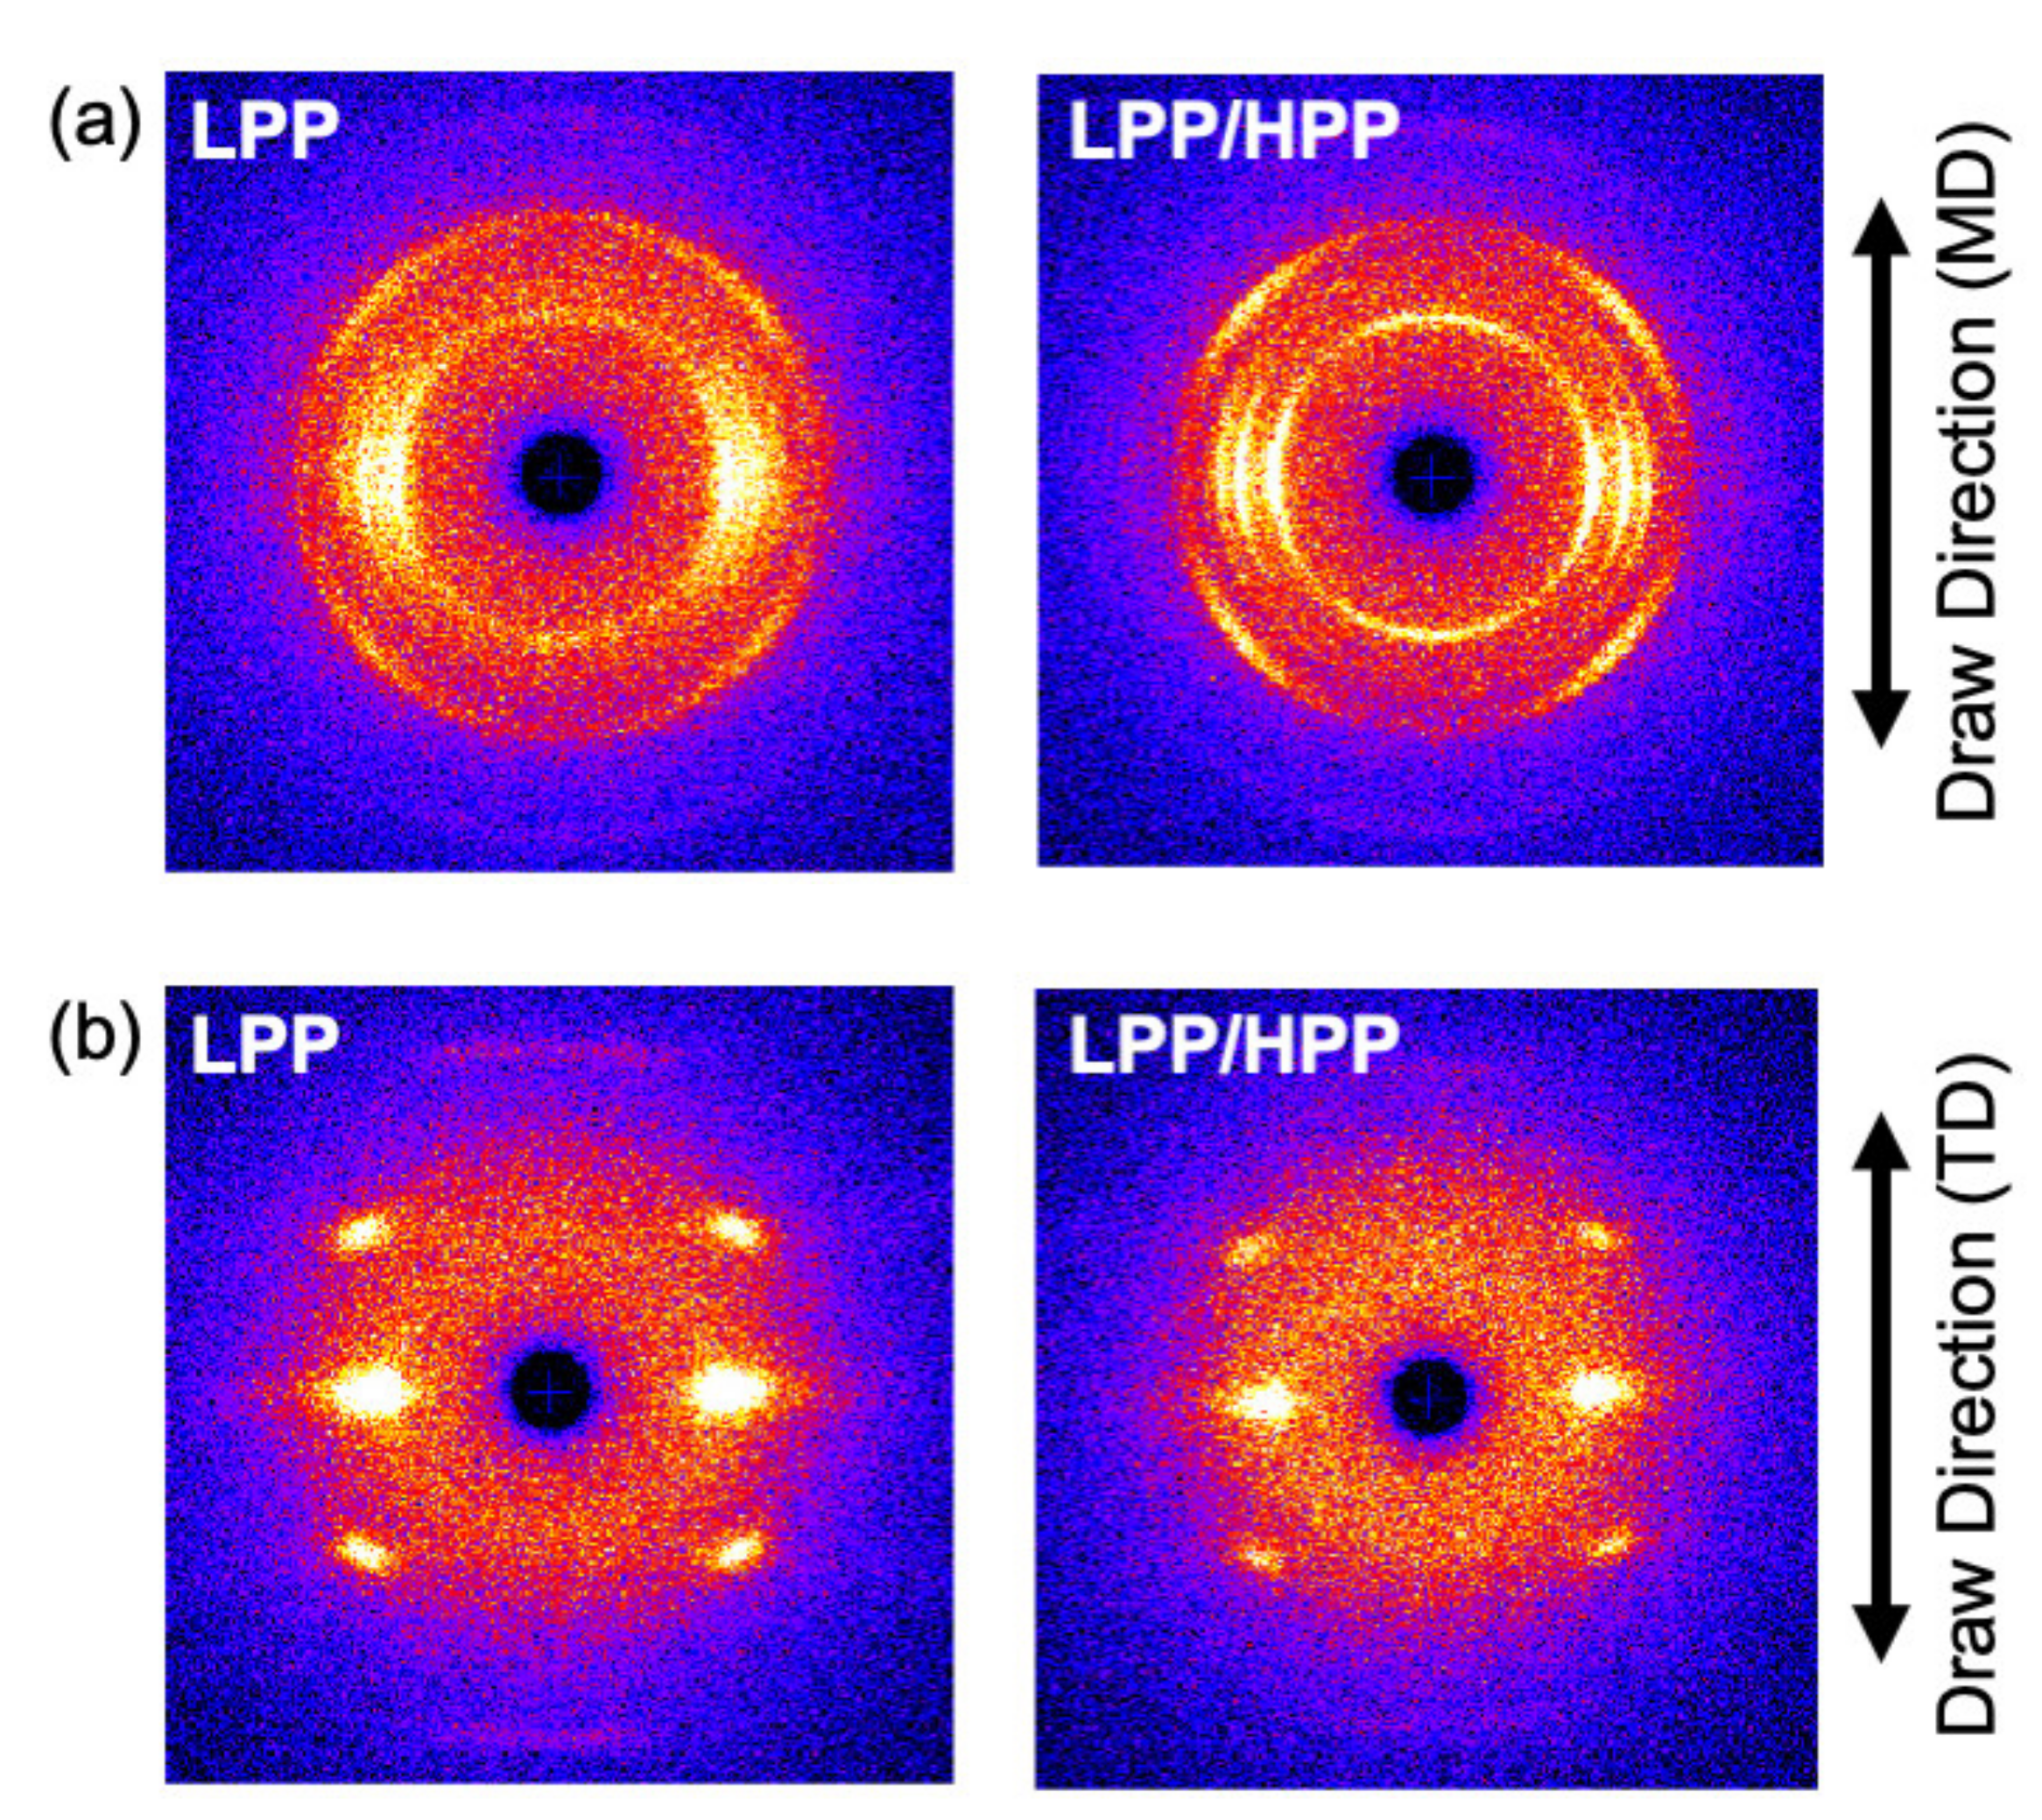
3.3. Morphology and Mechanical Properties of Films

The DSC curves obtained during the heating and cooling processes of LPP and LPP/HPP films at heating and cooling rates of 10 and 30 °C min−1, respectively, are shown in Figure 10. The melting and crystallization temperatures (Tm and Tc) were almost the same for both PP films, as denoted in Figure 10, which is in good agreement with the crystallization behavior demonstrated by the light transmittance shown in Figure 8. Moreover, as shown in Table 2, both PP samples had almost the same crystallinity, whereas the amount of rigid amorphous structure in LPP was higher than in LPP/HPP, suggesting that the LPP film included a large amount of imperfect crystalline structure compared with LPP/HPP.
The two-dimensional WAXD patterns of the LPP and LPP/HPP films are shown in Figure 11. Each PP film showed five diffraction peaks assigned to (110), (040), (130), (111), and (−131) of the PP α-crystals [51]. The integrated intensity profiles are plotted against 2θ in Figure 12. The figures in parentheses are the Miller indices. The crystalline diffraction peaks of LPP/HPP were sharper and stronger than those of LPP, although the crystallinity values calculated using Equation (3) were similar for each sample, as shown in Table 2. These results indicate that the crystalline regularity of LPP was imperfect compared with that of LPP/HPP. This corroborated the DSC results, which demonstrated that LPP included more rigid amorphous structure than HPP/LPP. It should be noted that the crystallinity determined by IR spectroscopy listed in Table 2 was similar for both PP samples, as corroborated by the DSC and WAXD results.
The azimuthal-angle dependence of the integrated intensity of the (040) diffraction peak is shown in Figure 13. There were sharp peaks in the intensity distribution at 90° and 270°, corresponding to the equator axis in Figure 11, for both PPs, suggesting that the c axis of the crystalline structure was oriented to the MD. The orientation of the crystalline structure was enhanced by the addition of the UHMW component because the peak width of the intensity profile of LPP/HPP was sharper than that of LPP. The orientation function values evaluated by WAXD and IR spectroscopy shown in Table 2 also suggest the enhancement of the crystalline structure orientation due to the addition of the UHMW component.
The two-dimensional SAXS patterns of the oriented films are shown in Figure 14. LPP/HPP exhibited a strong two-peak pattern in the MD compared with LPP, indicating that the addition of the UHMW component enhanced the lamellar orientation to the perpendicular direction of the MD. Such lamellar orientation behavior is corroborated by the WAXD results.
According to the evaluation of the rheological and crystallization behaviors of LPP and LPP/HPP, the strong orientation of the UHMW chains to the MD should remain during film processing, which results in the improvement of the orientation of the lamellar crystalline structure by the addition of the UHMW component.
The dynamic mechanical spectra of LPP and LPP/HPP films measured in the MD and TD are shown in Figure 15. Strain was applied along the MD and TD to investigate the effects of molecular orientation on solid-state viscoelasticity. For both PP samples, the E′ and E″ values for MD stretching were higher than those for TD stretching owing to the orientation to the MD. Moreover, for both MD and TD stretching, the E′ and E″ values for LPP/HPP were higher than those for LPP above the glass transition temperature at approximately 20 °C. These results were caused by the imperfect crystalline structure of LPP compared with that of LPP/HPP; disorder in the crystalline structure leads to low thermal stability.
Figure 16 and Figure 17 show the stress–strain curves of LPP and LPP/HPP films stretched along the MD and TD, respectively. The Young’s modulus, yield stress, and strength of LPP/HPP were higher than those of LPP with regard to MD stretching. As shown in Figure 18, the drawn specimens elongated up to ε = 1.5 along the MD exhibited homogeneous birefringence color without necking formation. Moreover, the two-dimensional WAXD patterns of the LPP and LPP/HPP films were almost the same as those of the undrawn films shown in Figure 11, suggesting that the initial crystalline structure of the undrawn films remained during the stretching process. These results indicate that the yielding deformation associated with MD stretching was caused by the pull-out of the molecular chains from the crystalline structure [52,53], because the pull-out deformation is homogeneously caused in all lamellar crystals. This is consistent with the homogeneous deformation without necking formation as observed in Figure 18a. Consequently, the improvements in the Young’s modulus, yield stress, and strength following the addition of the UHMW component resulted from the higher molecular orientation and high regularity of the crystalline structure.
With regard to TD stretching, the Young’s modulus, yield stress, and strength of LPP/HPP were increased by the addition of the UHMW component, as with MD stretching. However, in contrast to MD stretching, the stress–strain curve associated with TD stretching for each PP sample featured a neck-propagation region, and clear necking occurred in the drawn specimens of both samples elongated in the TD, as shown in Figure 18b. The two-dimensional WAXD patterns of the drawn specimens shown in Figure 19b suggest that the crystalline structure was highly oriented in the TD direction, and the orientation degree of LPP/HPP was higher than that of LPP. Moreover, the crystalline structure associated with TD stretching was significantly disordered in both samples because the diffraction peaks were obviously broadened. These results suggest that the initial crystalline structure that was highly oriented along the MD fragmented into smaller crystallites and reoriented in the TD direction, leading to the formation of necking [54,55,56]. The crystalline structure of the undrawn LPP film was disordered compared with that of the undrawn LPP/HPP, as shown in Figure 11. Therefore, the Young’s modulus, yield stress, and strength of LPP/HPP were higher than those of LPP in the TD stretching. It should be noted that the orientation behavior of the drawn specimens of LPP and LPP/HPP evaluated by WAXD measurements were identical to those evaluated by birefringence measurements.

4. Conclusions

The present study comprised an investigation of the effects of a UHMW component on the rheological properties, crystallization behavior, and mechanical properties of PP. The elasticity of the melt state was improved by adding the UHMW component, as demonstrated by the higher values of the primary normal stress difference, the extrudate swell ratio, and the drop in end pressure of LPP/HPP than of LPP. It should be noted that the enhancements in rheological properties resulting from the addition of the UHMW component were achieved without an increase in the shear viscosity. Moreover, LPP/HPP exhibited strain hardening during uniaxial elongational flow in the high strain rate region. The strain hardening was due to that the orientation of the UHMW chains cannot be relaxed during uniaxial elongation owing to the characteristic long duration of the Rouse mode. With regard to the crystallization behavior, the addition of the UHMW component had no influence on the crystallization temperature, and spherulites were formed in both PP samples. However, the formation of a highly oriented structure was enhanced by the strong orientation of the UHMW chains during crystallization with shear flow. The enhancement of the molecular orientation by the addition of the UHMW component was also observed in the T-die films. Moreover, the numbers of crystalline defects and rigid amorphous structures decreased following the addition of the UHMW component, resulting in the strong orientation of crystalline structure in LPP/HPP compared with in LPP. Consequently, the Young’s modulus and strength of the LPP/HPP films were higher than those of the LPP films for both MD and TD stretching. These results provide useful information for the improvement of the rheological and mechanical properties of semi-crystalline polymeric materials.

Author Contributions

Data curation, T.K. (Takeyoshi Kimura), A.E. and K.J.; Investigation, T.K. (Takumitsu Kida) and T.K. (Takeyoshi Kimura); Methodology, T.K. (Takumitsu Kida); Resources, T.K. (Tokutaro Kimura), T.M. (Tomoaki Mizukawa), T.M. (Tomoya Murakami), K.H. and T.O.; Software, Y.O.; Supervision, M.Y.; Writing—Original Draft, T.K. (Takumitsu Kida); Writing—Review and Editing, T.K. (Takumitsu Kida), M.Y. and Y.O. All authors have read and agreed to the published version of the manuscript.

Funding

This work was supported by the JSPS KAKENHI (grant number 20K15345).

Institutional Review Board Statement

Not applicable.

Informed Consent Statement

Not applicable.

Data Availability Statement

Not applicable.

Conflicts of Interest

The authors declare no conflict of interest.

References

  1. Gentekos, D.T.; Sifri, R.J.; Fors, B.P. Controlling polymer properties through the shape of the molecular-weight distribution. Nat. Rev. Mater. 2019, 4, 761–774. [Google Scholar] [CrossRef]
  2. Kennedy, M.A.; Peacock, A.J.; Failla, M.D.; Lucasji, J.C.; Mandelkern, L. Tensile Properties of Crystalline Polymers: Random Copolymers of Ethylene. Macromolecules 1995, 28, 1407–1421. [Google Scholar] [CrossRef]
  3. Hu, Y.; Shao, Y.; Liu, Z.; He, X.; Liu, B. Effect of short-chain branching on the tie chains and dynamics of bimodal polyethylene: Molecular dynamics simulation. Eur. Polym. J. 2018, 103, 312–321. [Google Scholar] [CrossRef]
  4. Zielińska, D.; Rydzkowski, T.; Thakur, V.K.; Borysiak, S. Enzymatic engineering of nanometric cellulose for sustainable polypropylene nanocomposites. Ind. Crops Prod. 2021, 161, 11388. [Google Scholar] [CrossRef]
  5. Nishikawa, R.; Aridome, N.; Ojima, N.; Yamaguchi, M. Structure and properties of fiber-reinforced polypropylene prepared by direct incorporation of aqueous solution of poly(vinyl alcohol). Polymer 2020, 199, 122566. [Google Scholar] [CrossRef]
  6. Iwasaki, S.; Inoue, M.; Takei, Y.; Nishikawa, R.; Yamaguchi, M. Modulus enhancement of polypropylene by sorbitol nucleating agent in flow field. Polym. Cryst. 2021, 4, e10170. [Google Scholar] [CrossRef]
  7. Phulkerd, P.; Nakabayashi, T.; Iwasaki, S.; Yamaguchi, M. Enhancement of drawdown force in polypropylene containing nucleating agent. J. Appl. Polym. Sci. 2019, 136, 1–7. [Google Scholar] [CrossRef]
  8. Colby, R.H.; Fetters, L.J.; Graessley, W.W. Melt Viscosity-Molecular Weight Relationship for Linear Polymers. Macromolecules 1987, 20, 2226–2237. [Google Scholar] [CrossRef]
  9. Pearson, D.S.; Ver Strate, G.; von Meerwall, E.; Schilling, F.C. Viscosity and Self-Diffusion Coefficient of Linear Polyethylene. Macromolecules 1987, 20, 1133–1141. [Google Scholar] [CrossRef]
  10. Anderews, J.M.; Ward, I.M. The cold-drawing of high density polyethylene. J. Mater. Sci. 1970, 5, 411–417. [Google Scholar] [CrossRef]
  11. Kennedy, M.A.; Peacock, A.J.; Mandelkern, L. Tensile Properties of Crystalline Polymers: Linear Polyethylene. Macromolecules 1994, 27, 5297–5310. [Google Scholar] [CrossRef]
  12. Diop, M.F.; Burghardt, W.R.; Torkelson, J.M. Well-mixed blends of HDPE and ultrahigh molecular weight polyethylene with major improvements in impact strength achieved via solid-state shear pulverization. Polymer 2014, 55, 4948–4958. [Google Scholar] [CrossRef]
  13. Tanaka, H.; Saijo, S.; Kakiage, M.; Yamanobe, T.; Uehara, H. In-situ analysis for melt-drawing behavior of ultra-high molecular weight polyethylene/normal molecular weight polyethylene blend films. Polymer 2021, 213, 123213. [Google Scholar] [CrossRef]
  14. Capaccio, G.; Ward, I.M. Preparation of ultra-high modulus linear polyethylenes; effect of molecular weight and molecular weight distribution on drawing behaviour and mechanical properties. Polymer 1974, 15, 233–238. [Google Scholar] [CrossRef]
  15. Sun, X.; Shen, H.; Xie, B.; Yang, W.; Yang, M. Fracture behavior of bimodal polyethylene: Effect of molecular weight distribution characteristics. Polymer 2011, 52, 564–570. [Google Scholar] [CrossRef]
  16. Kida, T.; Tanaka, R.; Hiejima, Y.; Nitta, K.-H.; Shiono, T. Improving the strength of polyethylene solids by simple controlling of the molecular weight distribution. Polymer 2021, 218, 123526. [Google Scholar] [CrossRef]
  17. Münstedt, H. Dependence of the Elongational Behavior of Polystyrene Melts on Molecular Weight and Molecular Weight Distribution. J. Rheol. 1980, 24, 847–867. [Google Scholar] [CrossRef]
  18. Minegishi, A.; Nishioka, A.; Takahashi, T.; Masubuchi, Y.; Takimoto, J.; Koyama, K. Uniaxial elongational viscosity of PS/a small amount of UHMW-PS blends. Rheol. Acta 2001, 40, 329–338. [Google Scholar] [CrossRef]
  19. Nielsen, J.K.; Rasmussen, H.K.; Hassager, O.; McKinley, G.H. Elongational viscosity of monodisperse and bidisperse polystyrene melts. J. Rheol. 2006, 50, 453–476. [Google Scholar] [CrossRef] [Green Version]
  20. Wingstrand, S.L.; Shen, B.; Kornfield, J.A.; Mortensen, K.; Parisi, D.; Vlassopoulos, D.; Hassager, O. Rheological Link between Polymer Melts with a High Molecular Weight Tail and Enhanced Formation of Shish-Kebabs. ACS Macro Lett. 2017, 6, 1268–1273. [Google Scholar] [CrossRef]
  21. Mykhaylyk, O.O.; Chambon, P.; Impradice, C.; Fairclough, J.P.A.; Terrill, N.J.; Ryan, A.J. Control of structural morphology in shear-induced crystallization of polymers. Macromolecules 2010, 43, 2389–2405. [Google Scholar] [CrossRef]
  22. Hamad, F.G.; Colby, R.H.; Milner, S.T. Onset of Flow-Induced Crystallization Kinetics of Highly Isotactic Polypropylene. Macromolecules 2015, 48, 3725–3738. [Google Scholar] [CrossRef]
  23. Matsuba, G.; Sakamoto, S.; Ogino, Y.; Nishida, K.; Kanaya, T. Crystallization of polyethylene blends under shear flow. Effects of crystallization temperature and ultrahigh molecular weight component. Macromolecules 2007, 40, 7270–7275. [Google Scholar] [CrossRef]
  24. Kanaya, T.; Matsuba, G.; Ogino, Y.; Nishida, K.; Shimizu, H.M.; Shinohara, T.; Oku, T.; Suzuki, J.; Otomo, T. Hierarchic structure of shish-kebab by neutron scattering in a wide Q range. Macromolecules 2007, 40, 3650–3654. [Google Scholar] [CrossRef]
  25. Bashir, Z.; Odell, J.A.; Keller, A. High modulus filaments of polyethylene with lamellar structure by melt processing; the role of the high molecular weight component. J. Mater. Sci. 1984, 19, 3713–3725. [Google Scholar] [CrossRef]
  26. Bashir, Z.; Odell, J.A.; Keller, A. Stiff and strong polyethylene with shish kebab morphology by continuous melt extrusion. J. Mater. Sci. 1986, 21, 3993–4002. [Google Scholar] [CrossRef]
  27. Seemork, J.; Siriprumpoonthum, M.; Lee, Y.; Nobukawa, S.; Yamaguchi, M. Effect of die geometry on drawdown force of polypropylene at capillary extrusion. Adv. Polym. Technol. 2015, 34, 1–7. [Google Scholar] [CrossRef]
  28. Wunderlich, B. Macromolecular Physics, Crystal Structure, Morphology, Defects; Academic Press: New York, NY, USA, 1973. [Google Scholar]
  29. Zia, Q.; Mileva, D.; Androsch, R. Rigid amorphous fraction in isotactic polypropylene. Macromolecules 2008, 41, 8095–8102. [Google Scholar] [CrossRef]
  30. Di Lorenzo, M.L.; Righetti, M.C. Crystallization-induced formation of rigid amorphous fraction. Polym. Cryst. 2018, 1, 1–14. [Google Scholar] [CrossRef]
  31. Wunderlich, B. The Athas database on heat capacities of polymers. Pure Appl. Chem. 1995, 67, 1019–1026. [Google Scholar] [CrossRef]
  32. Wunderlich, B. Thermal Analysis of Polymeric Materials; Springer: New York, NY, USA, 1995. [Google Scholar]
  33. Wilchinsky, Z.W. Measurement of Orientation in Polypropylene Film. J. Appl. Phys. 1960, 31, 1969–1972. [Google Scholar] [CrossRef]
  34. Tanaka, M.; Young, R. Molecular orientation distributions in uniaxially oriented poly (L-lactic acid) films determined by polarized Raman spectroscopy. Macromolecules 2006, 39, 3312–3321. [Google Scholar] [CrossRef]
  35. Arvidson, S.A.; Khan, S.A.; Gorga, R.E. Mesomorphic-α-monoclinic phase transition in isotactic polypropylene: A study of processing effects on structure and mechanical properties. Macromolecules 2010, 43, 2916–2924. [Google Scholar] [CrossRef]
  36. Bower, D.I.; Maddams, W.F. The Vibrational Spectroscopy of Polymers; Cambridge University Press: New York, NY, USA, 1992. [Google Scholar]
  37. Nitta, K.-H.; Sawada, T.; Yoshida, S.; Kawamura, T. Three dimensional molecular orientation of isotactic polypropylene films under biaxial deformation at higher temperatures. Polymer 2015, 74, 30–37. [Google Scholar] [CrossRef]
  38. Parthasarthy, G.; Sevegney, M.; Kannan, R.M. Rheooptical Fourier transform infrared spectroscopy of the deformation behavior in quenched and slow-cooled isotactic polypropylene films. J. Polym. Sci. Part B Polym. Phys. 2002, 40, 2539–2551. [Google Scholar] [CrossRef]
  39. Lanyi, F.J.; Wenzke, N.; Kaschta, J.; Schubert, D.W. A method to reveal bulk and surface crystallinity of Polypropylene by FTIR spectroscopy—Suitable for fibers and nonwovens. Polym. Test. 2018, 71, 49–55. [Google Scholar] [CrossRef]
  40. Yamaguchi, M.; Takahashi, M. Rheological properties of low-density polyethylenes produced by tubular and vessel processes. Polymer 2001, 42, 8663–8670. [Google Scholar] [CrossRef]
  41. Mieda, N.; Yamaguchi, M. Flow instability for binary blends of linear polyethylene and long-chain branched polyethylene. J. Non-Newton. Fluid Mech. 2011, 166, 231–240. [Google Scholar] [CrossRef]
  42. Osaki, K.; Murai, A.; Bessho, N.; Kim, B.S. Linear Viscoelastic Relation Concerning Shear Stresses at the Start and Cessation of Steady Shear Flow. Nihon Reoroji Gakkaishi (J. Soc. Rheol. Jpn.) 1976, 4, 166–169. [Google Scholar] [CrossRef] [Green Version]
  43. Yamaguchi, M. Flow instability in capillary extrusion of plasticized poly(vinyl chloride). J. Appl. Polym. Sci. 2001, 82, 1277–1283. [Google Scholar] [CrossRef]
  44. Yamaguchi, M.; Suzuki, K.I. Enhanced strain hardening in elongational viscosity for HDPE/crosslinked HDPE blend. II. Processability of thermoforming. J. Appl. Polym. Sci. 2002, 86, 79–83. [Google Scholar] [CrossRef]
  45. Yamaguchi, M. Material Strength in Molten State for Foam. In Foram Extrusion: Principles and Practie; Lee, S.-T., Park, C.B., Eds.; CRC Press: New York, NY, USA, 2014; p. 36. ISBN 9780429184703. [Google Scholar]
  46. Kugimoto, D.; Kouda, S.; Yamaguchi, M. Modification of Poly(Lactic Acid) Rheological Properties Using Ethylene—Vinyl Acetate Copolymer. J. Polym. Environ. 2021, 29, 121–129. [Google Scholar] [CrossRef]
  47. Seki, M.; Thurman, D.W.; Oberhauser, J.P.; Kornfield, J.A. Shear-Mediated Crystallization of Isotactic Polypropylene: The Role of Long Chain−Long Chain Overlap. Macromolecules 2002, 35, 2583–2594. [Google Scholar] [CrossRef]
  48. Koscher, E.; Fulchiron, R. Influence of shear on polypropylene crystallization: Morphology development and kinetics. Polymer 2002, 43, 6931–6942. [Google Scholar] [CrossRef]
  49. Doi, M.; Edwards, S.F. The Theory of Polymer Dynamics; Clarendon Press: Oxford, UK, 1986. [Google Scholar]
  50. Fetters, L.J.; Lohse, D.J.; Graessley, W.W. Chain dimensions and entanglement spacings in dense macromolecular systems. J. Polym. Sci. Part B Polym. Phys. 1999, 37, 1023–1033. [Google Scholar] [CrossRef]
  51. Pasquini, N. Polypropylene Handbook; Carl Hanser Verlag: Munich, Germany, 2005. [Google Scholar]
  52. Takayanagi, M.; Nitta, K.-H. Application of a tie molecule model to the postyielding deformation of crystalline polymers. Macromol. Theory Simul. 1997, 6, 181–195. [Google Scholar] [CrossRef]
  53. Nitta, K.-H.; Nomura, H. Stress–strain behavior of cold-drawn isotactic polypropylene subjected to various drawn histories. Polymer 2014, 55, 6614–6622. [Google Scholar] [CrossRef]
  54. Strobl, G. The Physics of Polymers: Concepts for Understanding Their Structures and Behavior, 3rd ed.; Springer: Berlin, Germany, 2007. [Google Scholar]
  55. Nitta, K.-H.; Takayanagi, M. Novel proposal of lamellar clustering process for elucidation of tensile yield behavior of linear polyethylenes. J. Macromol. Sci. Phys. 2003, 42, 107–126. [Google Scholar] [CrossRef]
  56. Kuriyagawa, M.; Nitta, K.-H. Structural explanation on natural draw ratio of metallocene-catalyzed high density polyethylene. Polymer 2011, 52, 3469–3477. [Google Scholar] [CrossRef]
Figure 1. Schematics of the microscopic system combined with the shear stage viewed from (a) the side and (b) the top.
Polymers 13 04222 g001
Figure 2. Angular−-frequency dependences of the storage and loss moduli (G′ and G″) of (a) LPP and (b) LPP/HPP (LPP is a unimodal PP and HPP is a bimodal PP). The reference temperature (Tr) was 180 °C.
Polymers 13 04222 g002
Figure 3. Shear-rate ( γ ˙ ) dependences of the shear stress (σ) and the primary normal stress difference (N) of LPP and LPP/HPP at 190 °C (LPP is a unimodal PP and HPP is a bimodal PP).
Polymers 13 04222 g003
Figure 4. Ratio of the diameter of the extruded strand (d) and the die (D) plotted against the apparent wall shear rate ( γ ˙ wa ) during capillary extrusion.
Polymers 13 04222 g004
Figure 5. End-pressure drop (ΔPe) for LPP and LPP/HPP plotted against the apparent wall shear rate ( γ ˙ wa ) at 190 °C (LPP is a unimodal PP and HPP is a bimodal PP).
Polymers 13 04222 g005
Figure 6. Steady-state shear stress (σw) and viscosity (ηw) plotted against the shear rate ( γ ˙ w ) during capillary extrusion at 190 °C for LPP and LPP/HPP (LPP is a unimodal PP and HPP is a bimodal PP).
Polymers 13 04222 g006
Figure 7. Transient uniaxial elongation viscosity (ηE+(t, ε ˙ )) at various Hencky strain rates ( ε ˙ ) at 190 °C for (a) LPP and (b) LPP/HPP (LPP is a unimodal PP and HPP is a bimodal PP). The solid line represents the calculated viscosity growth curve.
Polymers 13 04222 g007
Figure 8. (a) Temperature dependence of light transmittance and (b) polarized optical microscopy (POM) images at 110, 115, and 120 °C during non-isothermal crystallization at 30 °C min−1 in the absence of shear flow for both polypropylene (PP) samples.
Polymers 13 04222 g008
Figure 9. (a) Temperature dependence of light transmittance and (b) polarized optical microscopy (POM) images at 115, 120, 125, and 130 °C during non-isothermal crystallization at 30 °C min−1 after the cessation of shear flow (100 s−1) at 160 °C.
Polymers 13 04222 g009
Figure 10. Differential scanning calorimetry (DSC) curves during (a) heating at 10 °C min−1 and (b) cooling at 30 °C min−1 for LPP and LPP/HPP (LPP is a unimodal PP and HPP is a bimodal PP).
Polymers 13 04222 g010
Figure 11. Two-dimensional wide-angle X-ray diffraction (WAXD) patterns of LPP (left) and LPP/HPP (right) (LPP is a unimodal PP and HPP is a bimodal PP).
Polymers 13 04222 g011
Figure 12. Integrated intensity profiles plotted against 2θ for LPP and LPP/HPP (LPP is a unimodal PP and HPP is a bimodal PP).
Polymers 13 04222 g012
Figure 13. Azimuthal-angle distribution of the (040) diffraction plane of LPP and LPP/HPP α crystals (LPP is a unimodal PP and HPP is a bimodal PP).
Polymers 13 04222 g013
Figure 14. Two-dimensional small-angle X-ray scattering (SAXS) patterns of sample films of LPP (left) and LPP/HPP (right) (LPP is a unimodal PP and HPP is a bimodal PP).
Polymers 13 04222 g014
Figure 15. Temperature dependence of the storage modulus (E′), loss modulus (E″), and loss tangent (tanδ) at 10 Hz for LPP and LPP/HPP at the applied strain along (a) the machine direction (MD) and (b) the transverse direction (TD) (LPP is a unimodal PP and HPP is a bimodal PP).
Polymers 13 04222 g015
Figure 16. Stress–strain curves (a) in the yielding region and (b) up to the strain at break of LPP and LPP/HPP films stretched along the flow direction (MD) (LPP is a unimodal PP and HPP is a bimodal PP).
Polymers 13 04222 g016
Figure 17. Stress–strain curves (a) in the yielding region and (b) up to the strain at break of LPP and LPP/HPP films stretched along the transverse direction (TD) (LPP is a unimodal PP and HPP is a bimodal PP).
Polymers 13 04222 g017
Figure 18. Polarized optical microscopy (POM) images of drawn specimens of LPP and LPP/HPP elongated up to a strain of 1.5 along (a) the flow direction (MD) and (b) the transverse direction (TD) (LPP is a unimodal PP and HPP is a bimodal PP).
Polymers 13 04222 g018
Figure 19. Two-dimensional wide-angle X-ray diffraction (WAXD) patterns of drawn LPP (left) and LPP/HPP (right) elongated along (a) the flow direction (MD) and (b) the transverse direction (TD) (LPP is a unimodal PP and HPP is a bimodal PP).
Polymers 13 04222 g019
Table 1. Drawdown force during the capillary extrusion of polypropylene (PP) samples at draw ratios (DRs) of 10 and 30.
Sample CodeDrawdown Force (mN)
DR = 10DR = 30
LPP5670
LPP/HPP8696
Table 2. Characteristics of the LPP and LPP/HPP films (LPP is a unimodal PP and HPP is a bimodal PP).
Sample CodeχDSC (wt%)χRA (wt%)χWAXD (wt%)χIR (wt%)fWAXDfIR,cfIR,a
LPP34.359.549.351.80.120.220.15
LPP/HPP34.554.152.153.60.180.280.16
Publisher’s Note: MDPI stays neutral with regard to jurisdictional claims in published maps and institutional affiliations.

