
The Room Temperature Highly Sensitive Ammonia Gas Sensor Based on Polyaniline and Nitrogen-Doped Graphene Quantum Dot-Coated Hollow Indium Oxide Nanofiber Composite


Abstract
:
1. Introduction
2. Materials and Methods
2.1. Materials
2.2. Preparation of Graphene Nanoribbon and Indium Trioxide
2.3. Synthesis of Polyaniline/Nitrogen-Doped Graphene Quantum Dot/Hollow Indium Trioxide Nanofiber Composites
2.4. Analytical Procedures
3. Results
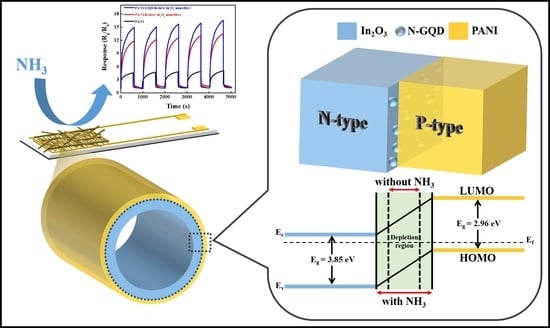
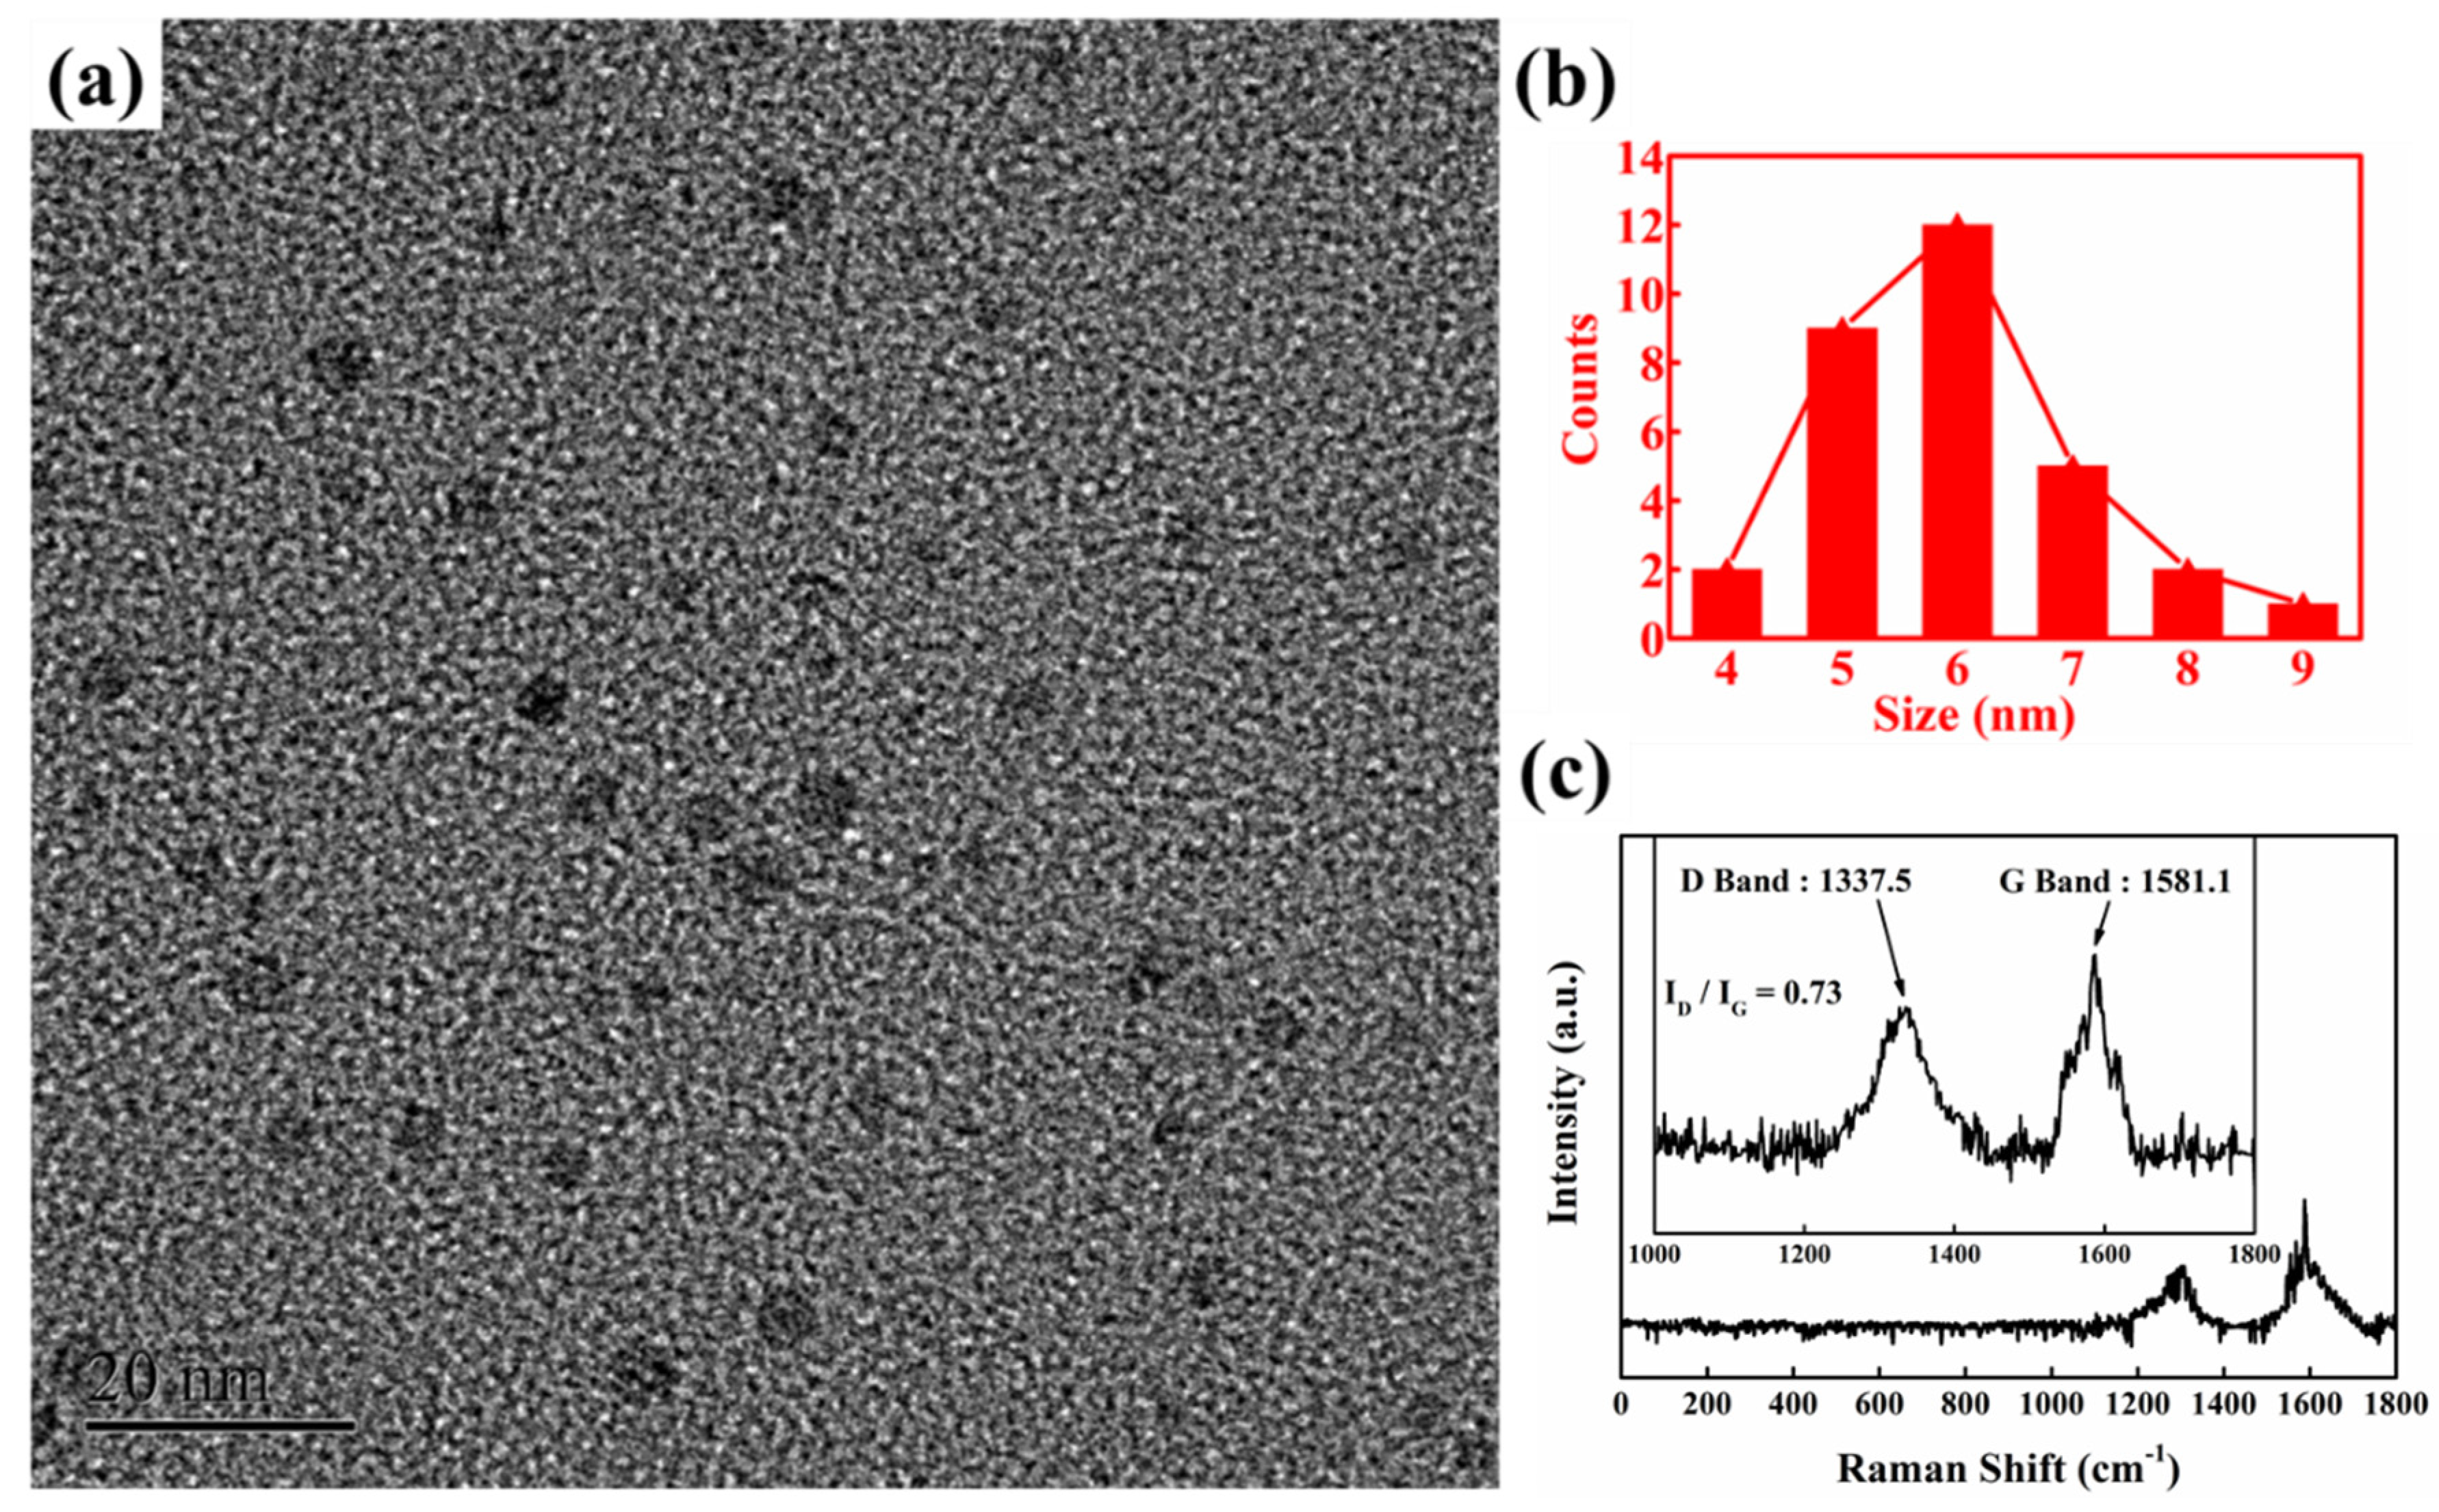
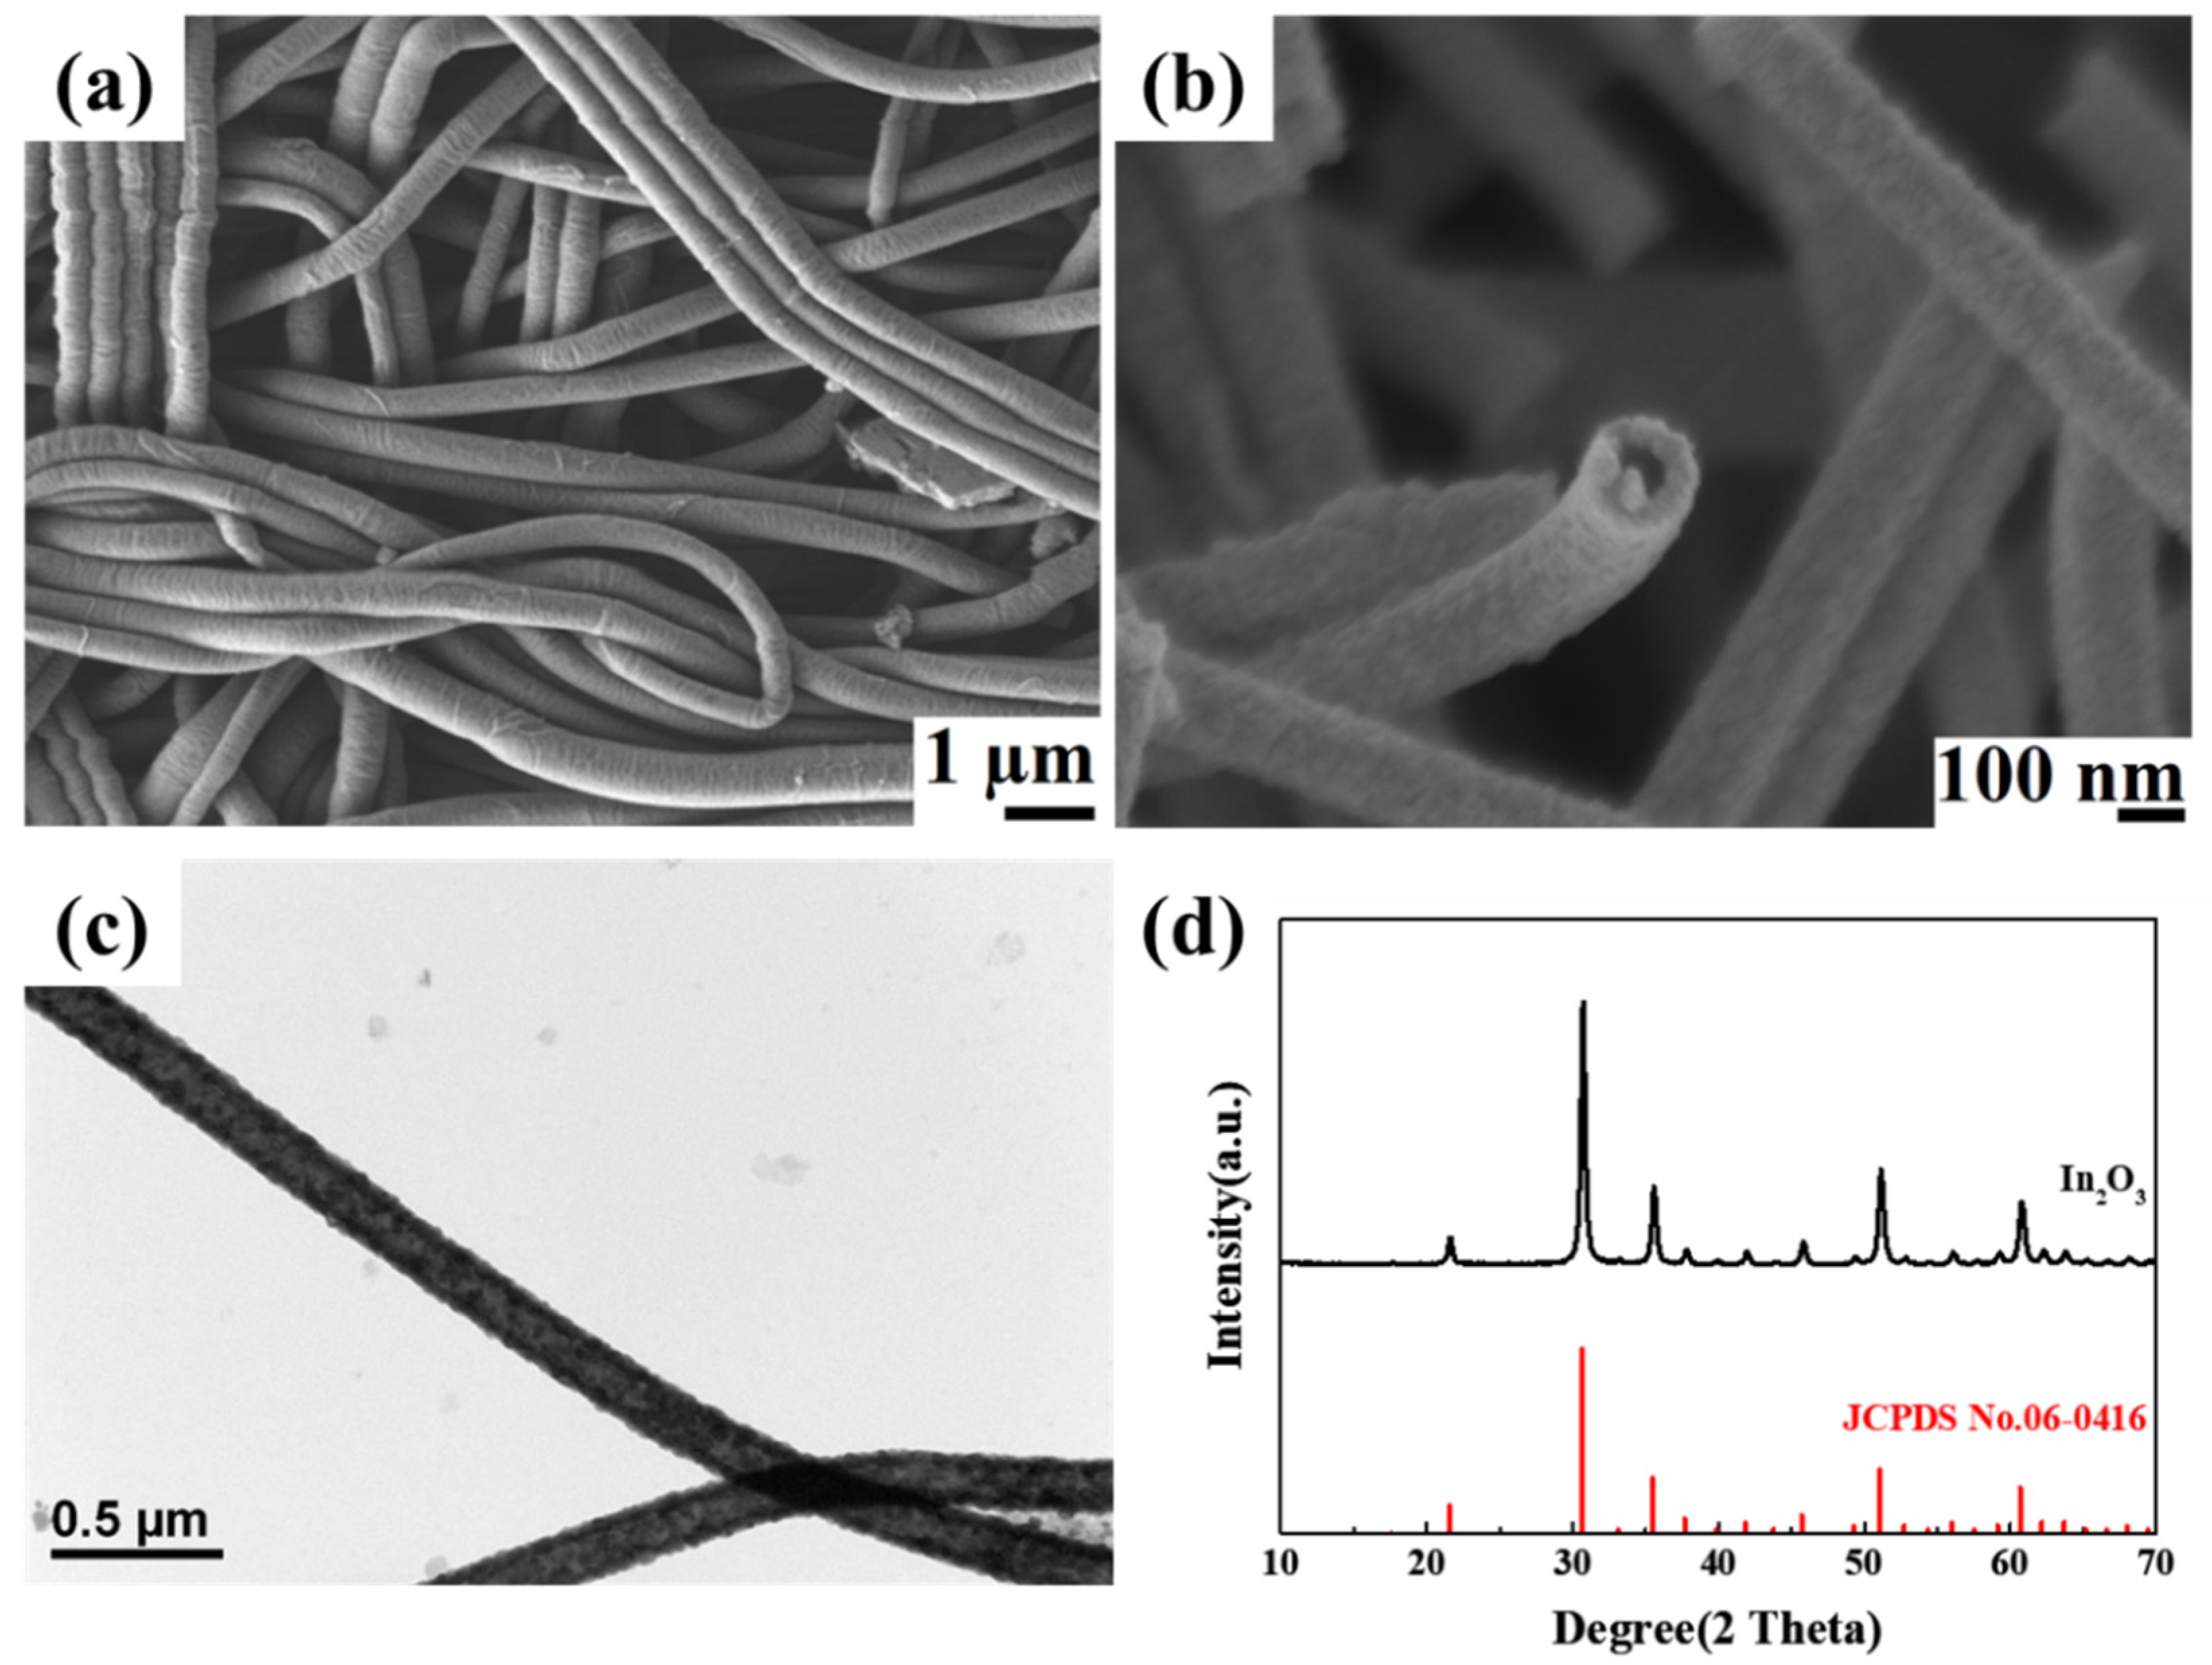
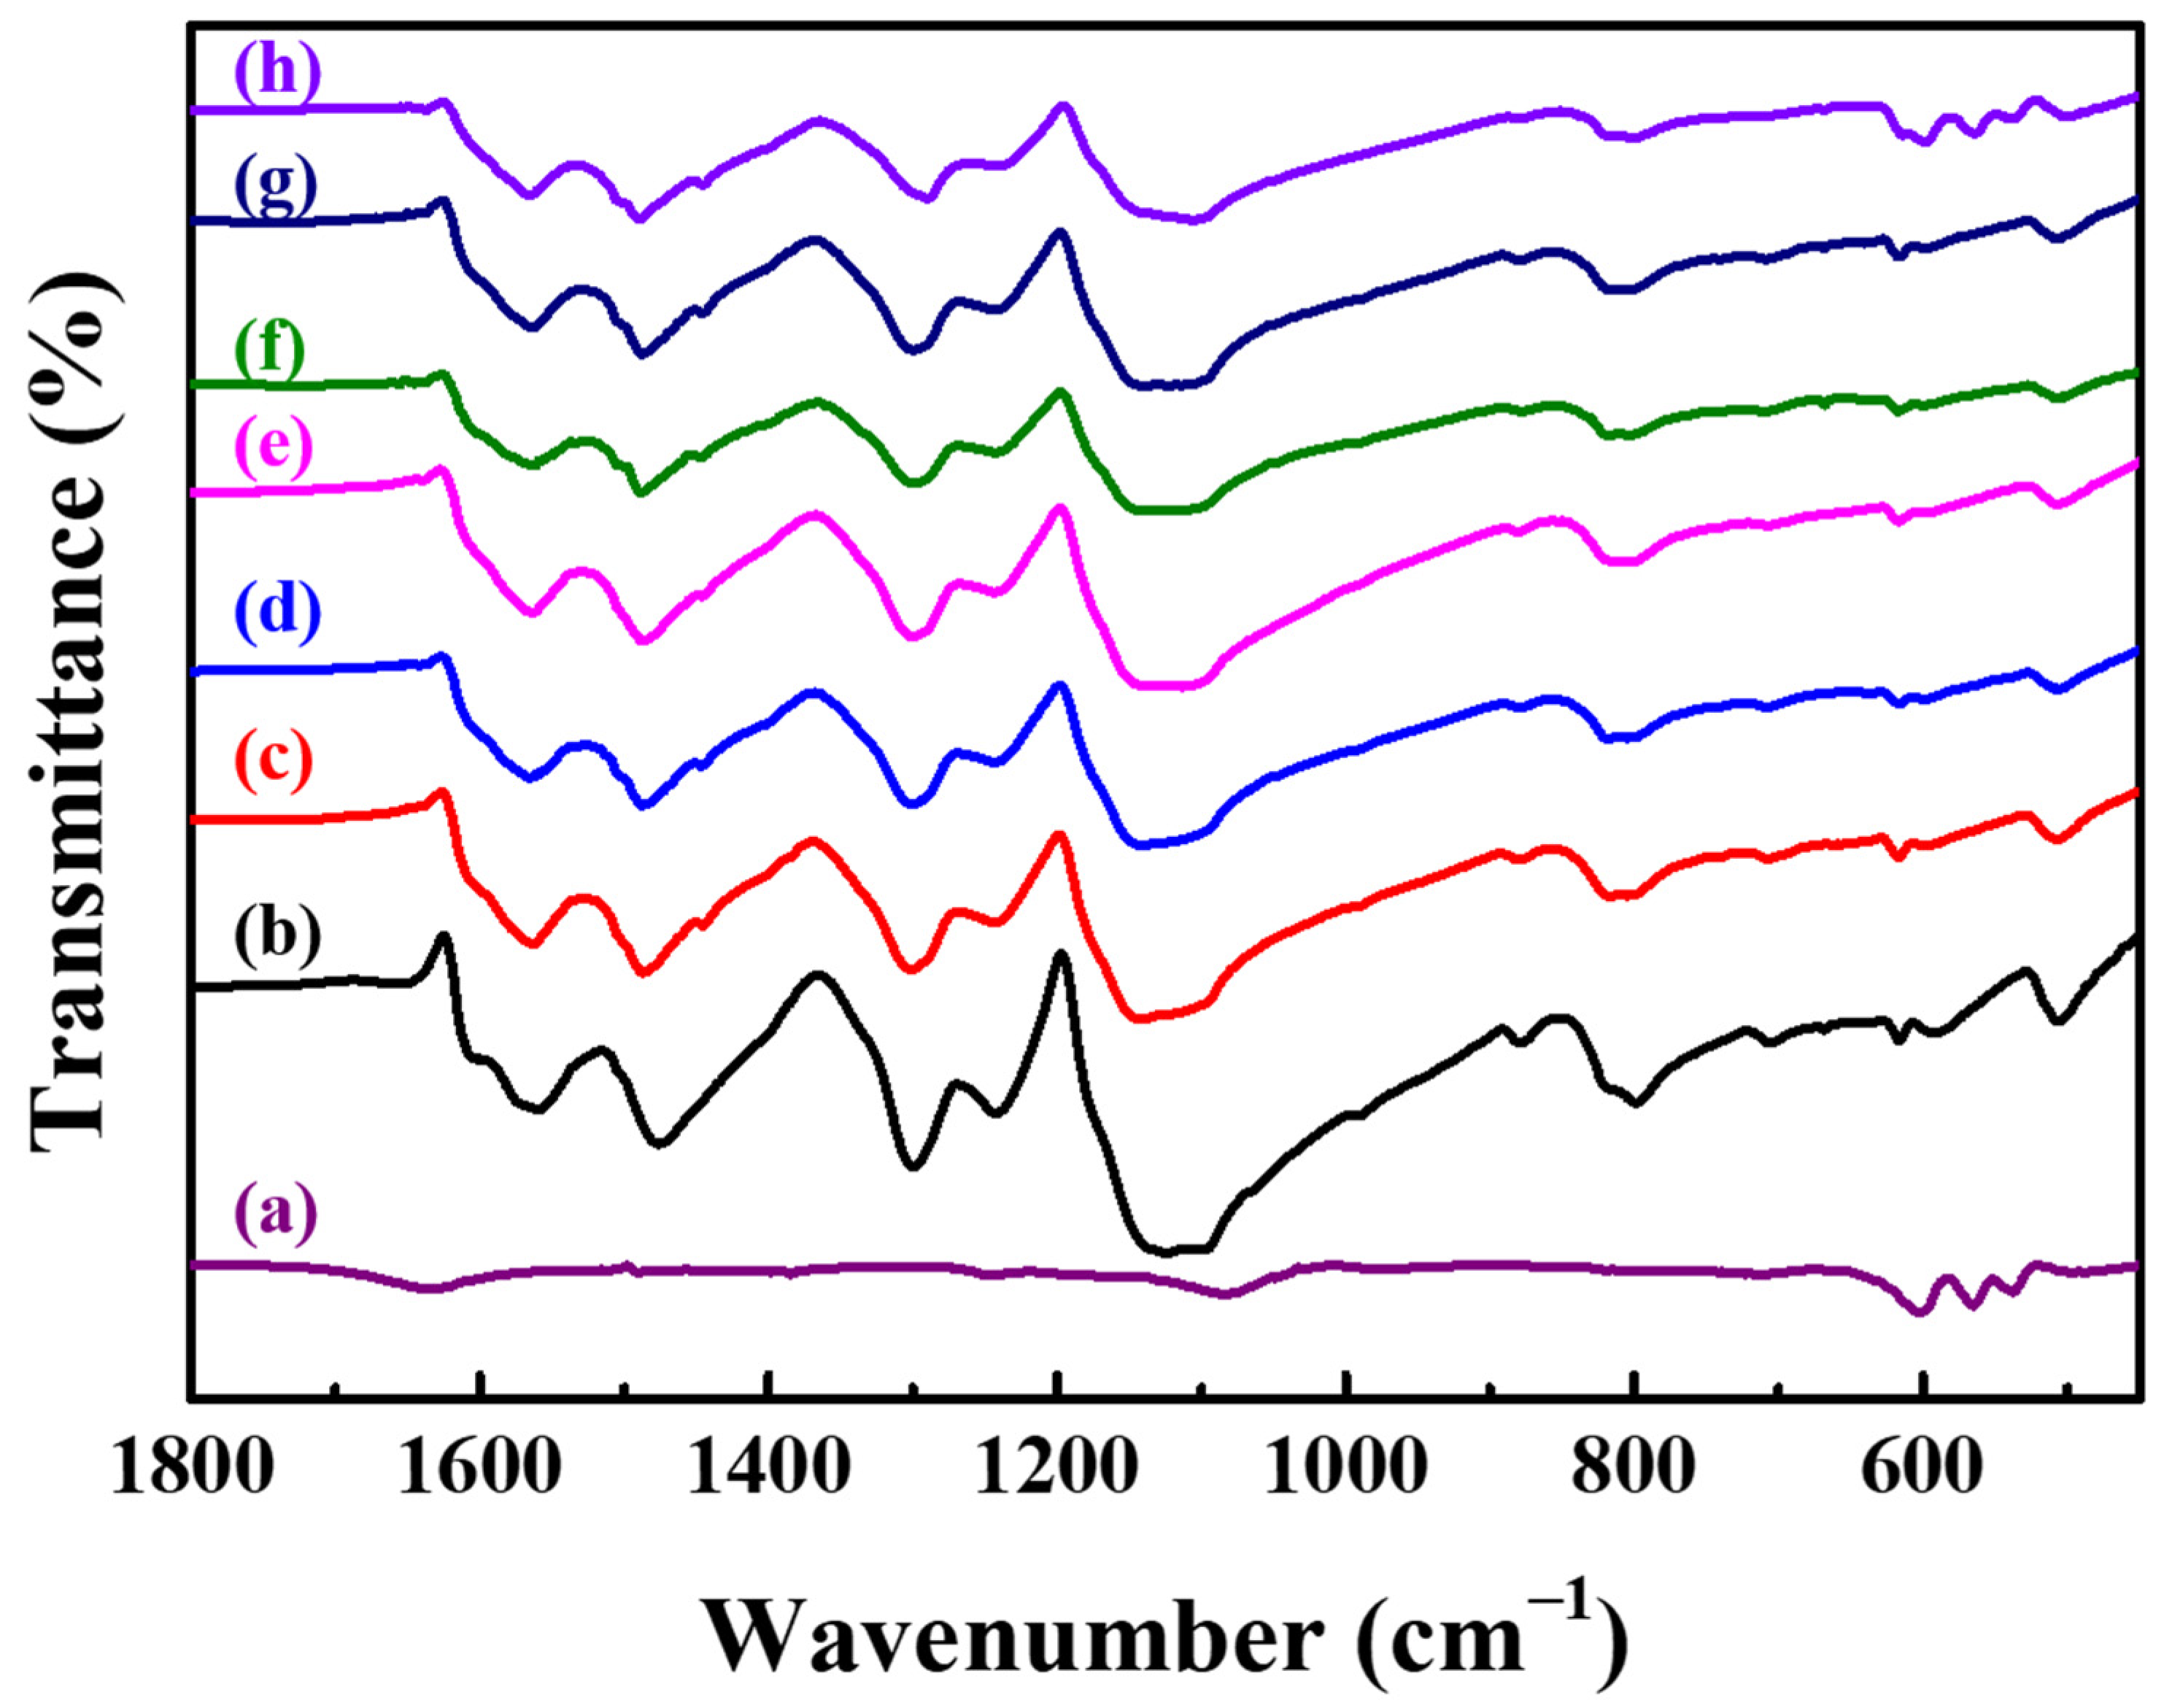
Synthesis, Structure, and Morphology of PANI/N-GQD/Hollow In2O3 Nanofiber Composites
4. Conclusions
Author Contributions
Funding
Institutional Review Board Statement
Informed Consent Statement
Data Availability Statement
Acknowledgments
Conflicts of Interest
References
- Phillips, M.; Herrera, J.; Krishnan, S.; Zain, M.; Greenberg, J.; Cataneo, R.N. Variation in volatile organic compounds in the breath of normal humans. J. Chromatogr. B Biomed. Sci. Appl. 1999, 729, 75–88. [Google Scholar] [CrossRef]
- Phillips, M.; Cataneo, R.N.; Cummin, A.R.C.; Gagliardi, A.J.; Gleeson, K.; Greenberg, J.; Maxfield, R.A.; Rom, W.N. Detection of lung cancer with volatile markers in the breath. Chest J. 2003, 123, 2115–2123. [Google Scholar] [CrossRef] [PubMed] [Green Version]
- Haick, H.; Broza, Y.Y.; Mochalski, P.; Ruzsanyi, V.; Amann, A. Assessment, origin, and implementation of breath volatile cancer markers. Chem. Soc. Rev. 2014, 43, 1423–1449. [Google Scholar] [CrossRef] [Green Version]
- Wehinger, A.; Schmid, A.; Mechtcheriakov, S.; Ledochowski, M.; Grabmer, C.; Amann, A. Lung cancer detection by proton transfer reaction mass-spectrometric analysis of human breath gas. Int. J. Mass Spectrom. 2007, 265, 49–59. [Google Scholar] [CrossRef]
- Capuano, R.; Santonico, M.; Pennazza, G.; Ghezzi, S.; Martinelli, E.; Roscioni, C.; Lucantoni, G.; Galluccio, G.; Paolesse, R.; Natale, C.D.; et al. The lung cancer breath signature: A comparative analysis of exhaled breath and air sampled from inside the lungs. Sci. Rep. 2015, 5, 16491. [Google Scholar] [CrossRef] [Green Version]
- Grabowska-Polanowska, B.; Faber, J.; Skowron, M.; Miarka, P.; Pietrzycka, A.; Sliwka, I.; Amann, A. Detection of potential chronic kidney disease markers in breath using gas chromatography with mass-spectral detection coupled with thermal desorption method. J. Chromatogr. A 2013, 1301, 179–189. [Google Scholar] [CrossRef] [PubMed]
- Davies, S.; Spanel, P.; Smith, D. Quantitative analysis of ammonia on the breath of patients in end-stage renal failure. Kidney Int. 1997, 52, 223–228. [Google Scholar] [CrossRef] [Green Version]
- Turner, C.; Španěl, P.; Smith, D. A longitudinal study of ammonia, acetone and propanol in the exhaled breath of 30 subjects using selected ion flow tube mass spectrometry, SIFT-MS. Physiol. Meas. 2006, 27, 321–327. [Google Scholar] [CrossRef]
- Buckley, L.K.; Collins, G.E. Conductive polymer-coated fabrics for chemical sensing. Synth. Met. 1996, 78, 93–101. [Google Scholar]
- Ciric-Marjanovic, G. Recent advances in polyaniline research: Polymerization mechanisms, structural aspects, properties and applications. Synth. Met. 2013, 177, 1–47. [Google Scholar] [CrossRef]
- Eising, M.; Cava, C.E.; Salvatierra, R.V.; Zarbin, A.J.G.; Roman, L.S. Doping effect on self-assembled films of polyaniline and carbon nanotube applied as ammonia gas sensor. Sens. Actuators B Chem. 2017, 245, 25–33. [Google Scholar] [CrossRef]
- Xue, L.; Wang, W.; Guo, Y.; Liu, G.; Wan, P. Flexible polyaniline/carbon nanotube nanocomposite film-based electronic gas sensors. Sens. Actuators B Chem. 2017, 244, 47–53. [Google Scholar] [CrossRef] [Green Version]
- Liu, C.; Tai, H.; Zhang, P.; Yuan, Z.; Du, X.; Xie, G.; Jiang, Y. A high-performance flexible gas sensor based on self-assembled PANI-CeO2 nanocomposite thin film for trace-level NH3 detection at room temperature. Sens. Actuators B Chem. 2018, 261, 587–597. [Google Scholar] [CrossRef]
- Li, S.; Lin, P.; Zhao, L.; Wang, C.; Liu, D.; Liu, F.; Sun, P.; Liang, X.; Liu, F.; Yan, X.; et al. The room temperature gas sensor based on polyaniline@flower-like WO3 nanocomposites and flexible PET substrate for NH3 detection. Sens. Actuators B Chem. 2018, 259, 505–513. [Google Scholar] [CrossRef]
- Feng, Q.; Zhang, H.; Shi, Y.; Yu, X.; Lan, G. Preparation and gas sensing properties of PANI/SnO2 hybrid material. Polymers 2021, 13, 1360. [Google Scholar] [CrossRef]
- Bibi, A.; Rubio, Y.R.M.; Santiago, K.S.; Jia, H.W.; Ahmed, M.M.M.; Lin, Y.F.; Yeh, J.M. H2S-sensing studies using interdigitated electrode with spin-coated carbon aerogel-polyaniline composites. Polymers 2021, 13, 1457. [Google Scholar] [CrossRef]
- Alharthy, R.D.; Saleh, A. A novel trace-level ammonia gas sensing based on flexible PAni-CoFe2O4 nanocomposite film at room temperature. Polymers 2021, 13, 3077. [Google Scholar] [CrossRef]
- Xu, L.H.; Wu, T.M. Synthesis of highly sensitive ammonia gas sensor of polyaniline/graphene nanoribbon/indium oxide composite at room temperature. J. Mater. Sci. Mater. Electron. 2020, 31, 7276–7283. [Google Scholar] [CrossRef]
- Zhou, X.; Ma, P.; Wang, A.; Yu, C.; Qian, T.; Wu, S.; Shen, J. Dopamine fluorescent sensors based on polypyrrole/graphene quantum dots core/shell hybrids. Biosens. Bioelectron. 2015, 64, 404–410. [Google Scholar] [CrossRef]
- Zhu, S.; Zhang, J.; Qiao, C.; Tang, S.; Li, Y.; Yuan, W.; Li, B.; Tian, L.; Liu, F.; Hu, R. Strongly green-photoluminescent graphene quantum dots for bioimaging applications. Chem. Commun. 2011, 47, 6858–6860. [Google Scholar] [CrossRef] [PubMed]
- Shen, J.; Zhu, Y.; Yang, X.; Li, C. Graphene quantum dots: Emergent nanolights for bioimaging, sensors, catalysis and photovoltaic devices. Chem. Commun. 2012, 48, 3686–3699. [Google Scholar] [CrossRef]
- Li, L.S.; Yan, X. Colloidal graphene quantum dots. J. Phys. Chem. Lett. 2010, 1, 2572–2576. [Google Scholar] [CrossRef]
- Peng, J.; Gao, W.; Gupta, B.K.; Liu, Z.; Romero-Aburto, R.; Ge, L.; Song, L.; Alemany, L.B.; Zhan, X.; Gao, G.; et al. Graphene quantum dots derived from carbon fibers. Nano Lett. 2012, 12, 844–849. [Google Scholar] [CrossRef]
- Tang, L.; Ji, R.; Cao, X.; Lin, J.; Jiang, H.; Li, X.; Teng, K.S.; Luk, C.M.; Zeng, S.; Hao, J. Deep ultraviolet photoluminescence of water-soluble self-passivated graphene quantum dots. ACS Nano 2012, 6, 5102–5110. [Google Scholar] [CrossRef] [PubMed]
- Zhou, C.; Jiang, W.; Via, B.K. Facile synthesis of soluble graphene quantum dots and its improved property in detecting heavy metal ions. Colloids Surf. B Biointerfaces 2014, 118, 72–76. [Google Scholar] [CrossRef] [PubMed]
- Liu, J.J.; Chen, Z.T.; Tang, D.S.; Wang, Y.B.; Kang, L.T.; Yao, J.N. Graphene quantum dots-based fluorescent probe for turn-on sensing of ascorbic acid. Sens. Actuators B Chem. 2015, 212, 214–219. [Google Scholar] [CrossRef]
- Zhao, J.; Chen, G.; Zhu, L.; Li, G. Graphene quantum dots-based platform for the fabrication of electrochemical biosensors. Electrochem. Commun. 2011, 13, 31–33. [Google Scholar] [CrossRef]
- Liu, H.T.; Liu, Y.Q.; Zhu, D.B. Chemical doping of graphene. J. Mater. Chem. 2011, 21, 3335–3345. [Google Scholar] [CrossRef]
- Gong, K.P.; Du, F.; Xia, Z.H.; Durstock, M.; Dai, L.M. Nitrogen-doped carbon nanotube arrays with high electrocatalytic activity for oxygen reduction. Science 2009, 323, 760. [Google Scholar] [CrossRef] [Green Version]
- Li, Y.; Zhao, Y.; Cheng, H.; Hu, Y.; Shi, G.; Dai, L.; Qu, L. Nitrogen-doped graphene quantum dots with oxygen-rich functional groups. J. Am. Chem. Soc. 2012, 134, 15–18. [Google Scholar] [CrossRef]
- Kadir, R.A.; Li, Z.; Sadek, A.Z.; Rani, R.A.; Zoolfakar, A.S.; Field, M.R.; Ou, J.Z.; Chrimes, A.F.; Kalantarzadeh, K. Electrospun granular hollow SnO2 nanofibers hydrogen gas sensors operating at low temperatures. J. Phys. Chem. C 2014, 118, 3129–3139. [Google Scholar] [CrossRef]
- Cheng, L.; Ma, S.Y.; Li, X.B.; Luo, J.; Li, W.Q.; Li, F.M.; Mao, Y.Z.; Wang, T.T.; Li, Y.F. Highly sensitive acetone sensors based on Y-doped SnO2 prismatic hollow nanofibers synthesized by electrospinning. Sens. Actuators B Chem. 2014, 200, 181–190. [Google Scholar] [CrossRef]
- Hsieh, C.H.; Xu, L.H.; Wang, J.M.; Wu, T.M. Fabrication of polypyrrole/tin oxide/graphene nanoribbon ternary nanocomposite and its high-performance ammonia gas sensing at room temperature. Mater. Sci. Eng. B 2021, 272, 115317. [Google Scholar] [CrossRef]
- Hsu, W.F.; Wu, T.M. Electrochemical sensor based on conductive polyaniline coated hollow tin oxide nanoparticles and nitrogen doped graphene quantum dots for sensitively detecting dopamine. J. Mater. Sci. Mater. Electron. 2019, 30, 8449–8456. [Google Scholar] [CrossRef]
- Pang, Z.; Nie, Q.; Wei, A.; Yang, J.; Huang, F.; Wei, Q. Effect of In2O3 nanofiber structure on the ammonia sensing performances of In2O3/PANI composite nanofibers. J. Mater. Sci. 2017, 52, 686–695. [Google Scholar] [CrossRef]
- Zhang, D.; Wu, Z.; Li, P.; Zong, X.; Dong, G.; Zhang, Y. Facile fabrication of polyaniline/multi-walled carbon nanotubes/molybdenum disulfide ternary nanocomposite and its high-performance ammonia-sensing at room temperature. Sens. Actuators B Chem. 2018, 258, 895–905. [Google Scholar] [CrossRef]
- Pang, Z.; Yang, Z.; Chen, Y.; Zhang, J.; Wang, Q.; Huang, F.; Wei, Q. A room temperature ammonia gas sensor based on cellulose/TiO2/PANI composite nanofibers. Colloids Surf. A Physicochem. Eng. Asp. 2016, 494, 248–255. [Google Scholar] [CrossRef]
- Liu, Y.; Hao, L.; Gao, W.; Xue, Q.; Guo, W.; Wu, Z.; Lin, Y.; Zeng, H.; Zhu, J.; Zhang, W. Electrical characterization and ammonia sensing properties of MoS2/Si p–n junction. J. Alloys Compd. 2015, 631, 105–110. [Google Scholar] [CrossRef]
- Pang, Z.; Yu, J.; Li, D.; Nie, Q.; Zhang, J.; Wei, Q. Free-standing TiO2–SiO2/PANI composite nanofibers for ammonia sensors. J. Mater. Sci. Mater. Electron. 2017, 29, 3576–3583. [Google Scholar] [CrossRef]
- Wei, J.; Liang, B.; Cao, Q.; Mo, C.; Zheng, Y.; Ye, X. Vertically aligned PANI nanorod arrays grown on graphene oxide nanosheets for a high-performance NH3 gas sensor. RSC Adv. 2017, 7, 33510–33520. [Google Scholar] [CrossRef] [Green Version]
- Zhang, H.D.; Tang, C.C.; Long, Y.Z.; Huang, R.; Li, J.J.; Gu, C.Z. High-sensitivity gas sensors based on arranged polyaniline/PMMA composite fibers. Sens. Actuators A Phys. 2014, 219, 123–127. [Google Scholar] [CrossRef]
- Bera, S.; Kundu, S.; Khan, H.; Jana, S. Polyaniline coated graphene hybridized SnO2 nanocomposite: Low temperature solution synthesis, structural property and room temperature ammonia gas sensing. J. Alloys Compd. 2018, 744, 260–270. [Google Scholar] [CrossRef]
- Liu, A.; Lv, S.; Jiang, L.; Liu, F.; Zhao, L.; Wang, J.; Hu, X.; Yang, Z.; He, J.; Wang, C.; et al. The gas sensor utilizing polyaniline/MoS2 nanosheets/SnO2 nanotubes for the room temperature detection of ammonia. Sens. Actuators B Chem. 2021, 332, 129444. [Google Scholar] [CrossRef]


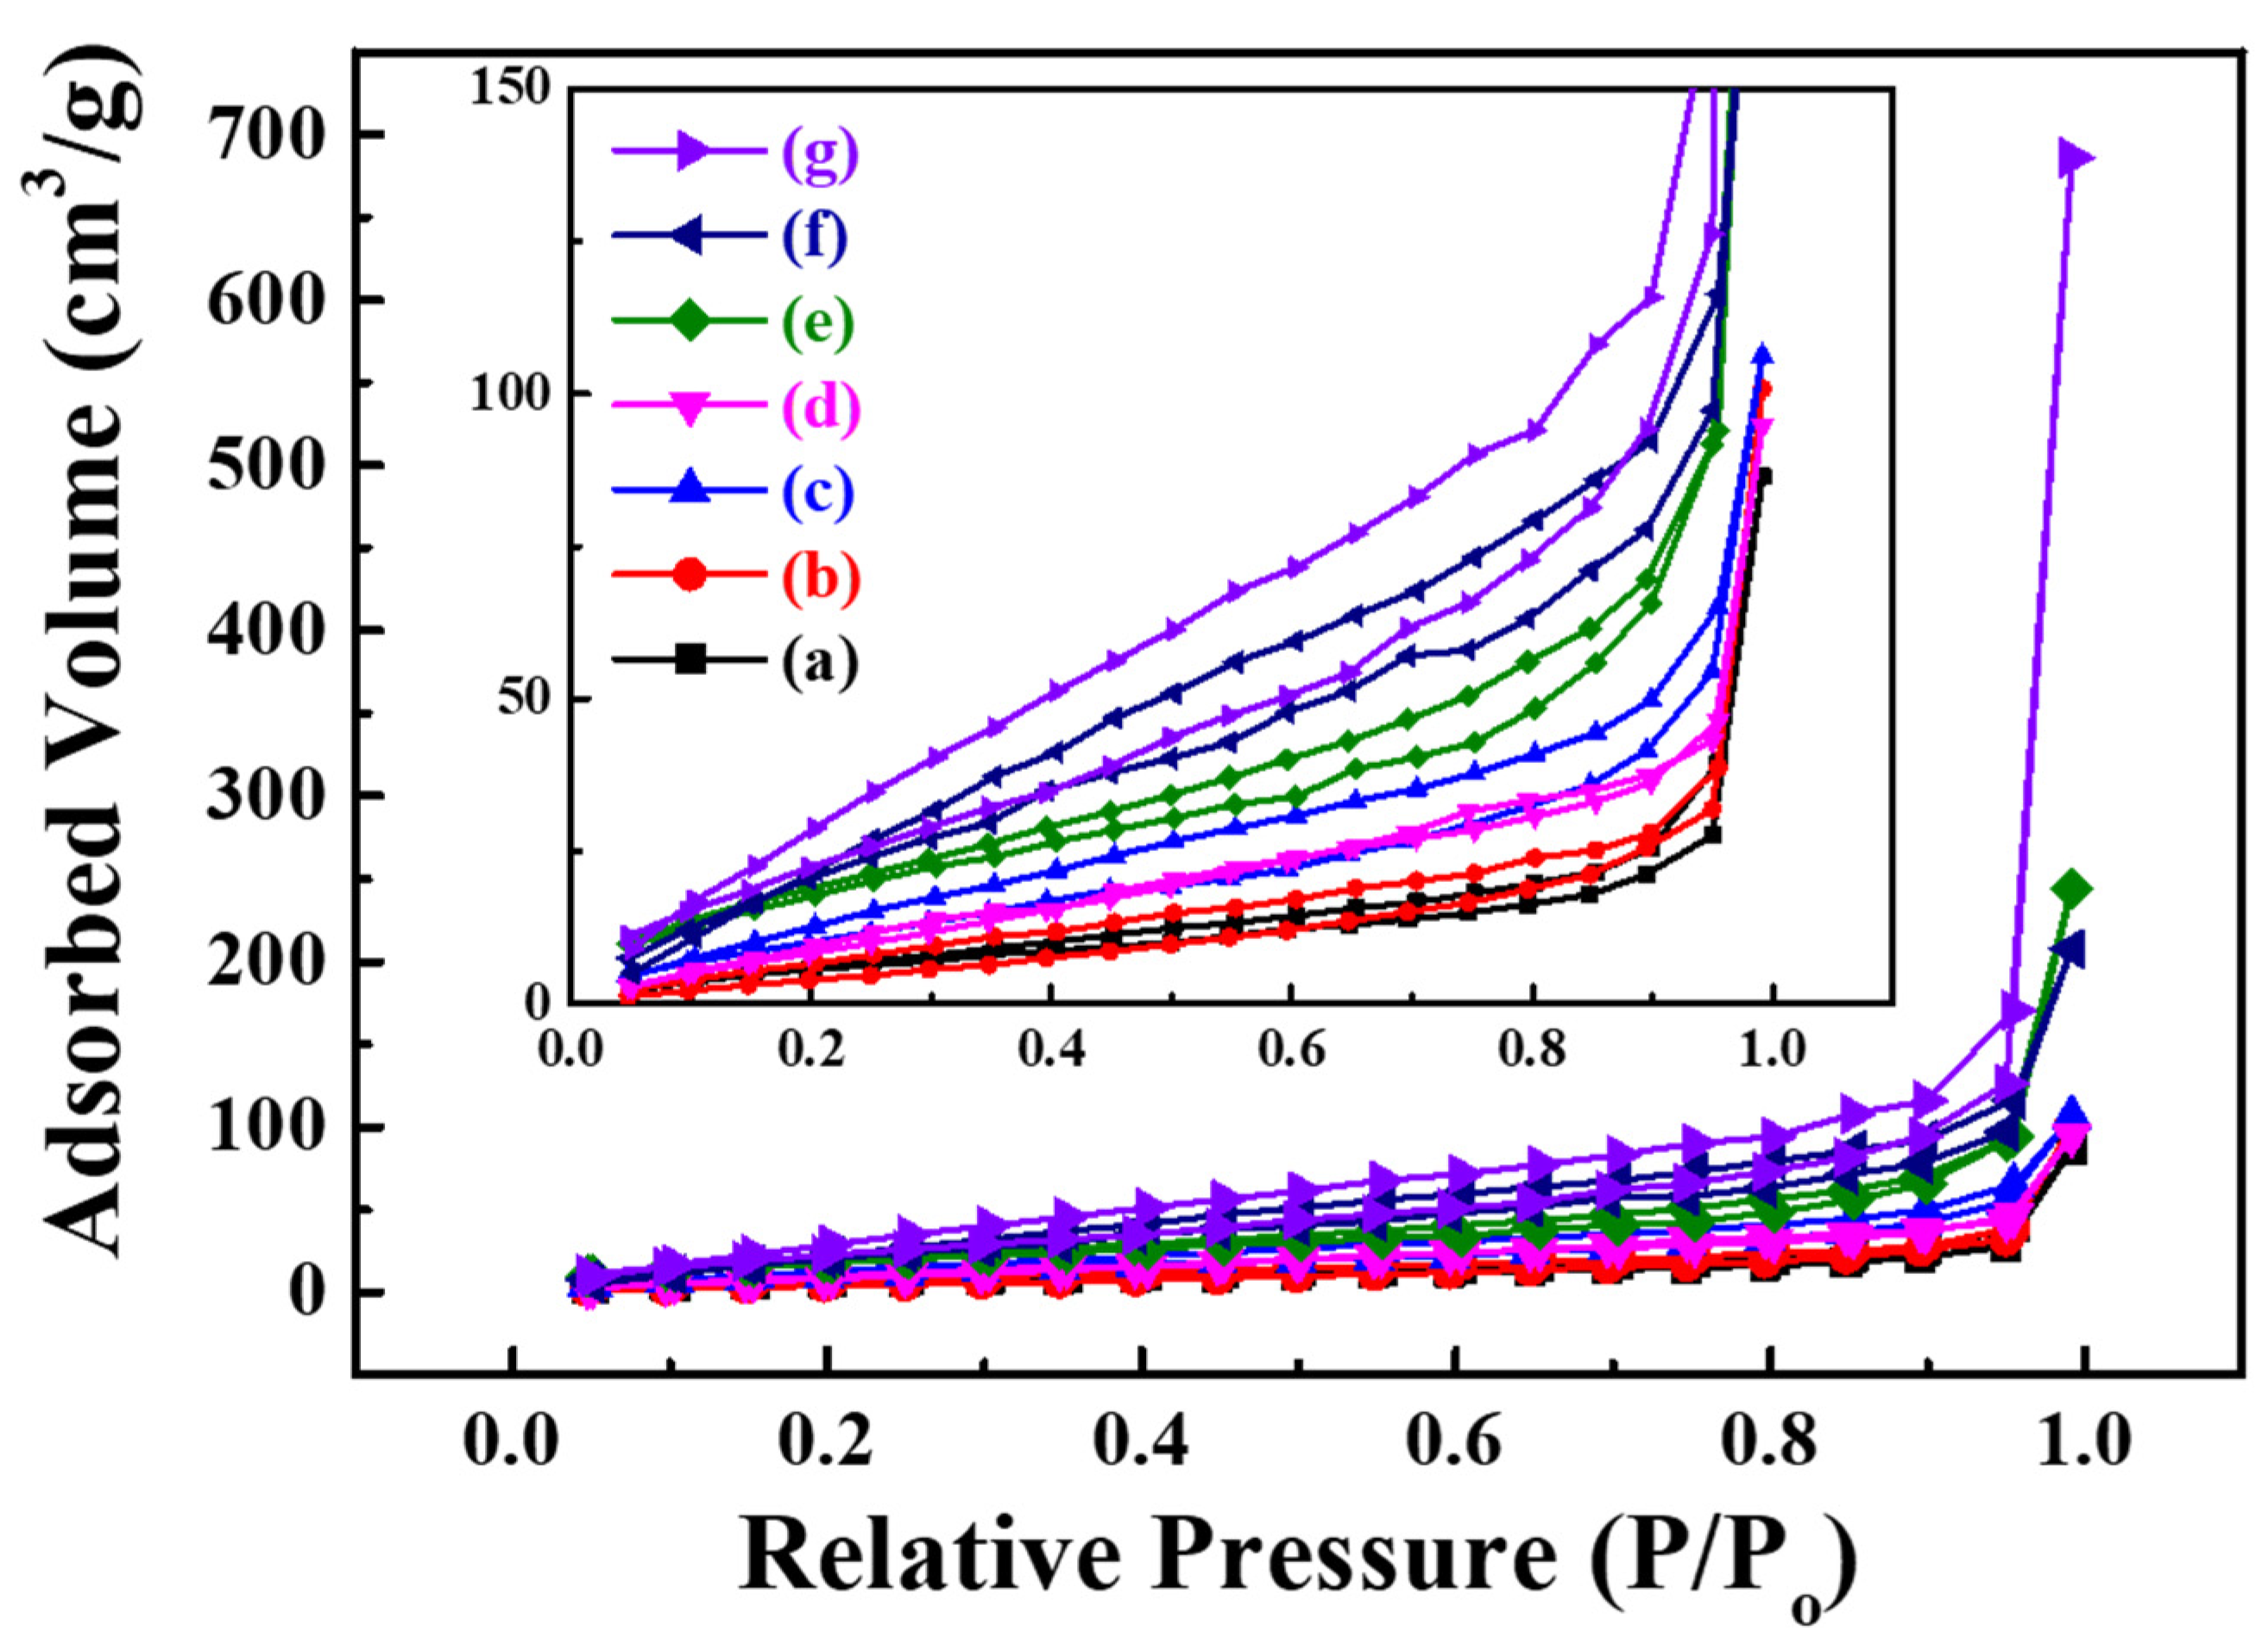
| Sample | Specific Surface Area (m2/g) | Coating Thickness of PANI (nm) |
|---|---|---|
| 2.5 wt% PANI/hollow In2O3 nanofiber | 25.0 | 56.1 |
| 5 wt% PANI/hollow In2O3 nanofiber | 47.7 | 23.7 |
| 10 wt% PANI/hollow In2O3 nanofiber | 48.3 | 19.4 |
| 15 wt% PANI/hollow In2O3 nanofiber | 69.9 | 17.7 |
| 20 wt% PANI/hollow In2O3 nanofiber | 102.1 | 10.3 |
| 25 wt% PANI/hollow In2O3 nanofiber | 73.5 | 19.6 |
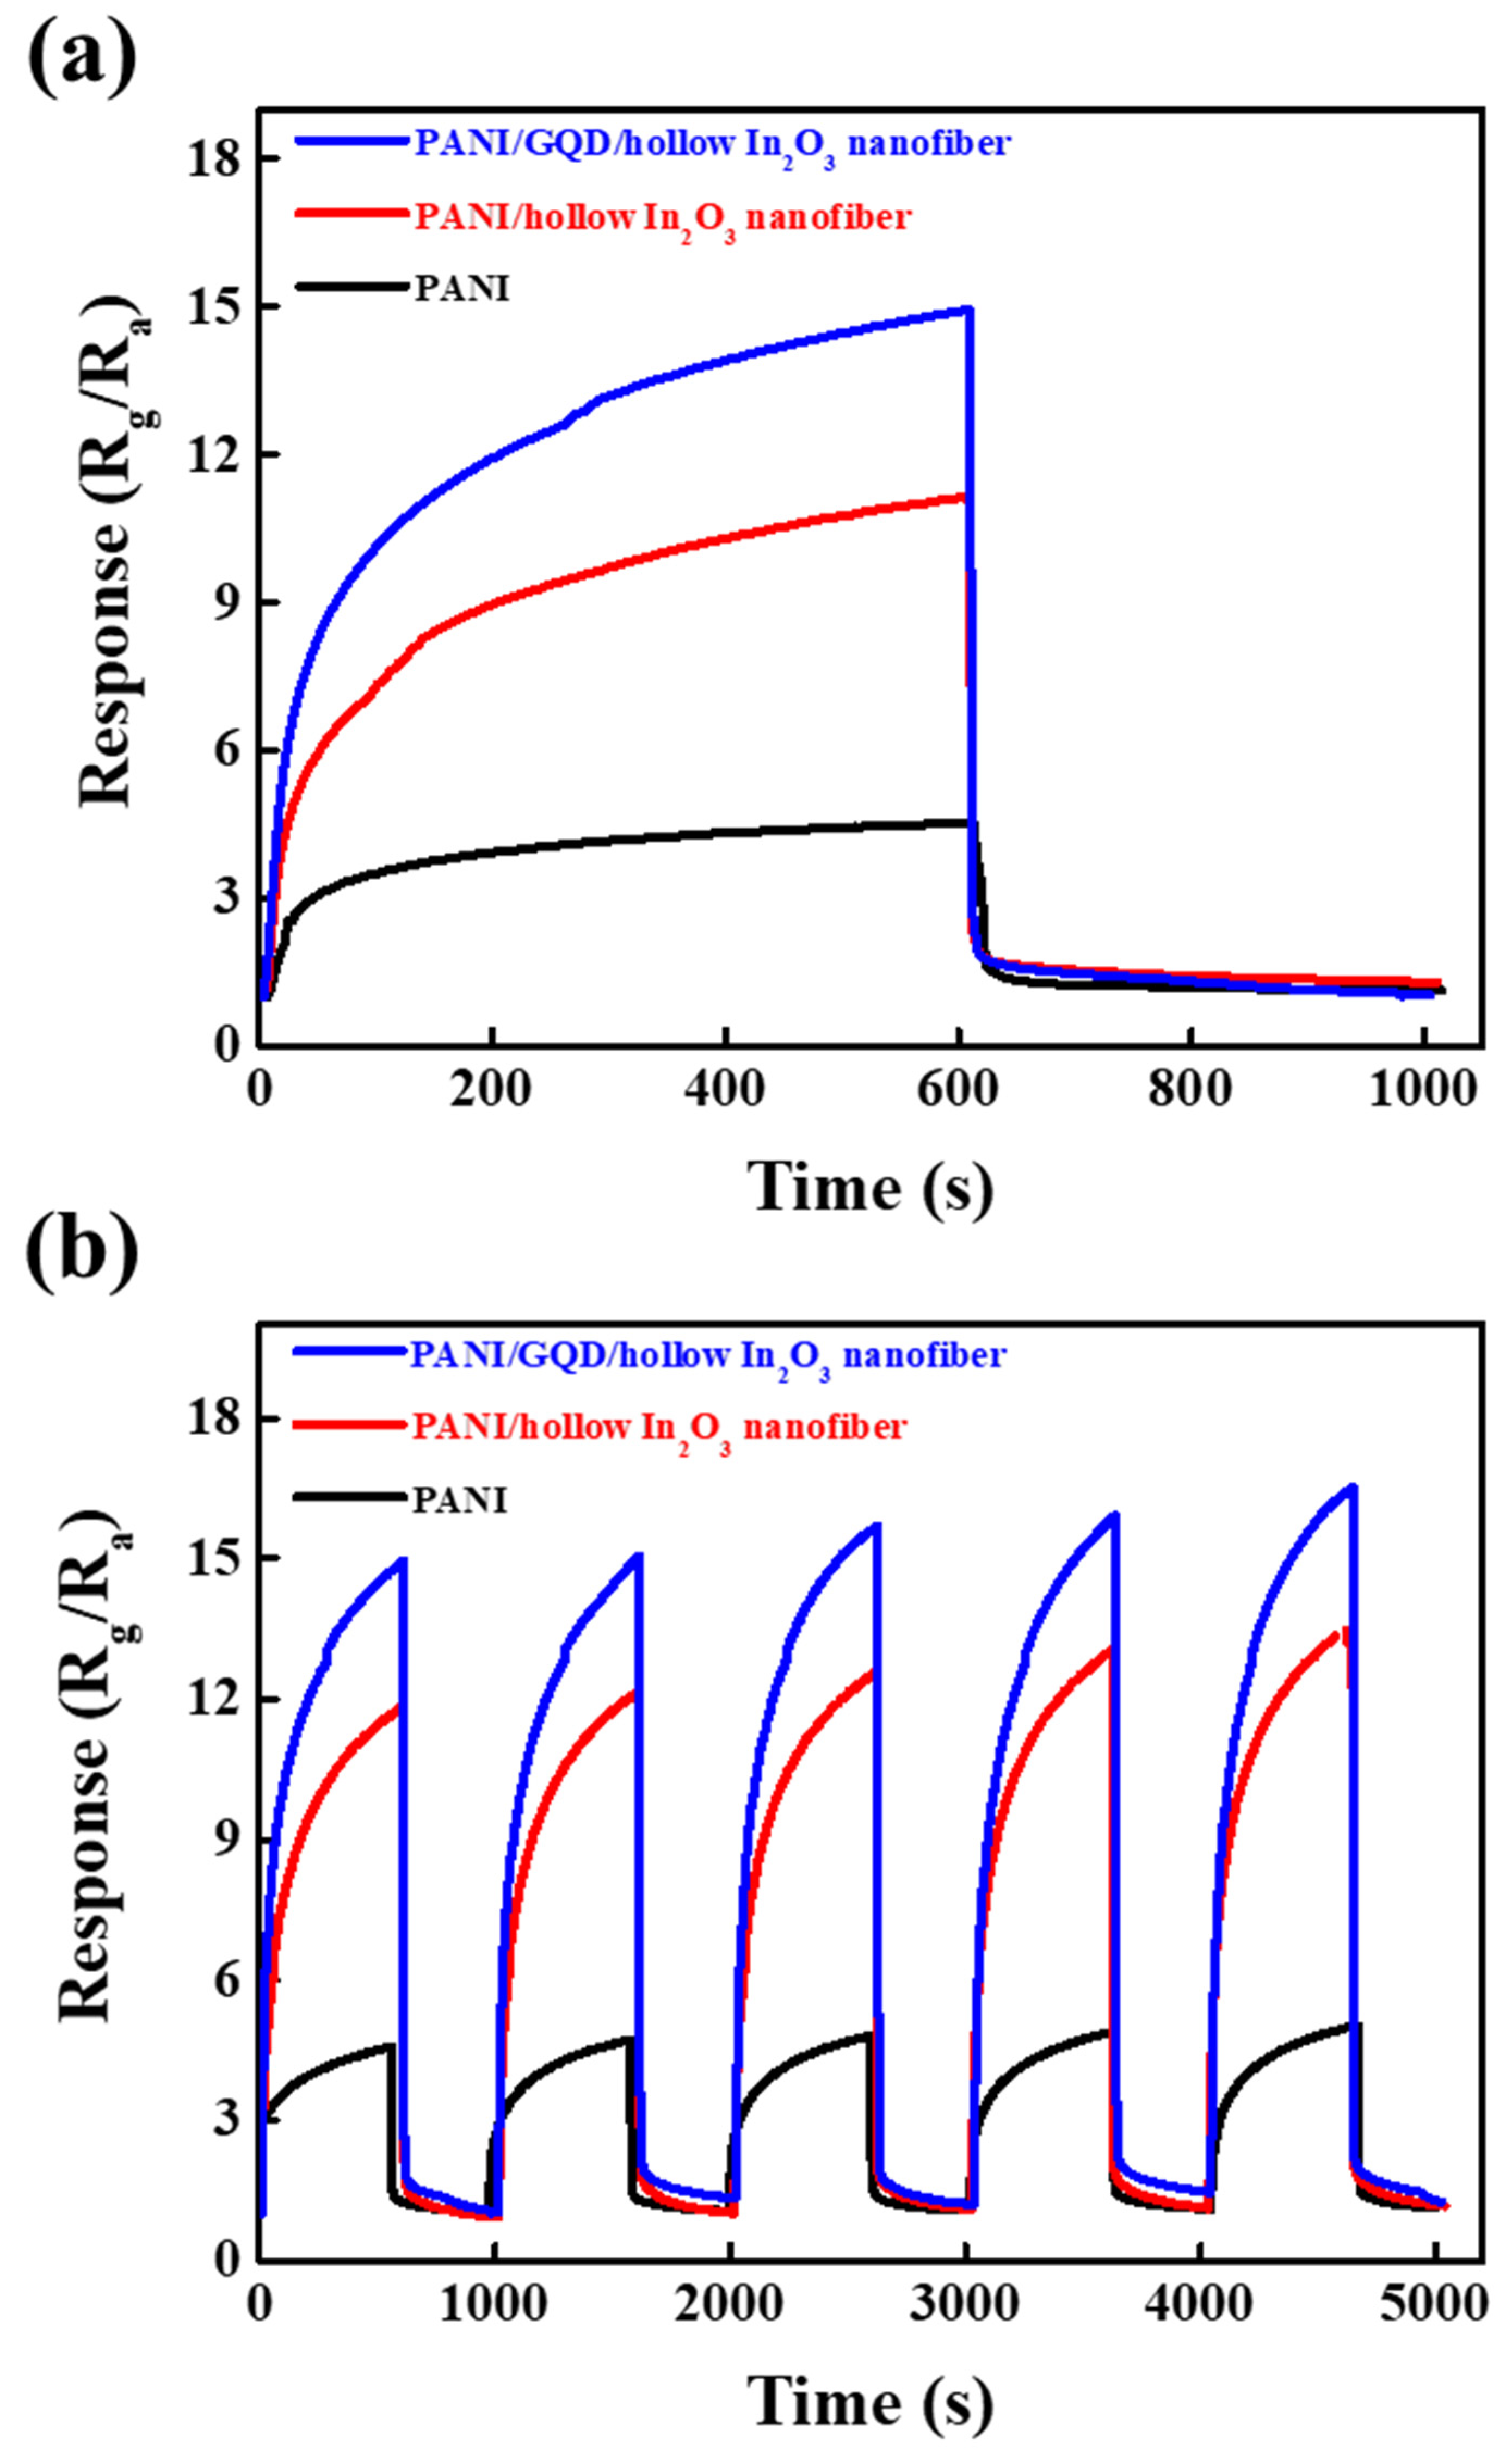
| Materials | Gas | Conc. (ppm) | Temp. (°C) | Response (%) | Ref. |
|---|---|---|---|---|---|
| PANI/WO3 | NH3 | 10 | RT | 7.14 | [14] |
| PANI/In2O3 | NH3 | 100 | RT | 3.2 | [35] |
| PANI/TiO2-SiO2 | NH3 | 50 | RT | 10 | [39] |
| PANI/CeFe2O4 | NH3 | 50 | RT | 118.3 | [17] |
| PANI/Graphene | NH3 | 50 | RT | 14.6 | [40] |
| PANI/GNR/In2O3 | NH3 | 0.65 | RT | 8.6 | [18] |
| PANI/PMMA | NH3 | 1 | RT | 1.4 | [41] |
| PANI/Graphene/SnO2 | NH3 | 10 | RT | 2.8 | [42] |
| PANI/MoS2/SnO2 | NH3 | 50 | RT | 7.5 | [43] |
| PANI/N-GQD/hollow In2O3 nanofiber | NH3 | 1 | RT | 15.6 | This work |
Publisher’s Note: MDPI stays neutral with regard to jurisdictional claims in published maps and institutional affiliations. |
© 2021 by the authors. Licensee MDPI, Basel, Switzerland. This article is an open access article distributed under the terms and conditions of the Creative Commons Attribution (CC BY) license (https://creativecommons.org/licenses/by/4.0/).
Share and Cite
Hong, S.-Z.; Huang, Q.-Y.; Wu, T.-M. The Room Temperature Highly Sensitive Ammonia Gas Sensor Based on Polyaniline and Nitrogen-Doped Graphene Quantum Dot-Coated Hollow Indium Oxide Nanofiber Composite. Polymers 2021, 13, 3676. https://doi.org/10.3390/polym13213676
Hong S-Z, Huang Q-Y, Wu T-M. The Room Temperature Highly Sensitive Ammonia Gas Sensor Based on Polyaniline and Nitrogen-Doped Graphene Quantum Dot-Coated Hollow Indium Oxide Nanofiber Composite. Polymers. 2021; 13(21):3676. https://doi.org/10.3390/polym13213676
Chicago/Turabian StyleHong, Sheng-Zhe, Qing-Yi Huang, and Tzong-Ming Wu. 2021. "The Room Temperature Highly Sensitive Ammonia Gas Sensor Based on Polyaniline and Nitrogen-Doped Graphene Quantum Dot-Coated Hollow Indium Oxide Nanofiber Composite" Polymers 13, no. 21: 3676. https://doi.org/10.3390/polym13213676
APA StyleHong, S.-Z., Huang, Q.-Y., & Wu, T.-M. (2021). The Room Temperature Highly Sensitive Ammonia Gas Sensor Based on Polyaniline and Nitrogen-Doped Graphene Quantum Dot-Coated Hollow Indium Oxide Nanofiber Composite. Polymers, 13(21), 3676. https://doi.org/10.3390/polym13213676