Abstract
Measuring fluid characteristics is of high importance in various industries such as the polymer, petroleum, and petrochemical industries, etc. Flow regime classification and void fraction measurement are essential for predicting the performance of many systems. The efficiency of multiphase flow meters strongly depends on the flow parameters. In this study, MCNP (Monte Carlo N-Particle) code was employed to simulate annular, stratified, and homogeneous regimes. In this approach, two detectors (NaI) were utilized to detect the emitted photons from a cesium-137 source. The registered signals of both detectors were decomposed using a discrete wavelet transform (DWT). Following this, the low-frequency (approximation) and high-frequency (detail) components of the signals were calculated. Finally, various features of the approximation signals were extracted, using the average value, kurtosis, standard deviation (STD), and root mean square (RMS). The extracted features were thoroughly analyzed to find those features which could classify the flow regimes and be utilized as the inputs to a network for improving the efficiency of flow meters. Two different networks were implemented for flow regime classification and void fraction prediction. In the current study, using the wavelet transform and feature extraction approach, the considered flow regimes were classified correctly, and the void fraction percentages were calculated with a mean relative error (MRE) of 0.4%. Although the system presented in this study is proposed for measuring the characteristics of petroleum fluids, it can be easily used for other types of fluids such as polymeric fluids.
1. Introduction
Information on flow regimes is used to increase the performance of flow meters [1]. Regime recognition and void fraction measurement are important issues in many industrial applications [2]. A wide variety of methods have been proposed for determining these parameters. The gamma-ray attenuation technique is the most accurate of these [3,4]. Over the past several years, many studies have been performed to enhance the accuracy of this method. Abro and co-authors [5] advanced a new methodology based on multi-beam gamma-ray densitometry for flow regime classification and void fraction calculation. The dual modality densitometry technique was studied by Jiang et al. [6] for regime classification in a two-phase flow using a radial basis function (RBF) neural network. Abro et al. carried out a study investigating the efficiency of single-beam and multi-beam gamma-ray densitometry in predicting the void fraction in two-phase flow systems [7]. Based on the presented results, the multi-beam gamma-ray technique showed better performance than the single-beam technique. Nazemi and co-authors performed research into void fraction measurement that was independent of density changes in the liquid phase, by employing a dual modality densitometry technique [3].
Roshani et al. [1] studied flow regime identification in a two-phase flow structure utilizing the dual modality densitometry method. For regime identification and void fraction measurement, three features were extracted. The extracted features were considered as the inputs of an ANN. Nazemi et al. utilized a method to investigate the optimum position of the scattering detector involving two features for achieving greater accuracy [8]. In this study, an RBF neural network was used to accomplish the investigations. This strategy enabled them to calculate volumetric percentages autonomously of the density changes. A new approach was investigated by Peyvandi and co-workers that aimed to calculate the void fraction in some specific conditions where only one side of the pipe is accessible [9]. Nazemi et al. carried out research into two-phase flow regimes for volume fraction calculations autonomously of the various types of regimes in the pipe, using the gamma-ray attenuation technique [10]. In all the previously mentioned studies, three or more detectors were employed, but in the latter study, the gamma-ray attenuation technique made it possible to use two detectors in the structure. Subsequently, a new study was performed to identify three flow regimes in a specific condition. Roshani et al. used one source and one detector to classify three flow regimes in their system, but only two of them were identified correctly [11].
Roshani et al. studied void fraction measurements independently of the type of flow regimes using a dual-energy broad beam technique. In this context, several features were extracted from the signals from the detector to use in network inputs [12]. Hanus et al. studied time-domain feature extraction to recognize flow regimes by employing different types of neural networks [13]. Sattari and co-workers used time-domain feature extraction for estimating volumetric percentages and identifying flow regimes. In this study, void fraction percentages were calculated with an MRE of 5.32 [14].
In the current study, a system including one source (cesium-137) and two detectors (NaI) was used to register the emitted photons passing through a pipe. Three main regimes consisting of homogeneous, stratified, and annular regimes with void fractions in the range of 5–90% were considered and simulated using MCNP code. The signals from both detectors were decomposed using DWT into approximation and detail components. In order to achieve regime identification and void fraction measurement, two methods for extracting features to utilize as the inputs of ANNs were analyzed.
In this paper, by utilizing an optimized structure and taking advantage of the wavelet transform, the types of regimes and volume fraction percentages in a two-phase flow were obtained precisely. In this study, the features of the signals were extracted using a wavelet transform. Then, various feature extraction methods were applied to the signals and finally, using the defined SA parameter, the best features with the best separation ability were selected. Following this, the features were applied to the networks, and the results demonstrated the precision and correctness of the presented solution. This method reduced the rate of errors in terms of the void fraction.
2. Simulated Structure
MCNP code, which is a powerful tool for modeling radiation-based multiphase flow meters [15,16,17,18,19,20,21,22,23,24], was used in this study to model the measuring system. In the simulations, homogeneous, stratified, and annular regimes were considered in the structure. Simulations were accomplished for void fractions ranging from 5% to 90% for all the aforementioned regimes. Gas oil and air were defined as the liquid and gas phases, respectively. It is worth noting that radiation-based multiphase flow meters are independent of the chemical characteristics of the materials inside the pipe that the radiation passes through. In other words, it makes no difference whether the radiation passes through a polymeric fluid, water, gas oil, or any other type of fluid. Therefore, instead of gas oil, which is used as an example liquid inside the pipe in this study, there could be a polymeric liquid, and the structure of the proposed measuring system would remain the same.
A 137Cs radioactive source (emitter energy: 0.662 MeV) and two 25.4 mm NaI transmitted photon detectors were used to detect emitted photons. The detectors were positioned at a distance of 250 mm from the source at angles of 0 and 13 degrees. It is worth mentioning that the simulated structure used in this study was validated in several experiments in our previous research [4,10].
The energy spectra of the registered photons for both detectors in three flow regimes are illustrated in Figure 1.
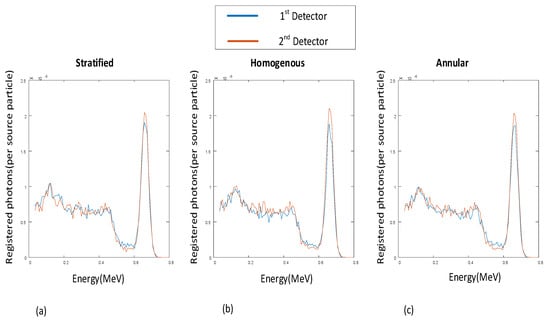
Figure 1.
Registered signals in the 1st detector and 2nd detector (void fraction = 5%) for three flow regimes: (a) Stratified, (b) Homogenous, (c) Annular.
3. Discrete Wavelet Transform
The wavelet decomposition tree is shown in Figure 2. The approximation signal in the initial stage was also divided into new approximation and detail components and the procedure was reiterated [25,26].
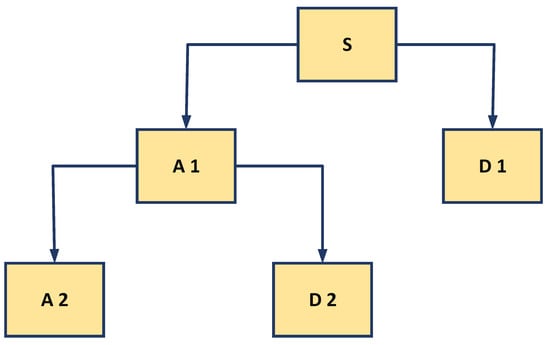
Figure 2.
Decomposition tree of discrete wavelet transforms.
There are many well-known wavelet families, such as Haar, Coiflet, Symmlet, and Daubechies wavelets [27], etc., which have a wide range of applications. There is no certain way to choose a specific wavelet family in research. The choice of wavelet functions depends on the application. One of the greatest advantages of the Haar wavelet algorithm is the fact that it is easy to compute and simple to understand [28].
4. Feature Extraction
Feature extraction is utilized for highlighting specific patterns, with the purpose of decreasing the substantial data loss. Classification and prediction can be carried out more accurately when the pattern is represented by the principal features of the signal. Feature engineering methods can be considered as a key element in classification and prediction problems [26].
In this study, at first the registered signals of both detectors were decomposed using a discrete wavelet transform (DWT). Following this, the approximation and detail components of the signals were calculated using the Haar wavelet family. Finally, the statistical features of the approximation signal were extracted [26] utilizing the average value (m), kurtosis (g), standard deviation (), and RMS. Formulations relating to these features are shown in Equations (1)–(4), respectively:
The wavelet transform of the first detector’s signal (annular) is shown in Figure 3.
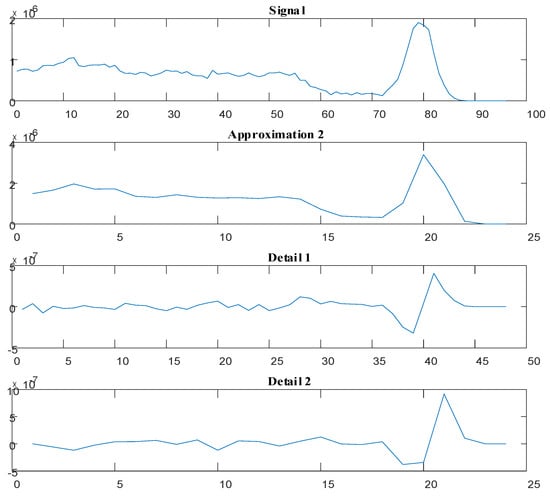
Figure 3.
Wavelet transform of the first detector’s signal for the annular regime with a void fraction of 5%.
4.1. Extracting Same Features from Both Detectors
In the first case, the same features were extracted from the approximation signals of both detectors. In Figure 4, the diagram of the extracted features from the first detector versus the second detector is shown, illustrating the separation ability of each feature.
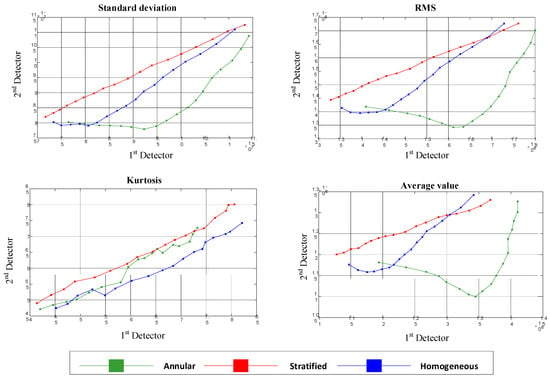
Figure 4.
The same features extracted from both detectors.
As a result of the overlap of the illustrated features in Figure 4, the flow regimes could not be classified using these features.
It should be noted that the points illustrated in each graph are related to different void fraction percentages.
4.2. Extracting Different Features from Both Detectors
In this section, different features of the approximation signal were extracted from each detector. The diagram of the extracted features from the first detector versus the second detector is shown in Figure 5, illustrating the separation ability of each feature.
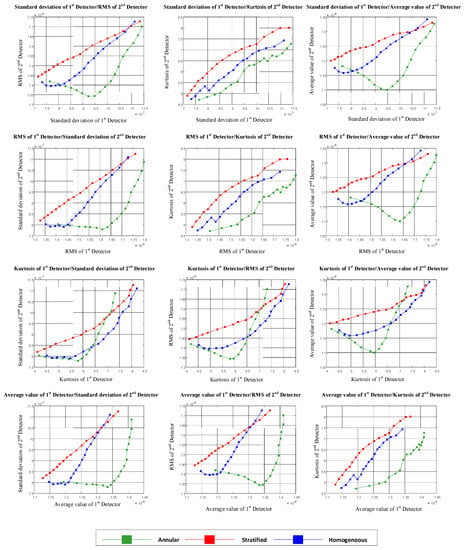
Figure 5.
Different features extracted from each detector.
5. Feature Selection
Considering Figure 4, it is possible to recognize type of flow regime using three features (the standard deviation of the approximation signal of the first detector versus the kurtosis of the approximation signal of the second detector, the RMS of the approximation signal of the first detector versus the kurtosis of the approximation signal of the second detector, and the average value of the approximation signal of the first detector versus the kurtosis of the approximation signal of the second detector). For investigating the separation ability of these three features, a novel parameter called the SA parameter, where SA stands for separation ability, was calculated as shown below. One of the three mentioned features is shown in Figure 6 for analyzing the operation of the SA parameter. The calculation methods for the SA parameter are shown in Figure 7 and Equations (5) to (8).
where D1, D2, and D3 in the equations are the average distances between the annular– homogeneous, annular–stratified, and homogeneous–stratified regimes, respectively.
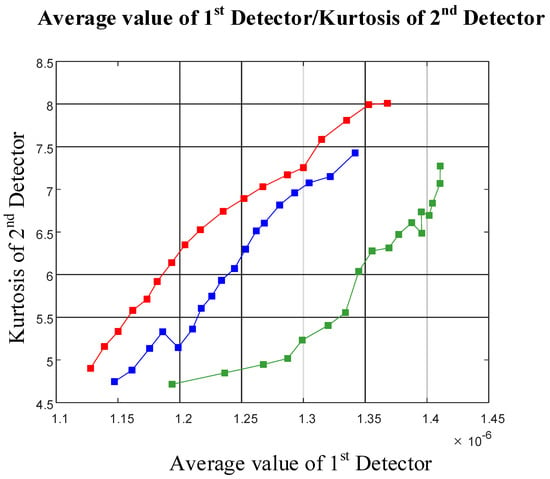
Figure 6.
One of the features with separated graphs.

Figure 7.
The calculation method for the SA parameter.
SA stands for separation ability.
By calculating the SA parameter for all three separated cases, the average value of the approximation signal of the first detector and the kurtosis of the approximation signal of the second detector can be recognized as the features that are able to classify the three flow regimes, and can be applied as inputs to the ANN, aiming to enable flow regime classification and void fraction measurement.
6. Artificial Neural Network
In the past few decades, various advanced computational approaches, e.g., finite element, numerical linear algebra, statistics, numerical analysis, tensor analysis, and artificial intelligence, have been applied in various fields of study such as chemical engineering [29,30,31,32,33,34,35,36,37], electrical engineering [38,39,40,41,42,43,44,45,46], biomedical engineering [47,48,49,50,51,52,53,54], civil engineering [55,56,57,58], social sciences [59,60,61,62,63,64,65,66,67,68,69], mechanical engineering [70,71,72,73,74,75,76,77], computer and information technology engineering [78,79,80,81], physics [82,83,84,85,86,87], petroleum engineering [88,89,90,91,92,93,94], mathematics [95,96,97,98,99,100], etc. The ANN has been demonstrated to be the most potent technique for classification and prediction among the aforementioned computational methods. The ANN is an appropriate tool for handling modeling, optimization, prediction, and classification. These networks are mathematical systems made of simple processing elements called neurons, with parallel performance in single or multiple layers. One of the most well-known and widely used neural networks is the multilayer perceptron (MLP). The idea behind artificial neural networks comes from biological neural networks.
In this study, two different networks were utilized for recognizing the three flow regimes and measuring the void fraction percentages. The average value of the approximation signal of the first detector and the kurtosis of the approximation signal of the second detector were used as the inputs for both networks. A total of 54 different cases in three different regimes were simulated using MCNPX code. A dataset containing 39 cases (about 70%) was used for training the network and a dataset of 15 cases (about 30%) was used for evaluating the network.
Several networks with different parameters were analyzed, which led to finding the optimized network. The network characteristics and the diagram of the optimized network for regime classification are shown in Table 1 and Figure 8, respectively.

Table 1.
Network characteristics for regime classification.
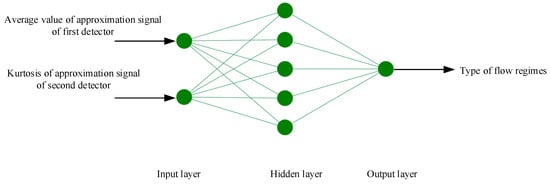
Figure 8.
Network structure for regime classification.
The performance of the obtained neural network for classifying the flow regimes is shown in Figure 9.
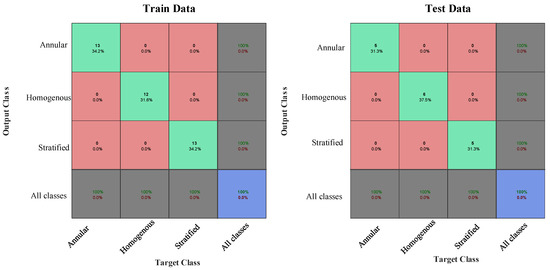
Figure 9.
Confusion matrix for regime classification (training and testing data samples).
According to the presented results (Figure 9), with the aid of the proposed techniques, all the considered regimes were identified correctly.
In the second network, the same inputs were applied to the ANN, and the output of the network was the percentage void fraction. The characteristics of the neural network utilized to predict the void fraction are shown in Table 2 and Figure 10.

Table 2.
Network characteristics for void fraction measurement.
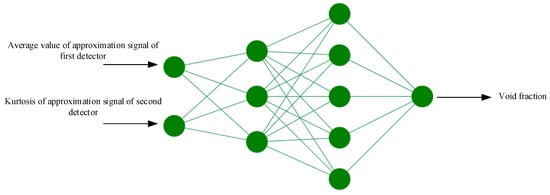
Figure 10.
Network structure for predicting volumetric percentages.
The performance of the implemented network for determining the void fractions of the training and testing datasets is illustrated in Figure 11 and Figure 12, respectively.
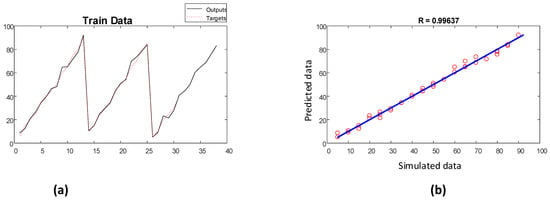
Figure 11.
Performance of void fraction estimator network (training): (a) fitting diagram and (b) regression diagram.
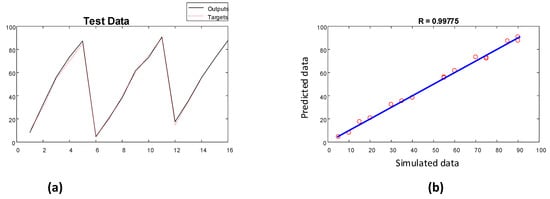
Figure 12.
Performance of void fraction estimator network (testing): (a) fitting diagram and (b) regression diagram.
The obtained errors of the proposed artificial neural network model are shown in Table 3, where the MRE% and RMSE values were calculated using Equations (9) and (10), respectively.
where N, X (Sim) and X (Pred) stand for the number of data points and the simulated and predicted values of the neural network, respectively. The low error for the testing set validates the presented model and also shows that overfitting has not occurred.

Table 3.
Errors related to training and testing procedures.
Table 4 shows a comparison between this study and other relevant studies in this field.

Table 4.
Comparison between current study and previous research.
Measuring volumetric percentages is a matter of key importance in many industries. Dozens of investigations have been carried out in this field to accomplish this task more accurately and decrease the rate of errors. According to the information shown in Table 4, the current study shows better performance and a lower rate of errors. The three studies mentioned adopted time-domain as well as statistical features to calculate volumetric percentages. In this study, by utilizing wavelet feature extraction, all the flow regimes were classified correctly, and the calculated void fraction percentages had notably lower error rates in comparison with the previous studies.
The simulated and predicted values of the implemented network for void fraction percentages can be found in Table 5.

Table 5.
Simulated and predicted values for volumetric percentages.
7. Conclusions
To conclude, three conventional flow regimes were simulated using MCNP code. The output signals of both transmitted photon detectors were decomposed using a discrete wavelet transform. Several statistical features were extracted from the approximation signals of both detectors. All these features were analyzed in order to find the best features with the highest ability to classify the relevant flow regimes, for use as the inputs to the networks. The average value of the approximation signal of the first detector and the kurtosis of the approximation signal of the second detector were found to be the features with the best separation ability. One ANN was used for classifying the three flow regimes and another ANN was employed for predicting the void fraction percentages. The low error rates of the presented ANNs demonstrate the precision and correctness of the presented models.
It should be noted that in the current research, using the described methods, all the flow regimes were identified correctly, and the volume fraction percentages were determined with an RMSE of less than 1.93, which is about three times better than in previous work [4].
Author Contributions
Conceptualization, S.H., G.H.R. and O.T.; Software, S.H., G.H.R., E.E.-Z. and O.T.; Writing—Review and Editing, S.H., M.A., F.B., E.N., E.E.-Z. and O.T.; Supervision, T.A., E.N. and G.H.R.; Funding acquisition, M.A., O.T. and E.E.-Z. All authors have read and agreed to the published version of the manuscript.
Funding
We acknowledge support from the German Research Foundation and the Open Access Publication Fund of the Thueringer Universitaets- und Landesbibliothek Jena Projekt, Nr. 433052568. The Deanship of Scientific Research (DSR) at King Abdulaziz University, Jeddah, Saudi Arabia has funded this project, under grant no. (FP-12-43).
Institutional Review Board Statement
Not applicable.
Informed Consent Statement
Not applicable.
Data Availability Statement
Data is contained within the article.
Conflicts of Interest
The authors declare no conflict of interest.
References
- Roshani, G.H.; Nazemi, E.; Feghhi, S.A.; Setayeshi, S. Flow regime identification and void fraction prediction in two-phase flows based on gamma ray attenuation. Measurement 2015, 62, 25–32. [Google Scholar] [CrossRef]
- Roshani, G.; Feghhi, S.; Mahmoudi-Aznaveh, A.; Nazemi, E.; Adineh-Vand, A. Precise volume fraction prediction in oil–water–gas multiphase flows by means of gamma-ray attenuation and artificial neural networks using one detector. Measurement 2014, 51, 34–41. [Google Scholar] [CrossRef]
- Roshani, M.; Phan, G.T.; Ali, P.J.M.; Roshani, G.H.; Hanus, R.; Duong, T.; Corniani, E.; Nazemi, E.; Kalmoun, E.M. Evaluation of flow pattern recognition and void fraction measurement in two phase flow independent of oil pipeline’s scale layer thickness. Alex. Eng. J. 2021, 60, 1955–1966. [Google Scholar] [CrossRef]
- Nazemi, E.; Roshani, G.H.; Feghhi, S.A.H.; Setayeshi, S.; Zadeh, E.E.; Fatehi, A. Optimization of a method for identifying the flow regime and measuring void fraction in a broad beam gamma-ray attenuation technique. Int. J. Hydrog. Energy 2016, 41, 7438–7444. [Google Scholar] [CrossRef]
- Åbro, E.; Khoryakov, V.A.; Johansen, G.A.; Kocbach, L. Determination of void fraction and flow regime using a neural network trained on simulated data based on gamma-ray densitometry. Meas. Sci. Technol. 1999, 10, 619. [Google Scholar]
- Chunguo, J.; Qiuguo, B. Flow regime identification of gas/liquid two-phase flow in vertical pipe using RBF neural networks. In Proceedings of the 2009 Chinese Control and Decision Conference, Guilin, China, 17–19 June 2009; pp. 5143–5147. [Google Scholar]
- Åbro, E.; Johansen, G.A. Improved void fraction determination by means of multibeam gamma-ray attenuation measurements. Flow Meas. Instrum. 1999, 10, 99–108. [Google Scholar] [CrossRef]
- Nazemi, E.; Feghhi, S.; Roshani, G.; Setayeshi, S.; Peyvandi, R.G. A radiation-based hydrocarbon two-phase flow meter for estimating of phase fraction independent of liquid phase density in stratified regime. Flow Meas. Instrum. 2015, 46, 25–32. [Google Scholar] [CrossRef]
- Peyvandi, R.G.; Rad, S.Z.I. Application of artificial neural networks for the prediction of volume fraction using spectra of gamma rays backscattered by three-phase flows. Eur. Phys. J. Plus 2017, 132, 511. [Google Scholar] [CrossRef]
- Nazemi, E.; Feghhi, S.A.H.; Roshani, G.H.; Peyvandi, R.G.; Setayeshi, S. Precise Void Fraction Measurement in Two-phase Flows Independent of the Flow Regime Using Gamma-ray Attenuation. Nucl. Eng. Technol. 2016, 48, 64–71. [Google Scholar] [CrossRef] [Green Version]
- Roshani, G.; Nazemi, E.; Feghhi, S. Investigation of using 60 Co source and one detector for determining the flow regime and void fraction in gas–liquid two-phase flows. Flow Meas. Instrum. 2016, 50, 73–79. [Google Scholar] [CrossRef]
- Roshani, G.H.; Nazemi, E.; Roshani, M.M. Flow regime independent volume fraction estimation in three-phase flows using dual-energy broad beam technique and artificial neural network. Neural Comput. Appl. 2016, 28, 1265–1274. [Google Scholar] [CrossRef]
- Hanus, R.; Zych, M.; Kusy, M.; Jaszczur, M.; Petryka, L. Identification of liquid-gas flow regime in a pipeline using gamma-ray absorption technique and computational intelligence methods. Flow Meas. Instrum. 2018, 60, 17–23. [Google Scholar] [CrossRef]
- Sattari, M.A.; Roshani, G.H.; Hanus, R.; Nazemi, E. Applicability of time-domain feature extraction methods and artificial intelligence in two-phase flow meters based on gamma-ray absorption technique. Measurement 2021, 168, 108474. [Google Scholar] [CrossRef]
- Roshani, G.; Nazemi, E.; Roshani, M. Usage of two transmitted detectors with optimized orientation in order to three phase flow metering. Measurement 2017, 100, 122–130. [Google Scholar] [CrossRef]
- Roshani, M.; Phan, G.; Roshani, G.H.; Hanus, R.; Nazemi, B.; Corniani, E.; Nazemi, E. Combination of X-ray tube and GMDH neural network as a nondestructive and potential technique for measuring characteristics of gas-oil–water three phase flows. Measurement 2021, 168, 108427. [Google Scholar] [CrossRef]
- Roshani, M.; Phan, G.; Faraj, R.H.; Phan, N.-H.; Roshani, G.H.; Nazemi, B.; Corniani, E.; Nazemi, E. Proposing a gamma radiation based intelligent system for simultaneous analyzing and detecting type and amount of petroleum by-products. Nucl. Eng. Technol. 2021, 53, 1277–1283. [Google Scholar] [CrossRef]
- Roshani, M.; Sattari, M.A.; Ali, P.J.M.; Roshani, G.H.; Nazemi, B.; Corniani, E.; Nazemi, E. Application of GMDH neural network technique to improve measuring precision of a simplified photon attenuation based two-phase flowmeter. Flow Meas. Instrum. 2020, 75, 101804. [Google Scholar] [CrossRef]
- Roshani, G.; Nazemi, E. Intelligent densitometry of petroleum products in stratified regime of two phase flows using gamma ray and neural network. Flow Meas. Instrum. 2017, 58, 6–11. [Google Scholar] [CrossRef]
- Karami, A.; Roshani, G.H.; Khazaei, A.; Nazemi, E.; Fallahi, M. Investigation of different sources in order to optimize the nuclear metering system of gas–oil–water annular flows. Neural Comput. Appl. 2018, 32, 3619–3631. [Google Scholar] [CrossRef]
- Karami, A.; Roshani, G.H.; Nazemi, E.; Roshani, S. Enhancing the performance of a dual-energy gamma ray based three-phase flow meter with the help of grey wolf optimization algorithm. Flow Meas. Instrum. 2018, 64, 164–172. [Google Scholar] [CrossRef]
- Roshani, G.H.; Roshani, S.; Nazemi, E.; Roshani, S. Online measuring density of oil products in annular regime of gas-liquid two phase flows. Measurement 2018, 129, 296–301. [Google Scholar] [CrossRef]
- Roshani, G.; Nazemi, E.; Roshani, M. Intelligent recognition of gas-oil-water three-phase flow regime and determination of volume fraction using radial basis function. Flow Meas. Instrum. 2017, 54, 39–45. [Google Scholar] [CrossRef]
- Roshani, G.; Nazemi, E.; Roshani, M. Identification of flow regime and estimation of volume fraction independent of liquid phase density in gas-liquid two-phase flow. Prog. Nucl. Energy 2017, 98, 29–37. [Google Scholar] [CrossRef]
- Kutlu, Y.; Kuntalp, D. Feature extraction for ECG heartbeats using higher order statistics of WPD coefficients. Comput. Methods Programs Biomed. 2012, 105, 257–267. [Google Scholar] [CrossRef] [PubMed]
- Hosseini, S.; Roshani, G.H.; Setayeshi, S. Precise gamma based two-phase flow meter using frequency feature extraction and only one detector. Flow Meas. Instrum. 2020, 72, 101693. [Google Scholar] [CrossRef]
- Daubechies, I. Ten Lectures on Wavelets, Society for Industrial and Applied Mathematics; SIAM: Philadelphia, Pennsylvania, 1992. [Google Scholar]
- Mahmoodabadi, S.Z.; Ahmadian, A.; Abolhasani, M.D. ECG feature extraction using Daubechies wavelets. In Proceedings of the fifth IASTED International conference on Visualization, Imaging and Image Processing, Benidorm, Spain, 7–9 September 2005; pp. 343–348. [Google Scholar]
- Khounani, Z.; Hosseinzadeh-Bandbafha, H.; Nazemi, F.; Shaeifi, M.; Karimi, K.; Tabatabaei, M.; Aghbashlo, M.; Lam, S.S. Exergy analysis of a whole-crop safflower biorefinery: A step towards reducing agricultural wastes in a sustainable manner. J. Environ. Manag. 2021, 279, 111822. [Google Scholar] [CrossRef] [PubMed]
- Bahiraei, M.; Foong, L.K.; Hosseini, S.; Mazaheri, N. Predicting heat transfer rate of a ribbed triple-tube heat exchanger working with nanofluid using neural network enhanced by advanced optimization algorithms. Powder Technology 2021, 381, 459–476. [Google Scholar] [CrossRef]
- Hosseinzadeh-Bandbafha, H.; Nazemi, F.; Khounani, Z.; Ghanavati, H.; Shafiei, M.; Karimi, K.; Lam, S.S.; Aghbashlo, M.; Tabatabaei, M. Safflower-based biorefinery producing a broad spectrum of biofuels and biochemicals: A life cycle assessment perspective. Sci. Total Environ. 2021, 802, 149842. [Google Scholar] [CrossRef]
- Bahiraei, M.; Kok Foong, L.; Hosseini, S.; Mazaheri, N. Neural network combined with nature-inspired algorithms to estimate overall heat transfer coefficient of a ribbed triple-tube heat exchanger operating with a hybrid nanofluid. Measurement 2021, 174, 108967. [Google Scholar] [CrossRef]
- Bahiraei, M.; Mazaheri, N.; Hosseini, S. Neural network modeling of thermo-hydraulic attributes and entropy generation of an ecofriendly nanofluid flow inside tubes equipped with novel rotary coaxial double-twisted tape. Powder Technol. 2020, 369, 162–175. [Google Scholar] [CrossRef]
- Nazemi, F.; Karimi, K.; Denayer, J.F.; Shafiei, M. Techno-economic aspects of different process approaches based on brown macroalgae feedstock: A step toward commercialization of seaweed-based biorefineries. Algal Res. 2021, 58, 102366. [Google Scholar] [CrossRef]
- Liu, Y.; Zhang, Z.; Liu, X.; Wang, L.; Xia, X. Ore image classification based on small deep learning model: Evaluation and optimization of model depth, model structure and data size. Miner. Eng. 2021, 172, 107020. [Google Scholar] [CrossRef]
- Zhang, K.; Qiu, L.; Tao, J.; Zhong, X.; Lin, Z.; Wang, R.; Liu, Z. Recovery of gallium from leach solutions of zinc refinery residues by stepwise solvent extraction with N235 and Cyanex. Hydrometallurgy 2021, 205, 105722. [Google Scholar] [CrossRef]
- Mengmeng, Y.; Qingquan, K.; Wei, F.; Weitang, Y.; Qingyuan, W. Hierarchical porous nitrogen, oxygen, and phosphorus ternary doped hollow biomass carbon spheres for high-speed and long-life potassium storage. Carbon Energy 2021. [Google Scholar] [CrossRef]
- Roshani, S.; Roshani, S. Design of a high efficiency class-F power amplifier with large signal and small signal measure-ments. Measurement 2020, 149, 106991. [Google Scholar] [CrossRef]
- Pourbemany, J.; Mirjalily, G.; Abouei, J.; Raouf, A.H.F. Load Balanced Ad-Hoc On-Demand Routing Basedon Weighted Mean Queue Length Metric. In Proceedings of the Electrical Engineering (ICEE), Iranian Conference on IEEE, Mashhad, Iran, 8–10 May 2018; pp. 470–475. [Google Scholar]
- Pirasteh, A.; Roshani, S.; Roshani, S. A modified class-F power amplifier with miniaturized harmonic control circuit. AEU Int. J. Electron. Commun. 2018, 97, 202–209. [Google Scholar] [CrossRef]
- Jamshidi, M.B.; Roshani, S.; Talla, J.; Roshani, S.; Peroutka, Z. Size reduction and performance improvement of a microstrip Wilkinson power divider using a hybrid design technique. Sci. Rep. 2021, 11, 7773. [Google Scholar] [CrossRef] [PubMed]
- Jamshidi, M.B.; Siahkamari, H.; Roshani, S.; Roshani, S. A compact Gysel power divider design using U-shaped and T-shaped reso-nators with harmonics suppression. Electromagnetics 2019, 39, 491–504. [Google Scholar] [CrossRef]
- Roshani, S.; Roshani, S.; Zarinitabar, A. A modified Wilkinson power divider with ultra harmonic suppression using open stubs and lowpass filters. Analog. Integr. Circuits Signal Process. 2019, 98, 395–399. [Google Scholar] [CrossRef]
- Roshani, S.; Roshani, S. Design of a very compact and sharp bandpass diplexer with bended lines for GSM and LTE applica-tions. AEU. Int. J. Electron. Commun. 2019, 99, 354–360. [Google Scholar] [CrossRef]
- Roshani, S.; Roshani, S. A compact coupler design using meandered line compact microstrip resonant cell (MLCMRC) and bended lines. Wireless Networks 2021, 27, 677–684. [Google Scholar] [CrossRef]
- Pirasteh, A.; Roshani, S.; Roshani, S. Compact microstrip lowpass filter with ultrasharp response using a square-loaded mod-ified T-shaped resonator. Turk. J. Electr. Eng. Comput. Sci. 2018, 26, 1736–1746. [Google Scholar] [CrossRef]
- Shekouhi, N.; Dick, D.; Baechle, M.W.; Kaeley, D.K.; Goel, V.K.; Serhan, H.; Rawlinson, J.; Shaw, D. Clinically relevant finite element technique based protocol to evaluate growing rods for early onset scoliosis correction. JOR Spine 2020, 3, 1119. [Google Scholar] [CrossRef]
- Ghanbari, B. A new model for investigating the transmission of infectious diseases in a prey-predator system using a non-singular fractional derivative. Math. Methods Appl. Sci. 2021. [Google Scholar] [CrossRef]
- Nabti, A.; Ghanbari, B. Global stability analysis of a fractional SVEIR epidemic model. Math. Methods Appl. Sci. 2021, 44, 8577–8597. [Google Scholar] [CrossRef]
- Hegde, A.; Sowndarya, K.; Joseph, J.A.; Shenoy, A. Evaluation of triglyceride/high-density lipoprotein ratio as a surrogate marker for insulin resistance in healthy young males. J. Nat. Sci. Biol. Med. 2021, 12, 213. [Google Scholar] [CrossRef]
- Ghanbari, B. On the modeling of the interaction between tumor growth and the immune system using some new frac-tional and fractional-fractal operators. Adv. Differ. Equ. 2020, 2020, 585. [Google Scholar] [CrossRef]
- Djilali, S.; Ghanbari, B. The influence of an infectious disease on a prey-predator model equipped with a fractional-order derivative. Adv. Differ. Equ. 2021, 2021, 20. [Google Scholar] [CrossRef]
- Ghanbari, B. Chaotic behaviors of the prevalence of an infectious disease in a prey and predator system using fractional derivatives. Math. Methods Appl. Sci. 2021, 44, 9998–10013. [Google Scholar] [CrossRef]
- Ghanbari, B. A fractional system of delay differential equation with nonsingular kernels in modeling hand-foot-mouth disease. Adv. Differ. Equ. 2020, 2020, 536. [Google Scholar] [CrossRef]
- Ashrafi, R.; Azarbayjani, M.; Cox, R.; Futrell, B.; Glass, J.; Zarrabi, A.; Amirazar, A. Assessing the Performance of UFAD System in an Office Building Located in Various Climate Zones. In Proceedings of the Symposium on Simulation for Archi-tecture and Urban Design, Atlanta, Georgia, 7–9 April 2019. [Google Scholar]
- Moradi, M.J.; Hariri-Ardebili, M.A. Developing a Library of Shear Walls Database and the Neural Network Based Predictive Meta-Model. Appl. Sci. 2019, 9, 2562. [Google Scholar] [CrossRef] [Green Version]
- Nazemi, B.; Rafiean, M. Forecasting house prices in Iran using GMDH. Int. J. Hous. Mark. Anal. 2021, 14, 555–568. [Google Scholar] [CrossRef]
- Nazemi, B.; Rafiean, M. Modelling the affecting factors of housing price using GMDH-type artificial neural networks in Isfa-han city of Iran. Int. J. Hous. Mark. Anal. 2021. [CrossRef]
- Jassim, T.L. The Influence of Oil Prices, Licensing and Production on the Economic Development: An Empirical Investigation of Iraq Economy. AgBioForum 2021, 23, 1–11. [Google Scholar]
- Mao, C.C.; Ma, Z.X. The analysis of the regional economic growth and the regional financial industry development difference in china based on the theil index. Int. J. Econ. Financ. Stud. 2021, 13, 128–154. [Google Scholar]
- Dubois, O.; Silvius, G. The Relation Between Sustainable Project Management and Project Success. Int. J. Manag. Sustain. 2020, 9, 218–238. [Google Scholar] [CrossRef]
- Khayatnezhad, M.; Nasehi, F. Industrial pesticides and a methods assessment for the reduction of associated risks: A Re-view. Adv. Life Sci. 2021, 8, 202–210. [Google Scholar]
- Johar, M.G.M.; Ab Yajid, M.S.; Khatibi, A. Data Mining Technology and its Applications for Sales Productivity Analysis. Syst. Rev. Pharm. 2020, 11, 626–632. [Google Scholar]
- Johar, M.G.M.; Azam, S.F.; & Ab Yajid, M.S. Information Mining Innovation and its Execution for an Information Digging Application in the Study of Deals Prescient. Syst. Rev. Pharm. 2020, 11, 633–639. [Google Scholar]
- Khdour, N.; Al-Adwan, A.S.; Alsoud, A.; Al-Douri, J.A. Human Resource Management Practices and Total Quality Man-agement in Insurance Companies: Evidence from Jordan. Probl. Perspect. Manag. 2021, 19, 432–444. [Google Scholar]
- Dewi, N.F.; Azam, S.M.F.; Yusof, S.K.M. Factors influencing the information quality of local government financial statement and financial accountability. Manag. Sci. Lett. 2019, 9, 1373–1384. [Google Scholar] [CrossRef]
- Pathiratne, S.U.; Khatibi, A.; Johar, M.G.M. CSFs for Six Sigma in service and manufacturing compa-nies: An insight on literature. Int. J. Lean Six Sigma 2018, 9, 543–561. [Google Scholar] [CrossRef]
- Zhuang, Y.; Yang, S.; Chupradit, S.; Nawaz, M.A.; Xiong, R.; Koksal, C. A nexus between macroeconomic dynamics and trade openness: Moderating role of institutional quality. Bus. Process. Manag. J. 2021, 27, 1703–1719. [Google Scholar] [CrossRef]
- Movchan, I.; Shaygallyamova, Z.; Yakovleva, A.; Movchan, A. Increasing Resolution of Seismic Hazard Mapping on the Example of the North of Middle Russian Highland. Appl. Sci. 2021, 11, 5298. [Google Scholar] [CrossRef]
- Rouhi, S.; Sadeqi, S.; Xiros, N.; Ioup, J. CFD Analysis of Filling Process for a Hydrogen Energy Storage System. Am. Soc. Therm. Fluids Eng. 2020. [Google Scholar]
- Tembely, M.; AlSumaiti, A.M.; Alameri, W.S. Machine and deep learning for estimating the permeability of complex carbonate rock from X-ray micro-computed tomography. Energy Rep. 2021, 7, 1460–1472. [Google Scholar] [CrossRef]
- Sadeqi, S.; Xiros, N.; Rouhi, S.; Ioup, J.; VanZwieten, J.; Sultan, C. Wavelet Transformation Analysis Ap-Plied to Incompressible Flow Field about A Solid Cylinder. In ASTFE Digital Library; Begel House Inc.: Danbury, Connecticut, 2021. [Google Scholar]
- Tembely, M.; Vadillo, D.; Soucemarianadin, A.; Dolatabadi, A. Numerical Simulations of Polymer Solution Droplet Impact on Surfaces of Different Wettabilities. Processes 2019, 7, 798. [Google Scholar] [CrossRef] [Green Version]
- Rouhi, S.; Xiros, N.; Sadeqi, S.; Ioup, J.; Sultan, C.; VanZwieten, J. CFD Validation of the Thermodynamics Model of a Compressed Gaseous Hydrogen Storage Tank. In Proceedings of the American Society of Thermal and Fluids Engineers, New Orleans, LA, USA, 5–8 April 2020. [Google Scholar]
- Taylan, O.; Sattari, M.A.; Essoussi, I.E.; Nazemi, E. Frequency Domain Feature Extraction Investigation to Increase the Accuracy of an Intelligent Nondestructive System for Volume Fraction and Regime Determination of Gas-Water-Oil Three-Phase Flows. Mechanics 2021, 9, 2091. [Google Scholar] [CrossRef]
- Tembely, M.; Dolatabadi, A. A comprehensive model for predicting droplet freezing features on a cold substrate. J. Fluid Mech. 2019, 859, 566–585. [Google Scholar] [CrossRef]
- Zhang, B.; Chen, Y.X.; Wang, Z.G.; Li, J.Q.; Ji, H.H. Influence of Mach Number of Main Flow on Film Cooling Char-acteristics under Supersonic Condition. Symmetry 2021, 13, 127. [Google Scholar] [CrossRef]
- Pourbemany, J.; Zhu, Y.; Bettati, R. Breath to Pair (B2P): Respiration-Based Pairing Protocol for Wearable Devices. arXiv 2021, arXiv:2107.11677. [Google Scholar]
- Roshani, S.; Roshani, S. Two-Section Impedance Transformer Design and Modeling for Power Amplifier Applications. Appl. Comput. Electromagn. Soc. J. 2017, 32, 1042–1047. [Google Scholar]
- Pourbemany, J.; Zhu, Y.; Bettati, R. A Survey of Wearable Devices Pairing Based on Biometric Signals. arXiv 2021, arXiv:2107.11685. [Google Scholar]
- Elfaki, A.O.; Abouabdalla, O.A.; Fong, S.L.; JOHAR, G.M.; AIK, K.L.T.; & Bachok, R. Review and future directions of the automated validation in software product line engineering. J. Theor. Appl. Inf. Technol. 2012, 42, 75–93. [Google Scholar]
- Rezaei, T.; Aslmarand, S.M.; Snyder, R.; Khajavi, B.; Alsing, P.M.; Fanto, M.; Miller, W.A. Experimentalrealization of Schu-macher’s information geometric Bell inequality. Phys. Lett. A 2021, 405, 127–444. [Google Scholar] [CrossRef]
- Ghanbari, B.; Yusuf, A.; Inc, M.; Baleanu, D. The new exact solitary wave solutions and stability analysis for the (2+1)-dimensional Zakharov—Kuznetsov equation. Adv. Differ. Equ. 2019, 2019, 1–15. [Google Scholar] [CrossRef] [Green Version]
- Roshani, G.; Hanus, R.; Khazaei, A.; Zych, M.; Nazemi, E.; Mosorov, V. Density and velocity determination for single-phase flow based on radiotracer technique and neural networks. Flow Meas. Instrum. 2018, 61, 9–14. [Google Scholar] [CrossRef]
- Ghanbari, B. Abundant exact solutions to a generalized nonlinear Schrödinger equation with local fractional derivative. Math. Methods Appl. Sci. 2021, 44, 8759–8774. [Google Scholar] [CrossRef]
- Ghanbari, B.; Nisar, K.S.; Aldhaifallah, M. Abundant solitary wave solutions to an extended nonlinear Schrödinger’s equation with conformable derivative using an efficient integration method. Adv. Differ. Equ. 2020, 2020, 328. [Google Scholar] [CrossRef]
- Srivastava, H.M.; Günerhan, H.; Ghanbari, B. Exact traveling wave solutions for resonance nonlinear Schrödinger equation with intermodal dispersions and the Kerr law nonlinearity. Math. Methods Appl. Sci. 2019, 42, 7210–7221. [Google Scholar] [CrossRef]
- Hanus, R.; Zych, M.; Mosorov, V.; Golijanek, J.; Jedrzejczyk, A.; Jaszczur, M.; Andruszkiewicz, A. Evaluation of liquid-gas flow in pipeline using gamma-ray absorption technique and advanced signal processing. Metrol. Meas. Syst. 2021, 28, 145–159. [Google Scholar]
- Basahel, A.; Sattari, M.; Taylan, O.; Nazemi, E. Application of Feature Extraction and Artificial Intelligence Techniques for Increasing the Accuracy of X-ray Radiation Based Two Phase Flow Meter. Mathematics 2021, 9, 1227. [Google Scholar] [CrossRef]
- Taylan, O.; Abusurrah, M.; Amiri, S.; Nazemi, E.; Eftekhari-Zadeh, E.; Roshani, G.H. Proposing an Intelligent Dual-Energy Radiation-Based System for Metering Scale Layer Thickness in Oil Pipelines Containing an Annular Regime of Three-Phase Flow. Mathematics 2021, 9, 2391. [Google Scholar] [CrossRef]
- Alkabaa, A.S.; Nazemi, E.; Taylan, O.; Kalmoun, E.M. Application of Artificial Intelligence and Gamma Attenuation Tech-niques for Predicting Gas–Oil–Water Volume Fraction in Annular Regime of Three-Phase Flow Independent of Oil Pipeline’s Scale Layer. Mathematics 2021, 9, 1460. [Google Scholar] [CrossRef]
- Talha, M.; Sohail, M.; Tariq, R.; Ahmad, M.T. Impact of Oil Prices, Energy Consumption and Economic Growth on the Inflation Rate in Malaysia. Cuad. Econ. 2021, 44, 26–32. [Google Scholar]
- Samimi, A. Risk Management in Oil and Gas Refineries. Prog. Chem. Biochem. Res. 2020, 3, 140–146. [Google Scholar] [CrossRef]
- Xin, X.; Yu, G.; Wu, K.; Dong, X.; Chen, Z. Polymer Flooding in Heterogeneous Heavy Oil Reservoirs: Experimental and Simulation Studies. Polymers 2021, 13, 2636. [Google Scholar] [CrossRef] [PubMed]
- Djilali, S.; Ghanbari, B. Dynamical behavior of two predators–one prey model with generalized functional response and time-fractional derivative. Adv. Differ. Equ. 2021, 2021, 235. [Google Scholar] [CrossRef]
- Ghanbari, B. On novel nondifferentiable exact solutions to local fractional Gardner’s equation using an effective tech-nique. Math. Methods Appl. Sci. 2021, 44, 4673–4685. [Google Scholar] [CrossRef]
- Ghanbari, B. On approximate solutions for a fractional prey–predator model involving the Atangana–Baleanu deriva-tive. Adv. Differ. Equ. 2020, 2020, 679. [Google Scholar] [CrossRef]
- Ghanbari, B.; Atangana, A. Some new edge detecting techniques based on fractional derivatives with non-local and non-singular kernels. Adv. Differ. Equ. 2020, 2020, 435. [Google Scholar] [CrossRef]
- Ghanbari, B.; Inc, M.; Rada, L. Solitary Wave Solutions to the Tzitzéica Type Equations Obtained by a New Efficient Approach. J. Appl. Anal. Comput. 2019, 9, 568–589. [Google Scholar] [CrossRef]
- Rahman, G.; Nisar, K.S.; Ghanbari, B.; Abdeljawad, T. On generalized fractional integral inequalities for the monotone weighted Chebyshev functionals. Adv. Differ. Equ. 2020, 2020, 368. [Google Scholar] [CrossRef]
- Roshani, G.H.; Nazemi, E.; Shama, F.; Imani, M.A.; Mohammadi, S. Designing a simple radiometric system to predict void fraction percentage independent of flow pattern using radial basis function. Metrol. Meas. Syst. 2018, 25, 347–358. [Google Scholar]
Publisher’s Note: MDPI stays neutral with regard to jurisdictional claims in published maps and institutional affiliations. |
© 2021 by the authors. Licensee MDPI, Basel, Switzerland. This article is an open access article distributed under the terms and conditions of the Creative Commons Attribution (CC BY) license (https://creativecommons.org/licenses/by/4.0/).