
Waste NR Latex Based-Precursors as Carbon Source for CNTs Eco-Fabrications

 ,
,  , ,
, ,
Abstract
:
1. Introduction
2. Materials and Methods
2.1. Materials
2.2. Precursor Analysis
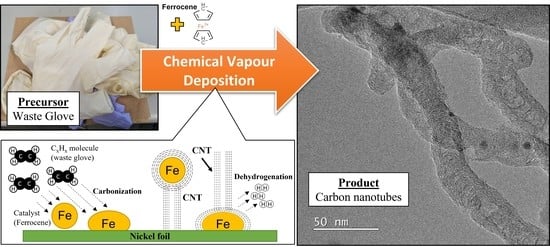
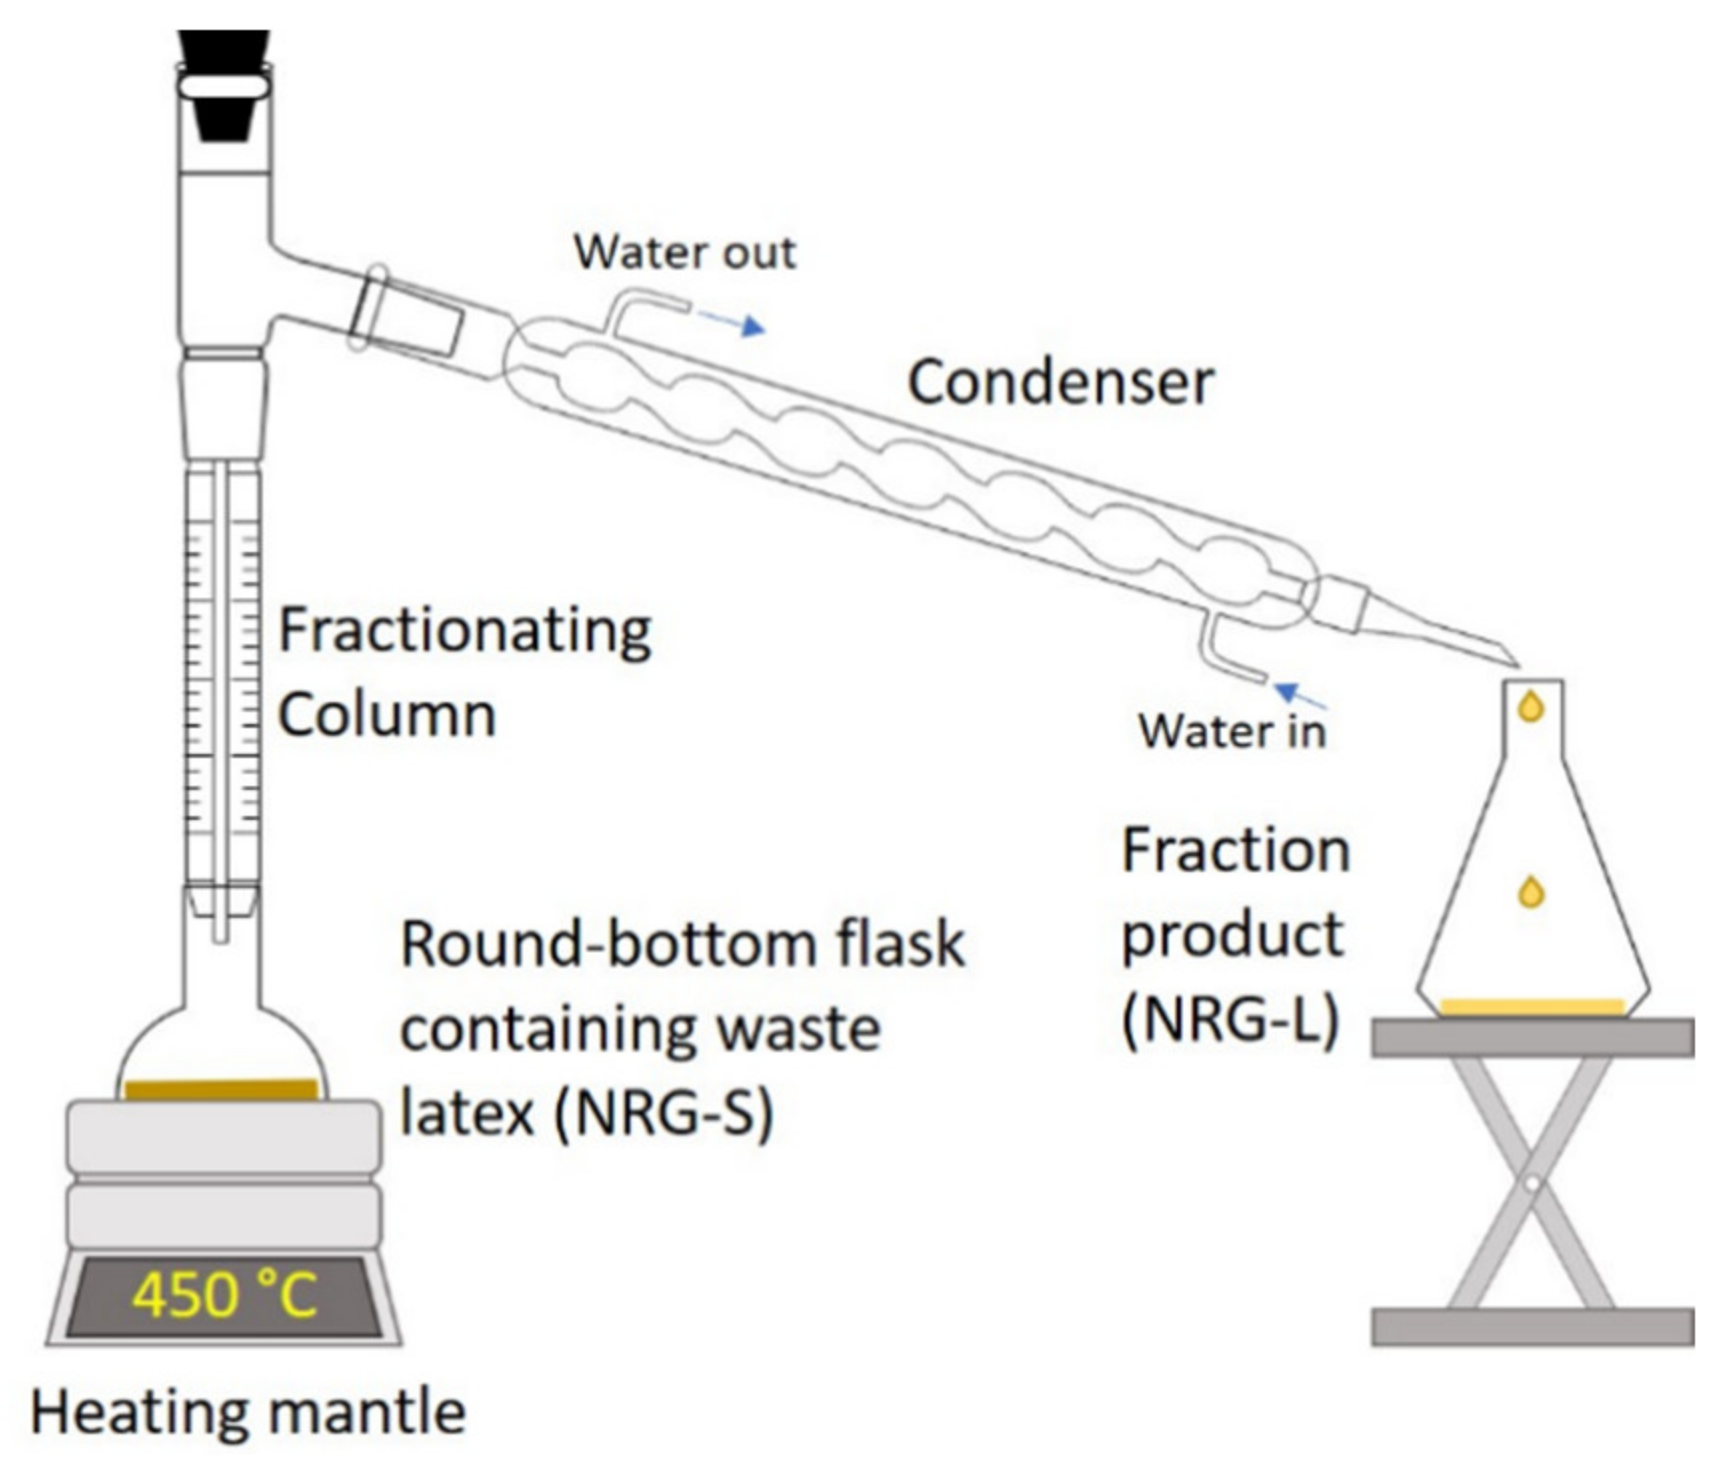
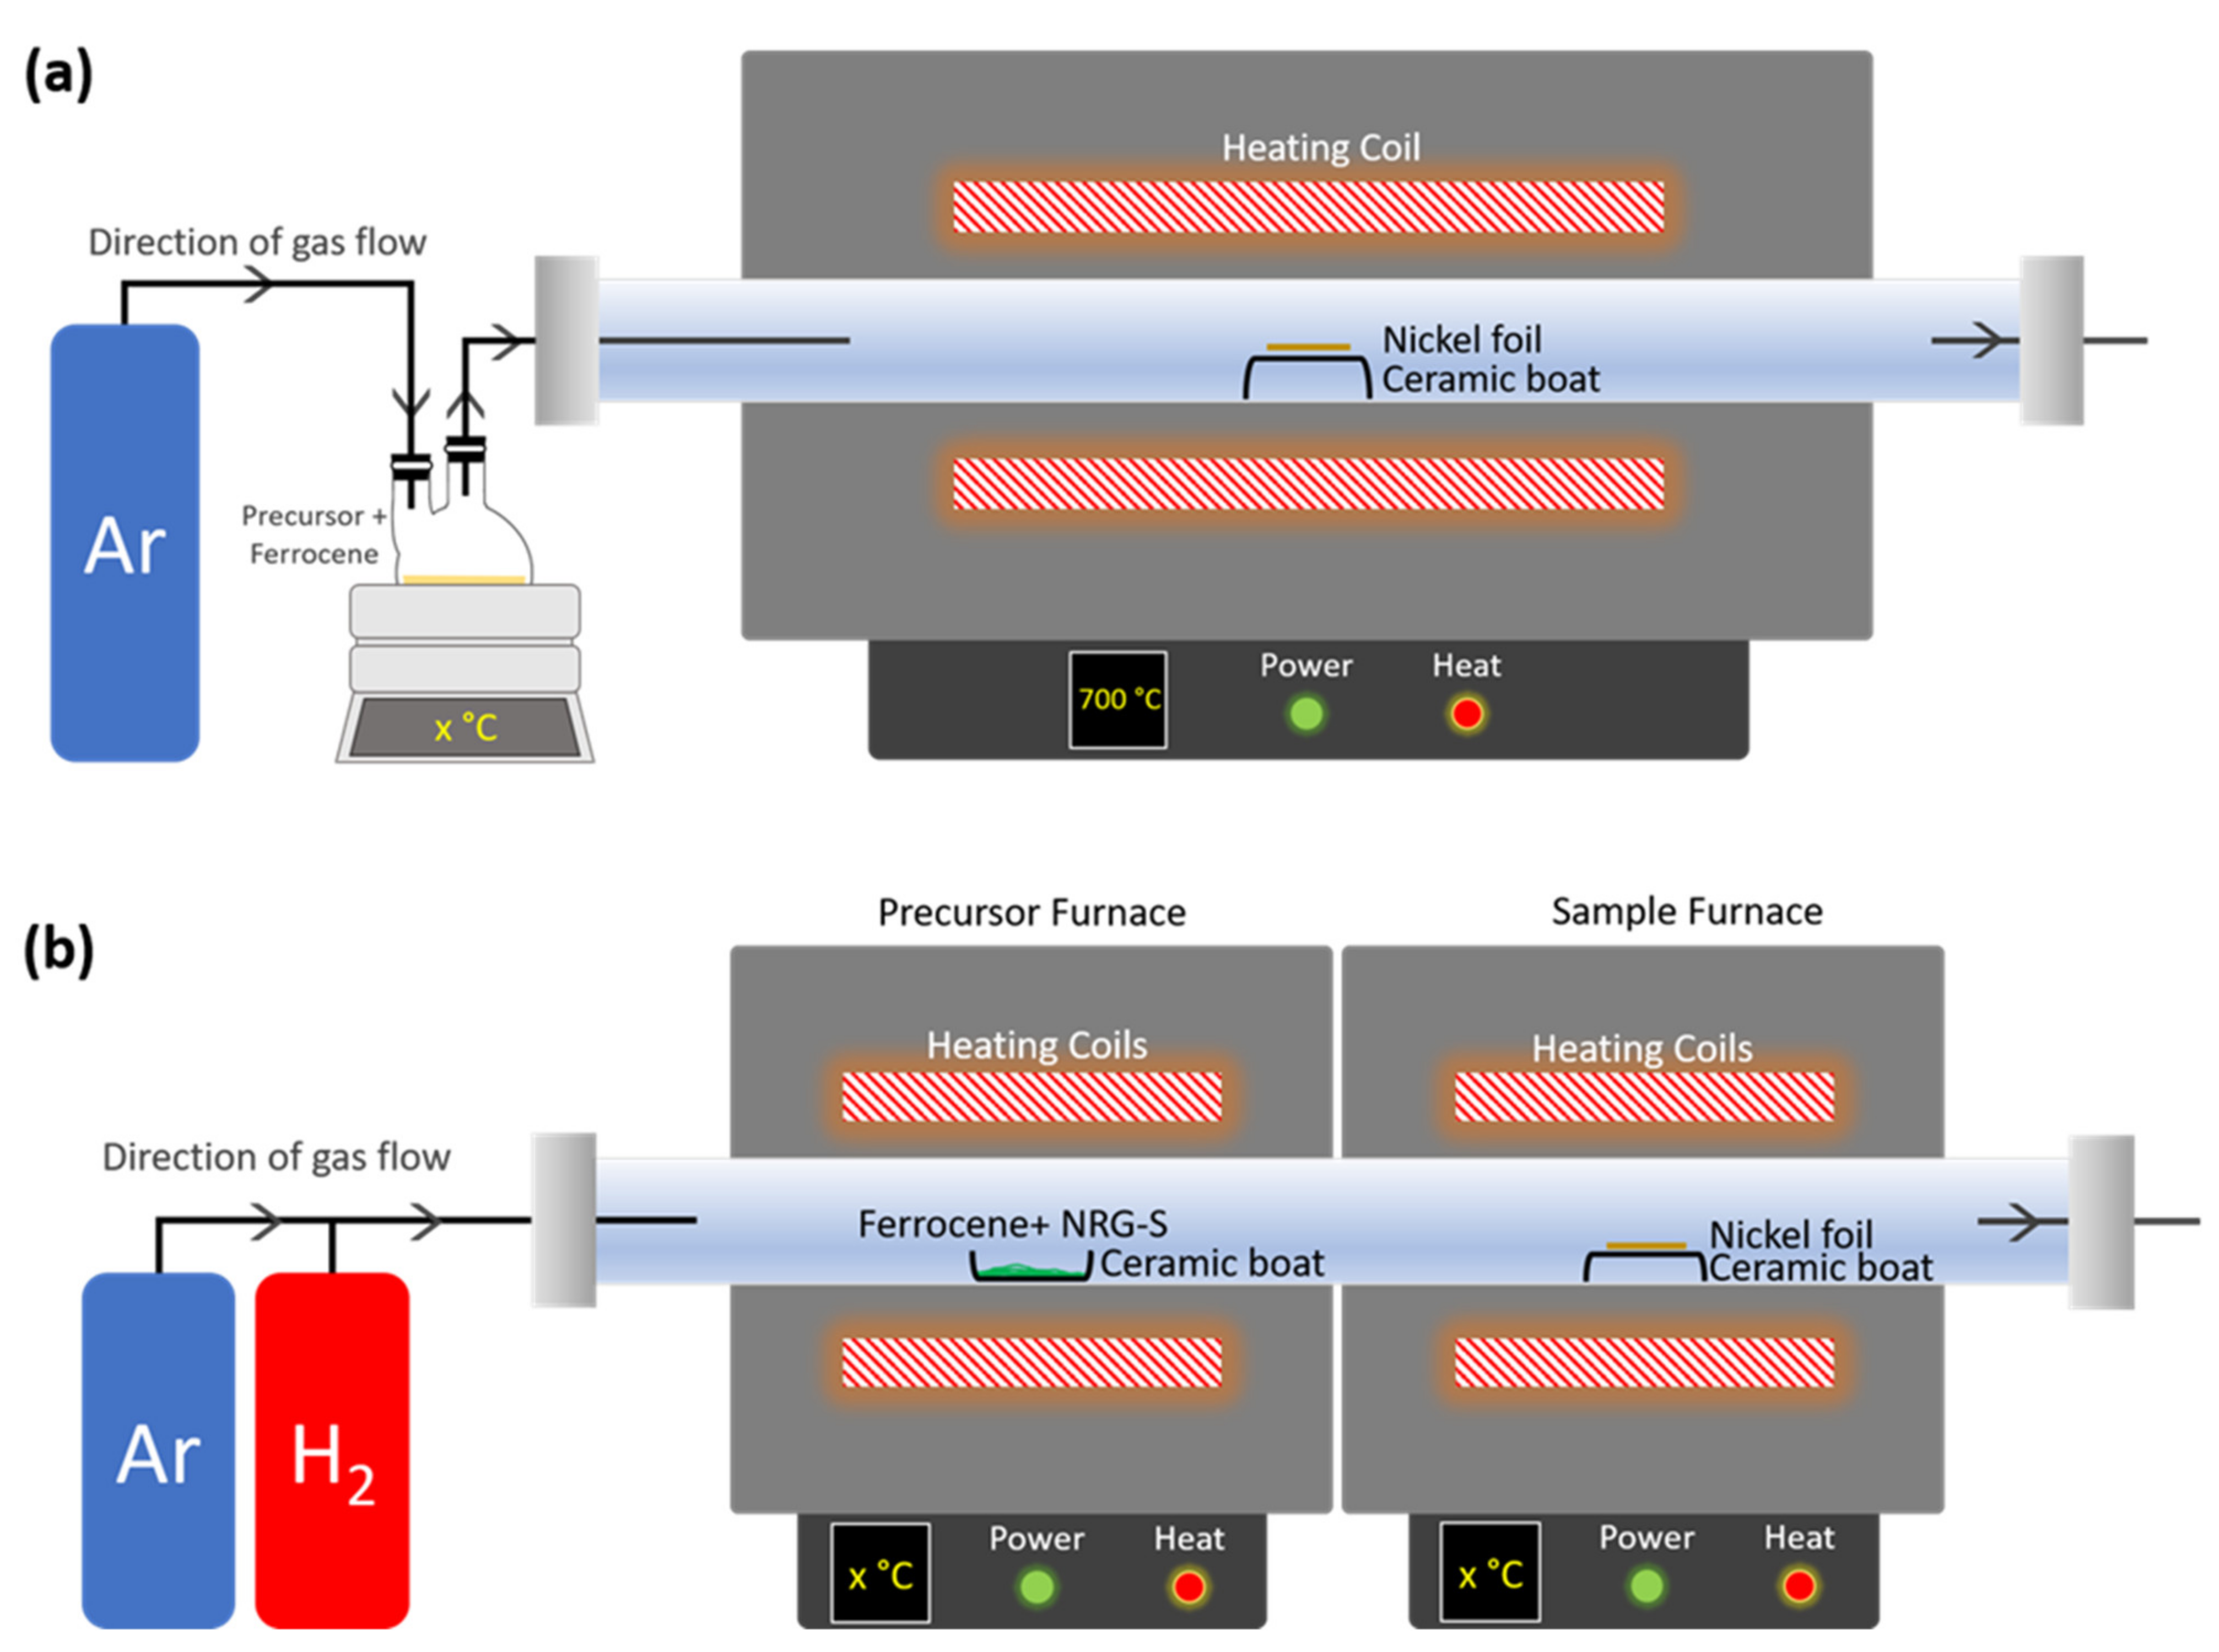
2.3. Fabrication of CNTs
2.4. Characterizations
3. Results and Discussions
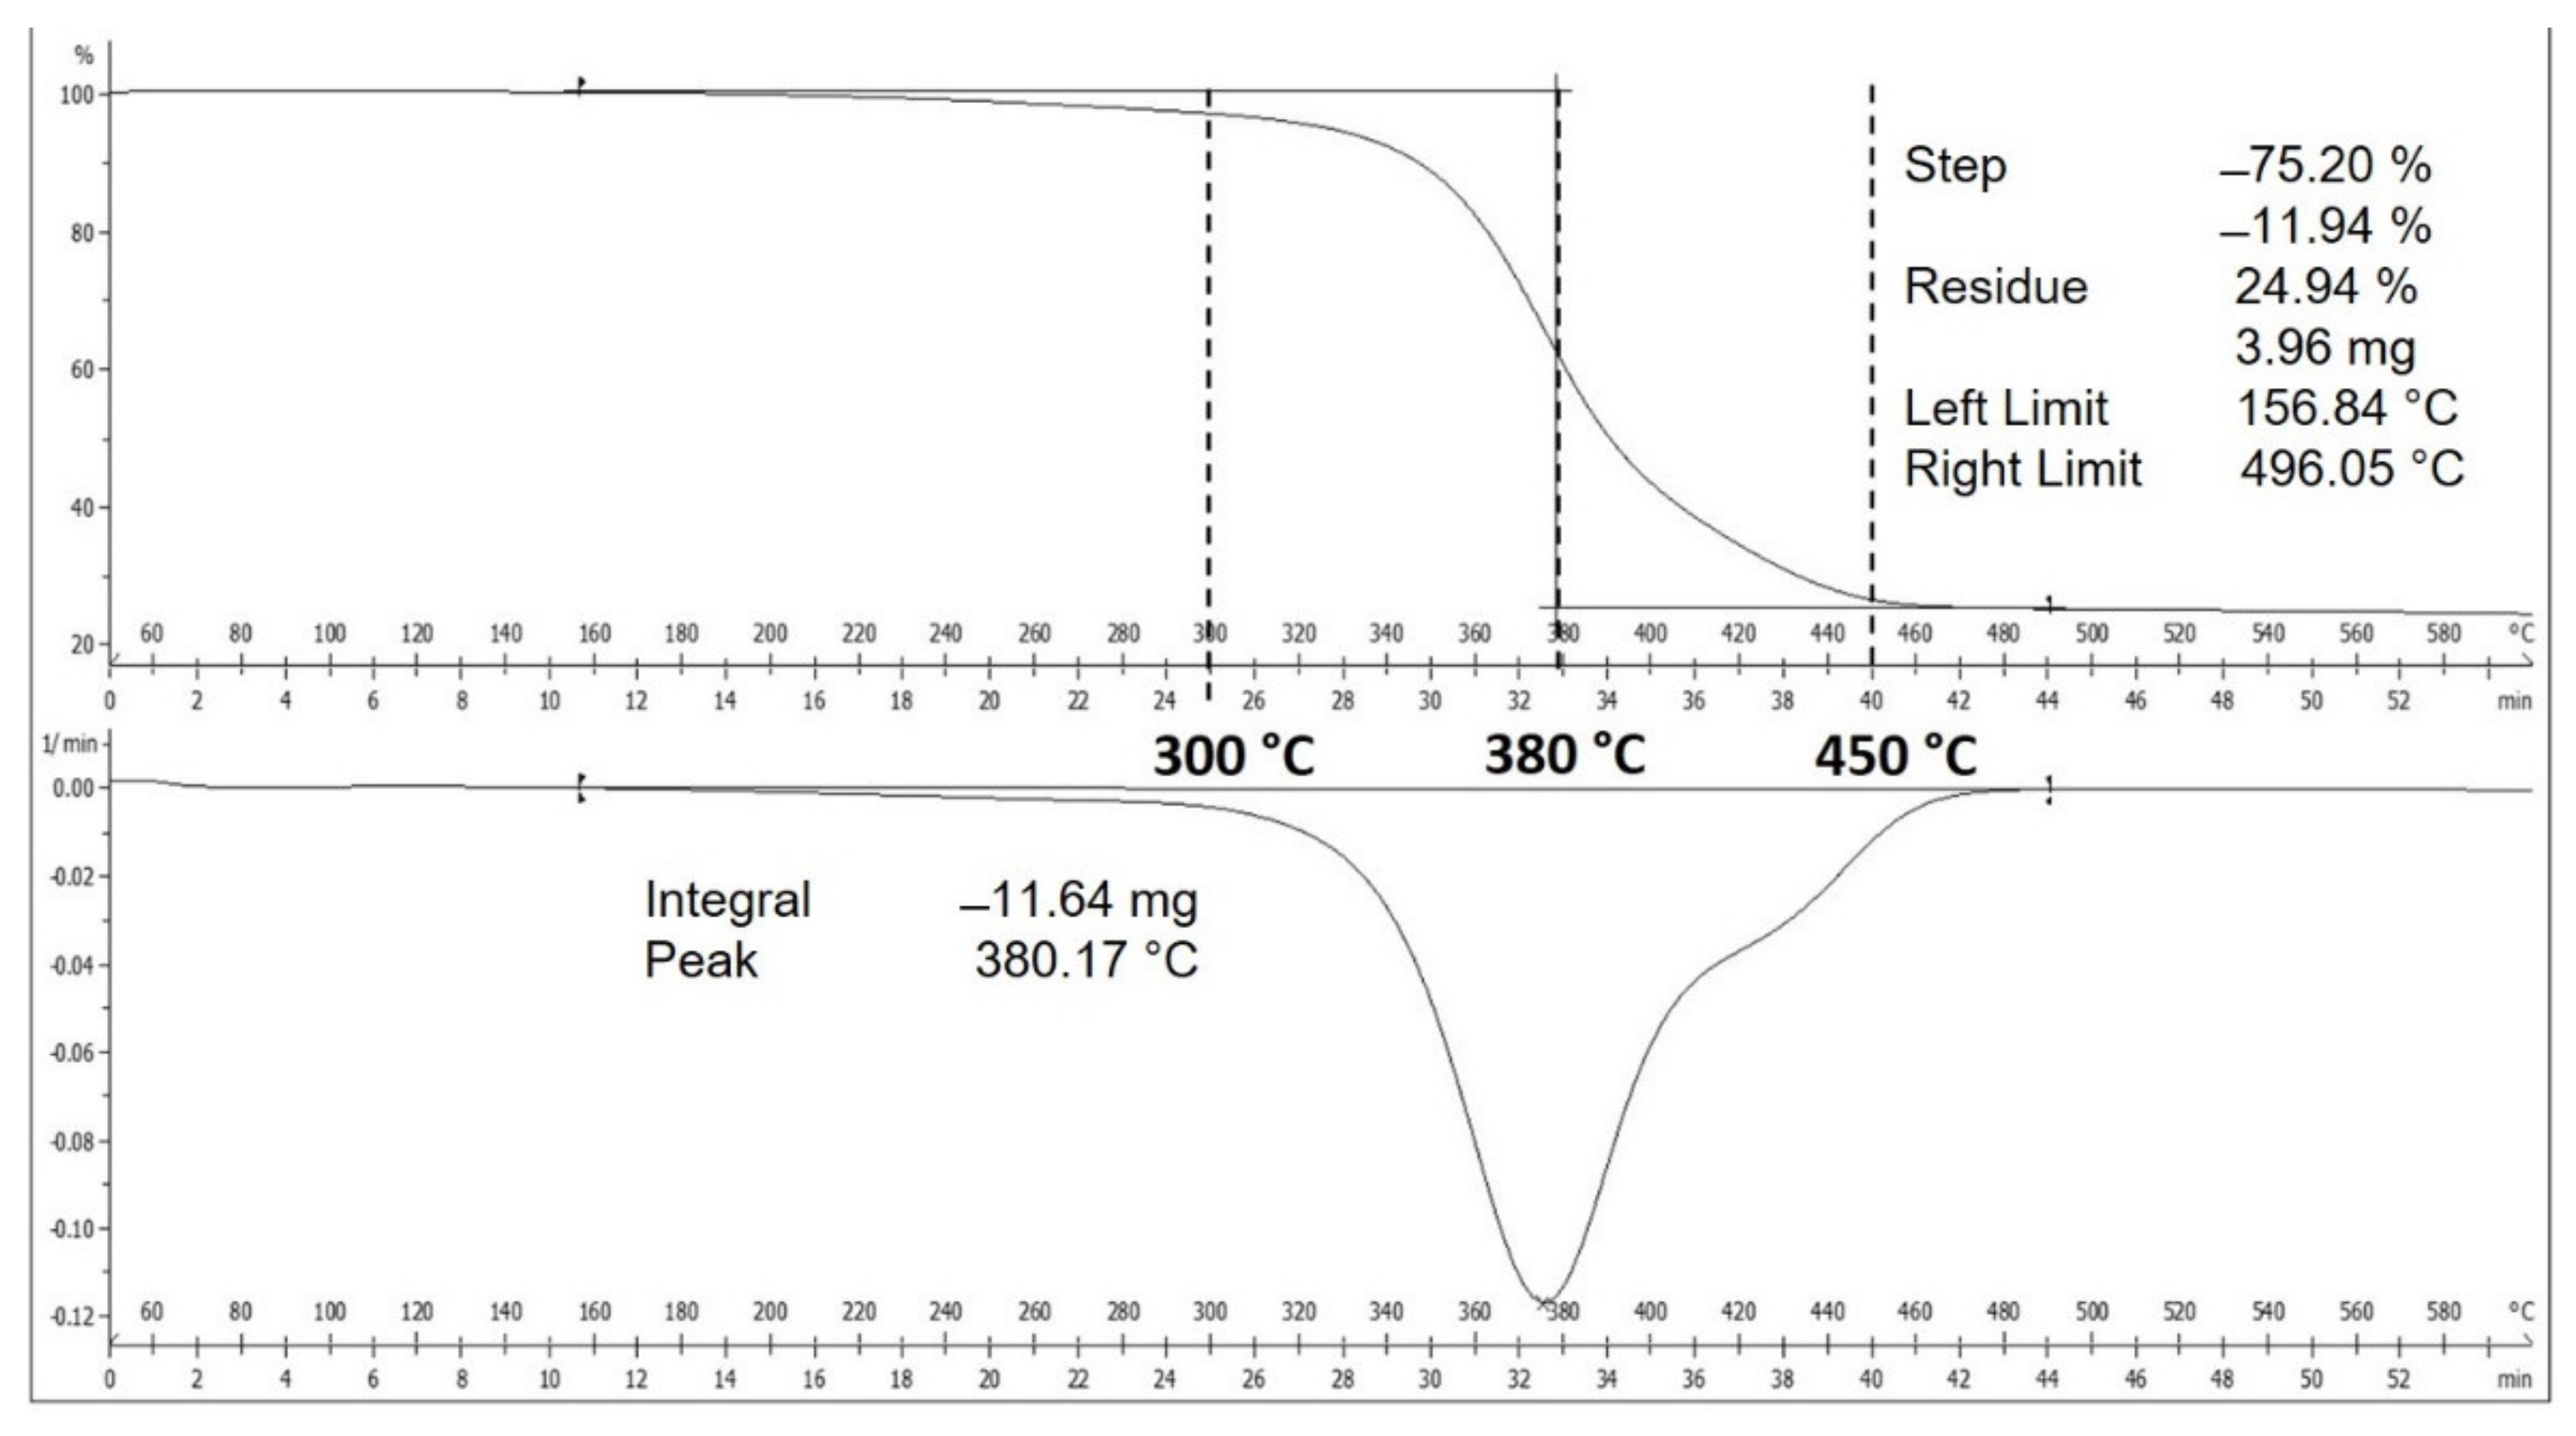
3.1. Analysis of Waste NRG as Carbon Precursor
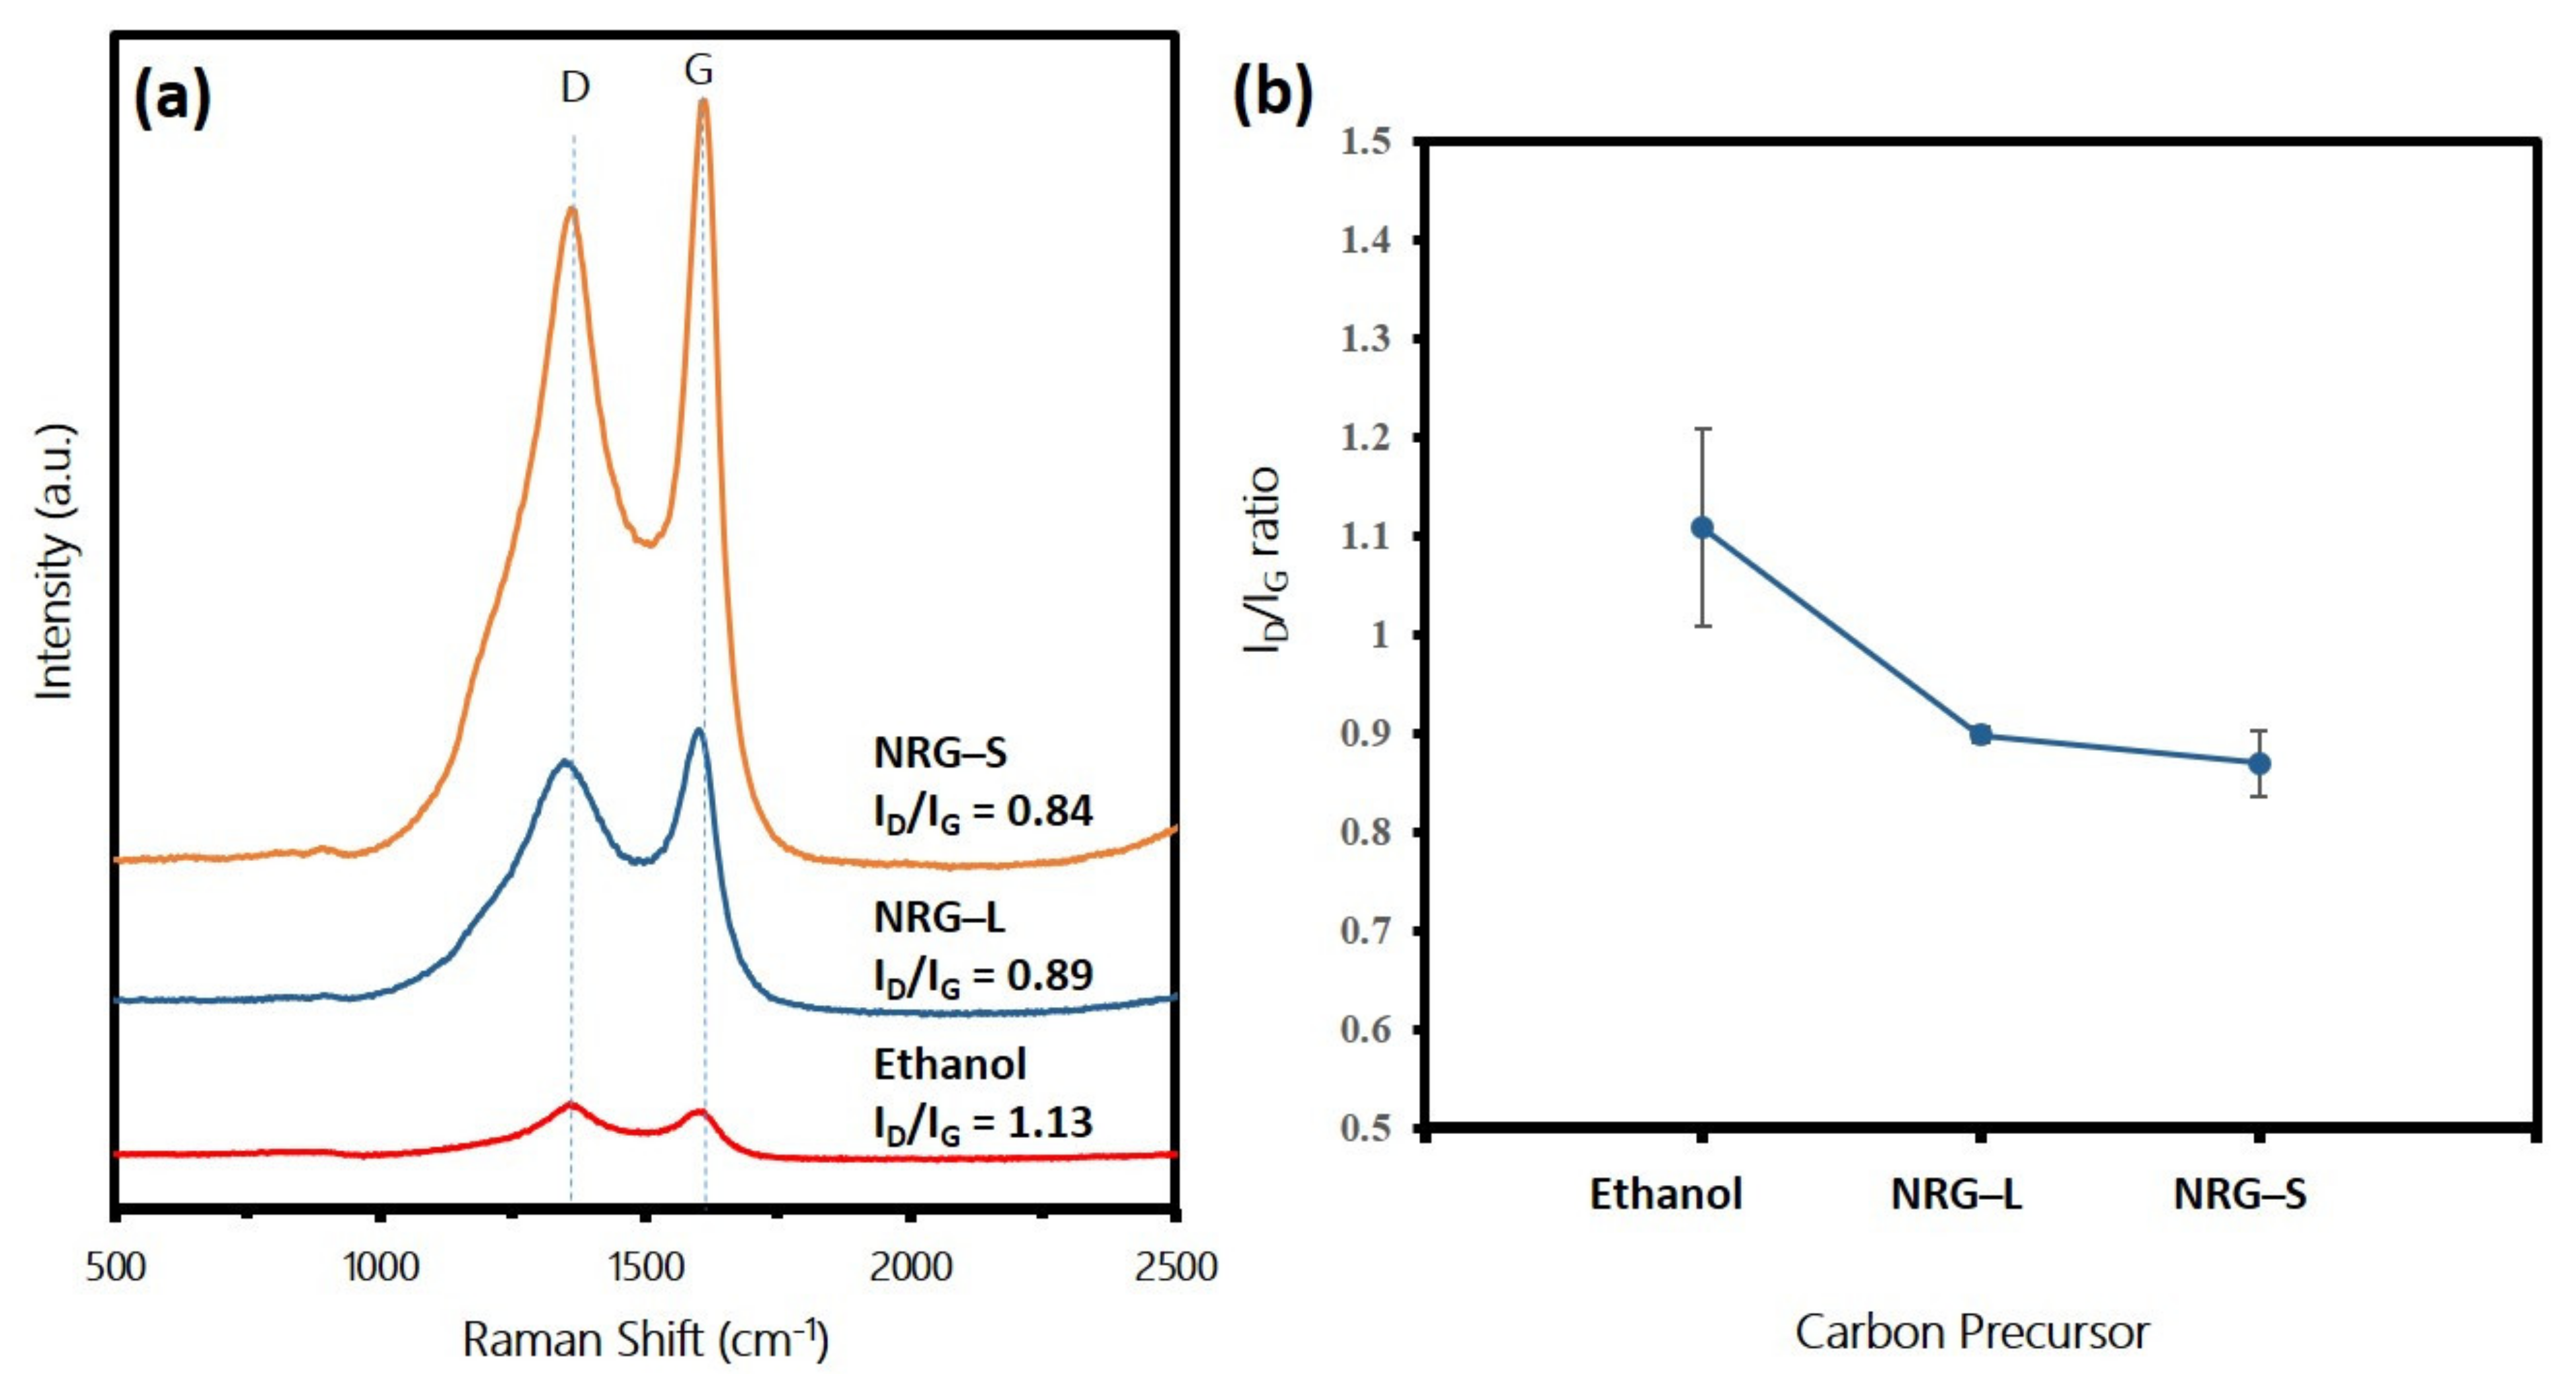
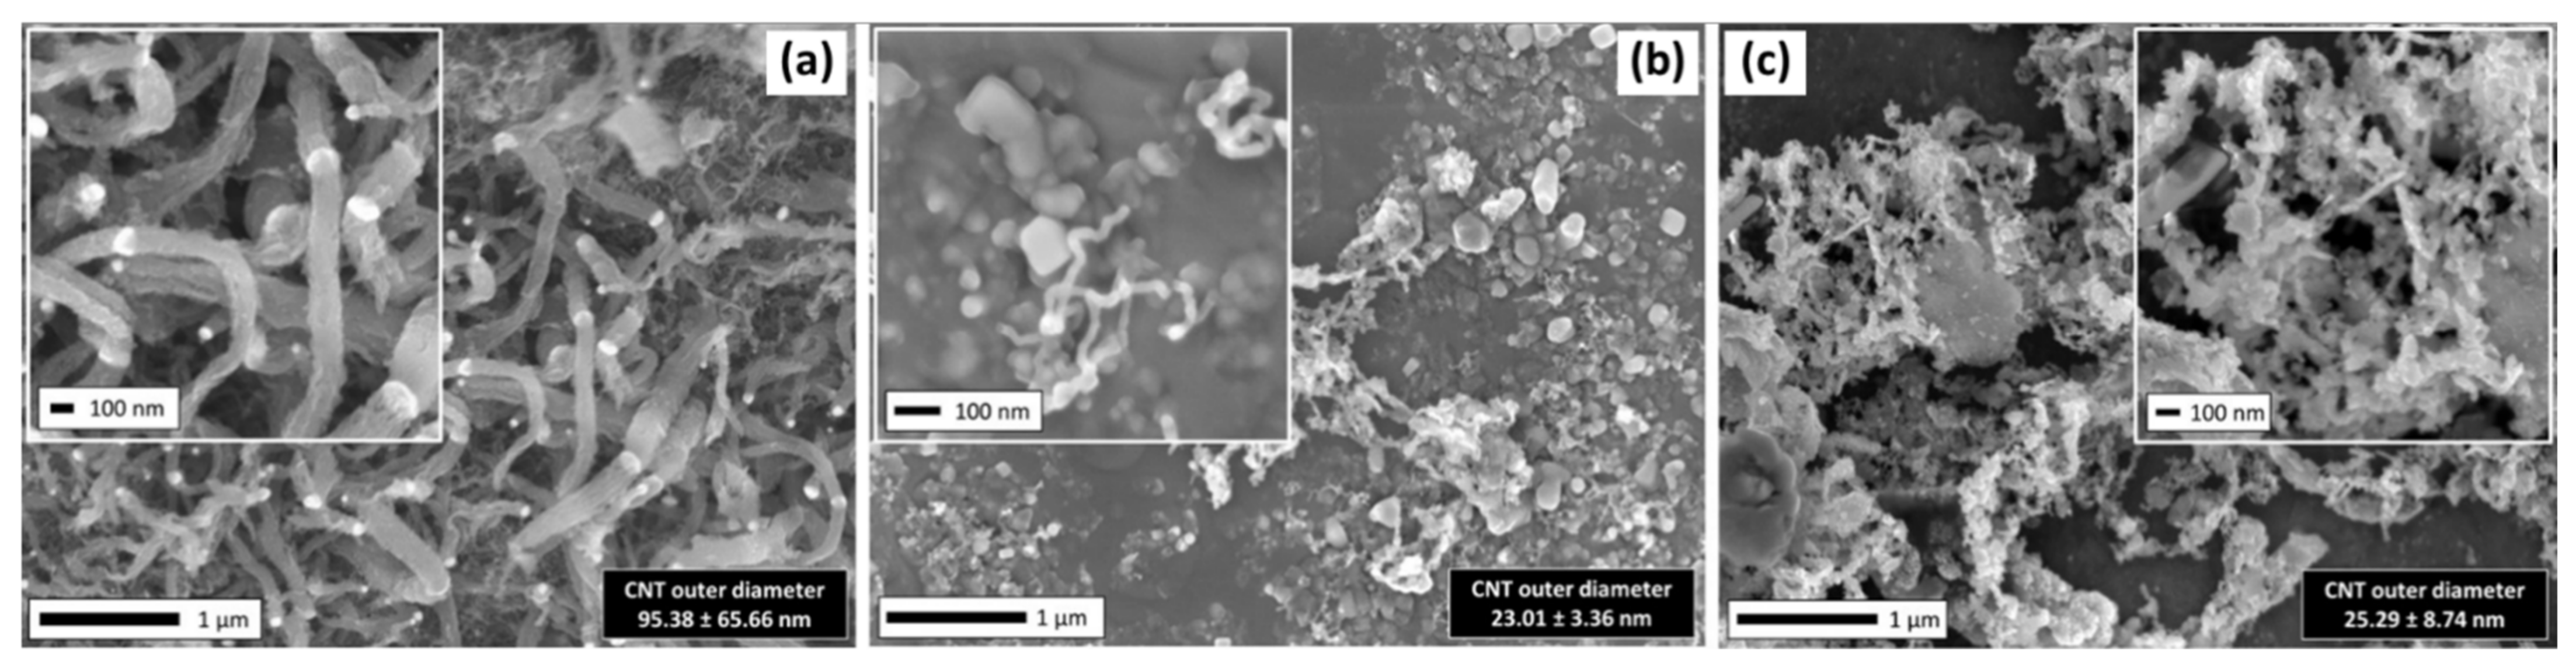
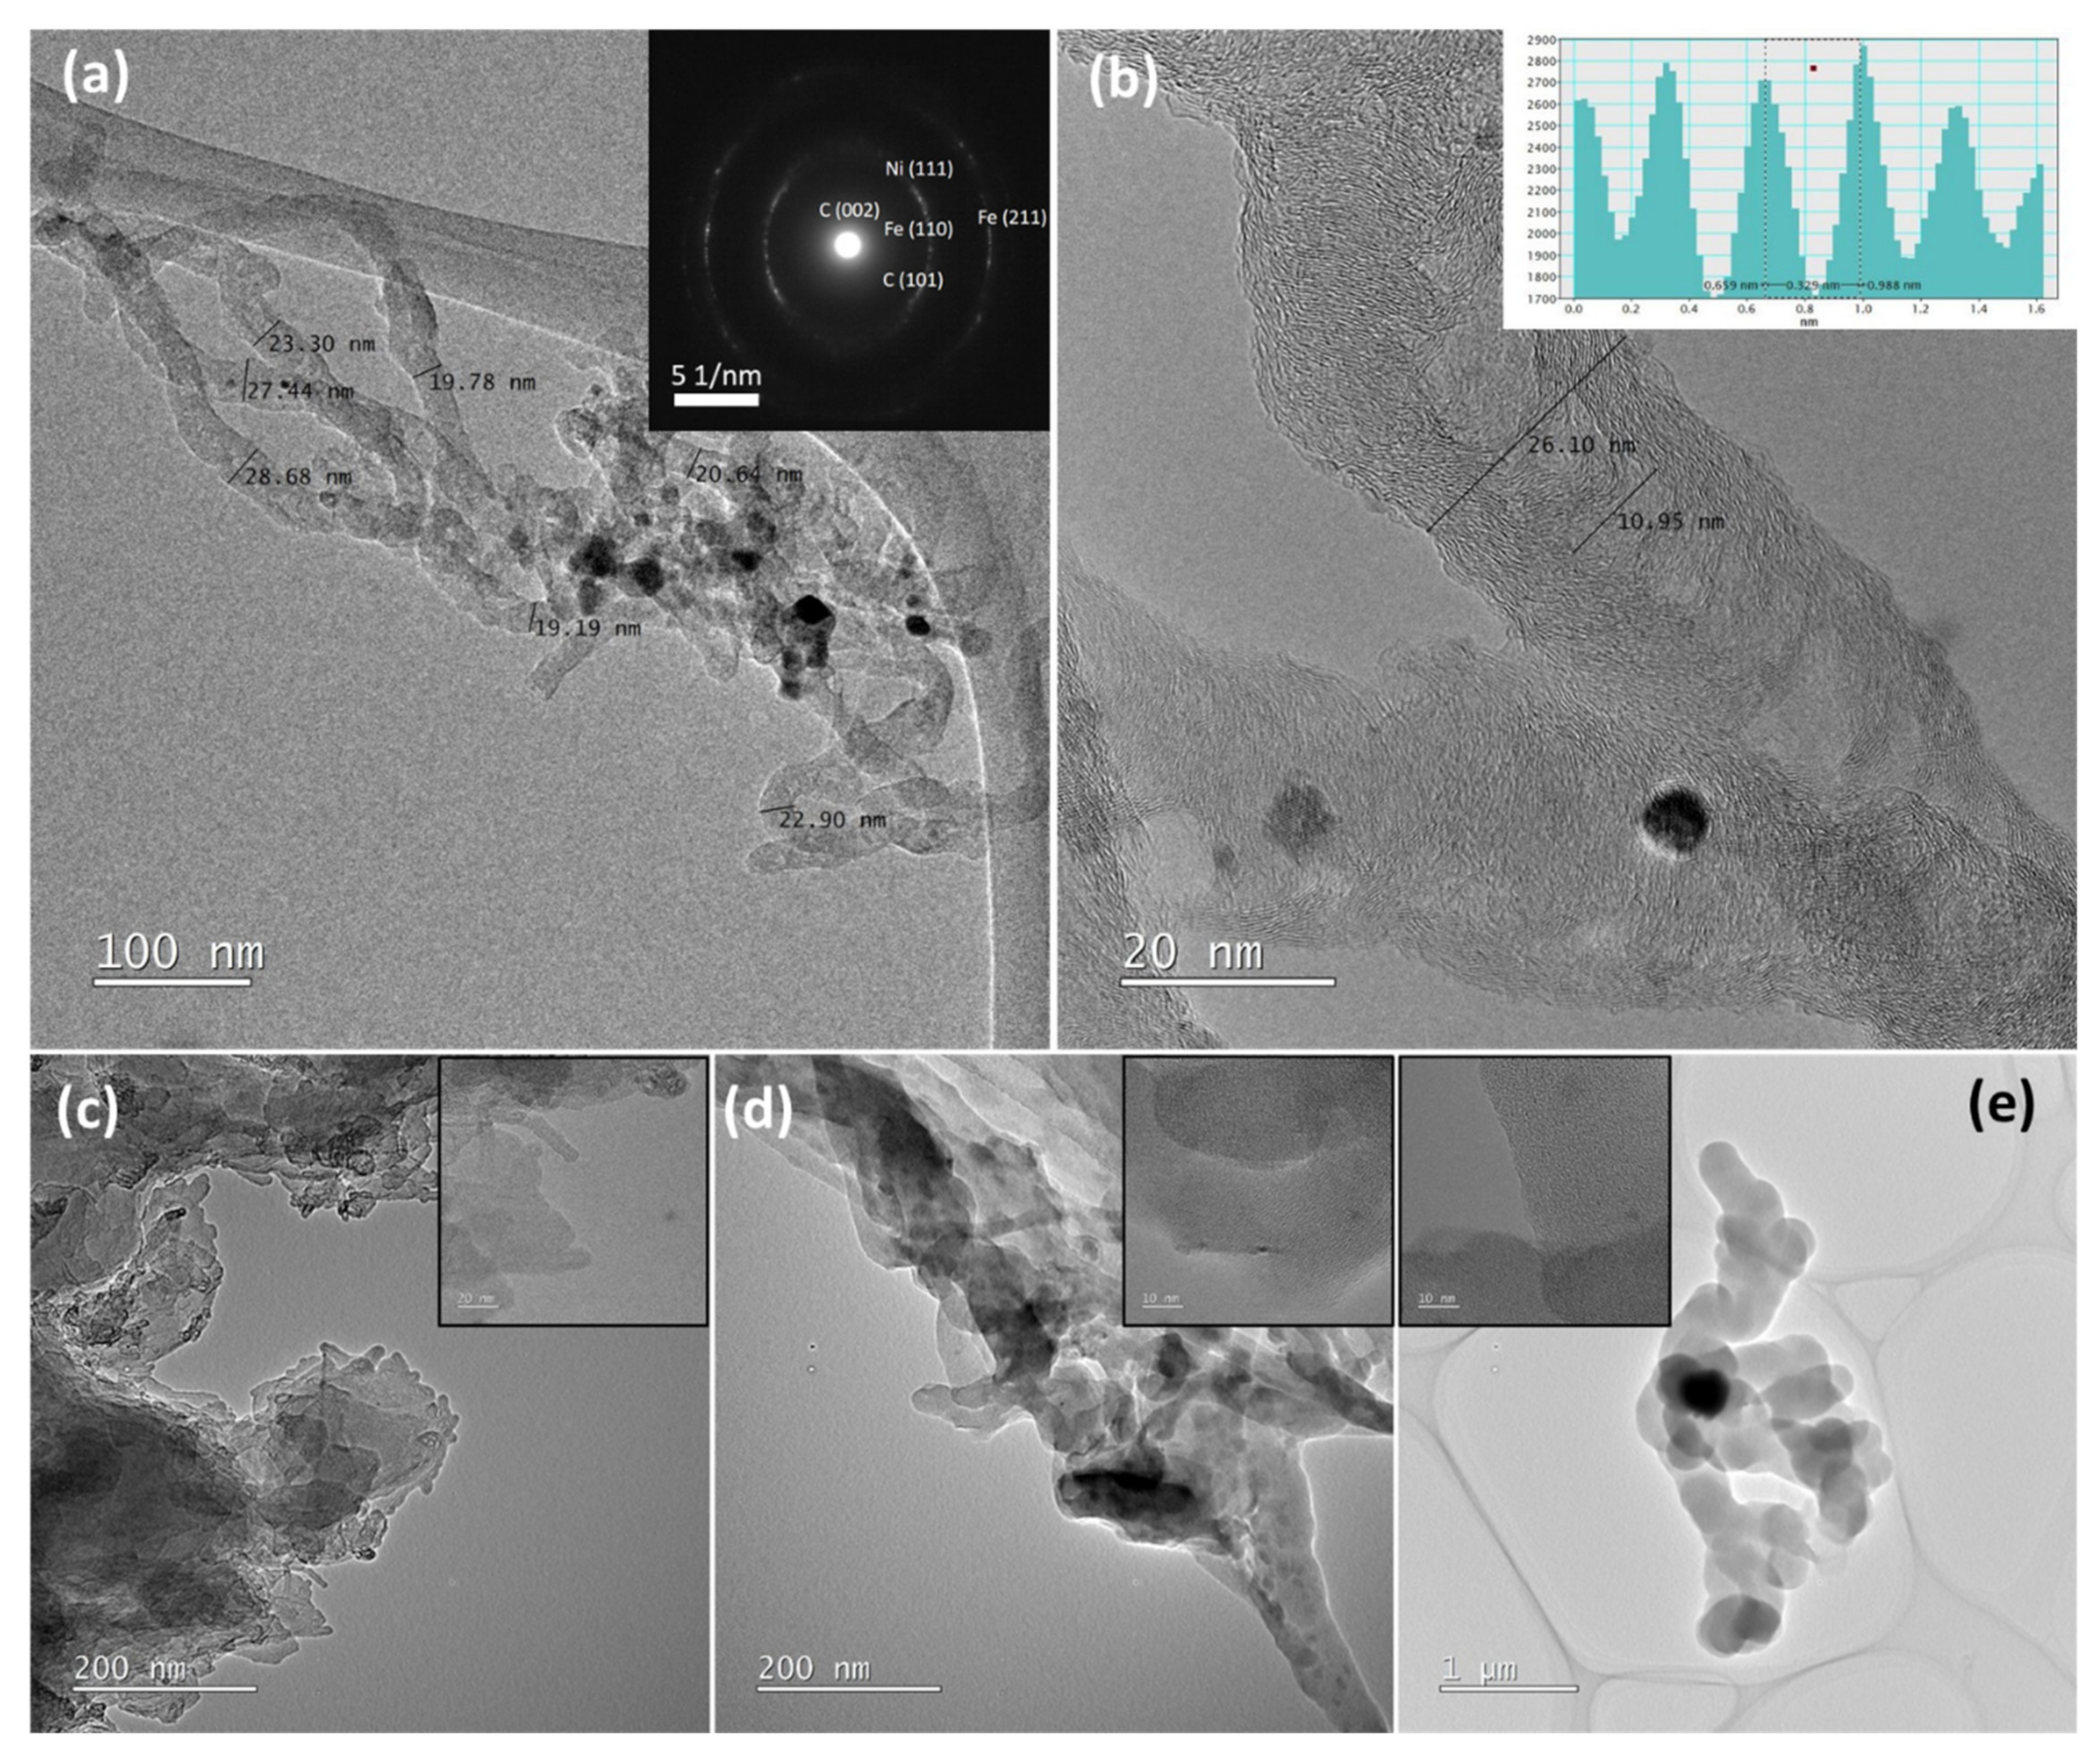
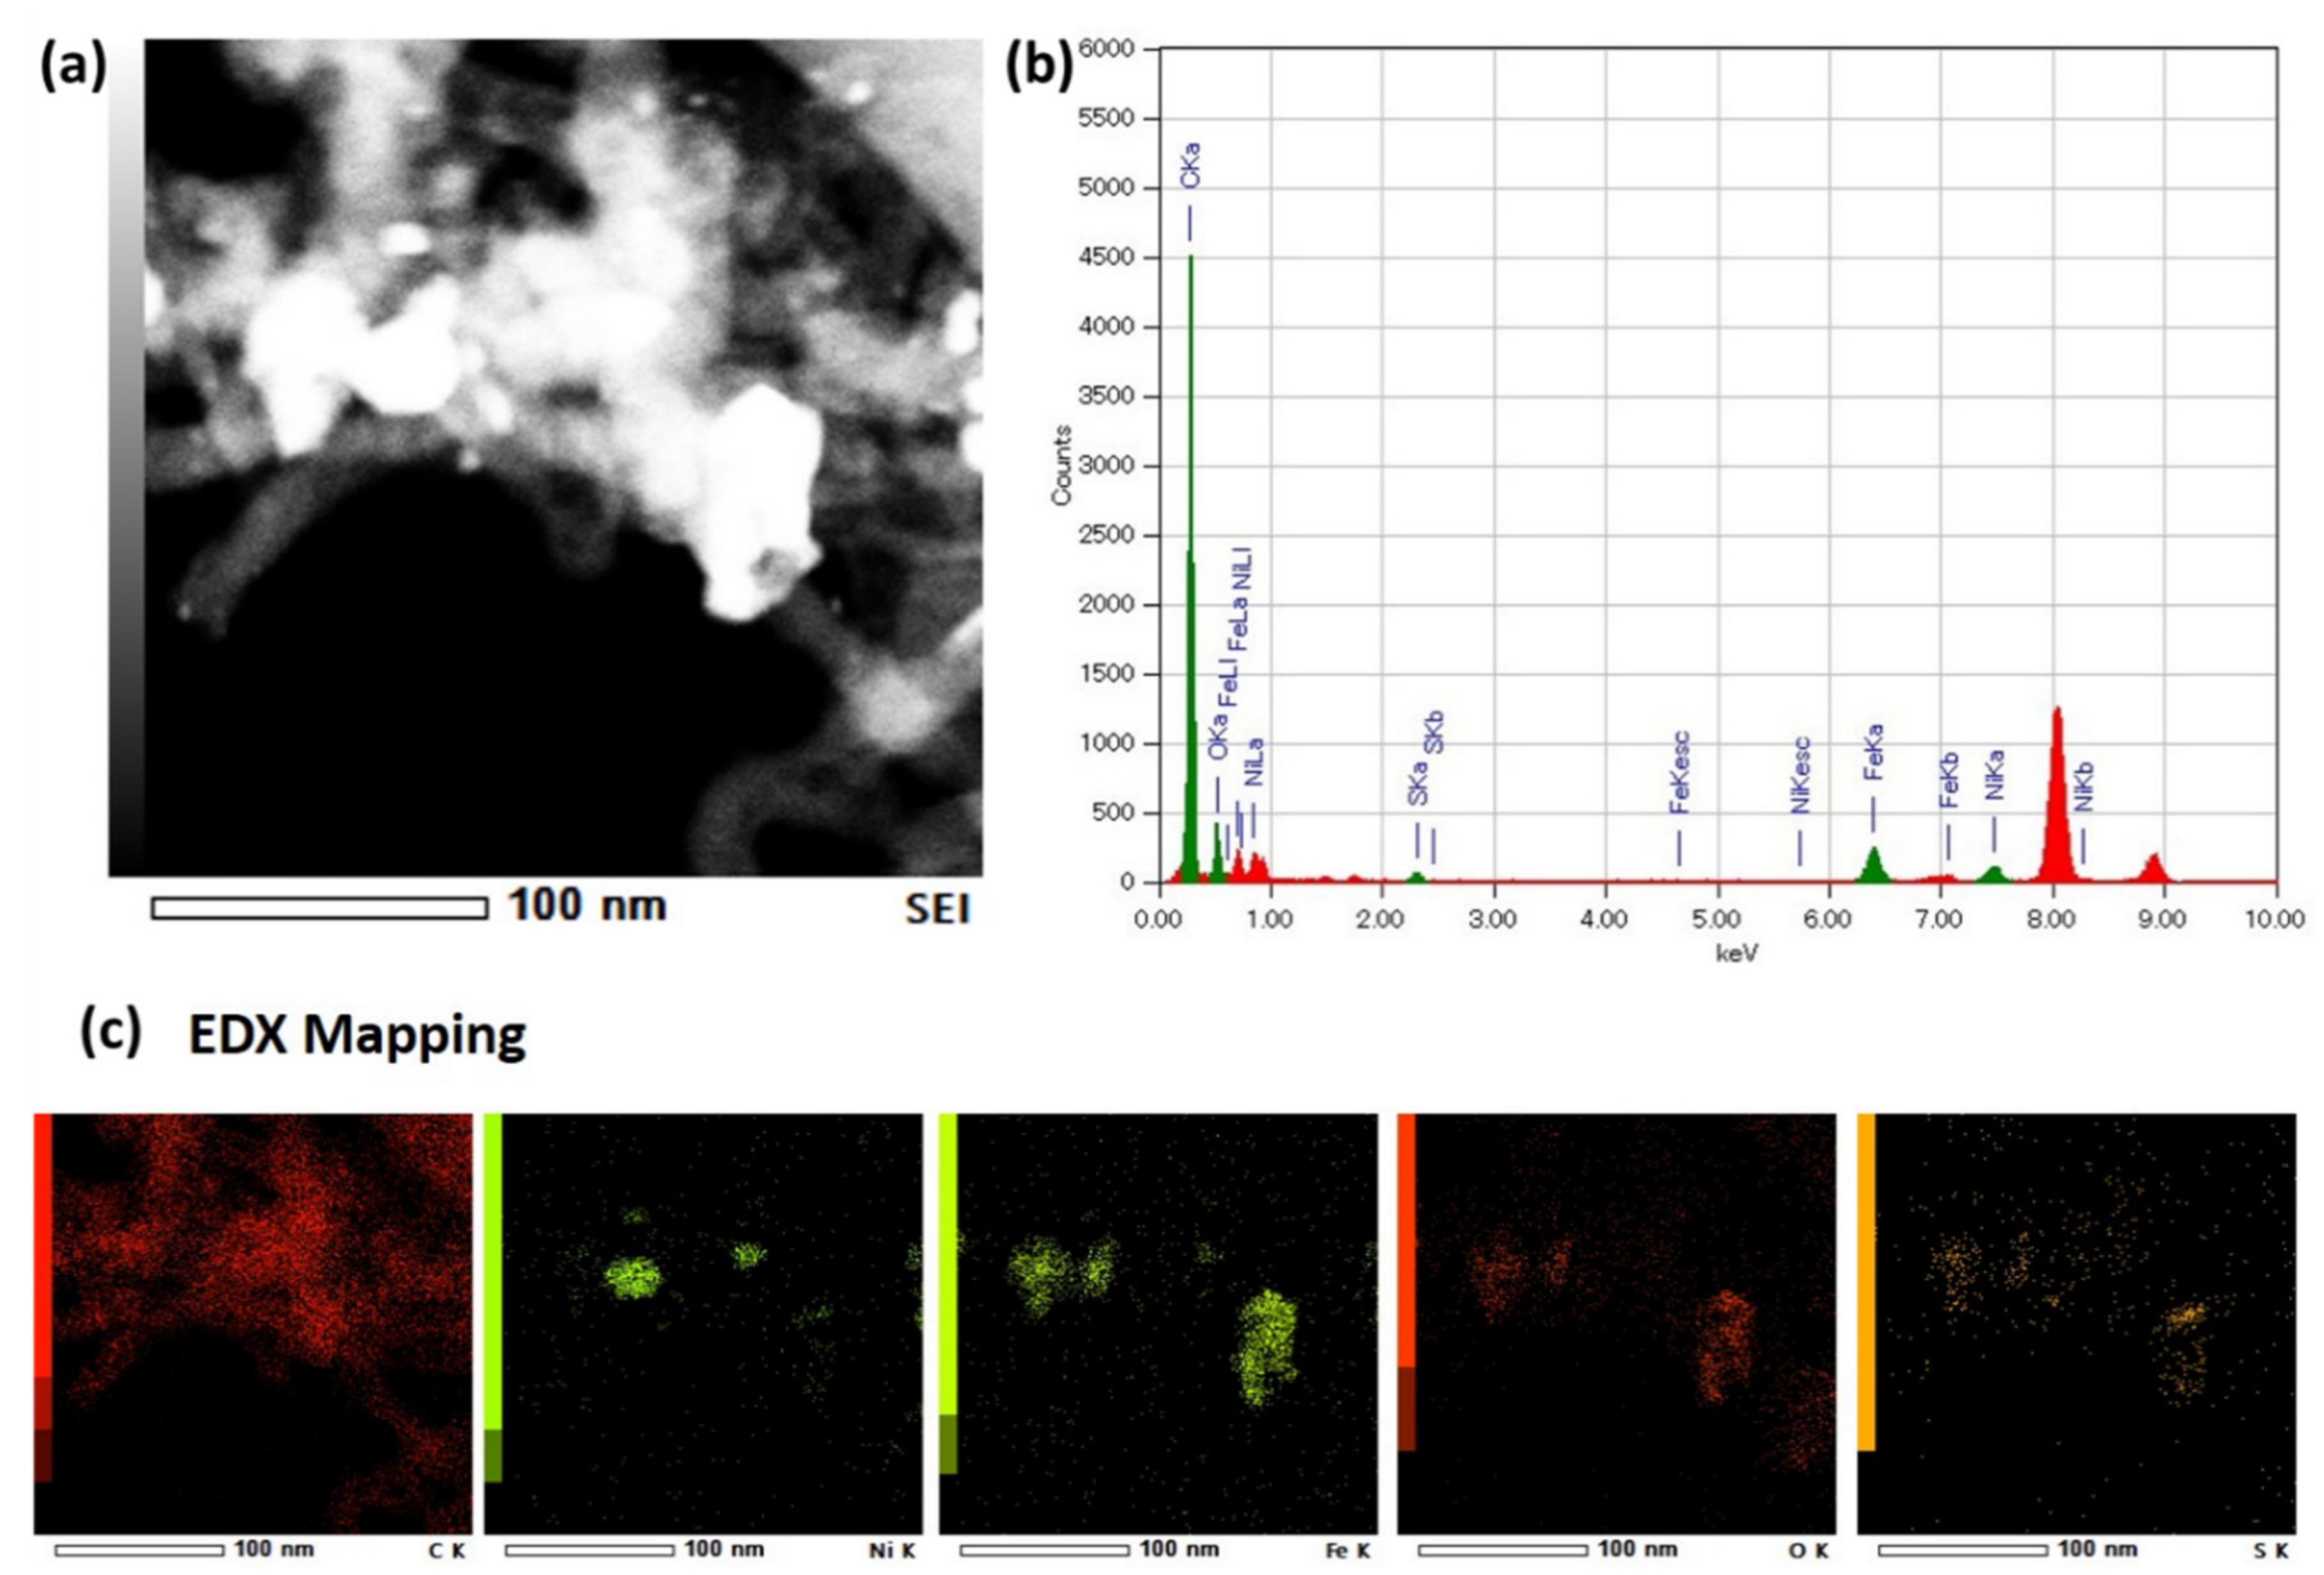
3.2. Characterization of Synthesised CNTs
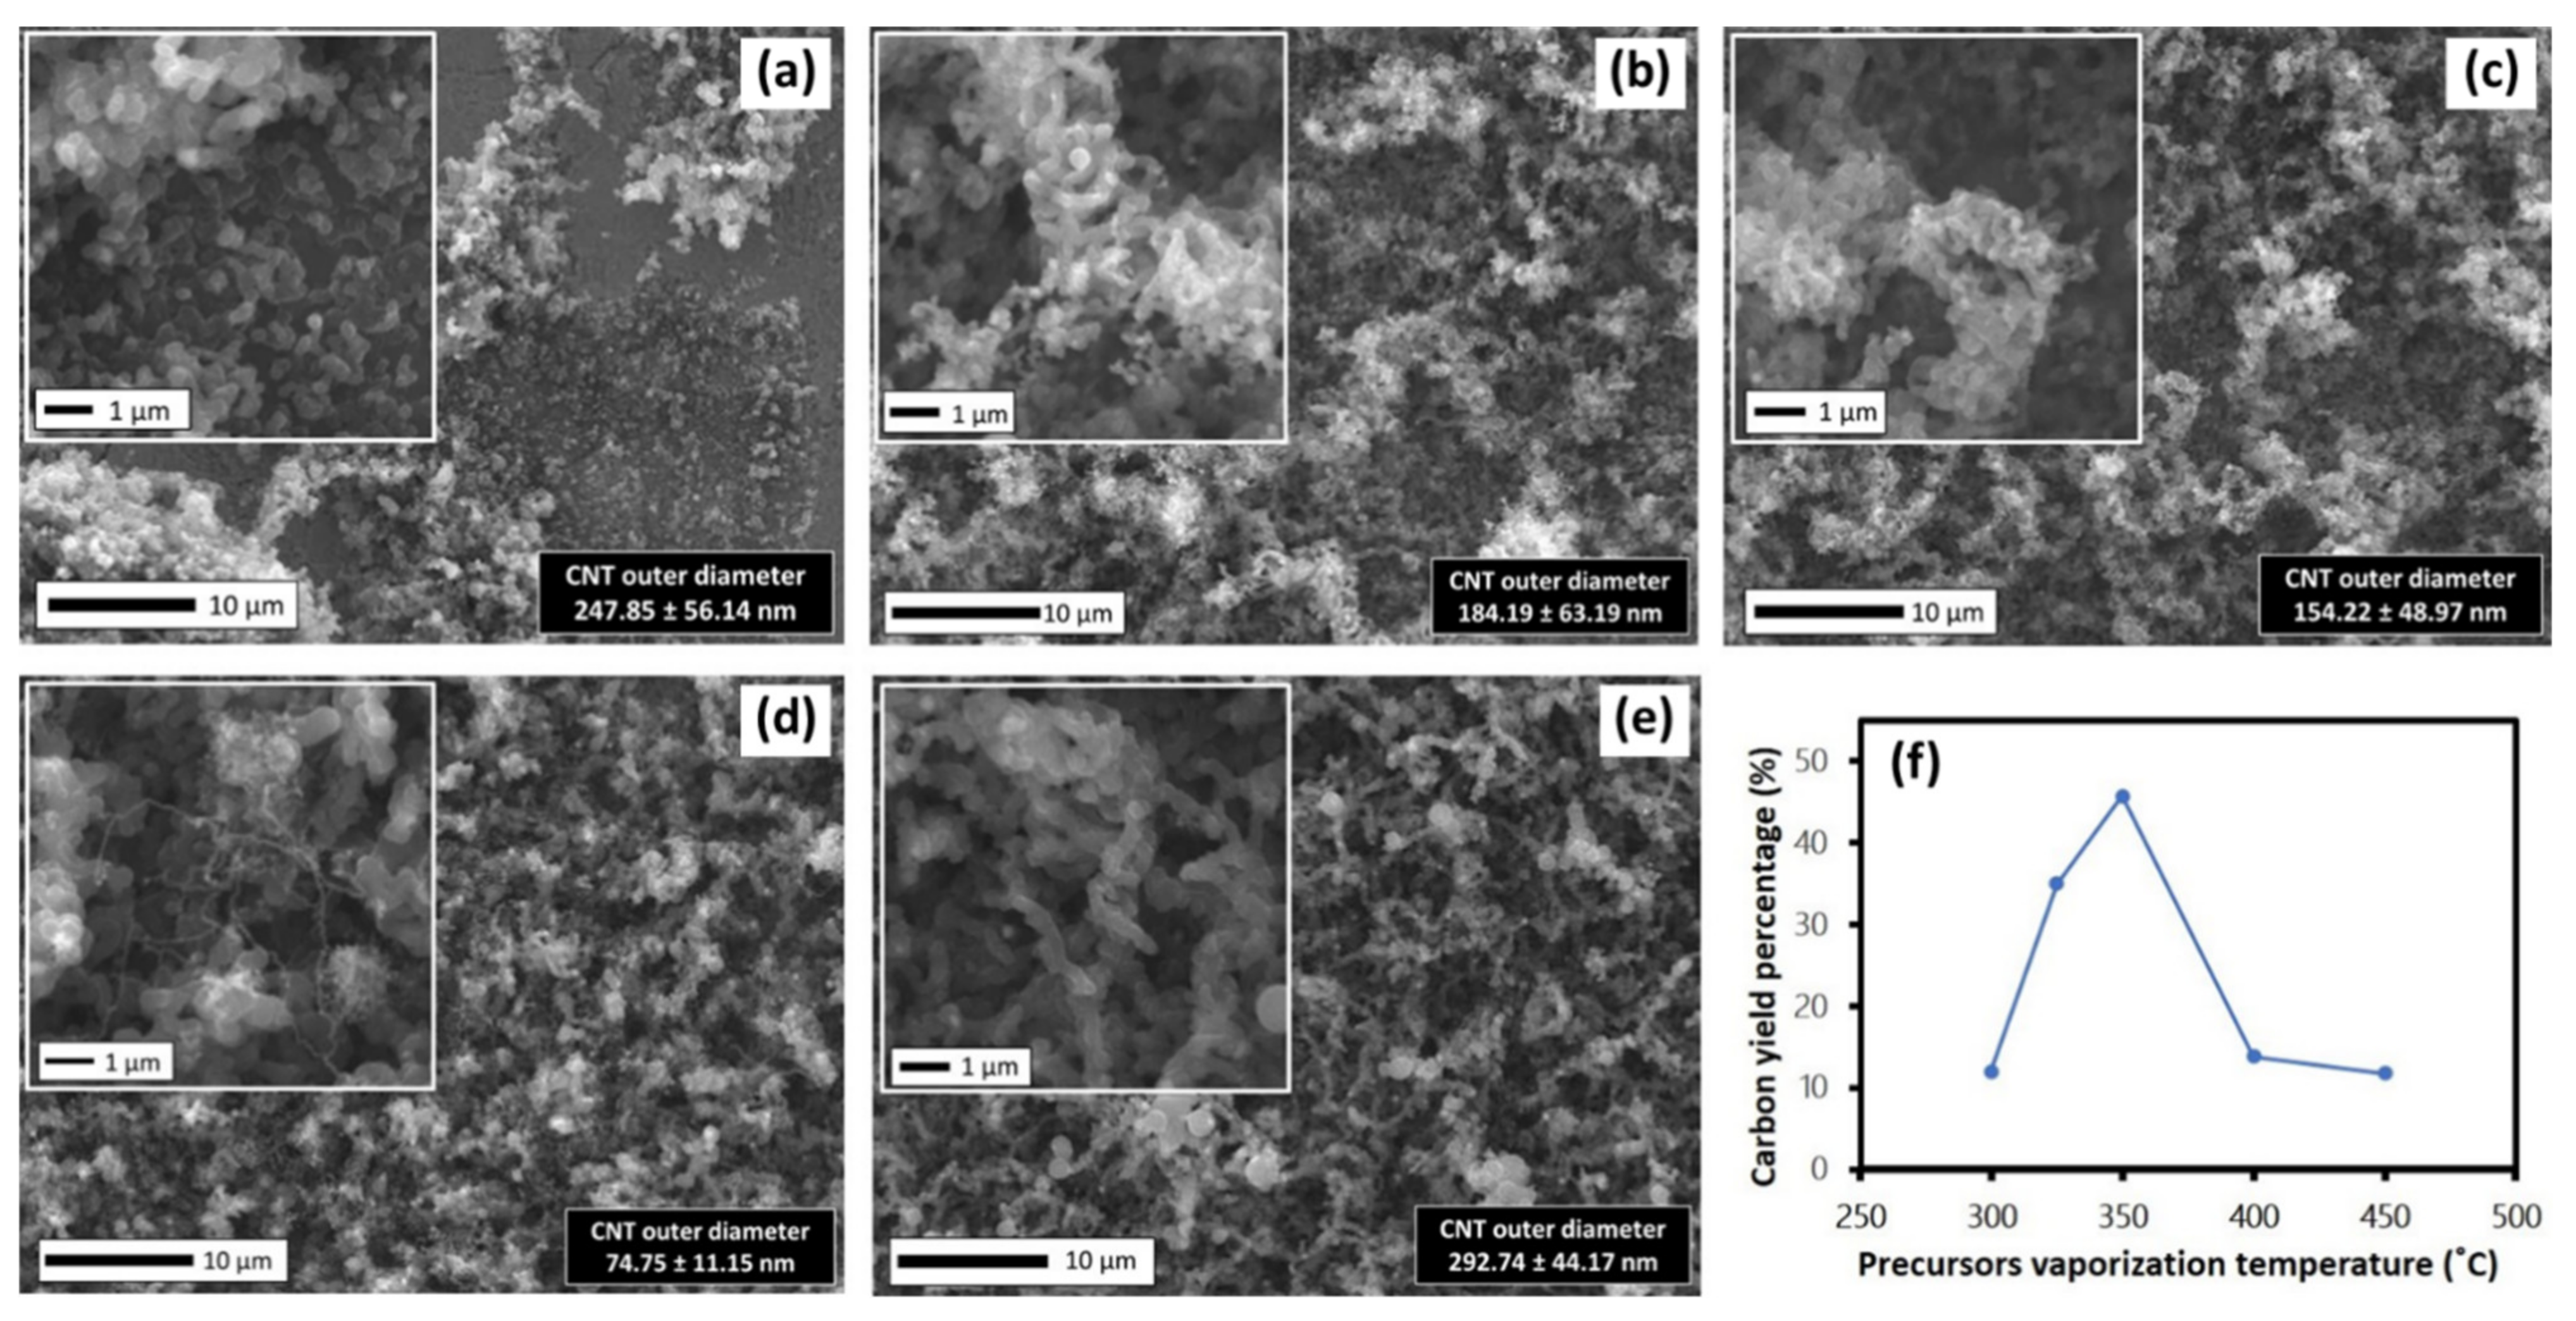
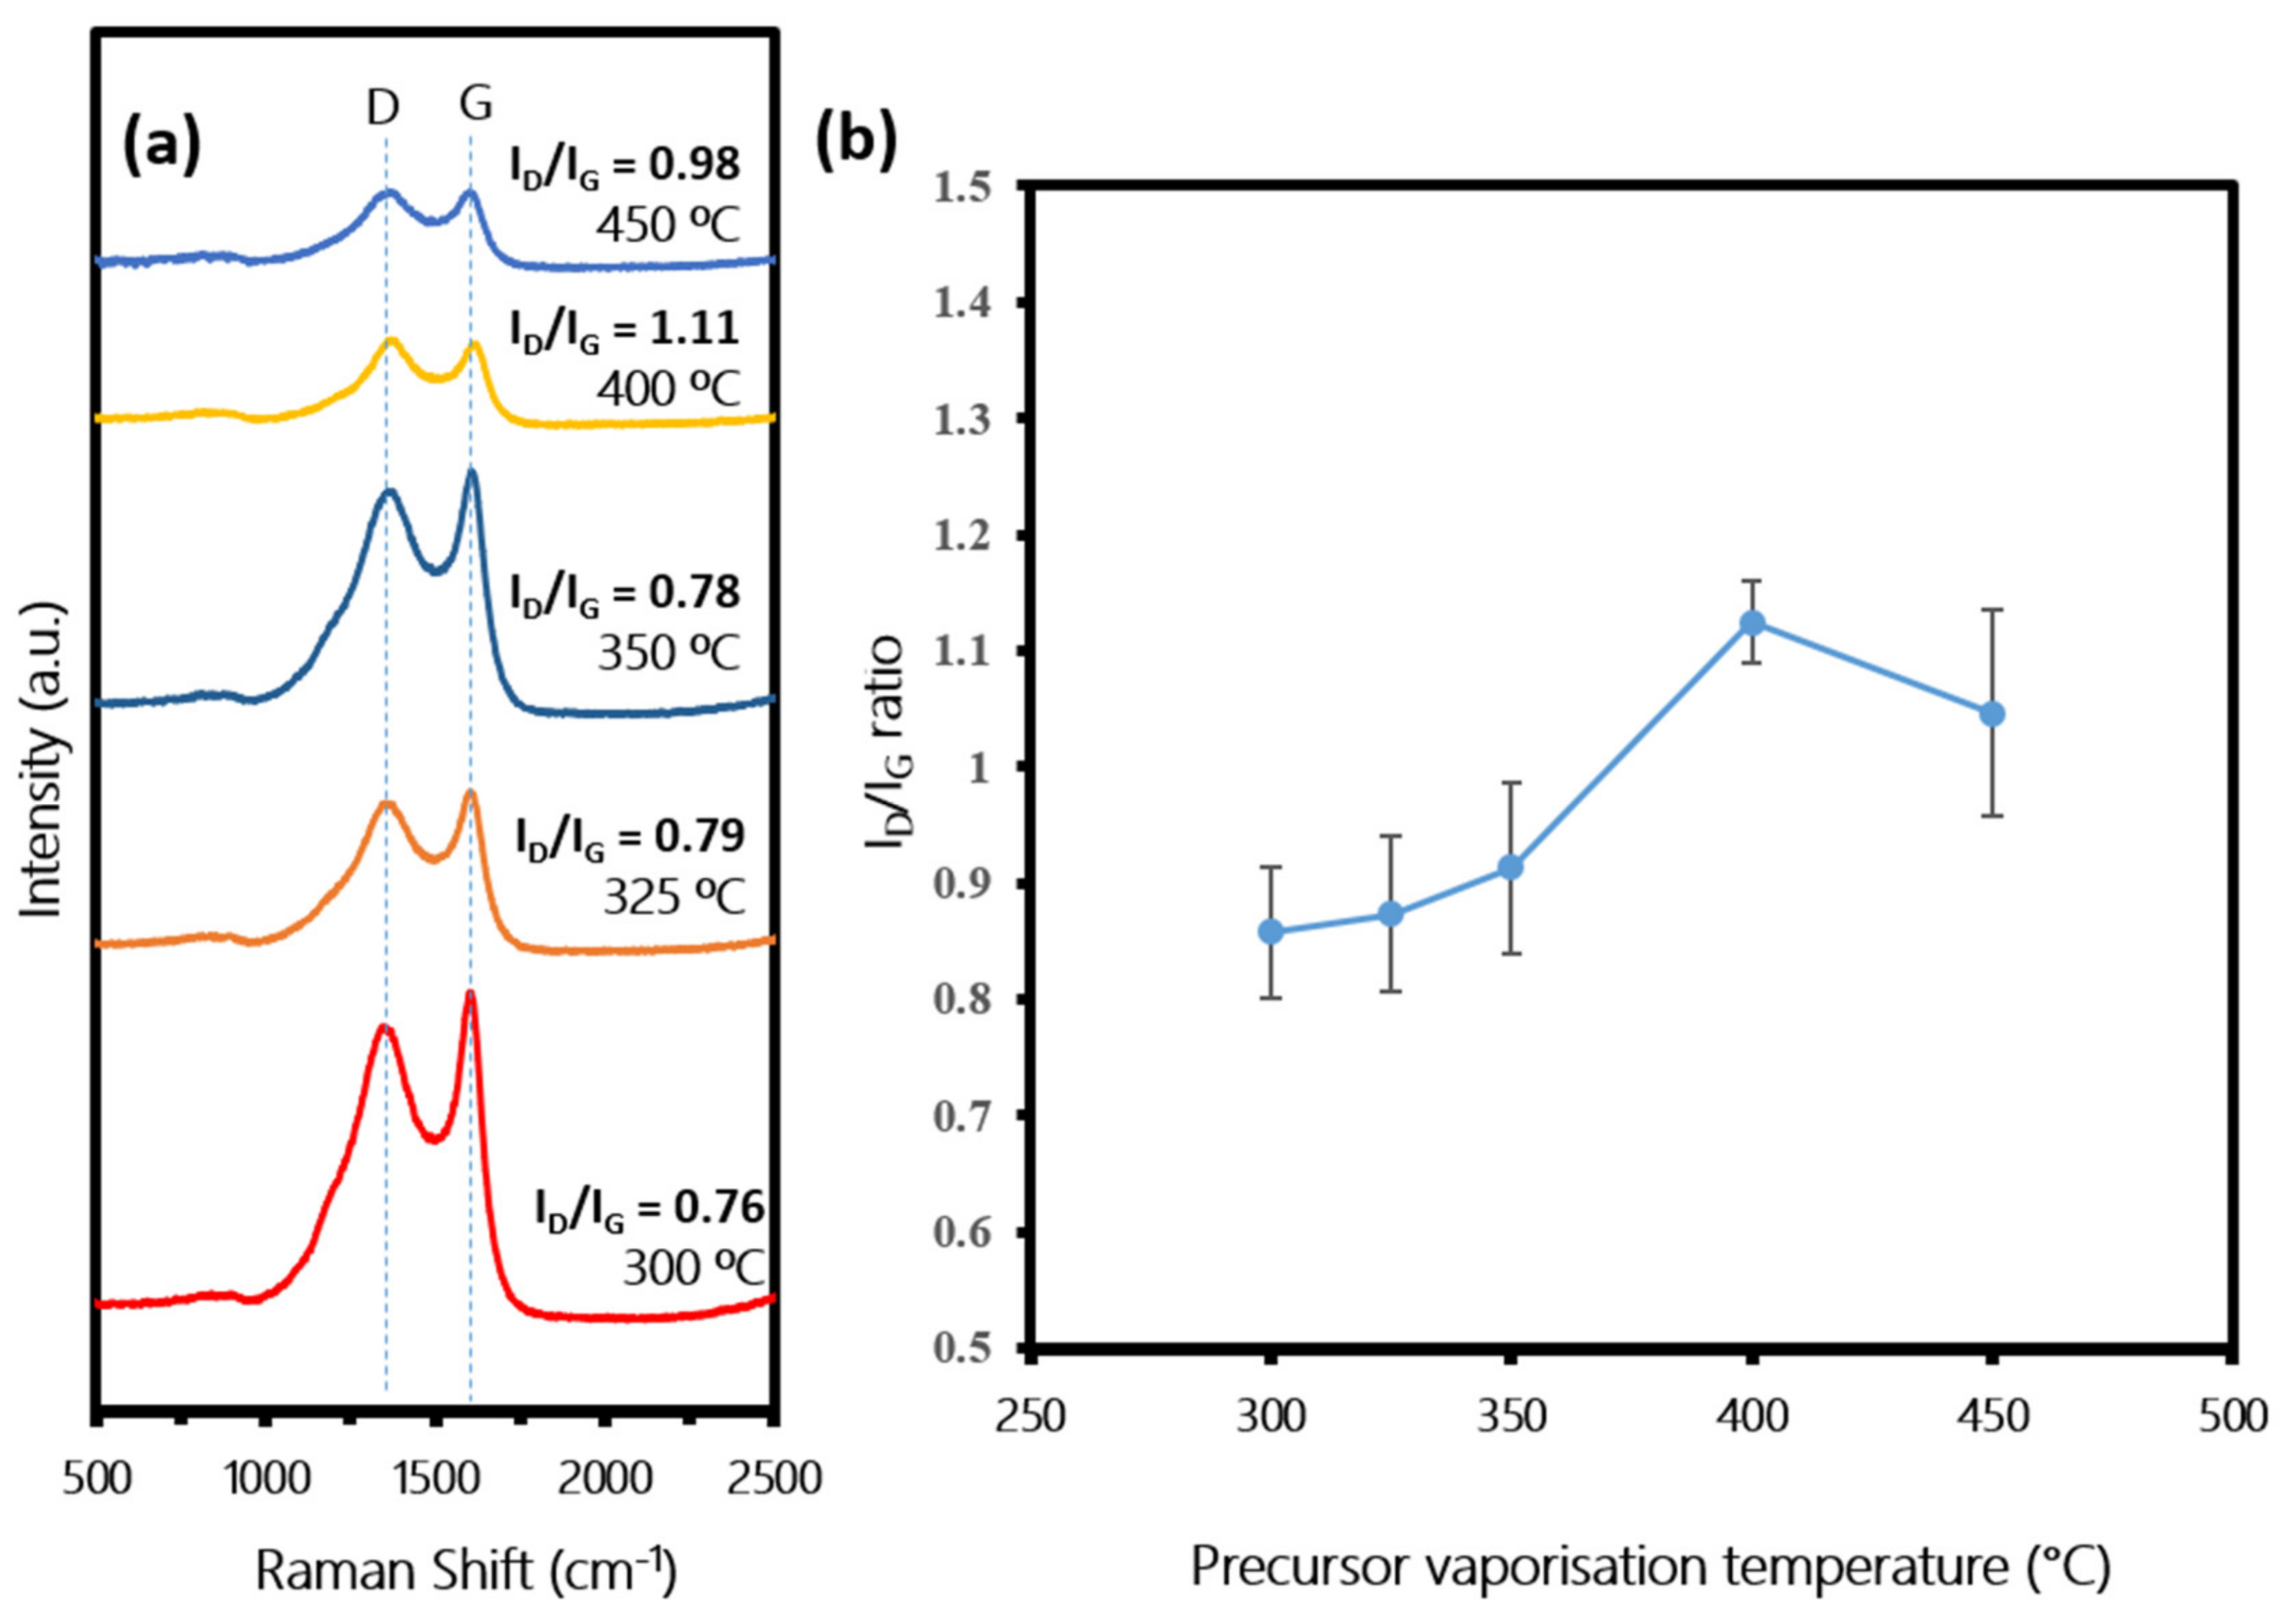
3.3. Effect of Precursor Vaporization Temperature on CNTs Growth
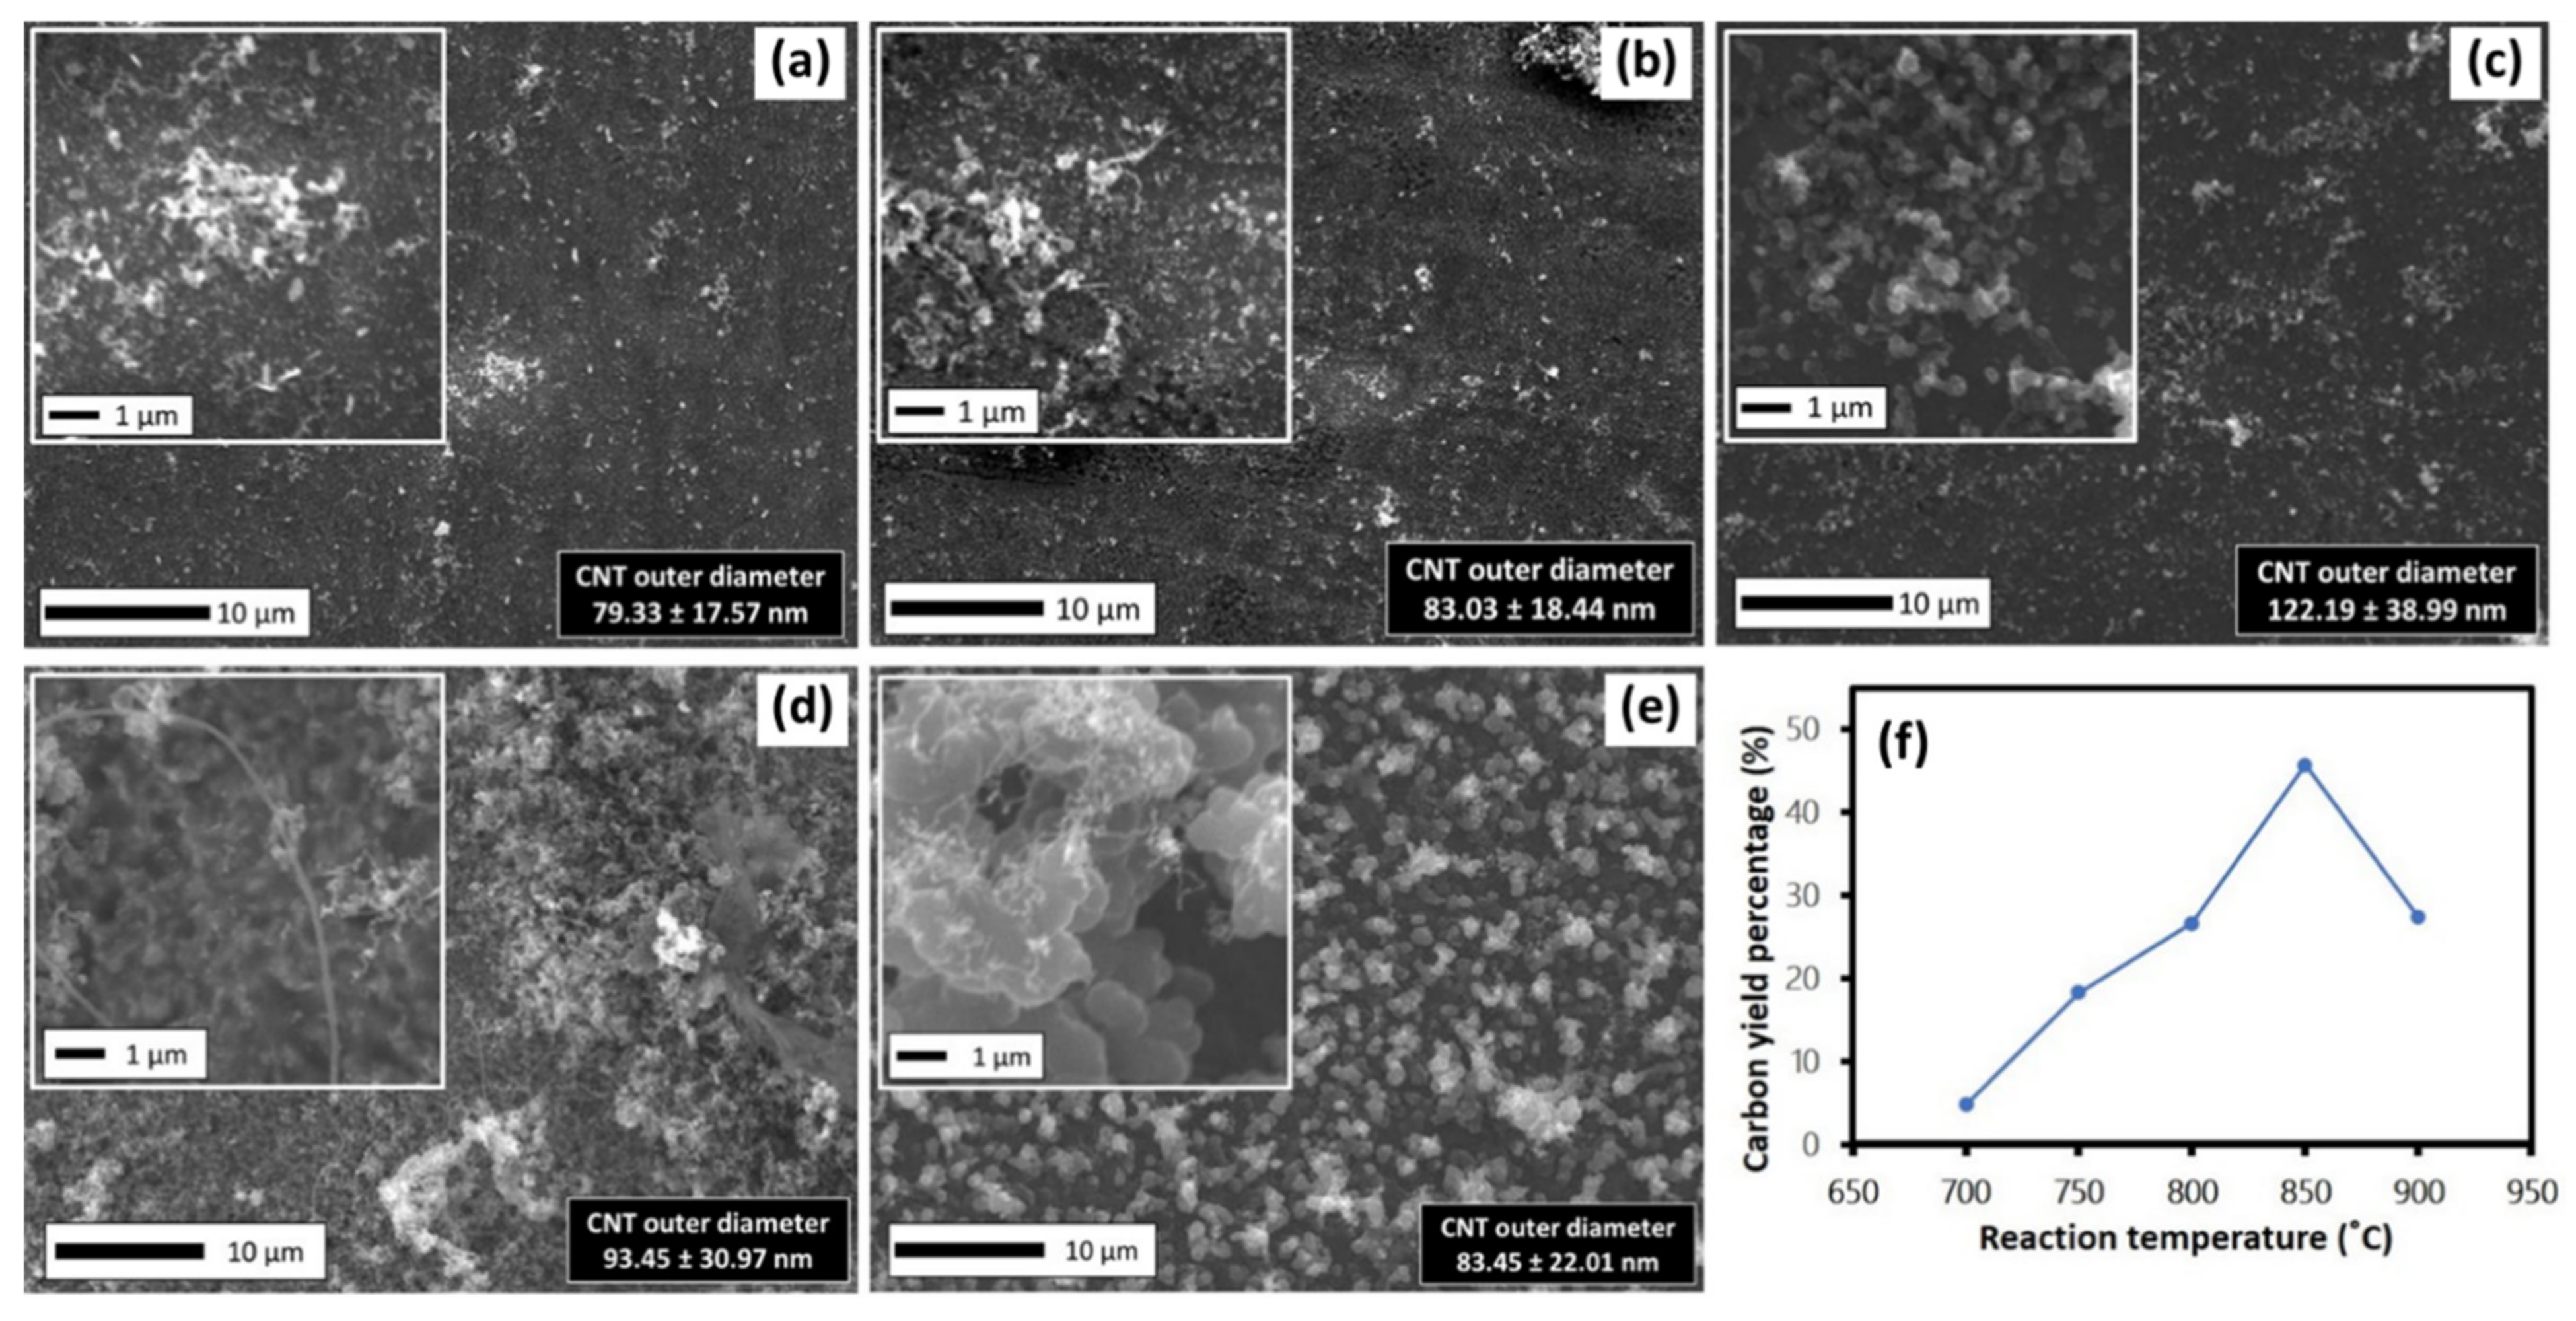
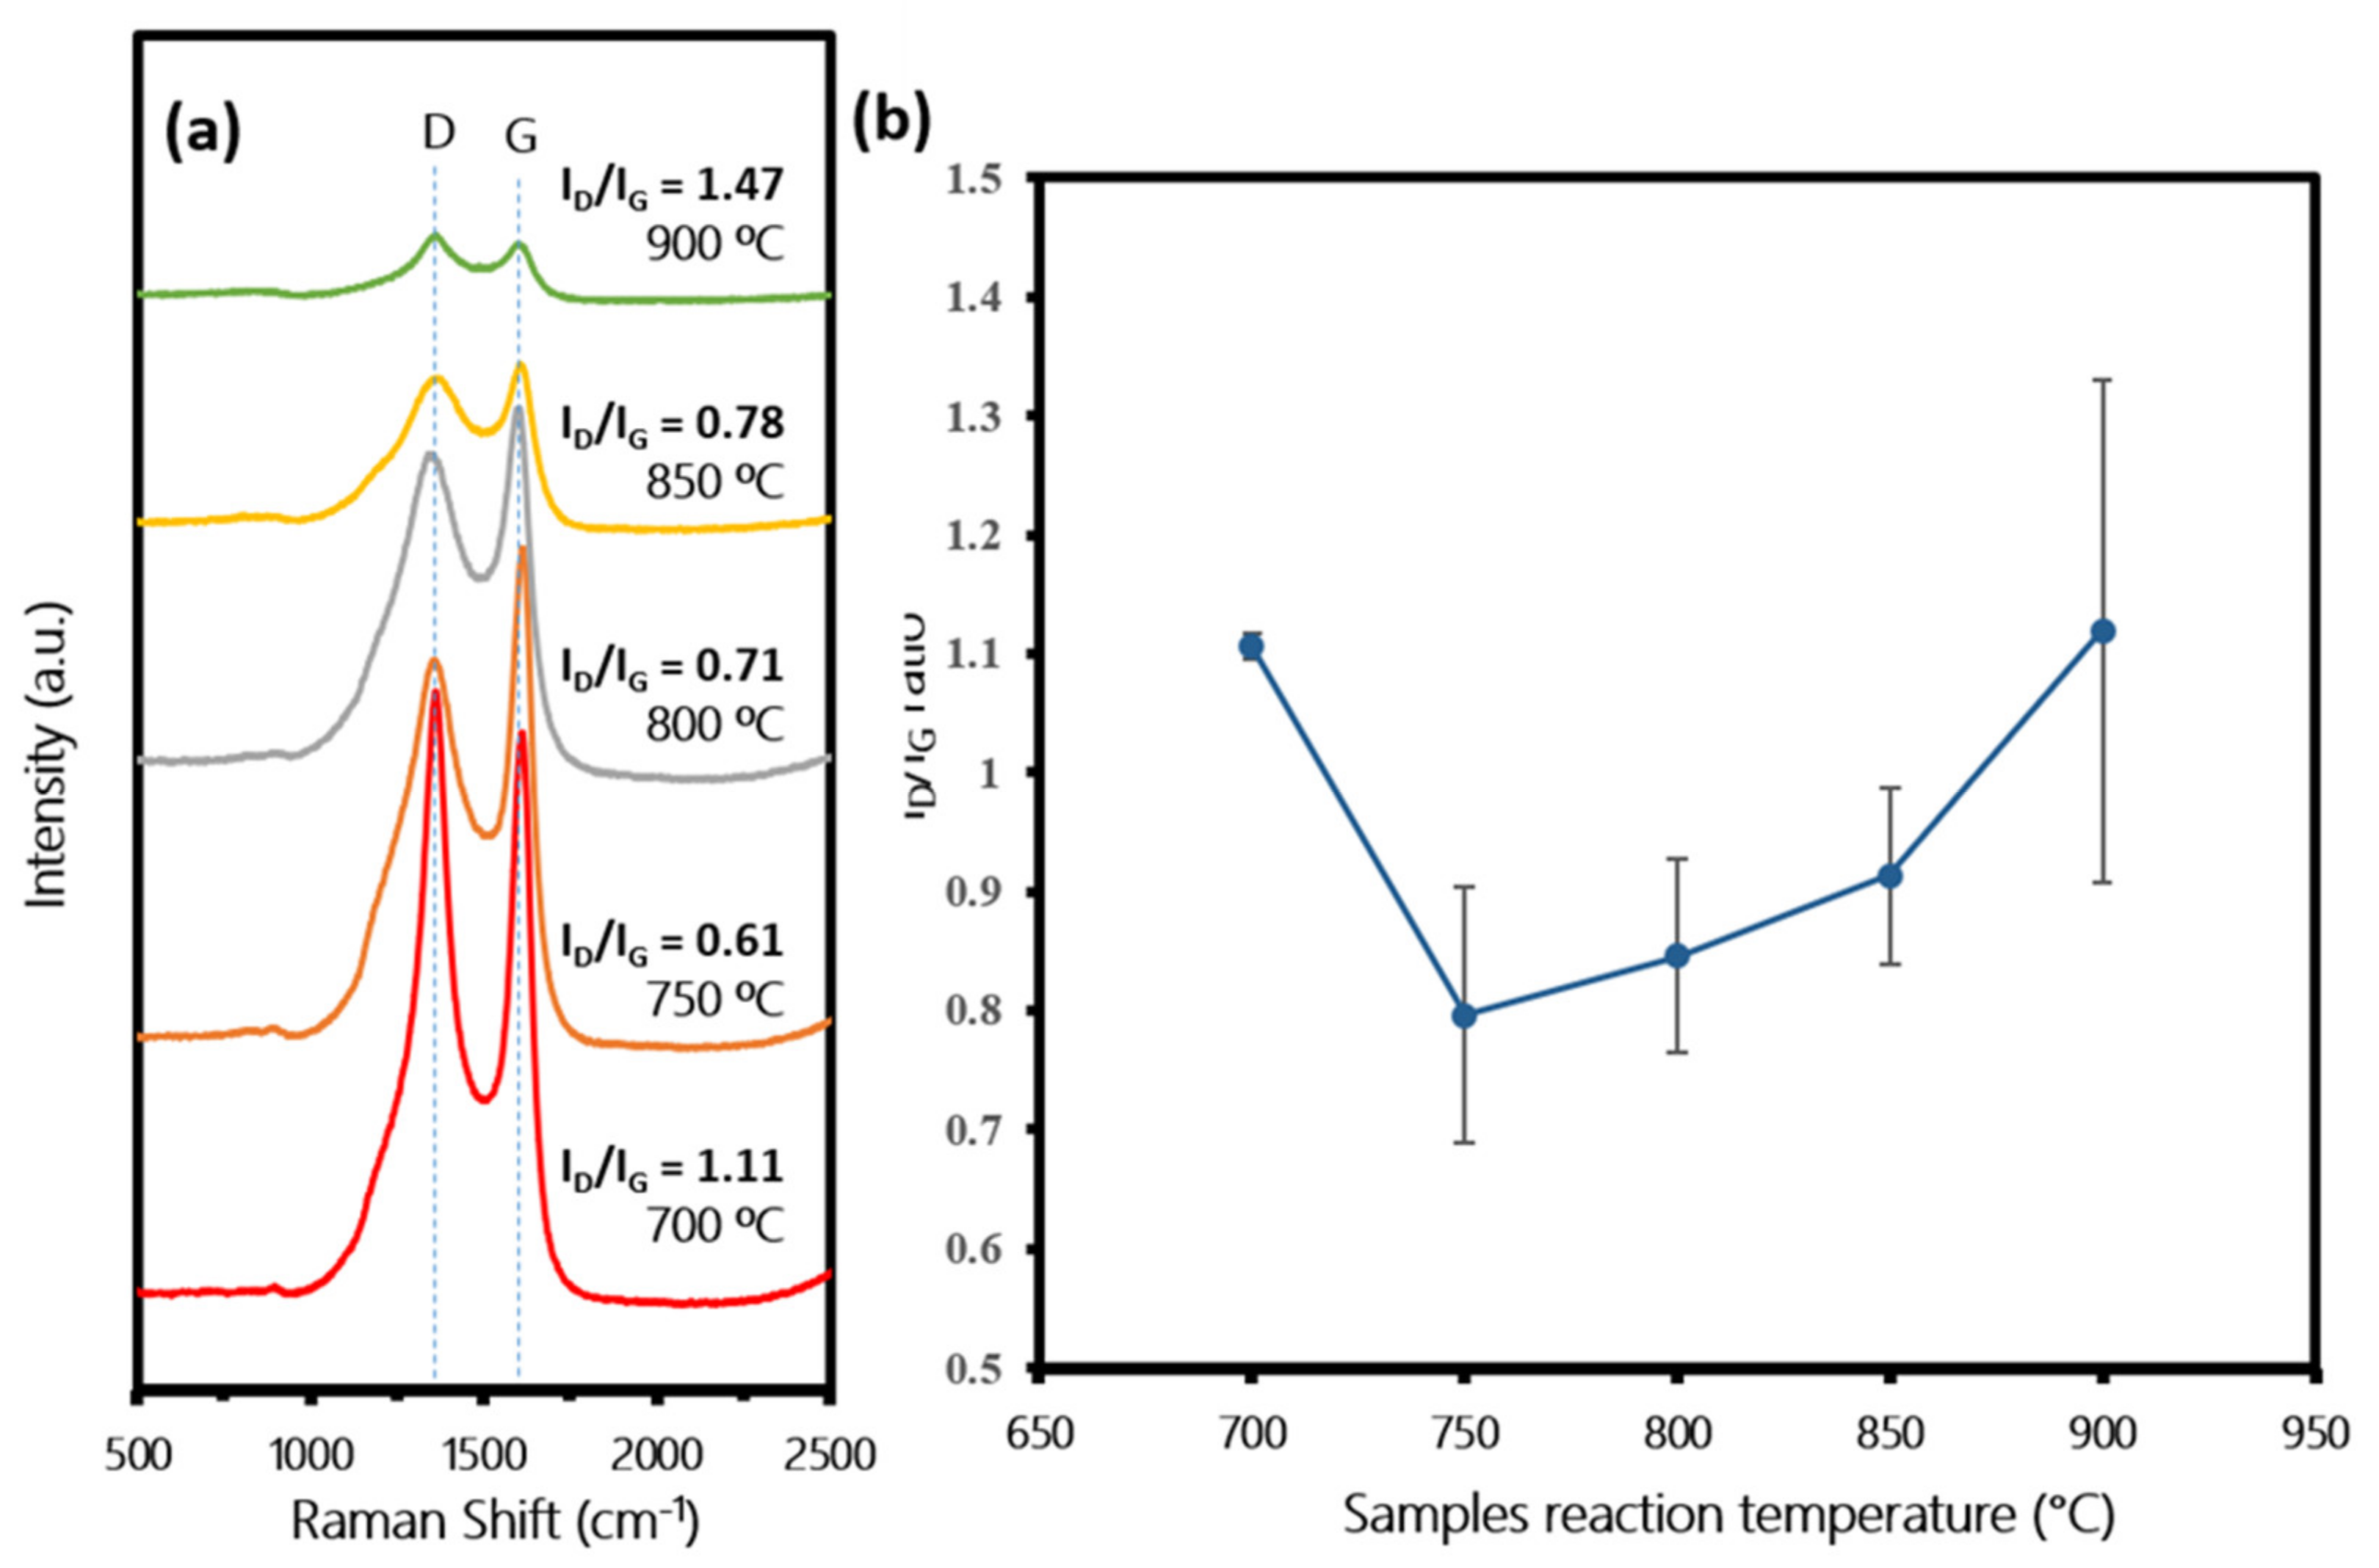
3.4. Effect of Sample Reaction Temperature on CNTs Growth
4. Conclusions
Author Contributions
Funding
Institutional Review Board Statement
Informed Consent Statement
Data Availability Statement
Acknowledgments
Conflicts of Interest
References
- Purnomo, C.W.; Kurniawan, W.; Aziz, M. Technological review on thermochemical conversion of COVID-19-related medical wastes. Resour. Conserv. Recycl. 2021, 167, 105429. [Google Scholar] [CrossRef] [PubMed]
- Shah, A.A.; Hasan, F.; Shah, Z.; Kanwal, N.; Zeb, S. Biodegradation of natural and synthetic rubbers: A review. Int. Biodeterior. Biodegradation 2013, 83, 145–157. [Google Scholar] [CrossRef]
- Shu, X.; Huang, B. Recycling of waste tire rubber in asphalt and portland cement concrete: An overview. Constr. Build. Mater. 2014, 67, 217–224. [Google Scholar] [CrossRef]
- Jędruchniewicz, K.; Ok, Y.S.; Oleszczuk, P. COVID-19 discarded disposable gloves as a source and a vector of pollutants in the environment. J. Hazard. Mater. 2021, 417, 125938. [Google Scholar] [CrossRef] [PubMed]
- Nuzaimah, M.; Sapuan, S.M.; Nadlene, R.; Jawaid, M. Recycling of waste rubber as fillers: A review. IOP Conf. Ser. Mater. Sci. Eng. 2018, 368, 012016. [Google Scholar] [CrossRef]
- Acosta, R.; Tavera, C.; Gauthier-Maradei, P.; Nabarlatz, D.A. Production of Oil and Char by Intermediate Pyrolysis of Scrap Tyres: Influence on Yield and Product Characteristics. Int. J. Chem. React. Eng. 2015, 13, 189–200. [Google Scholar] [CrossRef]
- Hita, I.; Arabiourrutia, M.; Olazar, M.; Bilbao, J.; Arandes, J.M.; Castaño, P. Opportunities and barriers for producing high quality fuels from the pyrolysis of scrap tires. Renew. Sustain. Energy Rev. 2016, 56, 745–759. [Google Scholar] [CrossRef]
- Ongen, A.; Ozcan, H.K.; Ozbas, E.E.; Pangaliyev, Y. Gasification of waste tires in a circulating fixed-bed reactor within the scope of waste to energy. Clean Technol. Environ. Policy 2019, 21, 1281–1291. [Google Scholar] [CrossRef]
- Putra, A.E.E.; Amaliyah, N.; Syam, M.; Rahim, I. Effect of Residence Time and Chemical Activation on Pyrolysis Product from Tires Waste. J. Jpn. Inst. Energy 2019, 98, 279–284. [Google Scholar] [CrossRef]
- Seidelt, S.; Müller-Hagedorn, M.; Bockhorn, H. Description of tire pyrolysis by thermal degradation behaviour of main components. J. Anal. Appl. Pyrolysis 2006, 75, 11–18. [Google Scholar] [CrossRef]
- Chen, F. Studies on the thermal degradation of cis-1,4-polyisoprene. Fuel 2002, 81, 2071–2077. [Google Scholar] [CrossRef]
- Hazan, M.A.; Mamat, M.S.; Ismail, I.; Hussein, M.Z.; Yaakob, Y. Fractionation of waste nitrile butadiene rubber (NBR) latex sludge. Nanosci. Nanotechnol. Nano-SciTech 2019, 2151, 020012. [Google Scholar] [CrossRef]
- Januszewicz, K.; Kazimierski, P.; Suchocki, T.; Kardaś, D.; Lewandowski, W.; Klugmann-Radziemska, E.; Łuczak, J. Waste Rubber Pyrolysis: Product Yields and Limonene Concentration. Materials 2020, 13, 4435. [Google Scholar] [CrossRef] [PubMed]
- Campuzano, F.; Jameel, A.G.A.; Zhang, W.; Emwas, A.-H.; Agudelo, A.F.; Martínez, J.D.; Sarathy, S.M. On the distillation of waste tire pyrolysis oil: A structural characterization of the derived fractions. Fuel 2021, 290, 120041. [Google Scholar] [CrossRef]
- Rahman, S.F.A.; Mahmood, M.R.; Hashim, A.M. Growth of graphene on nickel using a natural carbon source by thermal chemical vapor deposition. Sains Malays. 2014, 43, 1205–1211. [Google Scholar]
- Sharma, S.; Kalita, G.; Hirano, R.; Shinde, S.M.; Papon, R.; Ohtani, H.; Tanemura, M. Synthesis of graphene crystals from solid waste plastic by chemical vapor deposition. Carbon 2014, 72, 66–73. [Google Scholar] [CrossRef]
- Rosmi, M.S.; Shinde, S.M.; Rahman, N.D.A.; Thangaraja, A.; Sharma, S.; Sharma, K.P.; Yaakob, Y.; Vishwakarma, R.K.; Abu Bakar, S.; Kalita, G.; et al. Synthesis of uniform monolayer graphene on re-solidified copper from waste chicken fat by low pressure chemical vapor deposition. Mater. Res. Bull. 2016, 83, 573–580. [Google Scholar] [CrossRef]
- Abdullah, H.B.; Irmawati, R.; Ismail, I.; Yusof, N.A. Utilization of waste engine oil for carbon nanotube aerogel production using floating catalyst chemical vapor deposition. J. Clean. Prod. 2020, 261, 121188. [Google Scholar] [CrossRef]
- Yang, W.; Sun, W.J.; Chu, W.; Jiang, C.F.; Wen, J. Synthesis of carbon nanotubes using scrap tyre rubber as carbon source. Chin. Chem. Lett. 2012, 23, 363–366. [Google Scholar] [CrossRef]
- Essawy, H.; Fathy, N.; Tawfik, M.; El-Sabbagh, S.; Ismail, N.; Youssef, H. Fabrication of single-walled carbon nanotubes from vulcanized scrap rubber via thermal chemical vapor deposition. RSC Adv. 2017, 7, 12938–12944. [Google Scholar] [CrossRef] [Green Version]
- Hazan, M.A.; Mamat, M.S.; Haroun, R.Z.; Kamis, S.L.; Ismail, I.; Hussein, M.Z.; Sharma, S.; Tanemura, M.; Yaakob, Y. Carbon nanostructures grown from waste latex via chemical vapor deposition. Malays. J. Microsc. 2019, 15, 1–9. [Google Scholar]
- Advincula, P.A.; Luong, D.X.; Chen, W.; Raghuraman, S.; Shahsavari, R.; Tour, J.M. Flash graphene from rubber waste. Carbon 2021, 178, 649–656. [Google Scholar] [CrossRef]
- Pandey, S.; Karakoti, M.; Surana, K.; Dhapola, P.S.; SanthiBhushan, B.; Ganguly, S.; Singh, P.K.; Abbas, A.; Srivastava, A.; Sahoo, N.G. Graphene nanosheets derived from plastic waste for the application of DSSCs and supercapacitors. Sci. Rep. 2021, 11, 1–17. [Google Scholar] [CrossRef]
- Lekawa-Raus, A.; Patmore, J.; Kurzepa, L.; Bulmer, J.; Koziol, K. Electrical Properties of Carbon Nanotube Based Fibers and Their Future Use in Electrical Wiring. Adv. Funct. Mater. 2014, 24, 3661–3682. [Google Scholar] [CrossRef]
- Chan, K.F.; Zaid, M.H.M.; Liza, S.; Mamat, S.; Matori, K.A.; Endot, N.A.; Tanemura, M.; Yaakob, Y. Tuning the optical bandgap of multi-walled carbon nanotube-modified zinc silicate glass-ceramic composites. Ceram. Int. 2021, 47, 20108–20116. [Google Scholar] [CrossRef]
- Azman, N.F.I.; Zuhairi, S.A.; Ratnam, C.T.; Yaakob, Y.; Mamat, S. Incorporation of Multiwalled Carbon Nanotubes and Graphene Nanoplatelets on the Morphology and Properties of Polyethylene Terephthalate Nanocomposites. J. Nanomater. 2021, 2021, 1–9. [Google Scholar] [CrossRef]
- Paradise, M.; Goswami, T. Carbon nanotubes—Production and industrial applications. Mater. Des. 2007, 28, 1477–1489. [Google Scholar] [CrossRef]
- Kwon, S.-J.; Seo, H.-K.; Ahn, S.; Lee, T.-W. Value-Added Recycling of Inexpensive Carbon Sources to Graphene and Carbon Nanotubes. Adv. Sustain. Syst. 2019, 3, 1800016. [Google Scholar] [CrossRef]
- Lu, H.-B.; Boulos, R.A.; Chan, B.C.Y.; Gibson, C.; Wang, X.; Raston, C.L.; Chua, H.T. Carbon nanofibres from fructose using a light-driven high-temperature spinning disc processor. Chem. Commun. 2014, 50, 1478–1480. [Google Scholar] [CrossRef] [Green Version]
- Shudin, N.H.; Mukri, M.; Azizir, R.; Aziz, M.; Othman, M.H.D.; Tanemura, M.; Yusop, M.Z.M. The role of solid, liquid and gaseous hydrocarbon precursors on chemical vapor deposition grown carbon nanomaterials’ growth temperature. Synth. Met. 2021, 274, 116735. [Google Scholar] [CrossRef]
- Hazan, M.A.; Mohamad, S.; Hamid, M.A.; Liza, S.; Mamat, S.; Chan, K.F.; Yaakob, Y. Effect of Reaction Temperature on the Growth of Carbon Nanotubes from Waste Natural Rubber Glove. Pertanika J. Sci. Technol. 2020, 28, 217–230. [Google Scholar] [CrossRef]
- Ni, L.; Kuroda, K.; Zhou, L.-P.; Ohta, K.; Matsuishi, K.; Nakamura, J. Decomposition of metal carbides as an elementary step of carbon nanotube synthesis. Carbon 2009, 47, 3054–3062. [Google Scholar] [CrossRef]
- Alonso-Nuñez, G.; Valenzuela-Muñiz, A.M.; Paraguay-Delgado, F.; Aguilar, A.; Verde, Y. New organometallic precursor catalysts applied to MWCNT synthesis by spray-pirolysis. Opt. Mater. 2006, 29, 134–139. [Google Scholar] [CrossRef]
- Mohlala, M.S.; Liu, X.-Y.; Witcomb, M.J.; Coville, N.J. Carbon nanotube synthesis using ferrocene and ferrocenyl sulfide. The effect of sulfur. Appl. Organomet. Chem. 2007, 21, 275–280. [Google Scholar] [CrossRef]
- Hall, W.J.; Zakaria, N.; Williams, P.T. Pyrolysis of latex gloves in the presence of Y-zeolite. Waste Manag. 2009, 29, 797–803. [Google Scholar] [CrossRef] [Green Version]
- Berrueco, C.; Esperanza, E.; Mastral, F.; Ceamanos, J.; García-Bacaicoa, P. Pyrolysis of waste tyres in an atmospheric static-bed batch reactor: Analysis of the gases obtained. J. Anal. Appl. Pyrolysis 2005, 74, 245–253. [Google Scholar] [CrossRef]
- Zhang, Y.; Williams, P.T. Carbon nanotubes and hydrogen production from the pyrolysis catalysis or catalytic-steam reforming of waste tyres. J. Anal. Appl. Pyrolysis 2016, 122, 490–501. [Google Scholar] [CrossRef] [Green Version]
- Kusch, P. Identification of Organic Additives in Nitrile Rubber Materials by Pyrolysis-GC-MS; Avanstar Communications: Manchester, UK, 2013; Volume 31, pp. 248–254. [Google Scholar]
- Dresselhaus, M.; Dresselhaus, G.; Saito, R.; Jorio, A. Raman spectroscopy of carbon nanotubes. Phys. Rep. 2005, 409, 47–99. [Google Scholar] [CrossRef]
- Liu, W.-W.; Aziz, A.; Chai, S.-P.; Mohamed, A.R.; Tye, C.-T. The effect of carbon precursors (methane, benzene and camphor) on the quality of carbon nanotubes synthesised by the chemical vapour decomposition. Phys. E Low-Dimens. Syst. Nanostruct. 2011, 43, 1535–1542. [Google Scholar] [CrossRef]
- Yamada, T.; Maigne, A.; Yudasaka, M.; Mizuno, K.; Futaba, D.; Yumura, M.; Iijima, S.; Hata, K. Revealing the Secret of Water-Assisted Carbon Nanotube Synthesis by Microscopic Observation of the Interaction of Water on the Catalysts. Nano Lett. 2008, 8, 4288–4292. [Google Scholar] [CrossRef]
- Lee, Y.W.; Kim, M.; Kim, Y.; Kang, S.W.; Lee, J.-H.; Han, S.W. Synthesis and Electrocatalytic Activity of Au−Pd Alloy Nanodendrites for Ethanol Oxidation. J. Phys. Chem. C 2010, 114, 7689–7693. [Google Scholar] [CrossRef]
- Vm, S.; Mohamed, A.R.; Abdullah, A.Z.; Chai, S.-P. Role of Reaction and Factors of Carbon Nanotubes Growth in Chemical Vapour Decomposition Process Using Methane—A Highlight. J. Nanomater. 2010, 2010, 395191. [Google Scholar] [CrossRef]
- Li, Y.; Zhang, X.; Tao, X.; Xu, J.; Chen, F.; Huang, W.; Liu, F. Growth mechanism of multi-walled carbon nanotubes with or without bundles by catalytic deposition of methane on Mo/MgO. Chem. Phys. Lett. 2004, 386, 105–110. [Google Scholar] [CrossRef]
- Min, X.; Li, Y.; Ke, Y.; Shi, M.; Chai, L.; Xue, K. Fe-FeS2 adsorbent prepared with iron powder and pyrite by facile ball milling and its application for arsenic removal. Water Sci. Technol. 2017, 76, 192–200. [Google Scholar] [CrossRef] [Green Version]
- Chen, R.; Chai, L.; Li, Q.; Shi, Y.; Wang, Y.; Mohammad, A. Preparation and characterization of magnetic Fe3O4/CNT nanoparticles by RPO method to enhance the efficient removal of Cr(VI). Environ. Sci. Pollut. Res. 2013, 20, 7175–7185. [Google Scholar] [CrossRef]
- Jaret, S.J.; Glotch, T.D.; Johnson, J.R. Micro-raman and micro-FTIR spectroscopy of experimentally shocked andesine. In Proceedings of the Lunar and Planetary Science Conference 2015, The Woodlands, TX, USA, 16–20 March 2015; p. 2056. [Google Scholar]
- Nasrazadani, S. The application of infrared spectroscopy to a study of phosphoric and tannic acids interactions with magnetite (Fe3O4), goethite (α-FEOOH) and lepidocrocite (γ-FeOOH). Corros. Sci. 1997, 39, 1845–1859. [Google Scholar] [CrossRef]
- Islam, M.; Trevorah, R.; Appadoo, D.; Best, S.; Chantler, C. Methods and methodology for FTIR spectral correction of channel spectra and uncertainty, applied to ferrocene. Spectrochim. Acta Part A: Mol. Biomol. Spectrosc. 2017, 177, 86–92. [Google Scholar] [CrossRef]
- Shapter, J.; Brooker, M.; Skinner, W. Observation of the oxidation of galena using Raman spectroscopy. Int. J. Miner. Process. 2000, 60, 199–211. [Google Scholar] [CrossRef]
- Azizi, A. Green Synthesis of Fe3O4 Nanoparticles and Its Application in Preparation of Fe3O4/Cellulose Magnetic Nanocomposite: A Suitable Proposal for Drug Delivery Systems. J. Inorg. Organomet. Polym. Mater. 2020, 30, 3552–3561. [Google Scholar] [CrossRef]
- Basheer, A.; Hanafiah, M.; Alsaadi, M.; Yaacob, W.W.; Al-Douri, Y. Synthesis, Characterization, and Analysis of Hybrid Carbon Nanotubes by Chemical Vapor Deposition: Application for Aluminum Removal. Polymers 2020, 12, 1305. [Google Scholar] [CrossRef] [PubMed]
- Kumar, U.; Yadav, B. Synthesis of carbon nanotubes by direct liquid injection chemical vapor deposition method and its relevance for developing an ultra-sensitive room temperature based CO2 sensor. J. Taiwan Inst. Chem. Eng. 2019, 96, 652–663. [Google Scholar] [CrossRef]
- Sinnott, S.; Andrews, R.; Qian, D.; Rao, A.; Mao, Z.; Dickey, E.; Derbyshire, F. Model of carbon nanotube growth through chemical vapor deposition. Chem. Phys. Lett. 1999, 315, 25–30. [Google Scholar] [CrossRef]
- Deck, C.P.; Vecchio, K. Growth mechanism of vapor phase CVD-grown multi-walled carbon nanotubes. Carbon 2005, 43, 2608–2617. [Google Scholar] [CrossRef]
- Lim, Y.D.; Avramchuck, A.V.; Grapov, D.; Tan, C.W.; Tay, B.K.; Aditya, S.; Labunov, V. Enhanced Carbon Nanotubes Growth Using Nickel/Ferrocene-Hybridized Catalyst. ACS Omega 2017, 2, 6063–6071. [Google Scholar] [CrossRef] [PubMed]
- Lee, S.-H.; Park, J.; Kim, H.-R.; Lee, J.; Lee, K.-H. Synthesis of high-quality carbon nanotube fibers by controlling the effects of sulfur on the catalyst agglomeration during the direct spinning process. RSC Adv. 2015, 5, 41894–41900. [Google Scholar] [CrossRef] [Green Version]


| Sample | Carbon (%) | Nitrogen (%) | Sulfur (%) |
|---|---|---|---|
| NRG-S | 64.858 | 0.0706 | 0.6669 |
| NRG-L | 63.820 | 0.0769 | 0.4791 |
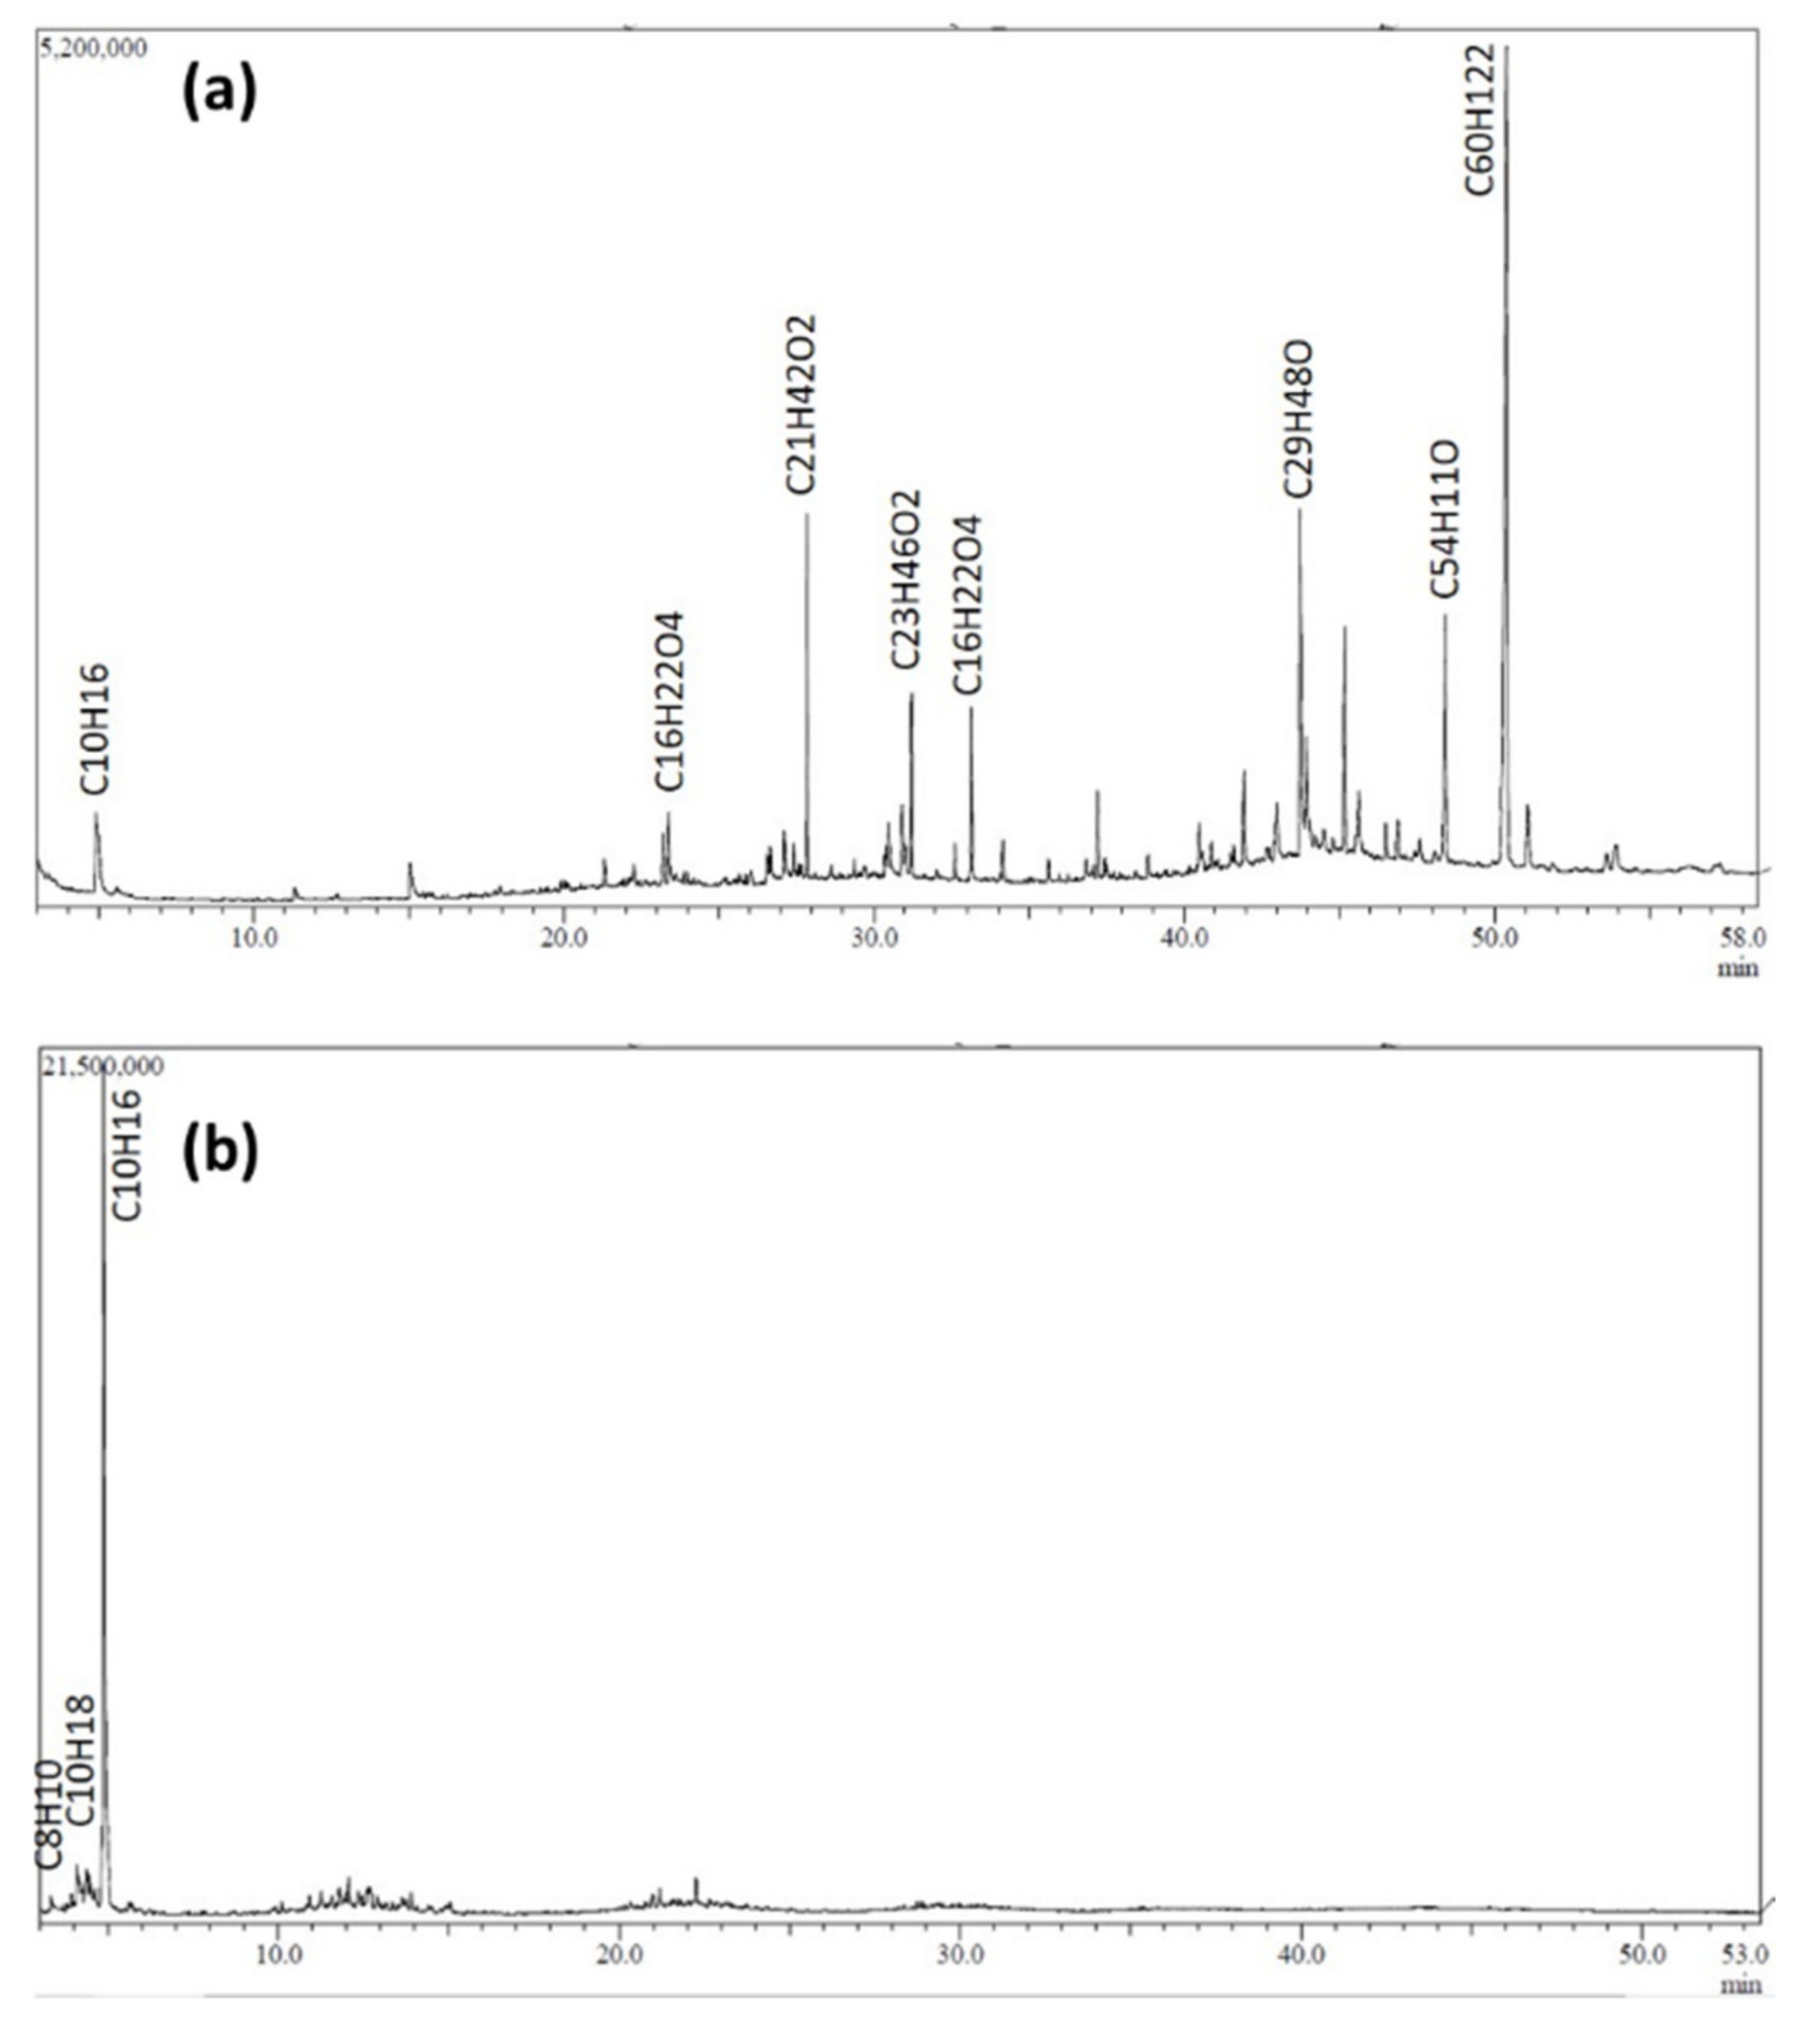
| Retention Time (Min) | Expected Compound | Formula |
|---|---|---|
| NRG-S | ||
| 4.111 | d-Limonene | C10H16 |
| 23.21 | Dibutyl phthalate | C16H22O4 |
| 27.841 | Nonadecyl acetate | C21H42O2 |
| 31.206 | Heneicosyl acetate | C23H46O2 |
| 33.135 | 1,2-benzenedicarboxylic acid | C16H22O4 |
| 43.946 | Fucosterol | C29H48O |
| 48.475 | Tetrapentacontane | C54H110 |
| 50.398 | Hexacontane | C60H122 |
| NRG-L | ||
| 3.343 | Benzene, 1,3-dimethyl- | C8H10 |
| 4.111 | d-Limonene | C10H16 |
| 4.35 | 2,6-Dimethyl-2-trans-6-octadiene | C10H18 |
| 4.479 | 1,5-Heptadiene,2,3,6-trimethyl- | C10H18 |
| 4.896 | d-Limonene | C10H16 |
Publisher’s Note: MDPI stays neutral with regard to jurisdictional claims in published maps and institutional affiliations. |
© 2021 by the authors. Licensee MDPI, Basel, Switzerland. This article is an open access article distributed under the terms and conditions of the Creative Commons Attribution (CC BY) license (https://creativecommons.org/licenses/by/4.0/).
Share and Cite
Hazan, M.A.; Chan, K.F.; Jofri, K.A.; Mamat, M.S.; Endot, N.A.; Liza, S.; Ismail, I.; Hussein, M.Z.; Tanemura, M.; Yaakob, Y. Waste NR Latex Based-Precursors as Carbon Source for CNTs Eco-Fabrications. Polymers 2021, 13, 3409. https://doi.org/10.3390/polym13193409
Hazan MA, Chan KF, Jofri KA, Mamat MS, Endot NA, Liza S, Ismail I, Hussein MZ, Tanemura M, Yaakob Y. Waste NR Latex Based-Precursors as Carbon Source for CNTs Eco-Fabrications. Polymers. 2021; 13(19):3409. https://doi.org/10.3390/polym13193409
Chicago/Turabian StyleHazan, Mohd Adib, Kar Fei Chan, Khairun Afiqa Jofri, Md Shuhazlly Mamat, Nor Azam Endot, Shahira Liza, Ismayadi Ismail, Mohd Zobir Hussein, Masaki Tanemura, and Yazid Yaakob. 2021. "Waste NR Latex Based-Precursors as Carbon Source for CNTs Eco-Fabrications" Polymers 13, no. 19: 3409. https://doi.org/10.3390/polym13193409
APA StyleHazan, M. A., Chan, K. F., Jofri, K. A., Mamat, M. S., Endot, N. A., Liza, S., Ismail, I., Hussein, M. Z., Tanemura, M., & Yaakob, Y. (2021). Waste NR Latex Based-Precursors as Carbon Source for CNTs Eco-Fabrications. Polymers, 13(19), 3409. https://doi.org/10.3390/polym13193409