
Prediction of Methylene Blue Removal by Nano TiO2 Using Deep Neural Network


Abstract
:1. Introduction
2. Materials and Methods
2.1. Materials
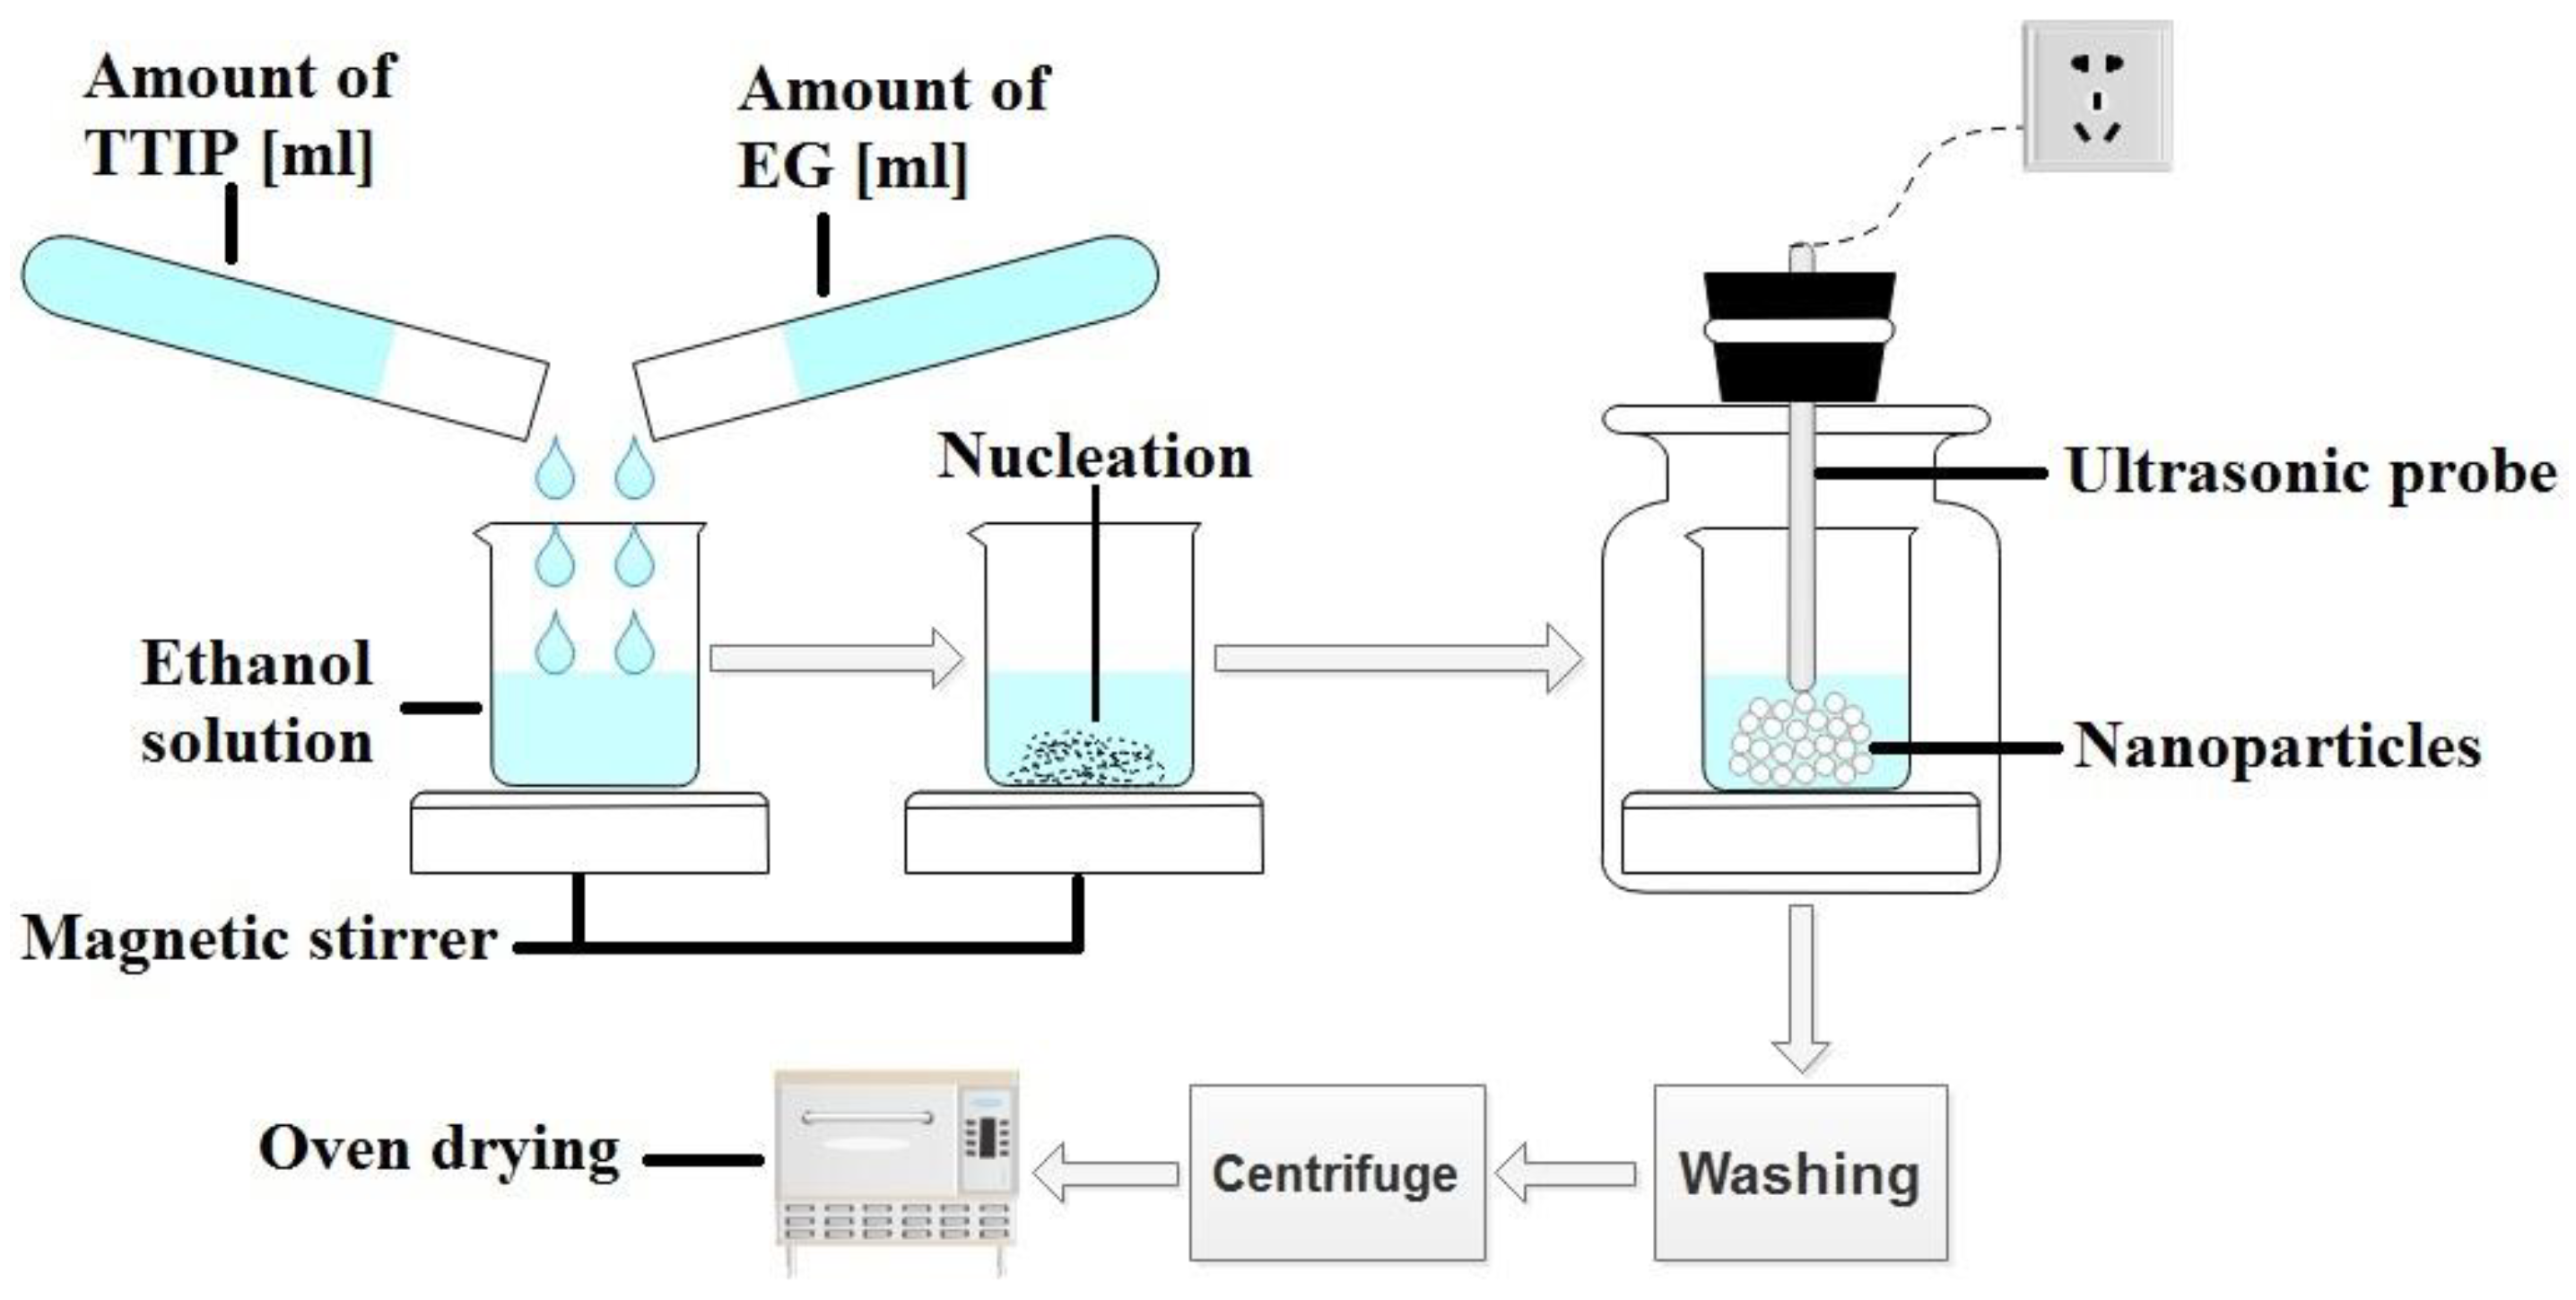
2.2. Synthesis of TiO NPs
2.3. MB Removal
2.4. Deep Neural Network
2.5. Evaluation of DNN Model
3. Results and Discussion
3.1. Scanning Electron Microscopy (SEM) Analysis
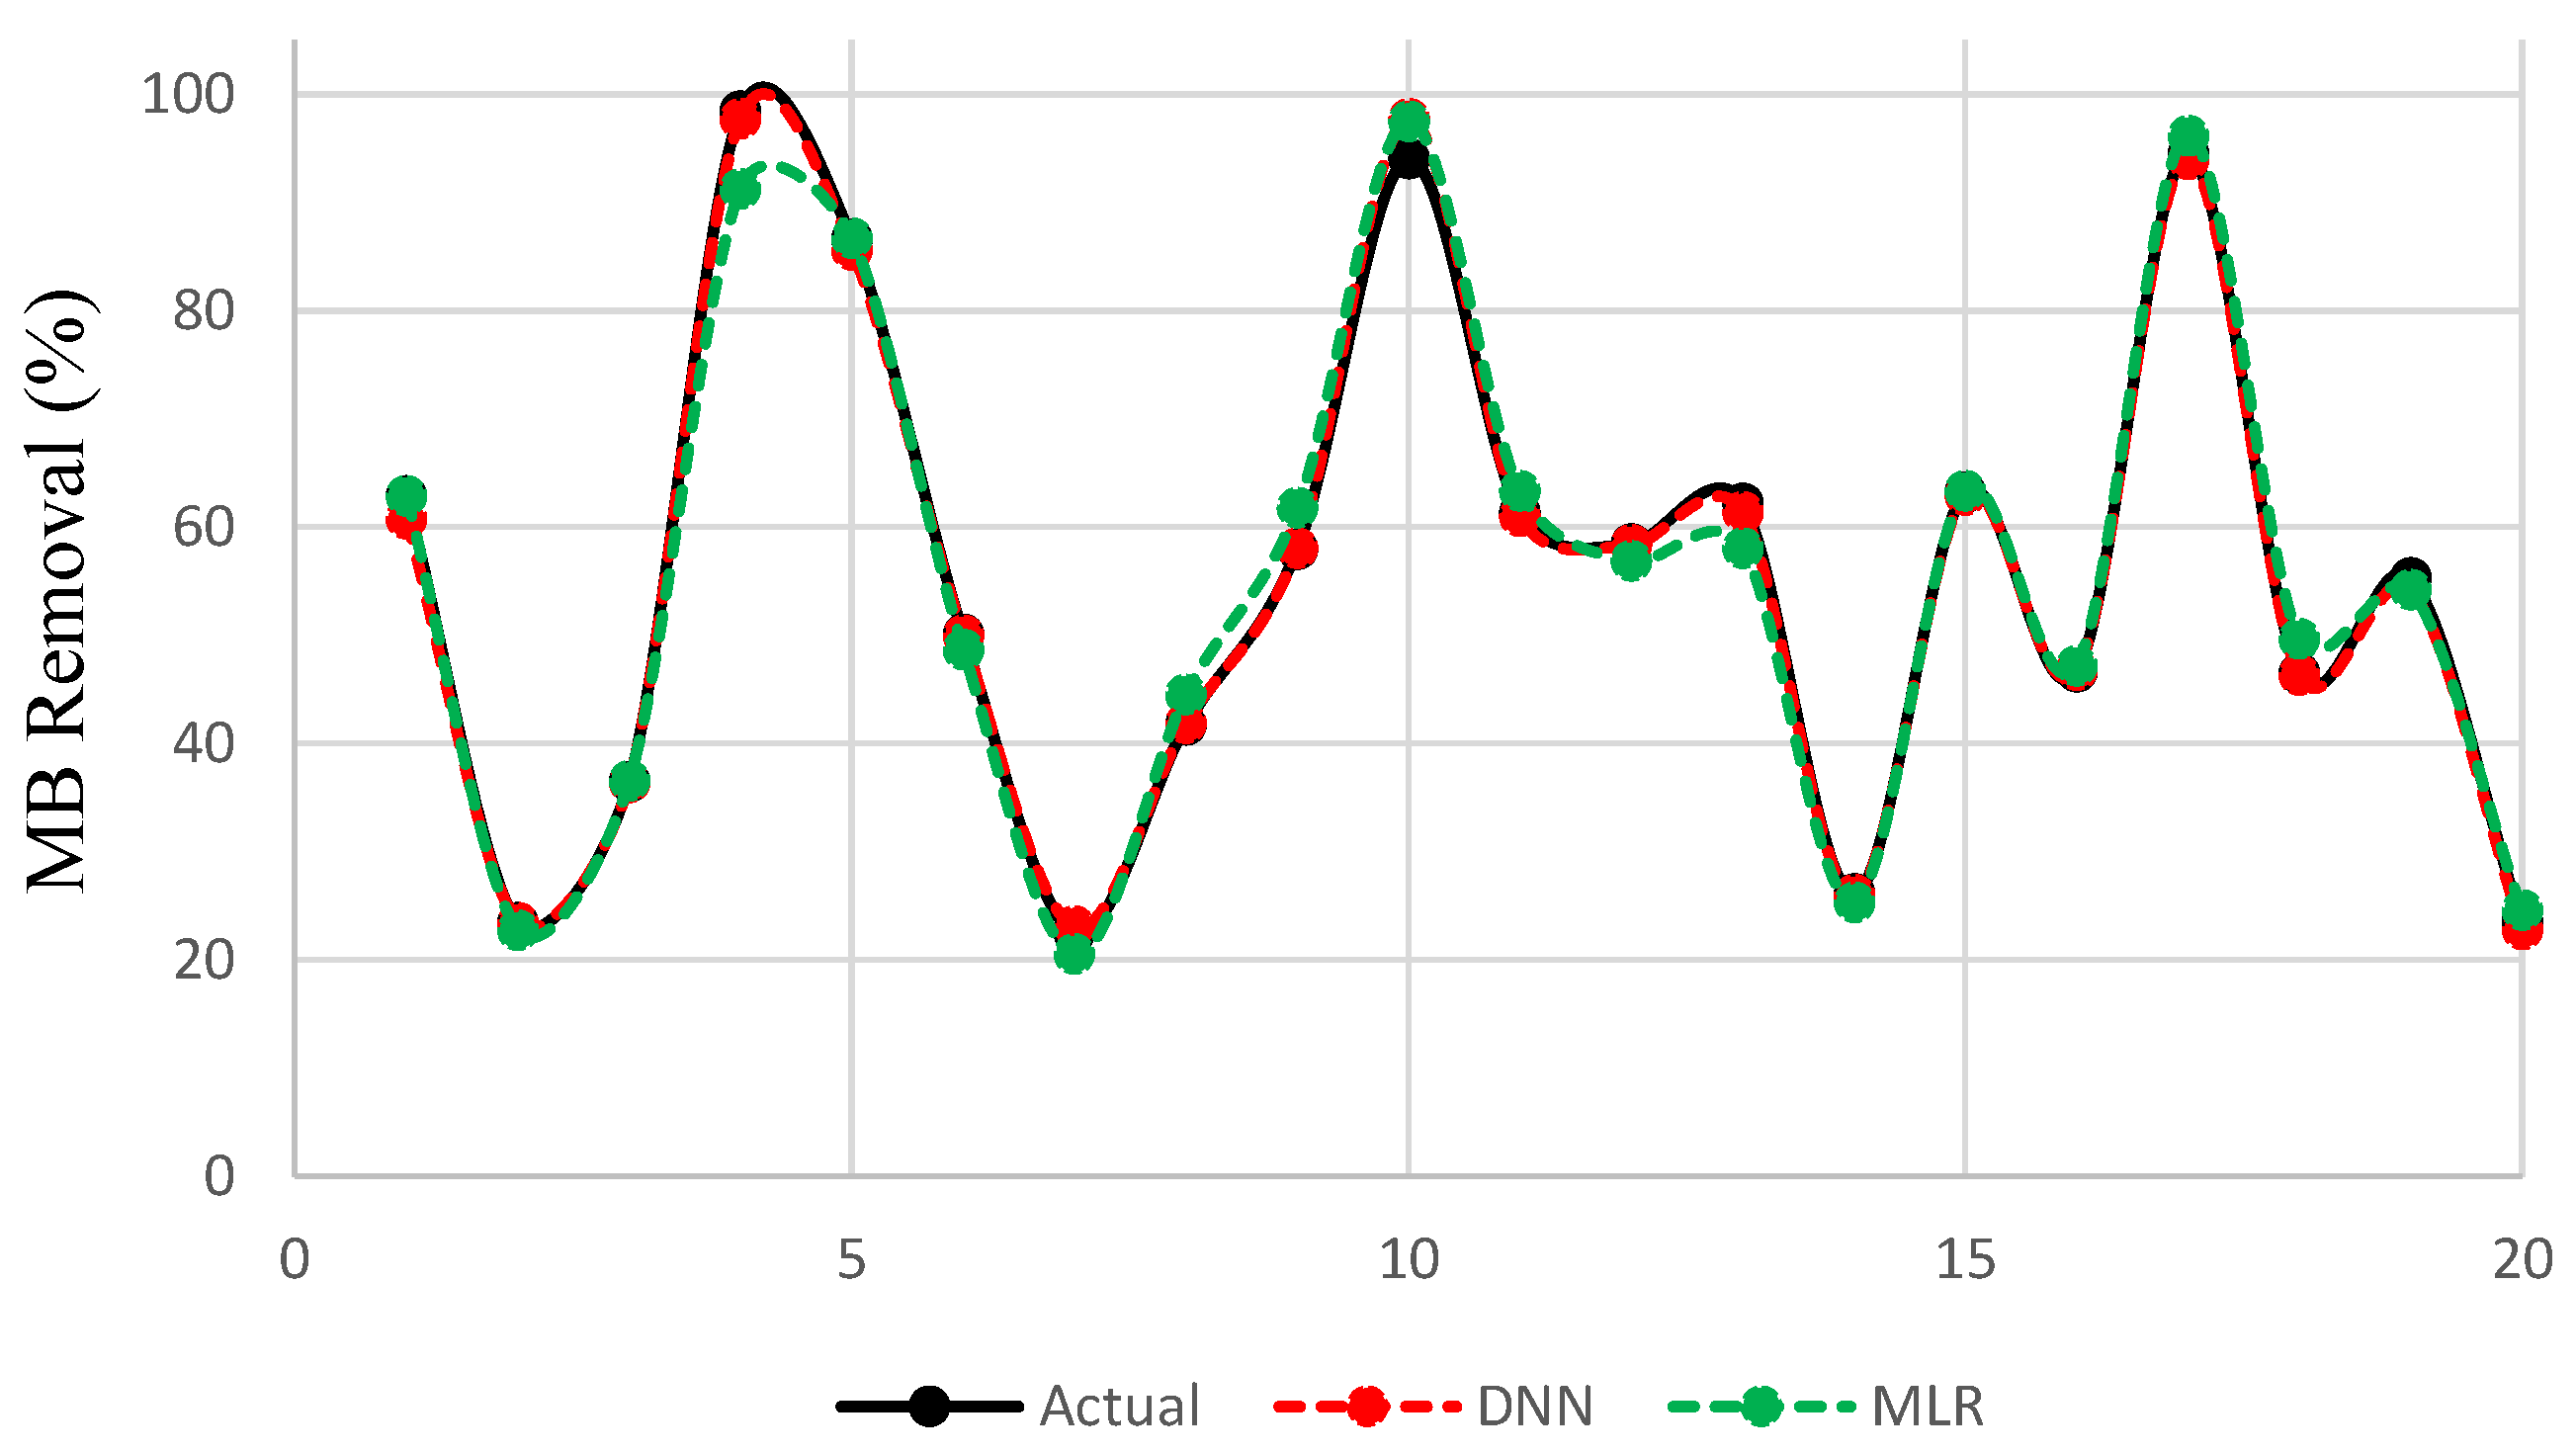
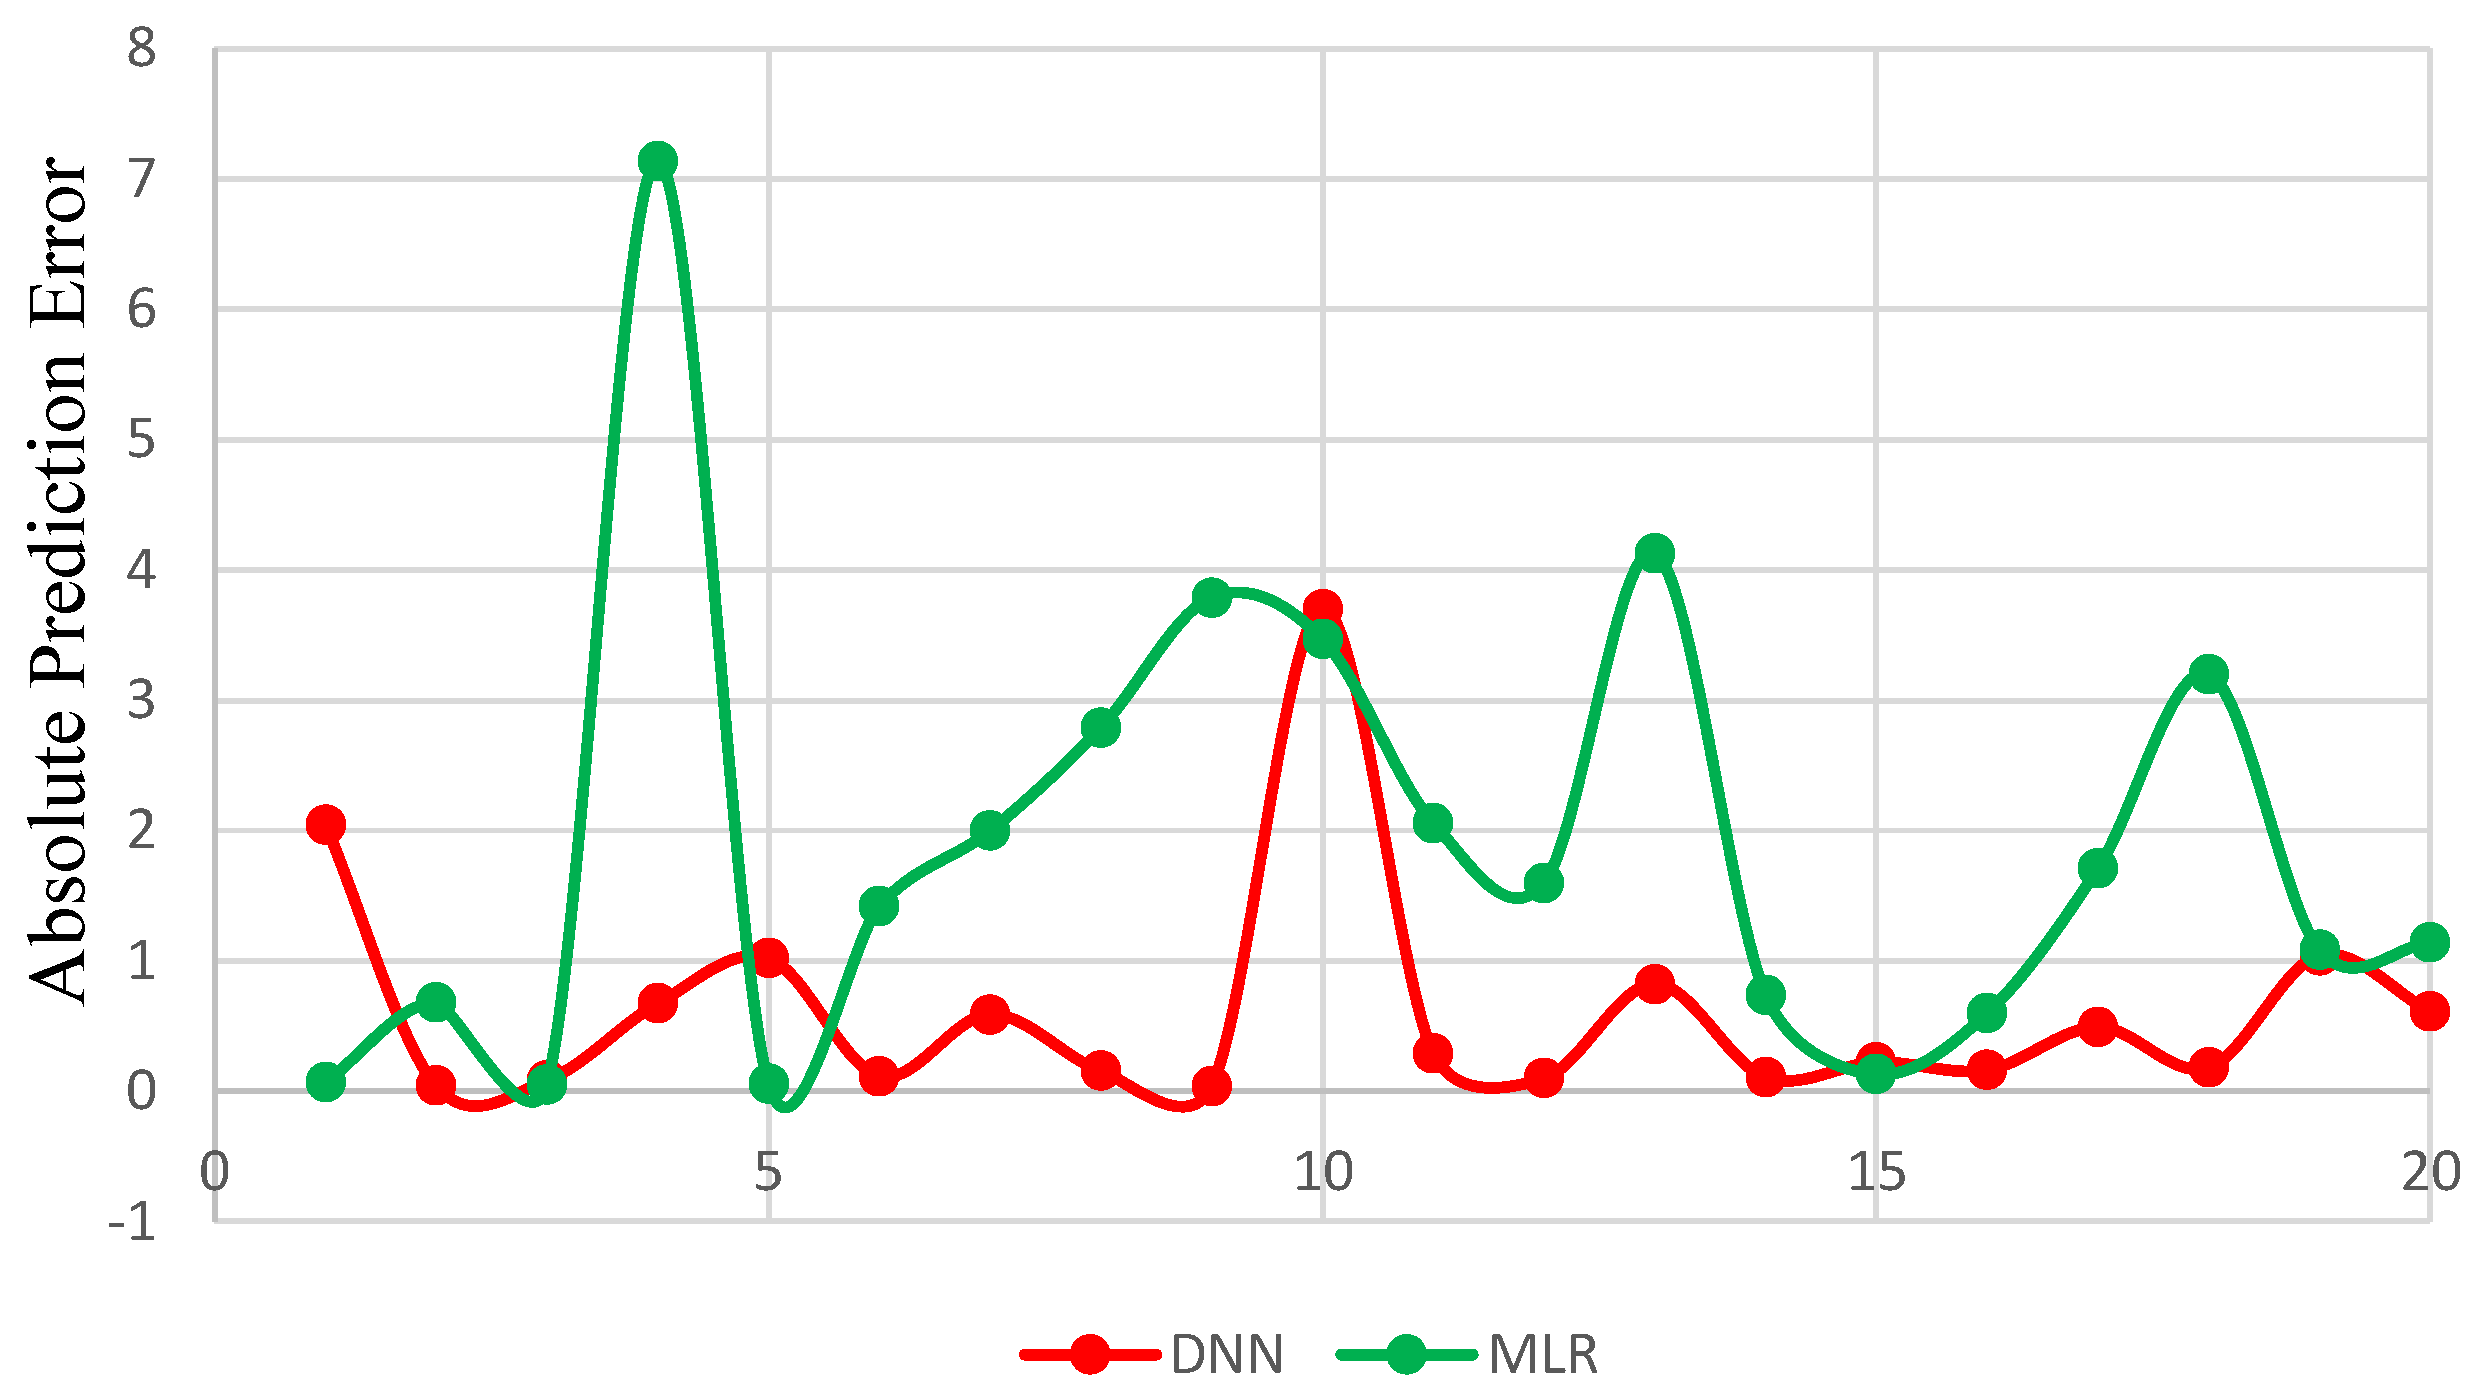
3.2. Evaluation of MB Removal
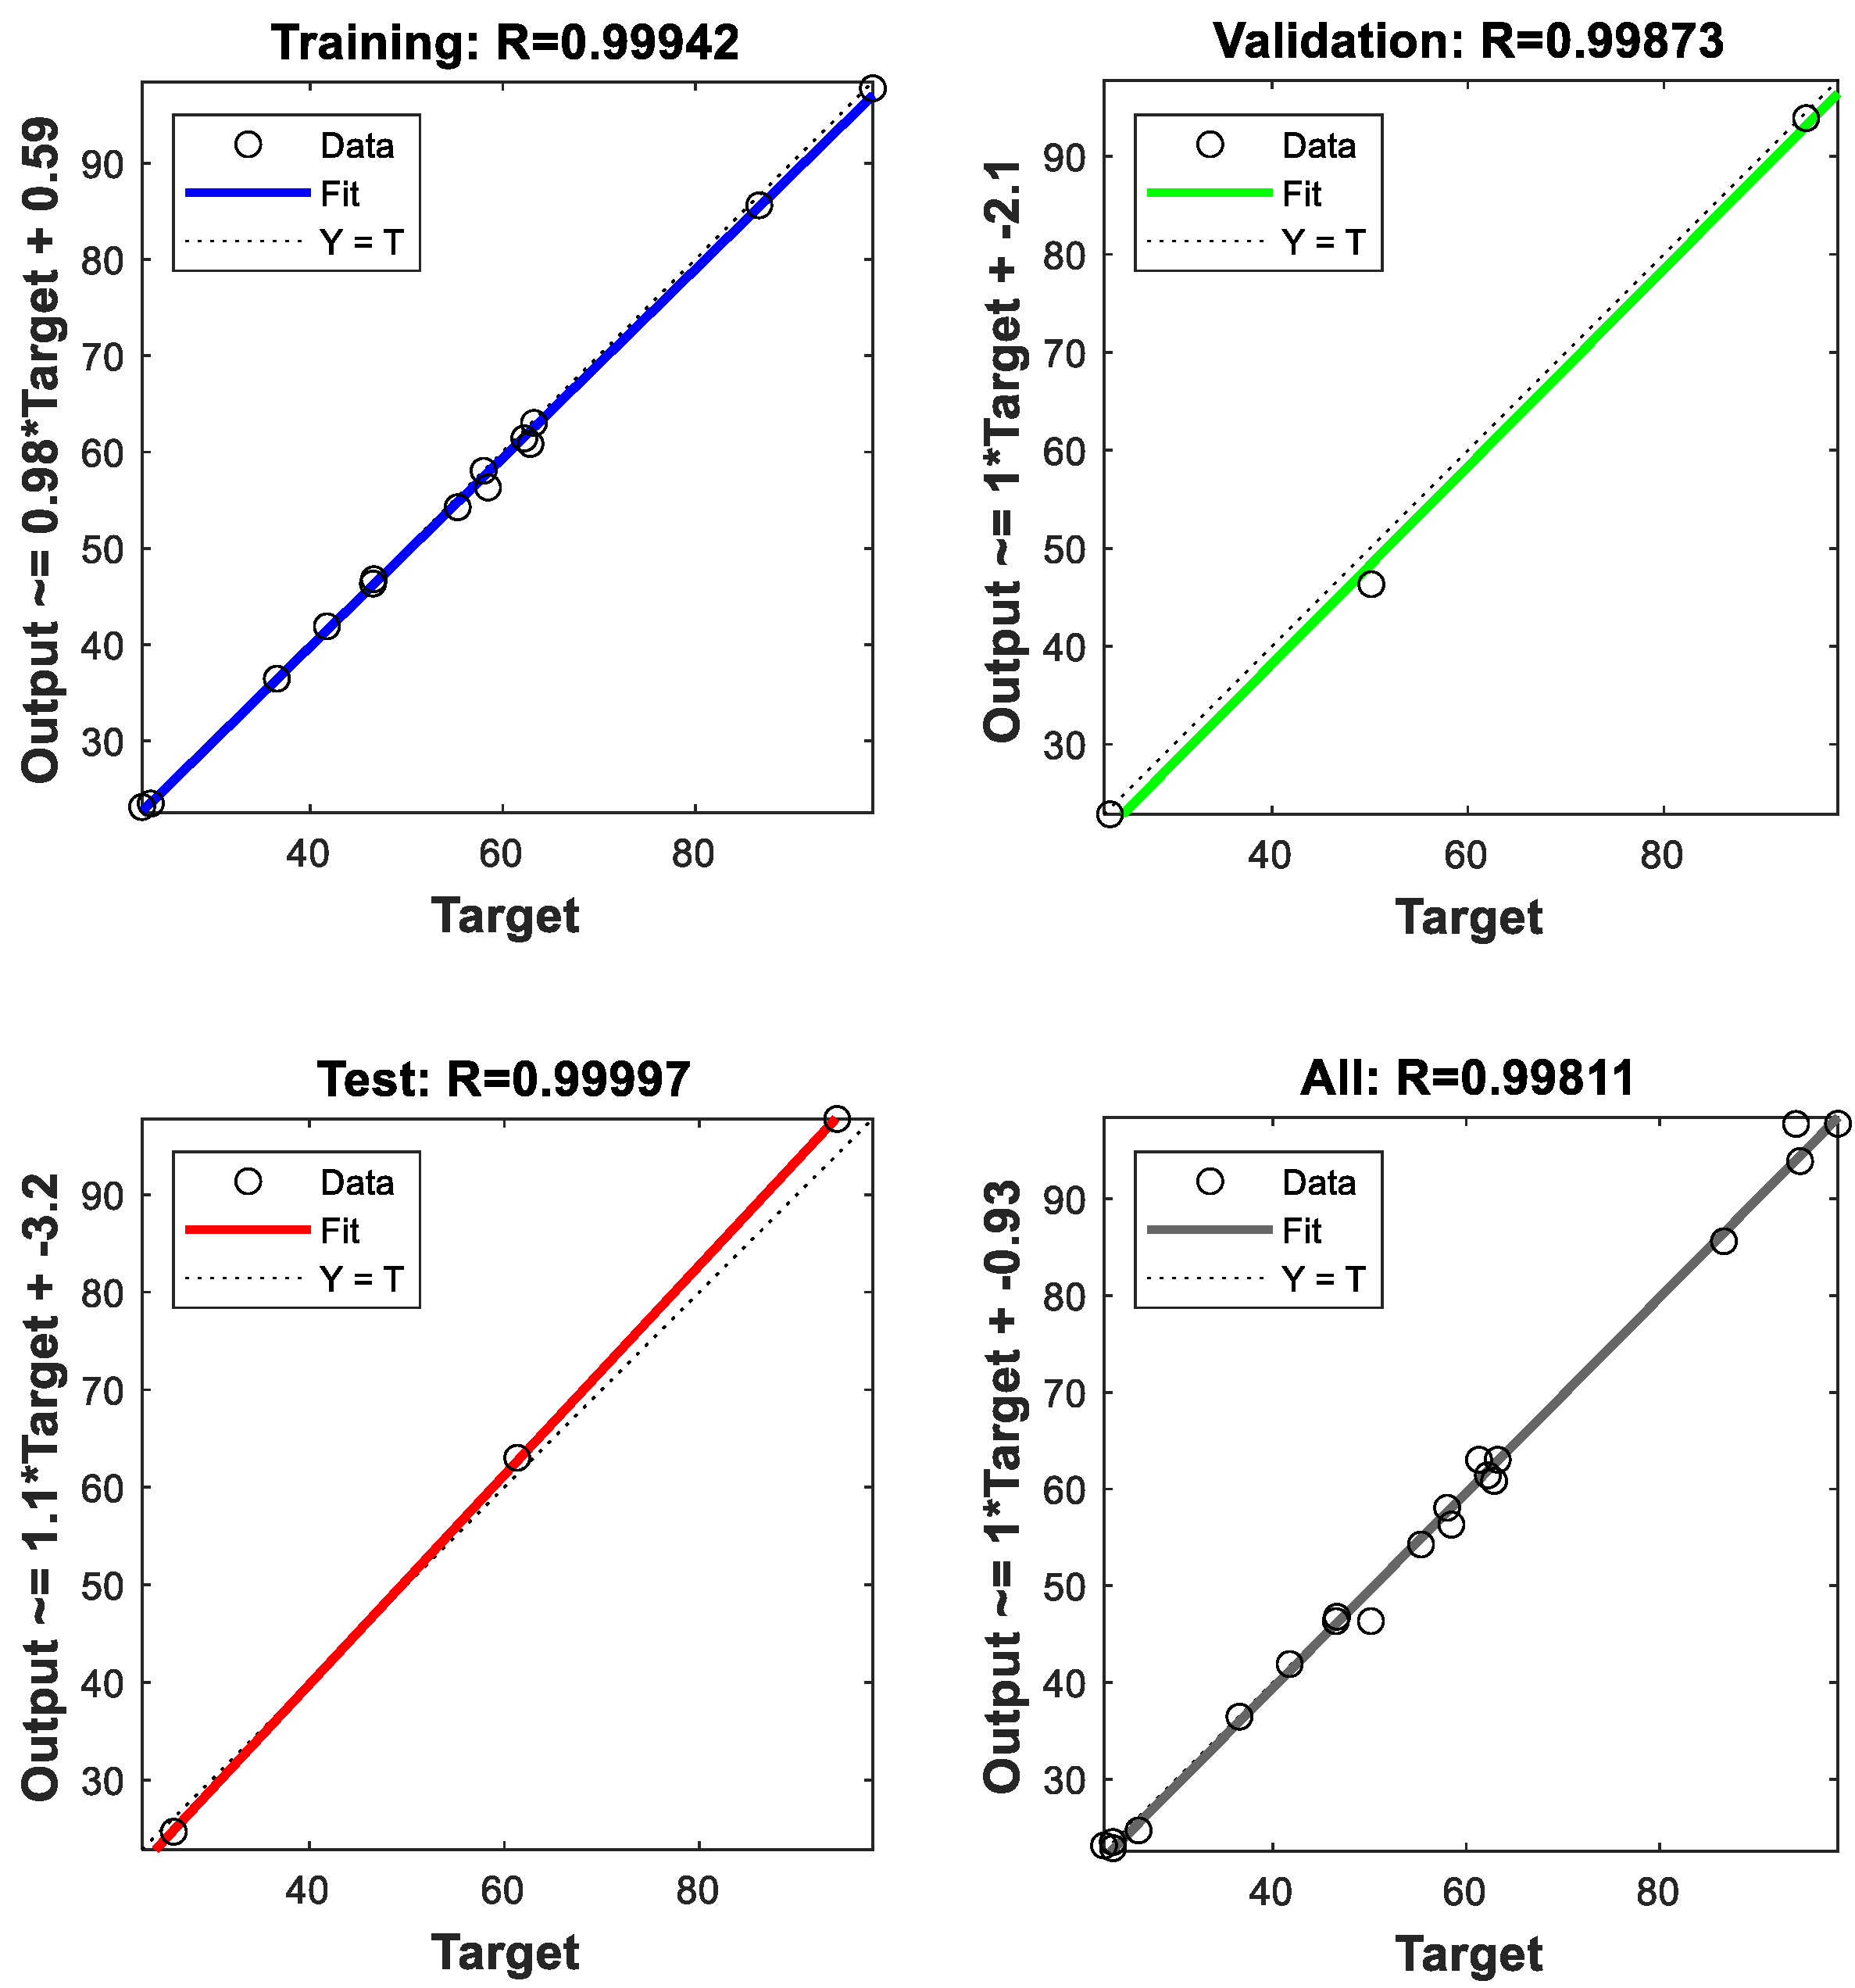
3.3. Analysis of the Proposed DNN Model
4. Conclusions
Supplementary Materials
Author Contributions
Funding
Institutional Review Board Statement
Informed Consent Statement
Data Availability Statement
Conflicts of Interest
References
- Ashraf, M.; Wiener, J.; Farooq, A.; Šašková, J.; Noman, M. Development of Maghemite Glass Fibre Nanocomposite for Adsorptive Removal of Methylene Blue. Fibers Polym. 2018, 19, 1735–1746. [Google Scholar] [CrossRef]
- Waqas, H.; Farooq, U.; Shah, Z.; Kumam, P.; Shutaywi, M. Second-order slip effect on bio-convectional viscoelastic nanofluid flow through a stretching cylinder with swimming microorganisms and melting phenomenon. Sci. Rep. 2021, 11, 11208. [Google Scholar] [CrossRef] [PubMed]
- Azeem, M.; Noman, M.T.; Wiener, J.; Petru, M.; Louda, P. Structural design of efficient fog collectors: A review. Environ. Technol. Innov. 2020, 20, 101169. [Google Scholar] [CrossRef]
- Mansoor, T.; Hes, L.; Bajzik, V.; Noman, M.T. Novel method on thermal resistance prediction and thermo-physiological comfort of socks in a wet state. Text. Res. J. 2020, 90, 1987–2006. [Google Scholar] [CrossRef]
- Noman, M.T.; Petru, M.; Militký, J.; Azeem, M.; Ashraf, M.A. One-Pot Sonochemical Synthesis of ZnO Nanoparticles for Photocatalytic Applications, Modelling and Optimization. Materials 2020, 13, 14. [Google Scholar] [CrossRef] [PubMed] [Green Version]
- Mahmood, A.; Noman, M.T.; Pechočiaková, M.; Amor, N.; Petrů, M.; Abdelkader, M.; Militký, J.; Sozcu, S.; Hassan, S.Z.U. Geopolymers and Fiber-Reinforced Concrete Composites in Civil Engineering. Polymers 2021, 13, 2099. [Google Scholar] [CrossRef] [PubMed]
- Wang, J.; Li, M.; Feng, J.; Yan, X.; Chen, H.; Han, R. Effects of TiO2-NPs pretreatment on UV-B stress tolerance in Arabidopsis thaliana. Chemosphere 2021, 281, 130809. [Google Scholar] [CrossRef] [PubMed]
- Pourhashem, S.; Duan, J.; Zhou, Z.; Ji, X.; Sun, J.; Dong, X.; Wang, L.; Guan, F.; Hou, B. Investigating the effects of chitosan solution and chitosan modified TiO2 nanotubes on the corrosion protection performance of epoxy coatings. Mater. Chem. Phys. 2021, 270, 124751. [Google Scholar] [CrossRef]
- Lee, K.H.; Chu, J.Y.; Kim, A.R.; Kim, H.G.; Yoo, D.J. Functionalized TiO2 mediated organic-inorganic composite membranes based on quaternized poly(arylene ether ketone) with enhanced ionic conductivity and alkaline stability for alkaline fuel cells. J. Membr. Sci. 2021, 634, 119435. [Google Scholar] [CrossRef]
- Yuan, N.; Cai, H.; Liu, T.; Huang, Q.; Zhang, X. Adsorptive removal of methylene blue from aqueous solution using coal fly ash-derived mesoporous silica material. Adsorpt. Sci. Technol. 2019, 37, 333–348. [Google Scholar] [CrossRef] [Green Version]
- Zhang, X.; Yuan, N.; Li, Y.; Han, L.; Wang, Q. Fabrication of new MIL-53(Fe)@TiO2 visible-light responsive adsorptive photocatalysts for efficient elimination of tetracycline. Chem. Eng. J. 2021, 428, 131077. [Google Scholar] [CrossRef]
- Noman, M.T.; Petrů, M.; Amor, N.; Yang, T.; Mansoor, T. Thermophysiological comfort of sonochemically synthesized nano TiO2 coated woven fabrics. Sci. Rep. 2020, 10, 17204. [Google Scholar] [CrossRef]
- Noman, M.T.; Ashraf, M.A.; Jamshaid, H.; Ali, A. A Novel Green Stabilization of TiO2 Nanoparticles onto Cotton. Fibers Polym. 2018, 19, 2268–2277. [Google Scholar] [CrossRef]
- Noman, M.T.; Militky, J.; Wiener, J.; Saskova, J.; Ashraf, M.A.; Jamshaid, H.; Azeem, M. Sonochemical synthesis of highly crystalline photocatalyst for industrial applications. Ultrasonics 2018, 83, 203–213. [Google Scholar] [CrossRef]
- Noman, M.T.; Wiener, J.; Saskova, J.; Ashraf, M.A.; Vikova, M.; Jamshaid, H.; Kejzlar, P. In-situ development of highly photocatalytic multifunctional nanocomposites by ultrasonic acoustic method. Ultrason. Sonochem. 2018, 40, 41–56. [Google Scholar] [CrossRef] [PubMed]
- Chen, R.; Mihaylova, L.; Zhu, H.; Bouaynaya, N. A Deep Learning Framework for Joint Image Restoration and Recognition. Circuits Syst. Signal Process. 2020, 39, 1561–1580. [Google Scholar] [CrossRef] [Green Version]
- Vahid, A.; Mückschel, M.; Stober, S.; Stock, A.; Beste, C. Applying deep learning to single-trial EEG data provides evidence for complementary theories on action control. Commun. Biol. 2020, 3, 112. [Google Scholar] [CrossRef] [PubMed] [Green Version]
- Zazoum, B.; Triki, E.; Bachri, A. Modeling of Mechanical Properties of Clay-Reinforced Polymer Nanocomposites Using Deep Neural Network. Materials 2020, 13, 4266. [Google Scholar] [CrossRef]
- Low, C.Y.; Park, J.; Teoh, A.B.J. Stacking-Based Deep Neural Network: Deep Analytic Network for Pattern Classification. IEEE Trans. Cybern. 2020, 50, 5021–5034. [Google Scholar] [CrossRef] [Green Version]
- Ha, M.H.; Chen, O.T.C. Deep Neural Networks Using Capsule Networks and Skeleton-Based Attentions for Action Recognition. IEEE Access 2021, 9, 6164–6178. [Google Scholar] [CrossRef]
- Amor, N.; Noman, M.T.; Petru, M. Classification of Textile Polymer Composites: Recent Trends and Challenges. Polymers 2021, 13, 2592. [Google Scholar] [CrossRef]
- Liu, X.; Gasco, F.; Goodsell, J.; Yu, W. Initial failure strength prediction of woven composites using a new yarn failure criterion constructed by deep learning. Compos. Struct. 2019, 230, 111505. [Google Scholar] [CrossRef]
- Khude, P.; Majumdar, A.; Butola, B.S. Modelling and prediction of antibacterial activity of knitted fabrics made from silver nanocomposite fibres using soft computing approaches. Neural Comput. Appl. 2019, 32, 9509–9519. [Google Scholar] [CrossRef]
- Altarazi, S.; Allaf, R.; Alhindawi, F. Machine Learning Models for Predicting and Classifying the Tensile Strength of Polymeric Films Fabricated via Different Production Processes. Materials 2019, 12, 1475. [Google Scholar] [CrossRef] [Green Version]
- Yang, C.S.; Lin, C.; Chen, W. Using deep principal components analysis-based neural networks for fabric pilling classification. Electronics 2019, 8, 474. [Google Scholar] [CrossRef] [Green Version]
- Li, Y.; Zhao, W.; Pan, J. Deformable Patterned Fabric Defect Detection With Fisher Criterion-Based Deep Learning. IEEE Trans. Autom. Sci. Eng. 2017, 14, 1256–1264. [Google Scholar] [CrossRef]
- Ni, C.; Li, Z.; Zhang, X.; Sun, X.; Huang, Y.; Zhao, L.; Zhu, T.; Wang, D. Online Sorting of the Film on Cotton Based on Deep Learning and Hyperspectral Imaging. IEEE Access 2020, 8, 93028–93038. [Google Scholar] [CrossRef]
- Lazzús, J.A. Neural network-particle swarm modeling to predict thermal properties. Math. Comput. Model. 2013, 57, 2408–2418. [Google Scholar] [CrossRef]
- Malik, S.A.; Gereke, T.; Farooq, A.; Aibibu, D.; Cherif, C. Prediction of yarn crimp in PES multifilament woven barrier fabrics using artificial neural network. J. Text. Inst. 2018, 109, 942–951. [Google Scholar] [CrossRef]
- Lu, D.; Yu, W. Predicting the tensile strength of single wool fibers using artificial neural network and multiple linear regression models based on acoustic emission. Text. Res. J. 2021, 91, 533–542. [Google Scholar] [CrossRef]
- Tadesse, M.G.; Loghin, E.; Pislaru, M.; Wang, L.; Chen, Y.; Nierstrasz, V.; Loghin, C. Prediction of the tactile comfort of fabrics from functional finishing parameters using fuzzy logic and artificial neural network models. Text. Res. J. 2019, 89, 4083–4094. [Google Scholar] [CrossRef]
- Mishra, S. Prediction of Yarn Strength Utilization in Cotton Woven Fabrics using Artificial Neural Network. J. Inst. Eng. Ser. E 2015, 96, 151–157. [Google Scholar] [CrossRef]
- El-Geiheini, A.; ElKateb, S.; Abd-Elhamied, M.R. Yarn Tensile Properties Modeling Using Artificial Intelligence. Alex. Eng. J. 2020, 59, 4435–4440. [Google Scholar] [CrossRef]
- Erbil, Y.; Babaarslan, O.; Ilhan, İ. A comparative prediction for tensile properties of ternary blended open-end rotor yarns using regression and neural network models. J. Text. Inst. 2018, 109, 560–568. [Google Scholar] [CrossRef]
- Noman, M.T.; Amor, N.; Petru, M.; Mahmood, A.; Kejzlar, P. Photocatalytic Behaviour of Zinc Oxide Nanostructures on Surface Activation of Polymeric Fibres. Polymers 2021, 13, 1227. [Google Scholar] [CrossRef]
- Wang, F.; Chen, Z.; Wu, C.; Yang, Y.; Zhang, D.; Li, S. A model for predicting the tensile strength of ultrafine glass fiber felts with mathematics and artificial neural network. J. Text. Inst. 2021, 112, 783–791. [Google Scholar] [CrossRef]
- Unal, P.; Üreyen, M.; Mecit, D. Predicting properties of single jersey fabrics using regression and artificial neural network models. Fibers Polym. 2012, 13, 87–95. [Google Scholar] [CrossRef]
- Amor, N.; Noman, M.T.; Petru, M. Prediction of functional properties of nano TiO2 coated cotton composites by artificial neural network. Sci. Rep. 2021, 11. [Google Scholar] [CrossRef]
- Amor, N.; Noman, M.T.; Petrů, M.; Mahmood, A.; Ismail, A. Neural network-crow search model for the prediction of functional properties of nano TiO2 coated cotton composites. Sci. Rep. 2021, 11, 1–13. [Google Scholar] [CrossRef]
- Breuer, K.; Stommel, M. Prediction of Short Fiber Composite Properties by an Artificial Neural Network Trained on an RVE Database. Fibers 2021, 9, 8. [Google Scholar] [CrossRef]
- Xie, Q.; Suvarna, M.; Li, J.; Zhu, X.; Cai, J.; Wang, X. Online prediction of mechanical properties of hot rolled steel plate using machine learning. Mater. Des. 2021, 197, 109201. [Google Scholar] [CrossRef]
- Wang, Z.; Di Massimo, C.; Tham, M.T.; Julian Morris, A. A procedure for determining the topology of multilayer feedforward neural networks. Neural Netw. 1994, 7, 291–300. [Google Scholar] [CrossRef]
- Rojas, R. Neural Networks—A Systematic Introduction; Springer: Berlin/Heidelberg, Germany, 1996. [Google Scholar]
- Sze, V.; Chen, Y.H.; Yang, T.J.; Emer, J.S. Efficient Processing of Deep Neural Networks: A Tutorial and Survey. Proc. IEEE 2017, 105, 2295–2329. [Google Scholar] [CrossRef] [Green Version]
- Chang, C.H. Deep and Shallow Architecture of Multilayer Neural Networks. IEEE Trans. Neural Netw. Learn. Syst. 2015, 26, 2477–2486. [Google Scholar] [CrossRef] [PubMed]
- Noman, M.T.; Amor, N.; Petru, M. Synthesis and applications of ZnO nanostructures (ZONSs): A review. Crit. Rev. Solid State Mater. Sci. 2021, 2, 1–44. [Google Scholar] [CrossRef]
- Noman, M.T.; Petrů, M.; Amor, N.; Louda, P. Thermophysiological comfort of zinc oxide nanoparticles coated woven fabrics. Sci. Rep. 2020, 10, 21080. [Google Scholar] [CrossRef] [PubMed]


| Sample | Amount of TTIP [mL] | Amount of EG [mL] | Sonication Time [h] |
|---|---|---|---|
| 1 | 10 | 8 | 4 |
| 2 | 1 | 2 | 0.5 |
| 3 | 1 | 2 | 4 |
| 4 | 10 | 4 | 1 |
| 5 | 10 | 5 | 0.5 |
| 6 | 5 | 5 | 2 |
| 7 | 1 | 8 | 4 |
| 8 | 5 | 5 | 0.5 |
| 9 | 7 | 5 | 1 |
| 10 | 10 | 2 | 0.5 |
| 11 | 7 | 5 | 2 |
| 12 | 7 | 8 | 1 |
| 13 | 5 | 2 | 2 |
| 14 | 1 | 4 | 1 |
| 15 | 7 | 5 | 2 |
| 16 | 5 | 5 | 1 |
| 17 | 10 | 2 | 4 |
| 18 | 5 | 5 | 2 |
| 19 | 7 | 5 | 4 |
| 20 | 1 | 8 | 0.5 |
| Sample | Surface Area [m/g] | Pore Volume [cm3/g] | Surface Roughness [nm] | Hydrodynamic Diameter [nm] |
|---|---|---|---|---|
| 1 | ||||
| 6 | ||||
| 9 | ||||
| 16 |
| Parameters | Settings |
|---|---|
| Training function | trainbr |
| Transfer function of hidden layers | tansig, tansig, tansig |
| Transfer function of output layer | tansig |
| Epochs | 1000 |
| Input node | 3 |
| Hidden node | 12,12, 6 |
| Output node | 1 |
| Performance goal | 0.00001 |
| Methods | MSE | RMSE | MAE | SD | |
|---|---|---|---|---|---|
| DNN (training) | 1.1186 | 1.0576 | 0.6254 | 1.1719 | 0.9997 |
| DNN (testing) | 1.09958 | 1.0532 | 0.6213 | 0.3558 | 0.9999 |
| MLR | 6.6044 | 2.5699 | 1.8933 | 2.6366 | 0.9882 |
| Methods | p-Value | F-Value |
|---|---|---|
| DNN | ||
| MLR | ||
| Experimental |
Publisher’s Note: MDPI stays neutral with regard to jurisdictional claims in published maps and institutional affiliations. |
© 2021 by the authors. Licensee MDPI, Basel, Switzerland. This article is an open access article distributed under the terms and conditions of the Creative Commons Attribution (CC BY) license (https://creativecommons.org/licenses/by/4.0/).
Share and Cite
Amor, N.; Noman, M.T.; Petru, M. Prediction of Methylene Blue Removal by Nano TiO2 Using Deep Neural Network. Polymers 2021, 13, 3104. https://doi.org/10.3390/polym13183104
Amor N, Noman MT, Petru M. Prediction of Methylene Blue Removal by Nano TiO2 Using Deep Neural Network. Polymers. 2021; 13(18):3104. https://doi.org/10.3390/polym13183104
Chicago/Turabian StyleAmor, Nesrine, Muhammad Tayyab Noman, and Michal Petru. 2021. "Prediction of Methylene Blue Removal by Nano TiO2 Using Deep Neural Network" Polymers 13, no. 18: 3104. https://doi.org/10.3390/polym13183104
APA StyleAmor, N., Noman, M. T., & Petru, M. (2021). Prediction of Methylene Blue Removal by Nano TiO2 Using Deep Neural Network. Polymers, 13(18), 3104. https://doi.org/10.3390/polym13183104