
The Influence of Local Strain Distribution on the Effective Electrical Resistance of Carbon Black Filled Natural Rubber


Abstract
:1. Introduction
1.1. Background
1.2. Research Approach
2. Materials and Methods
2.1. Rubber Formulation
2.2. Rubber Compounding and Samples Preparation
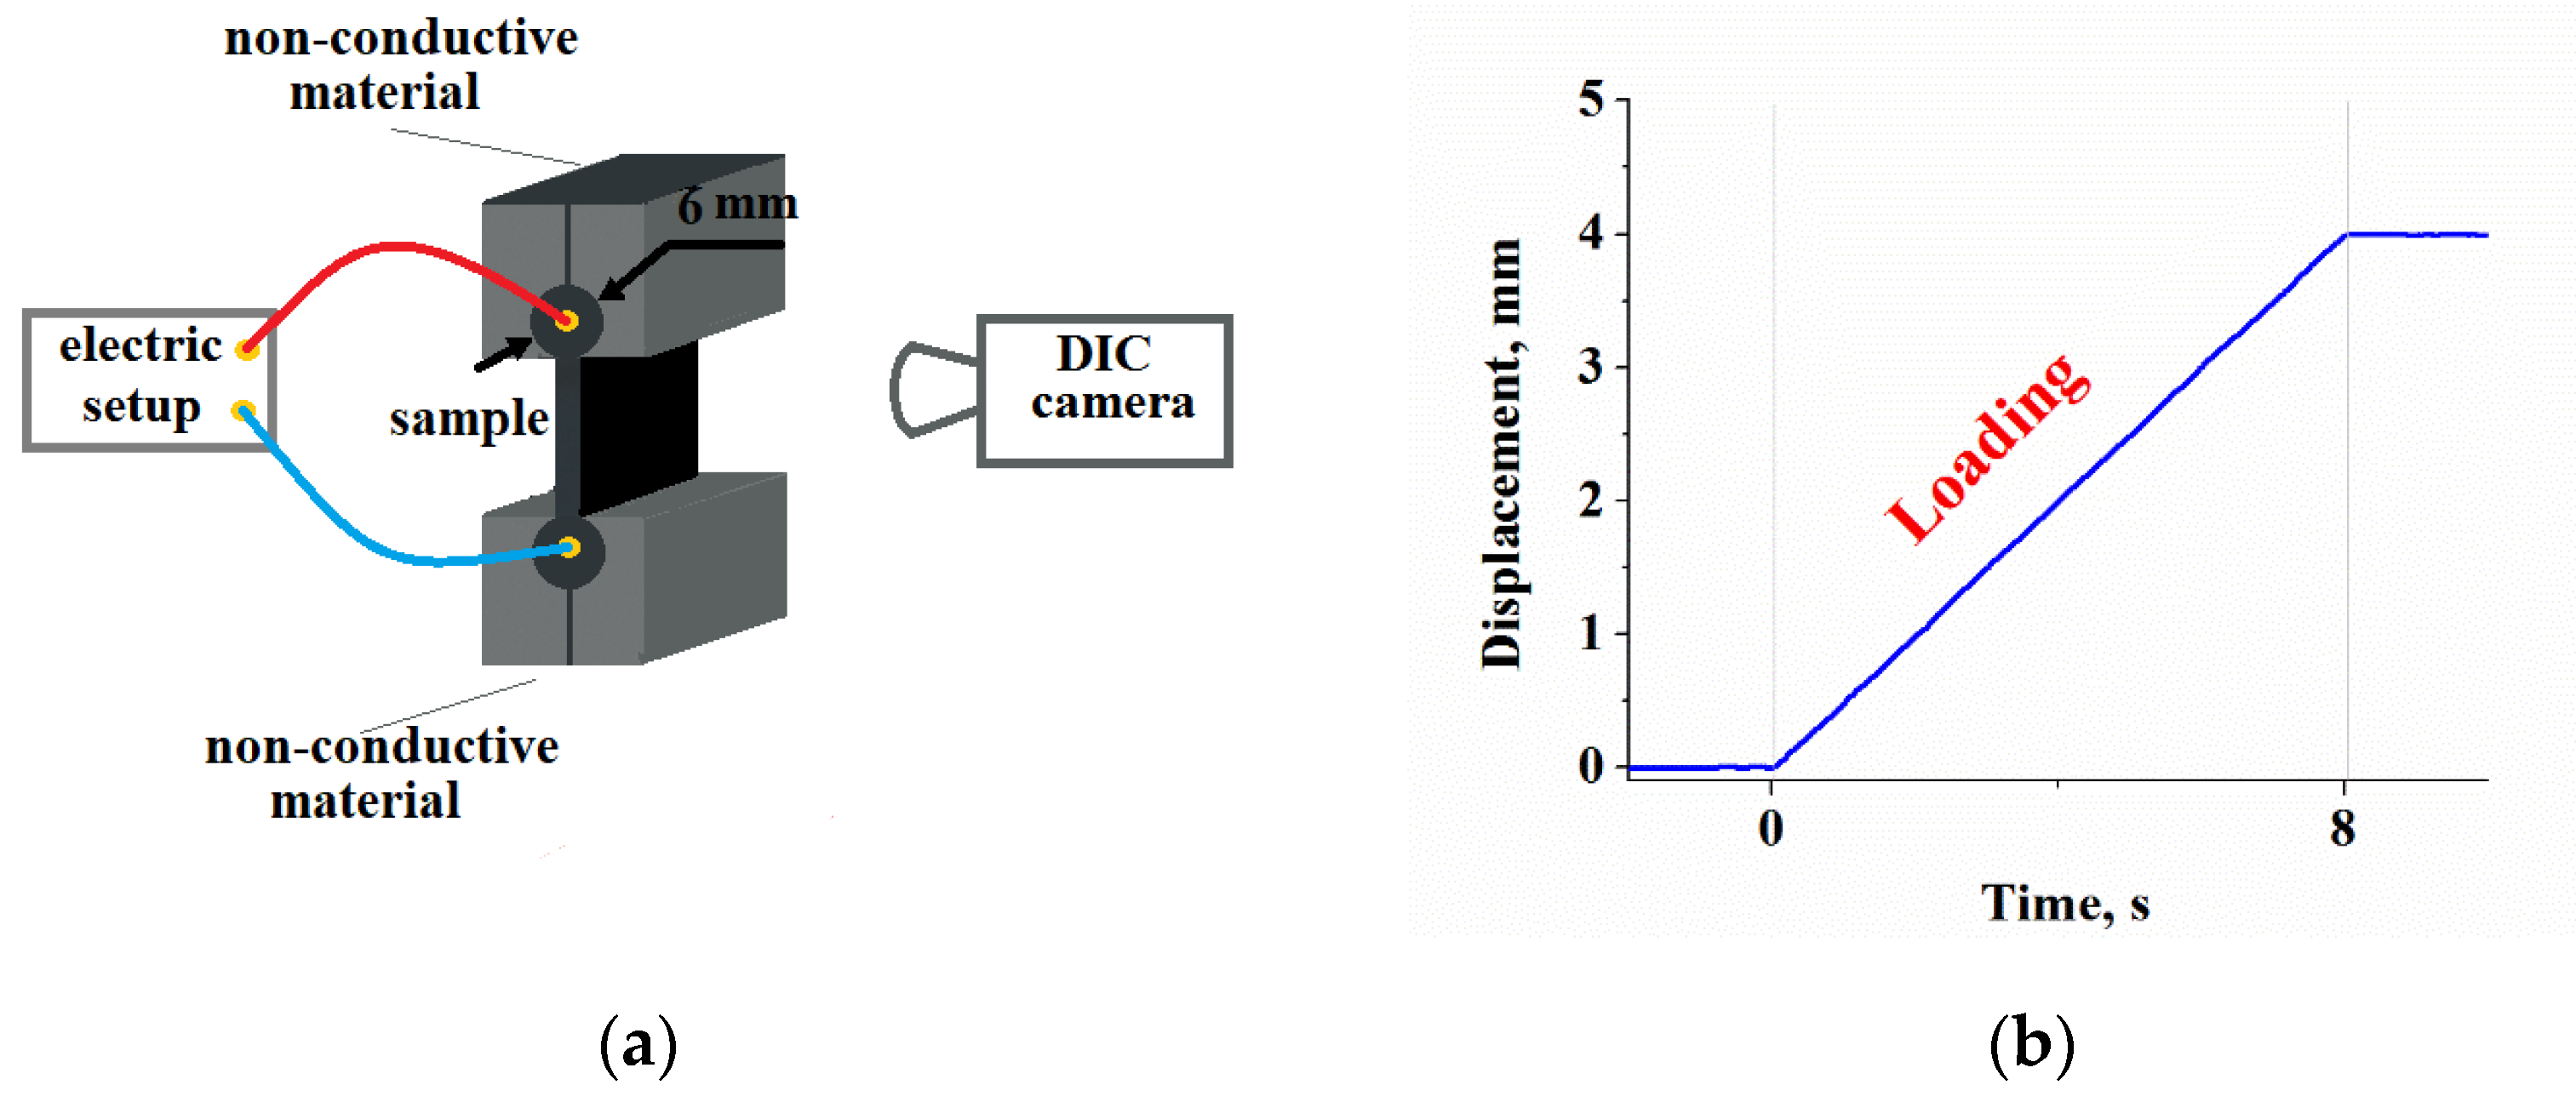
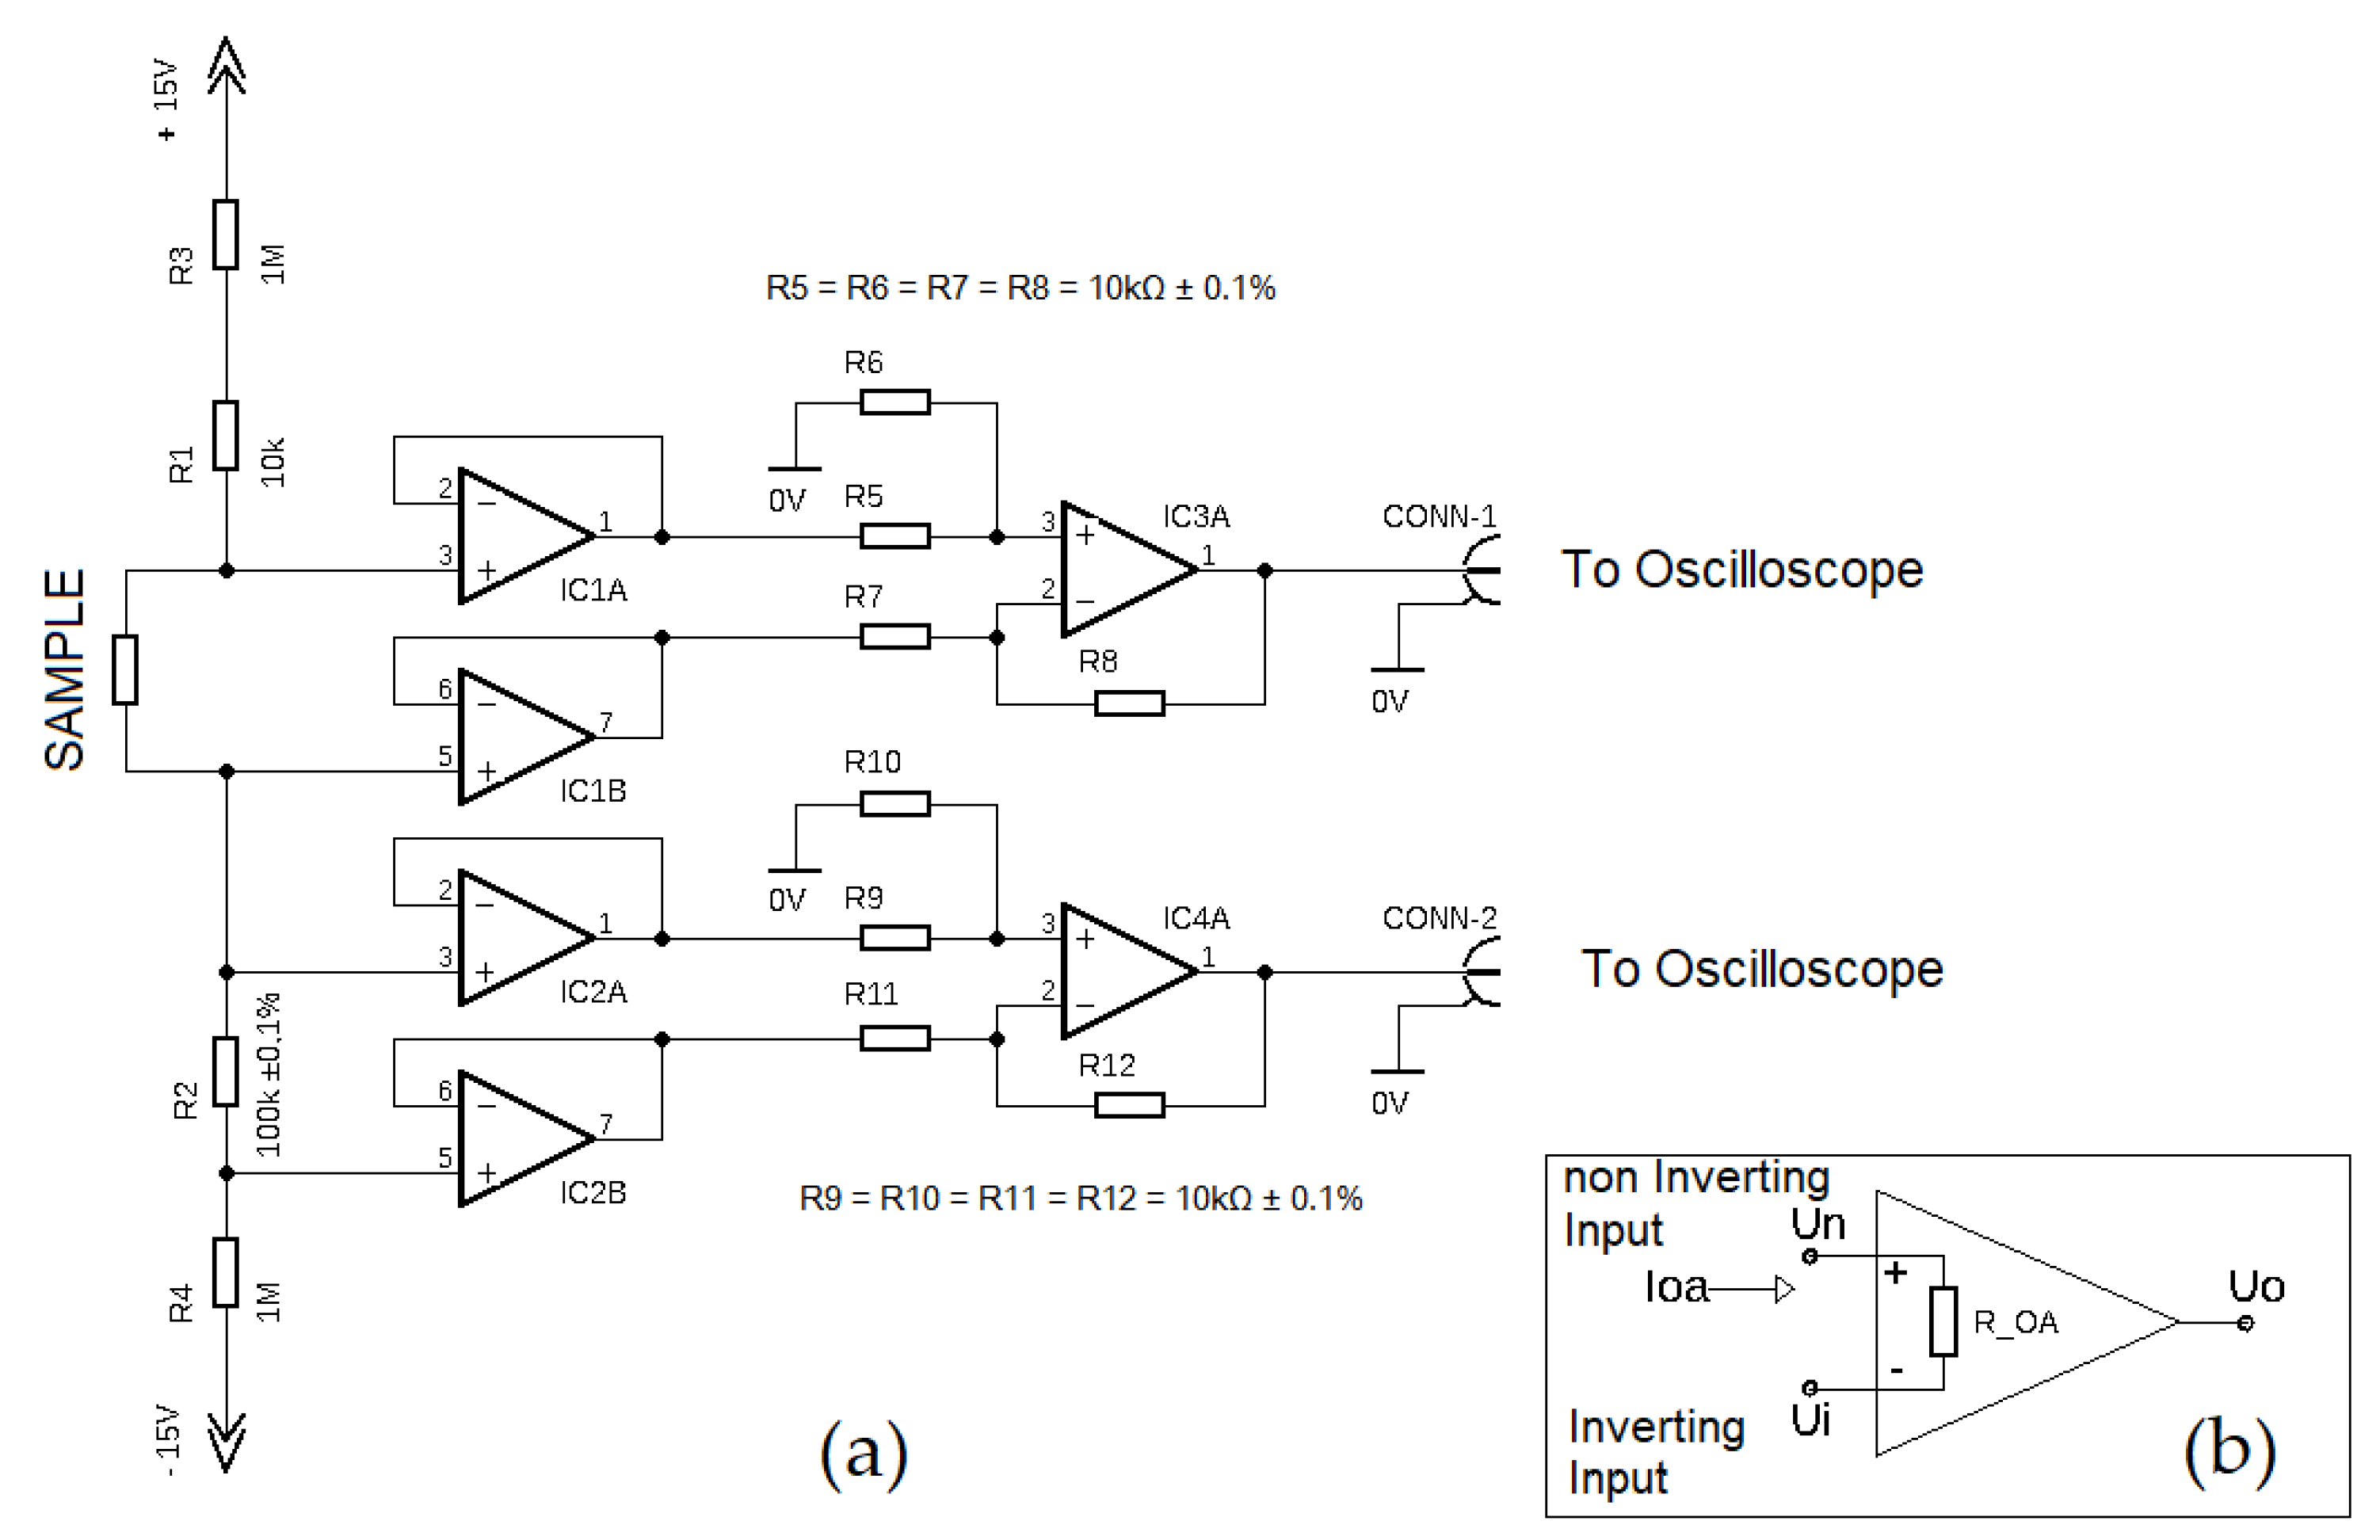
2.3. Electric Setup
3. Results and Discussions
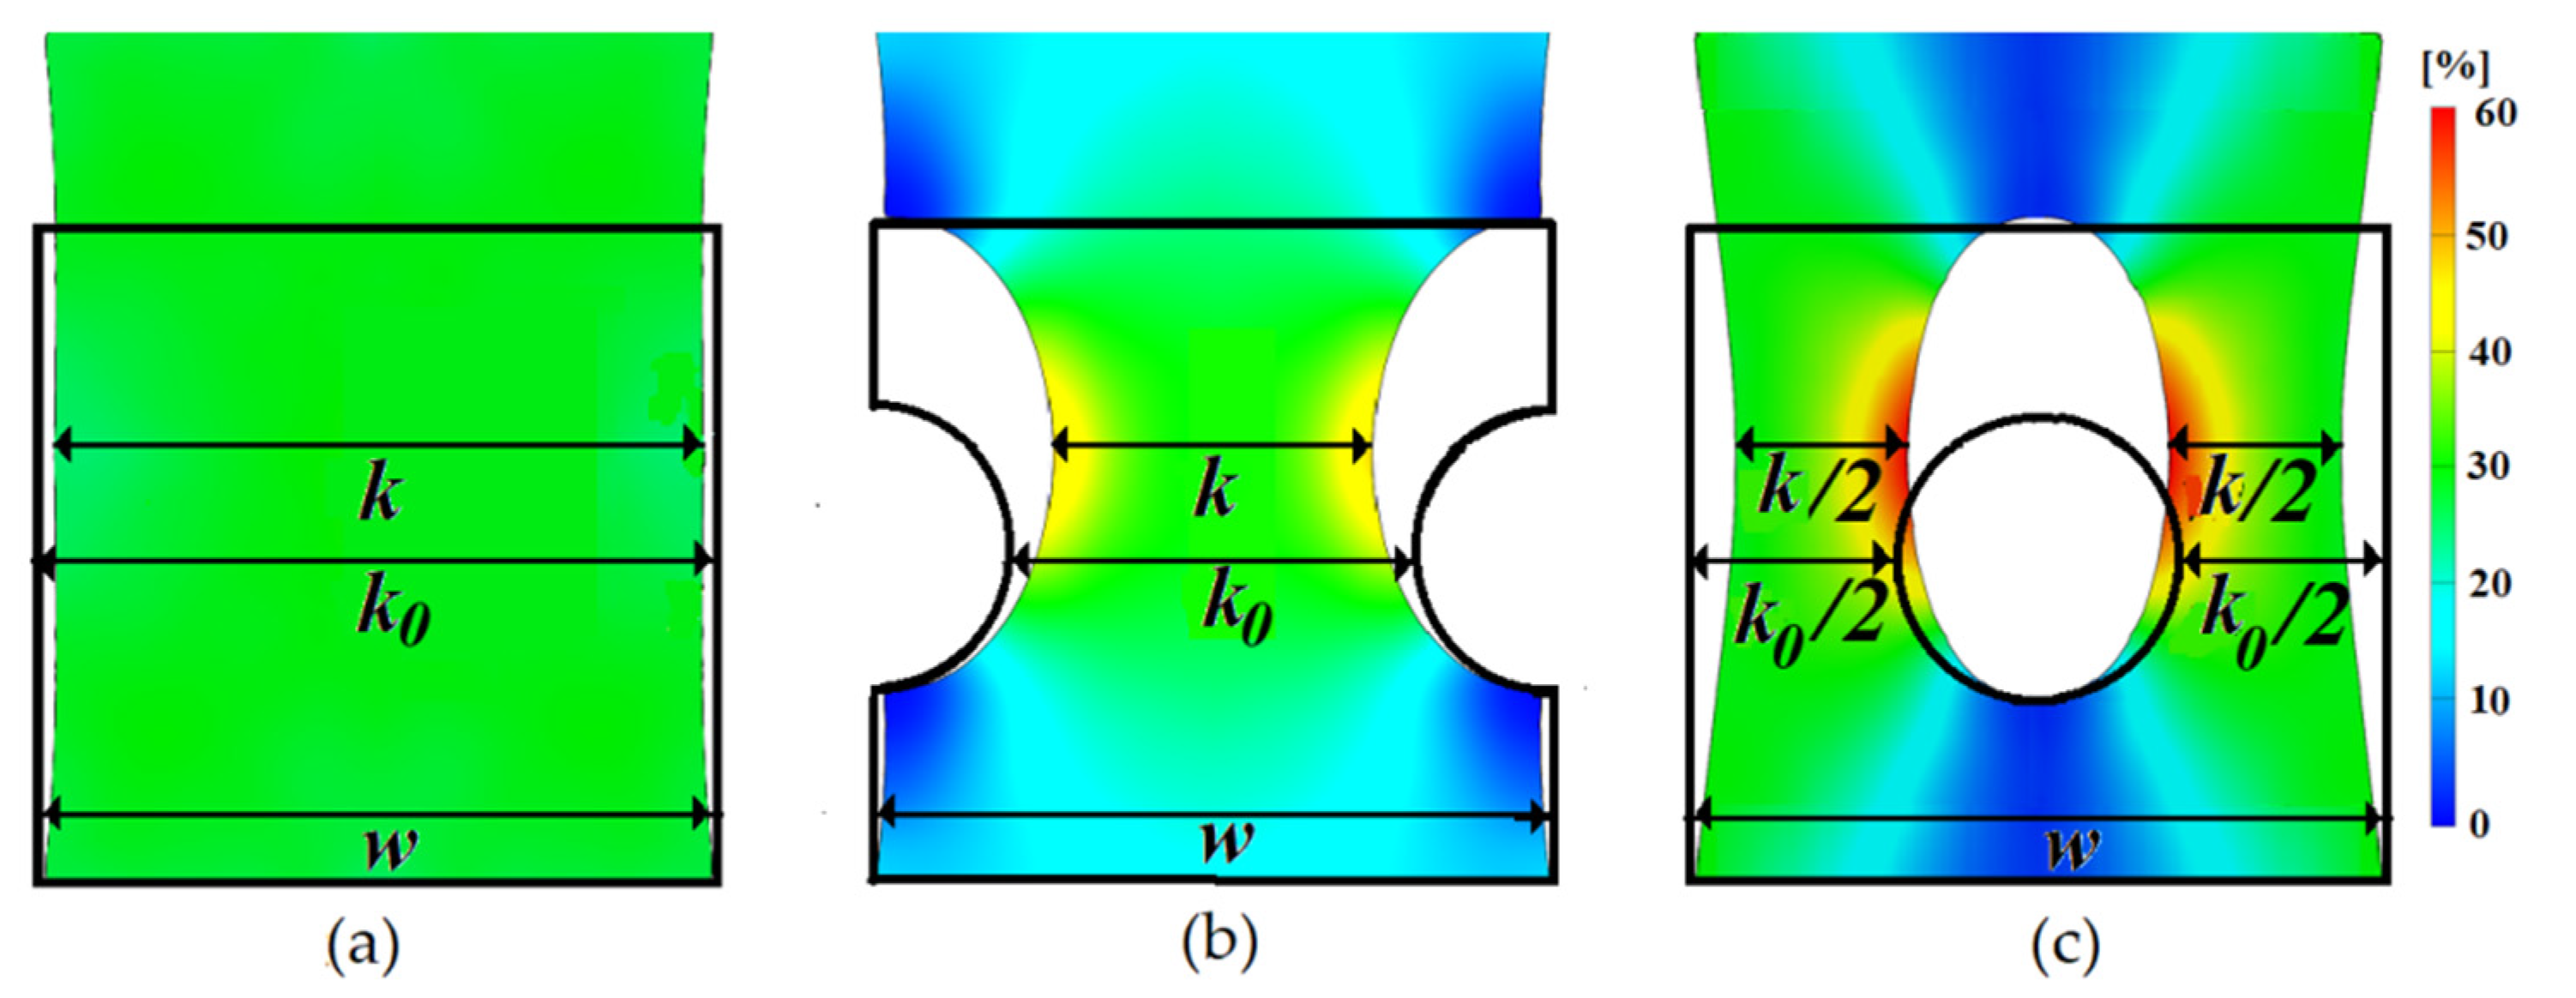
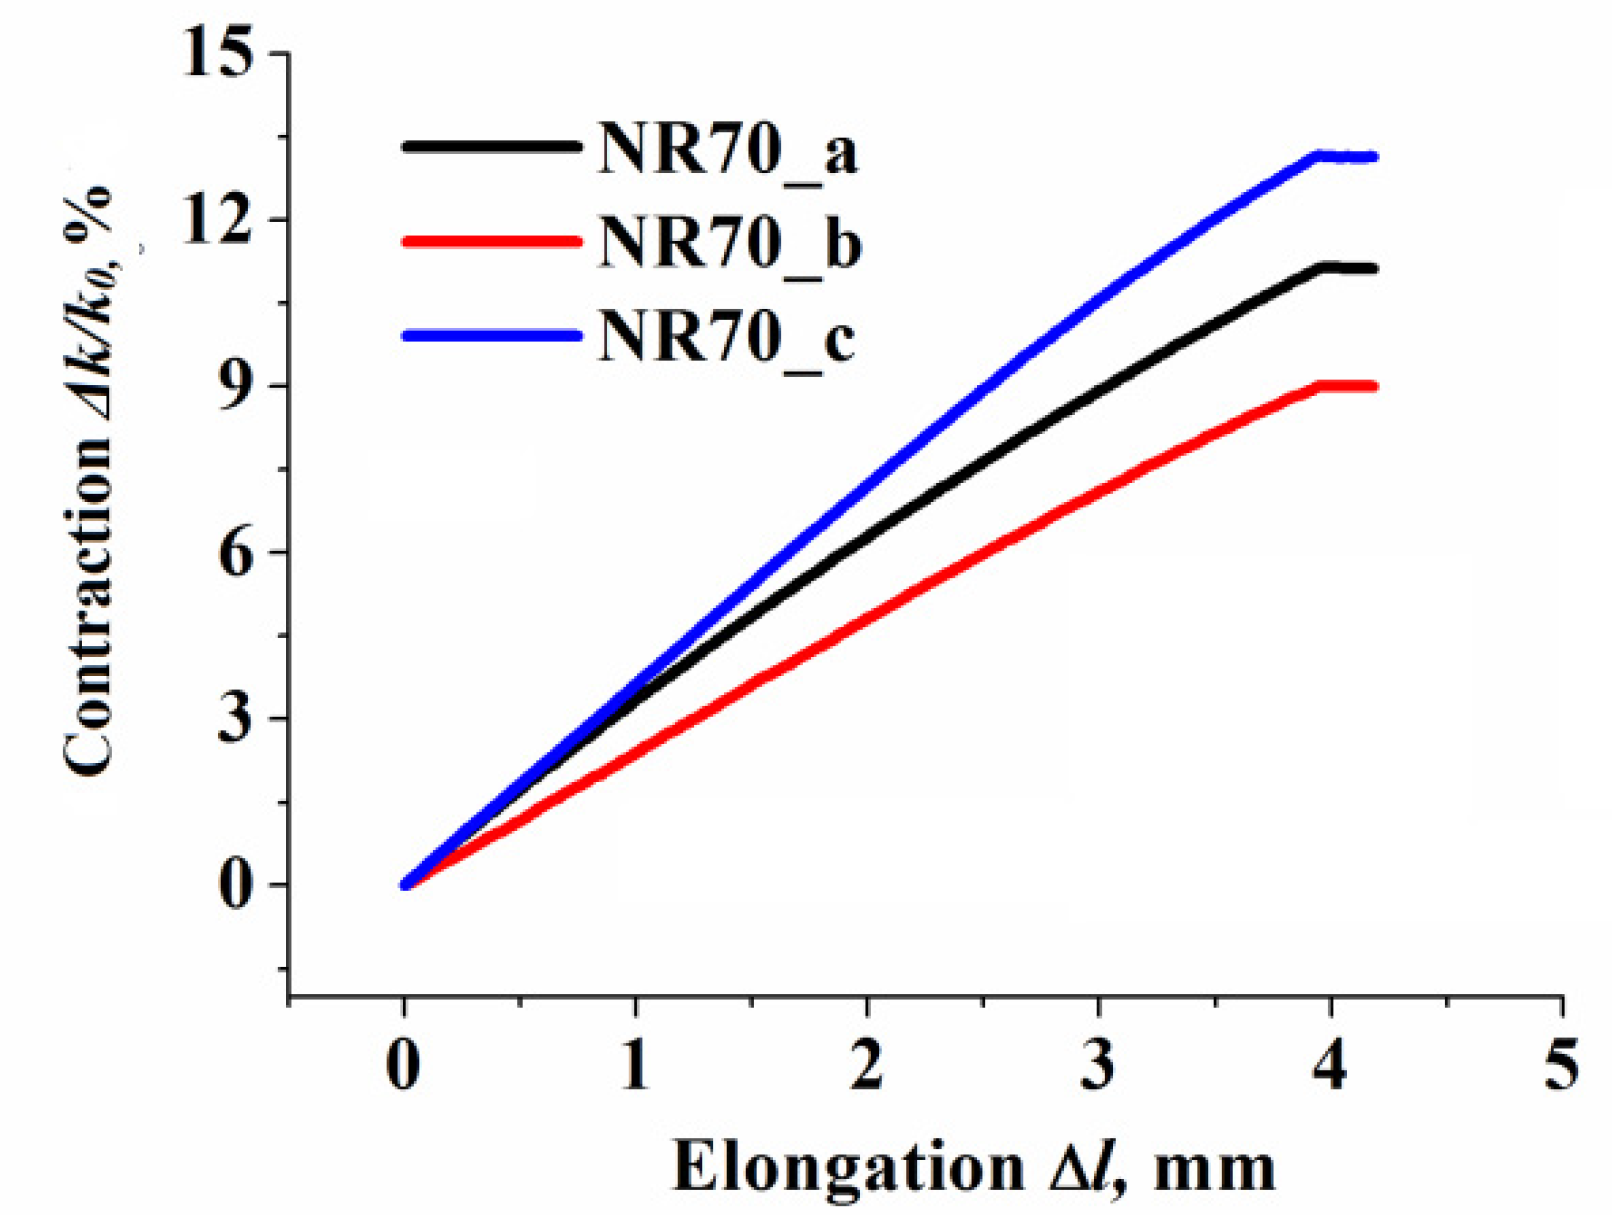
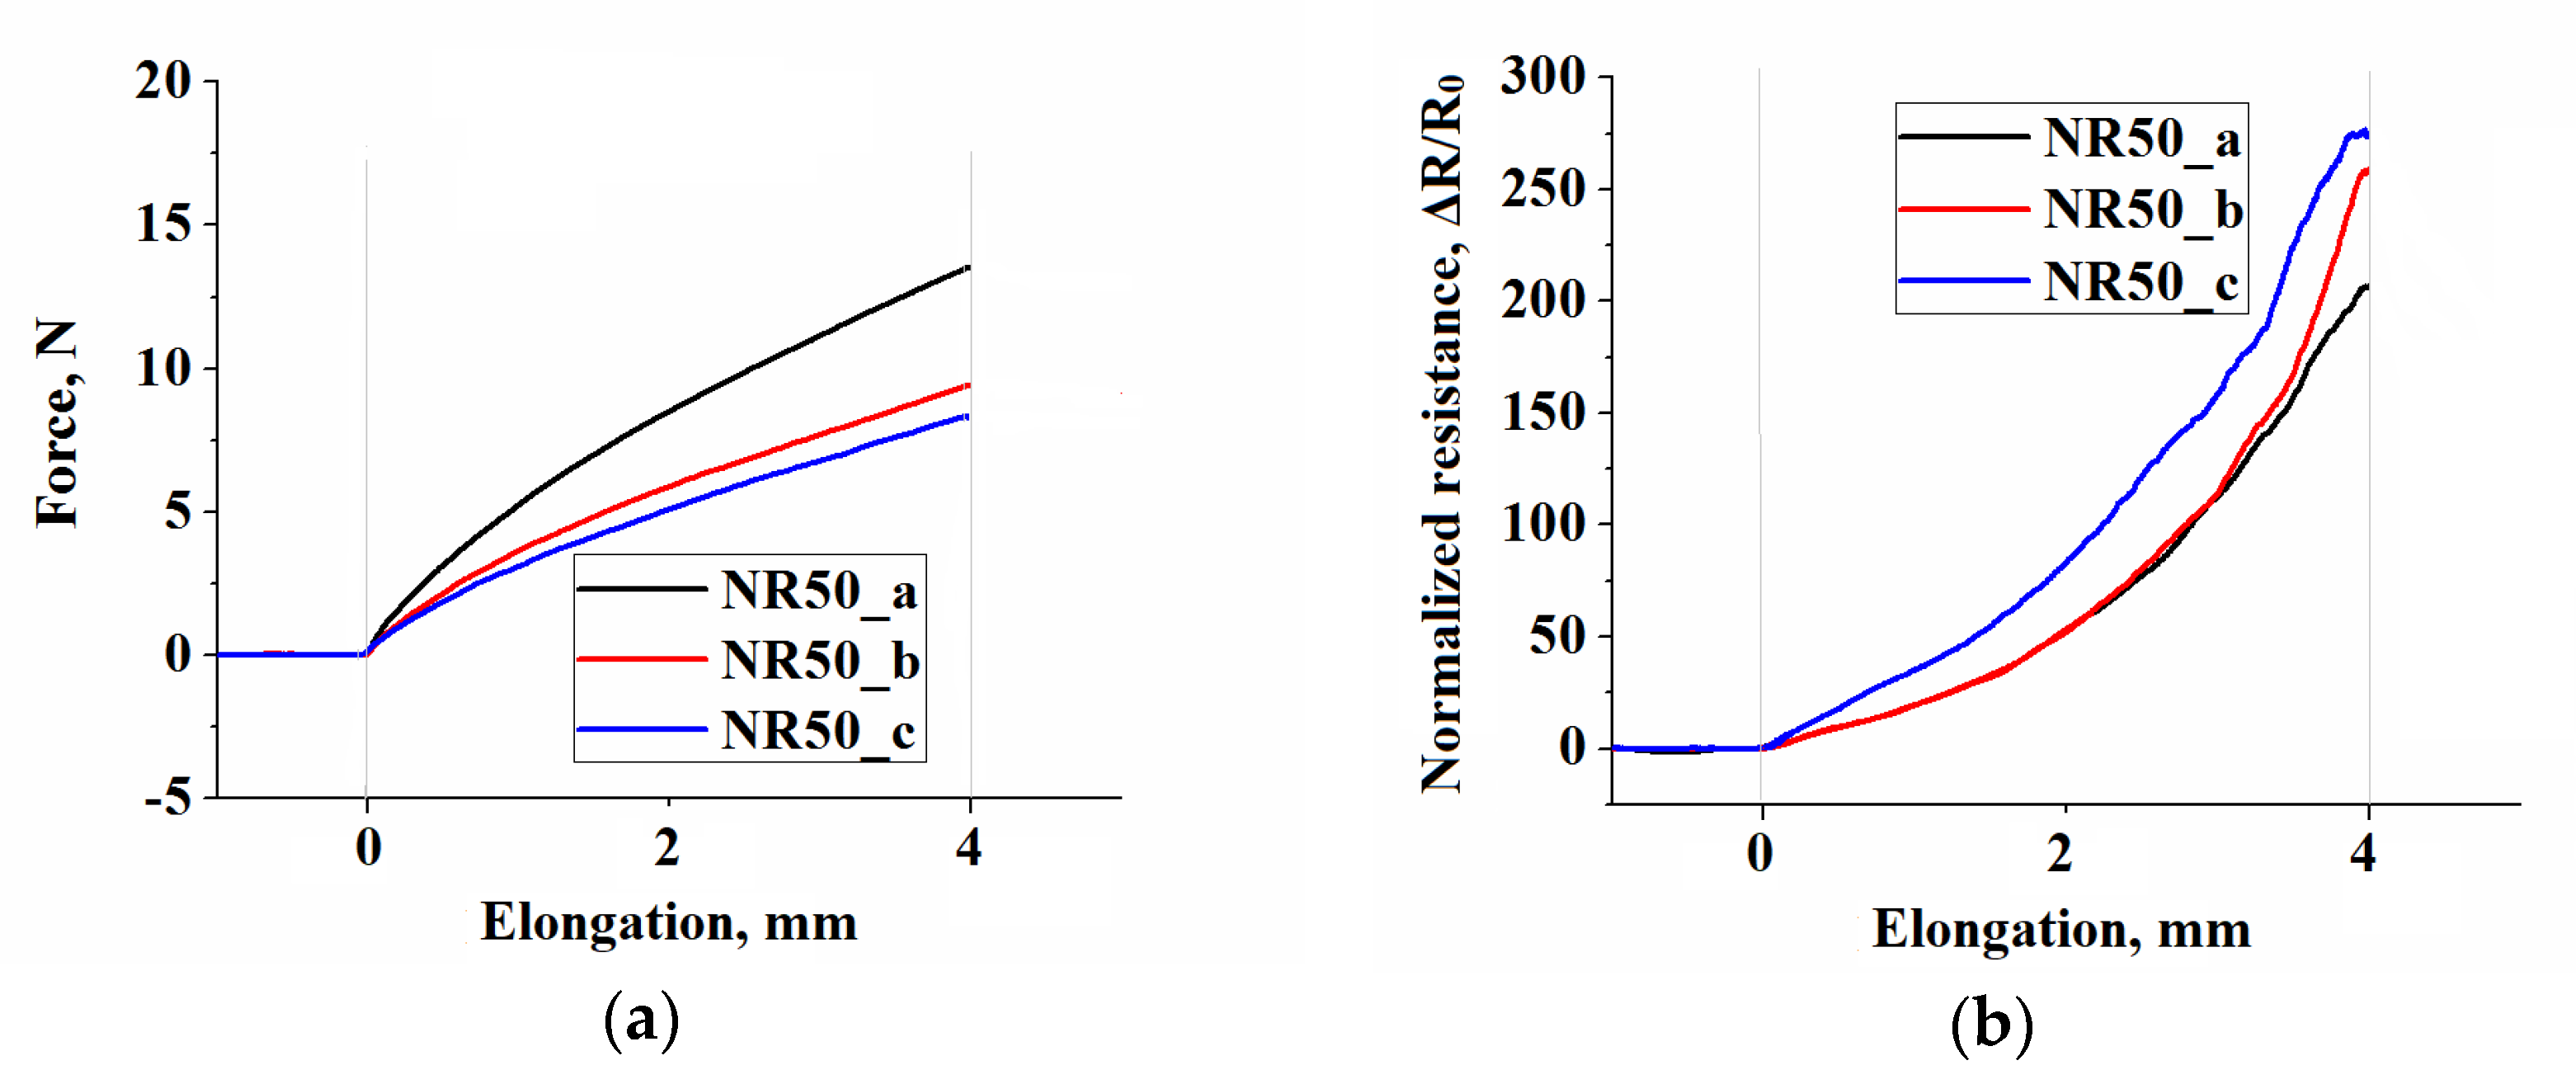
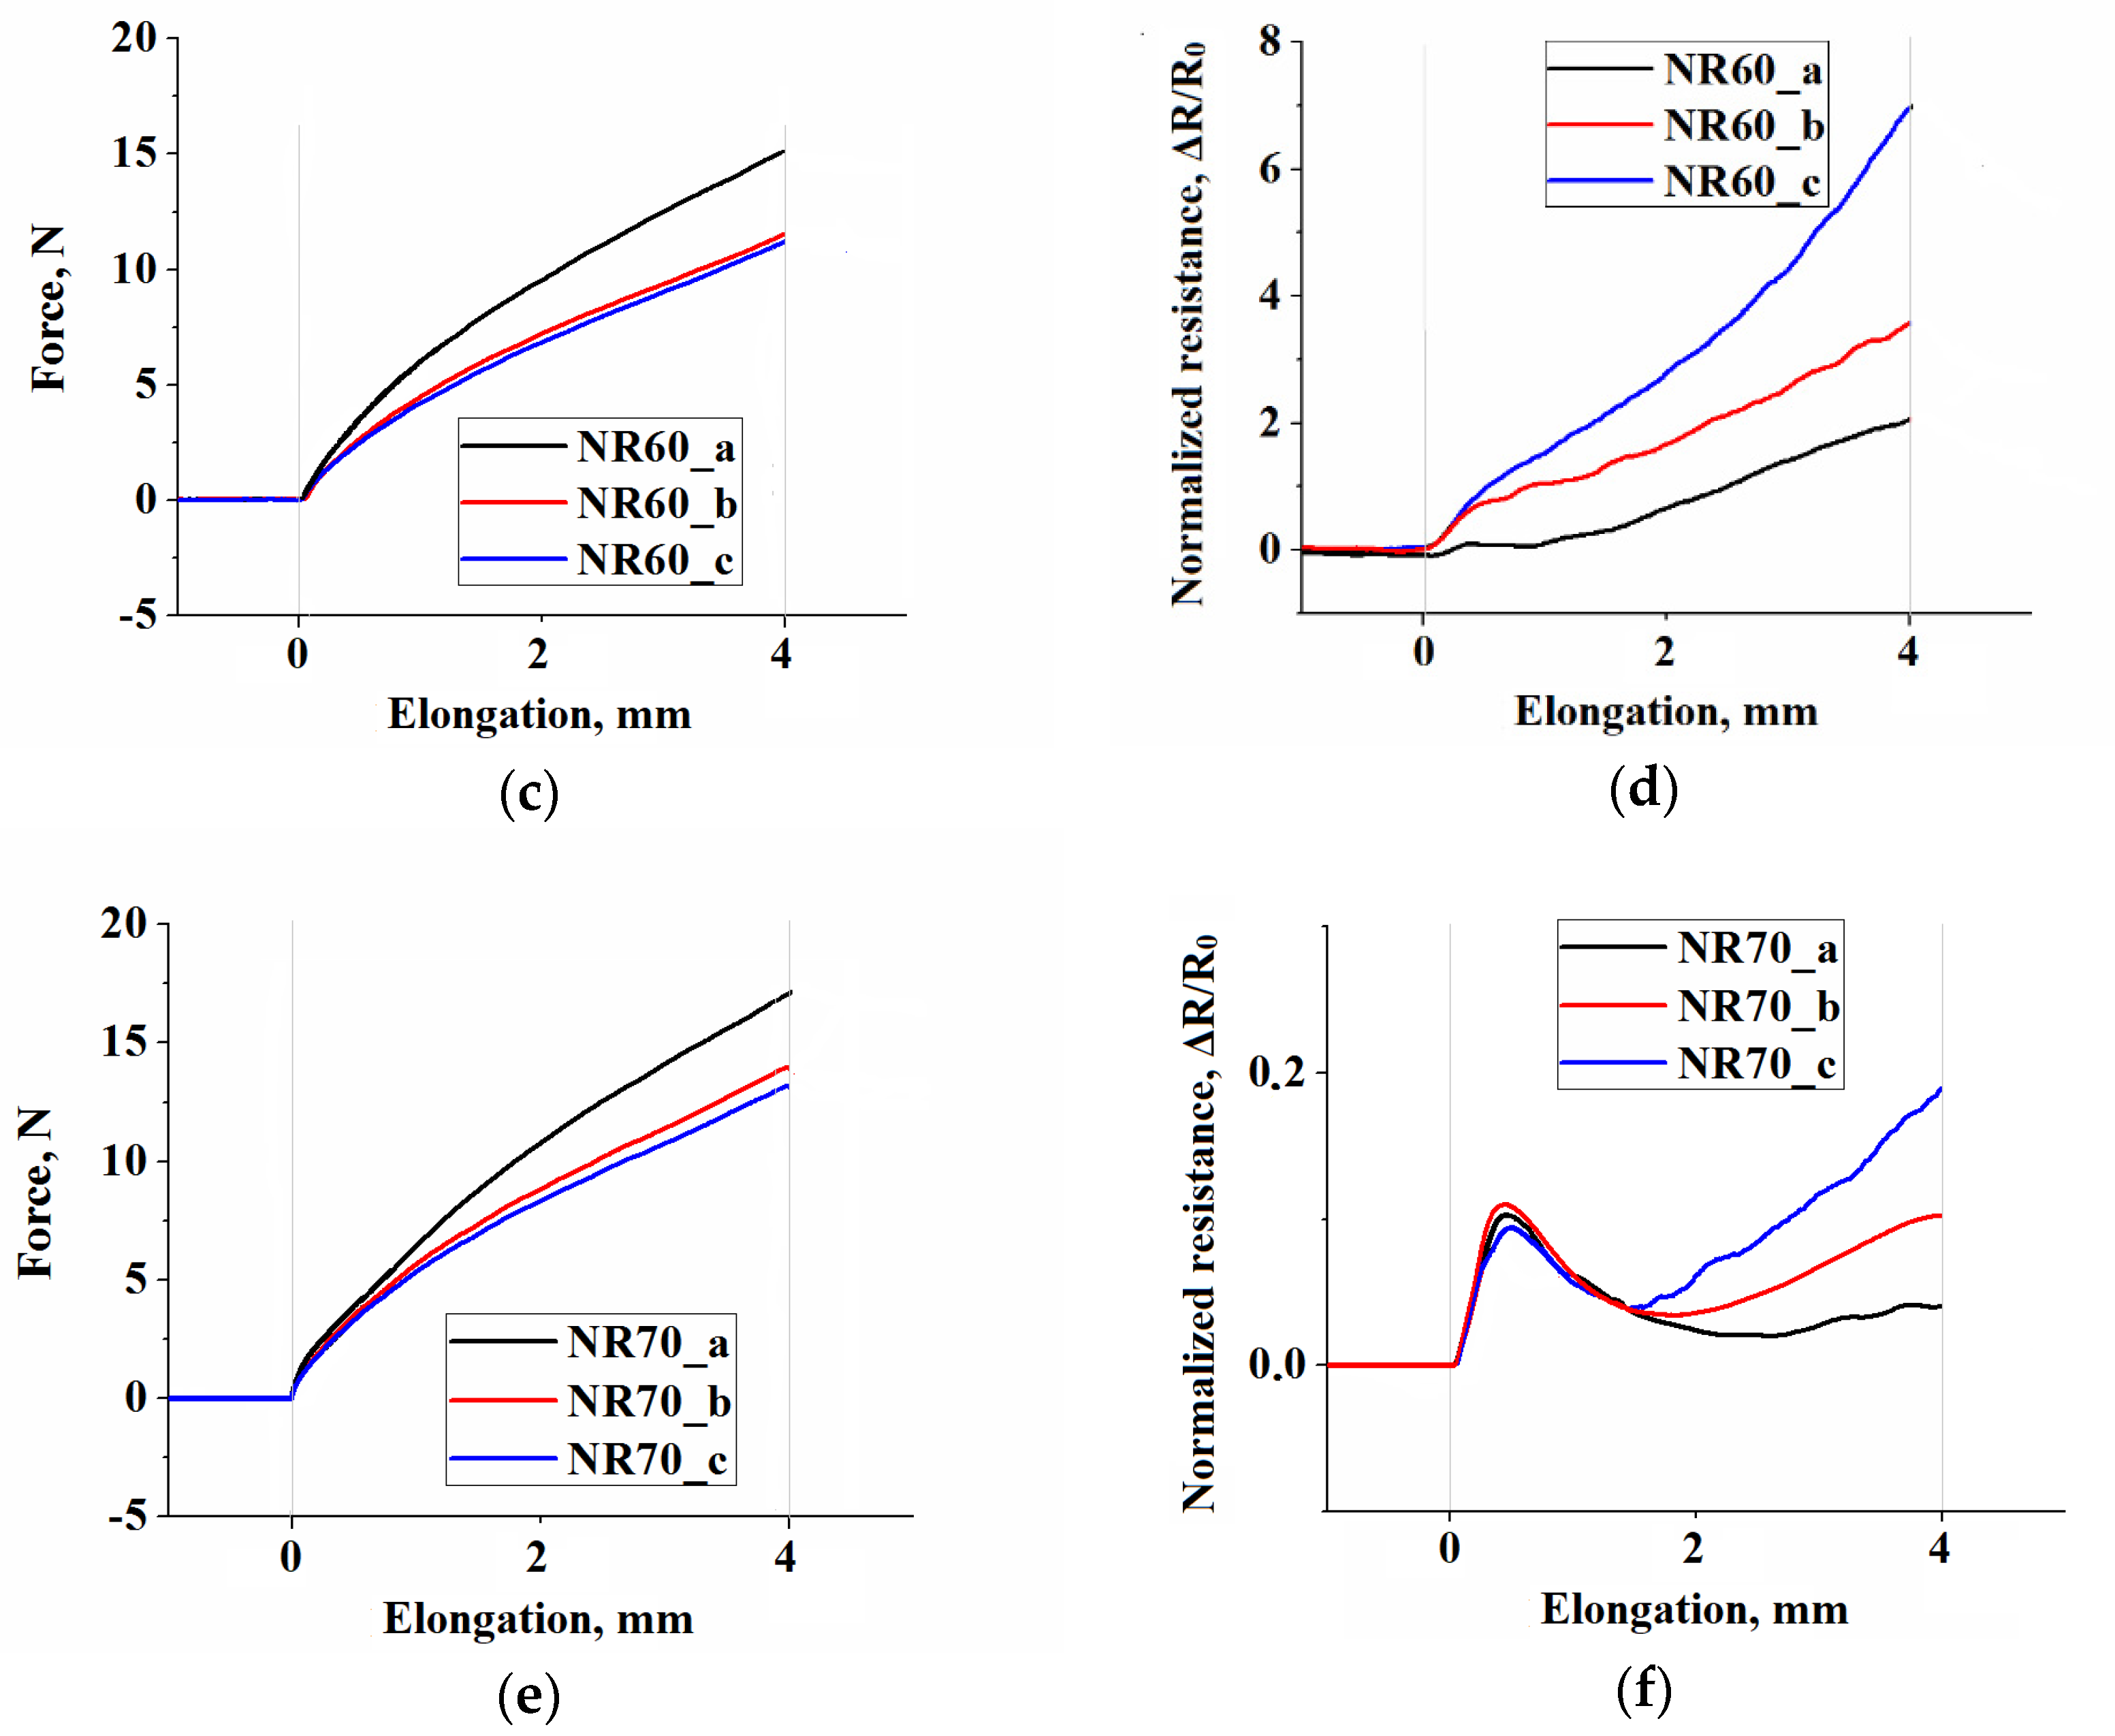
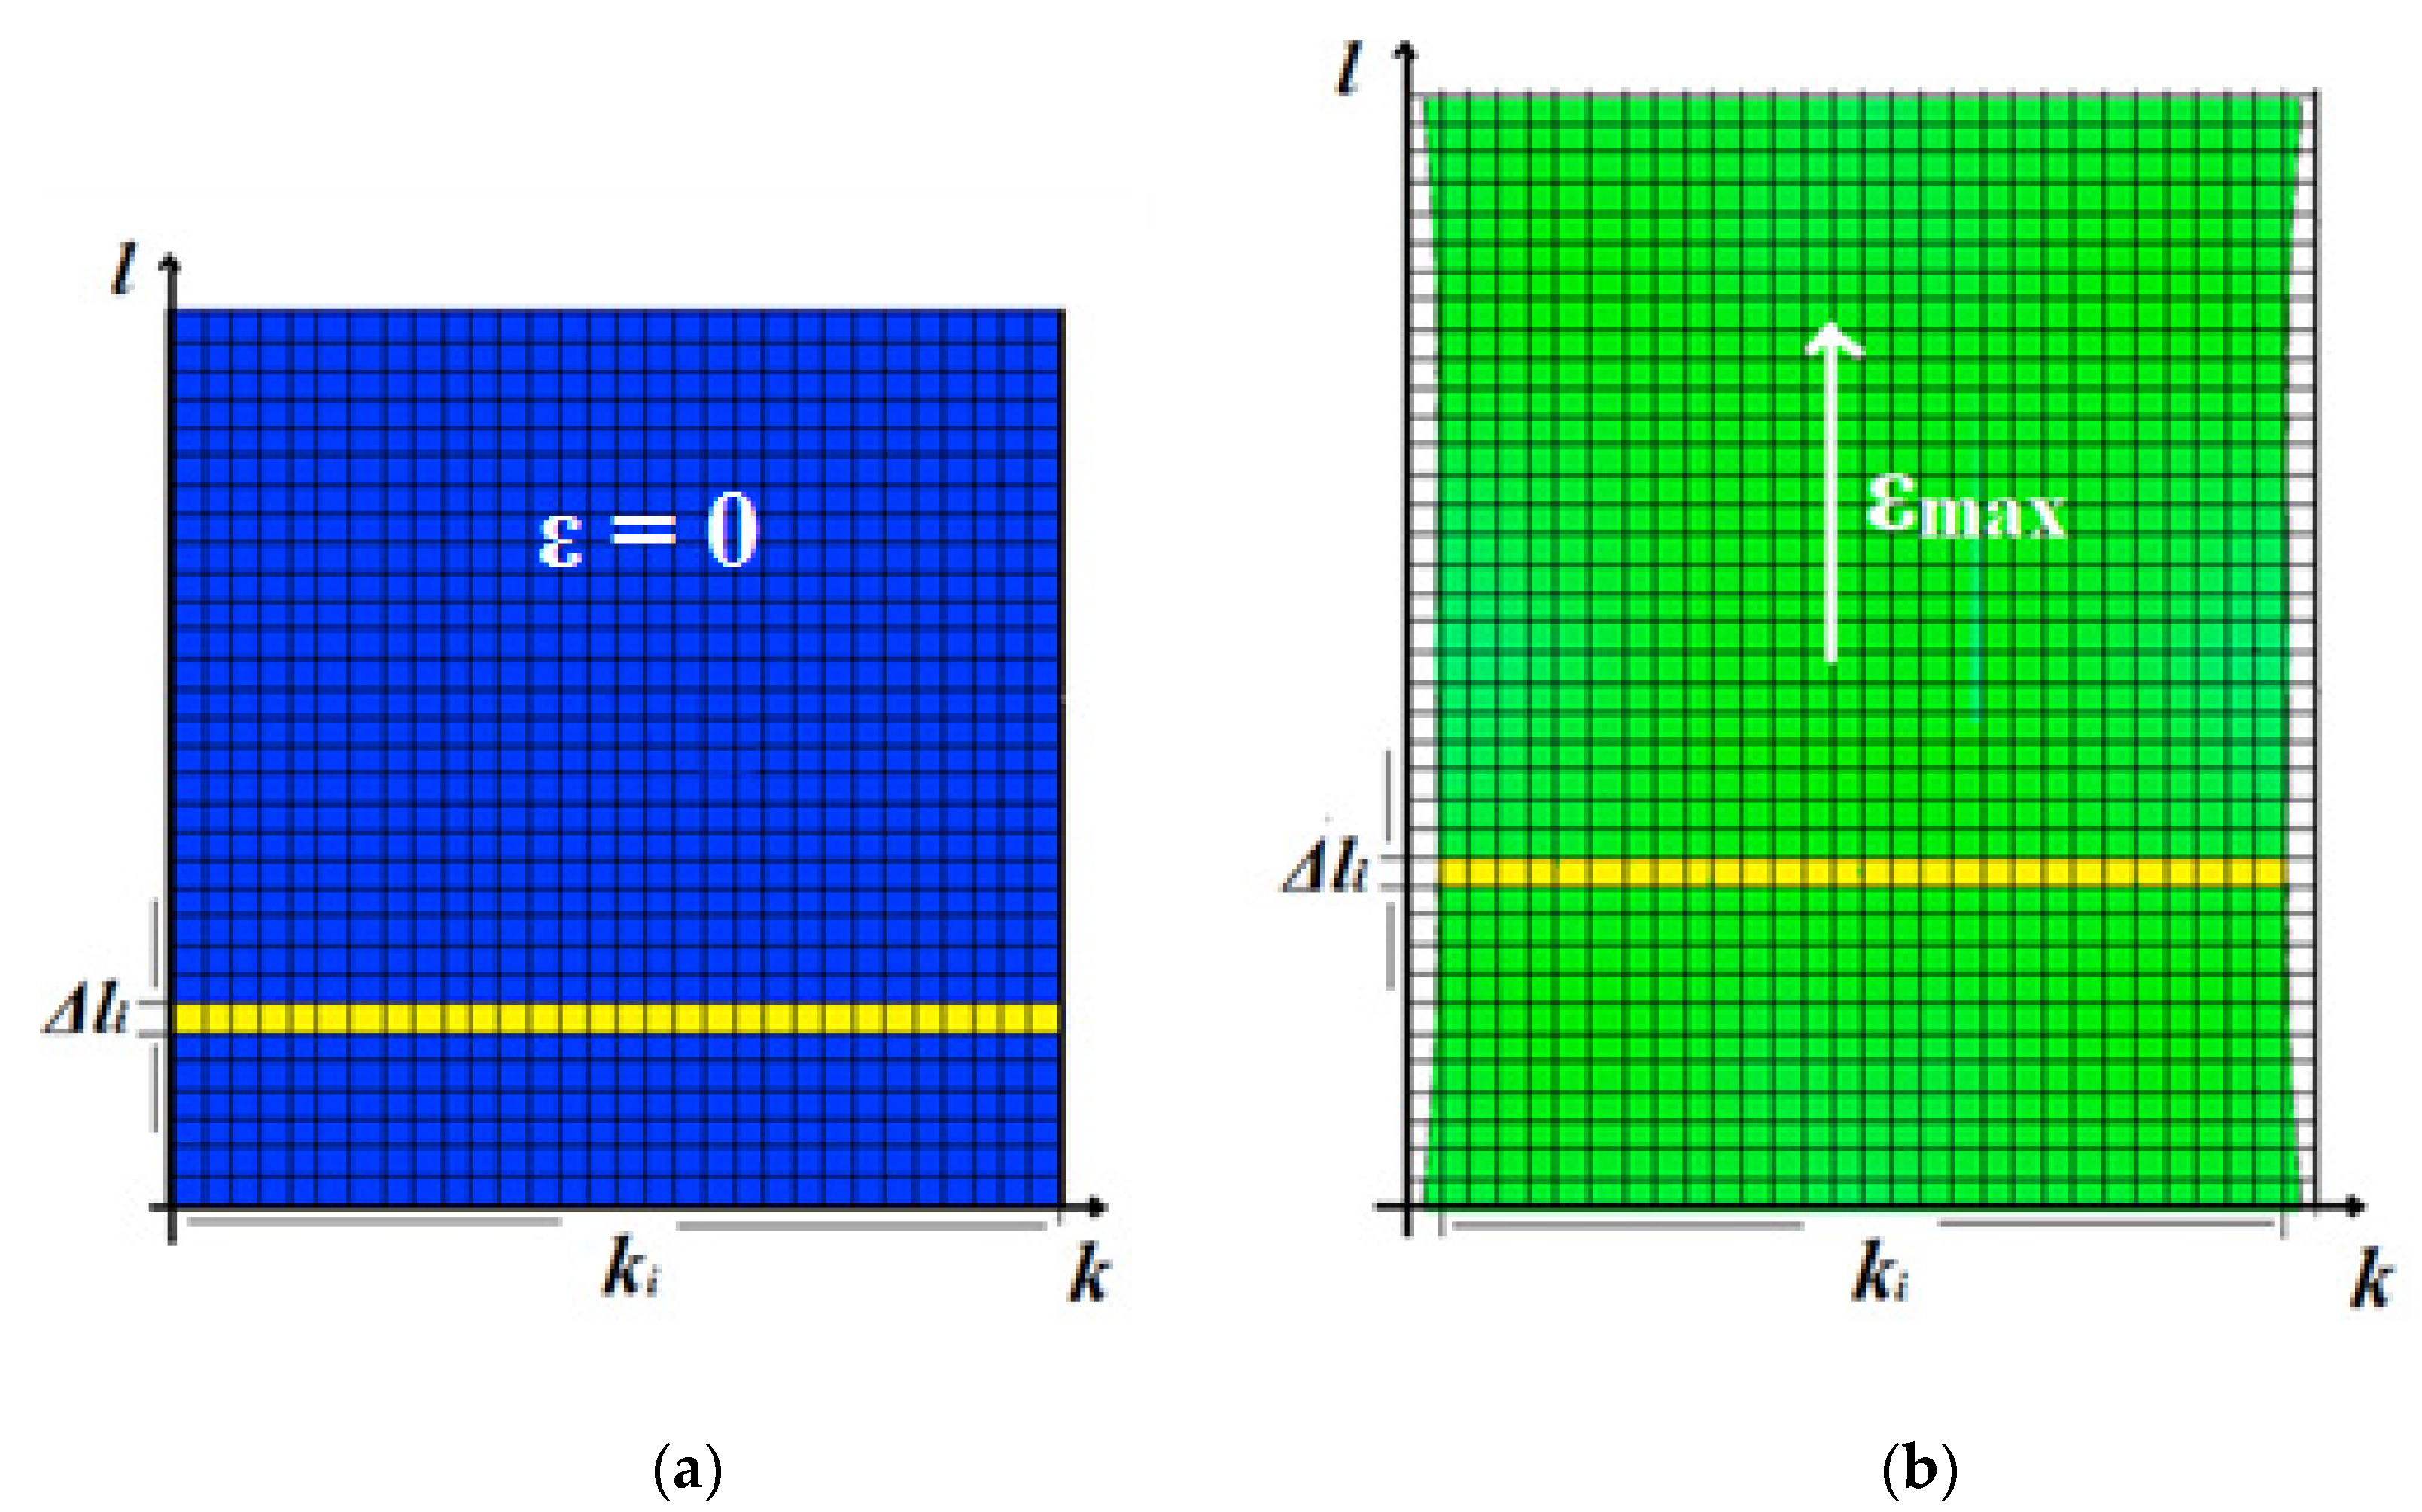
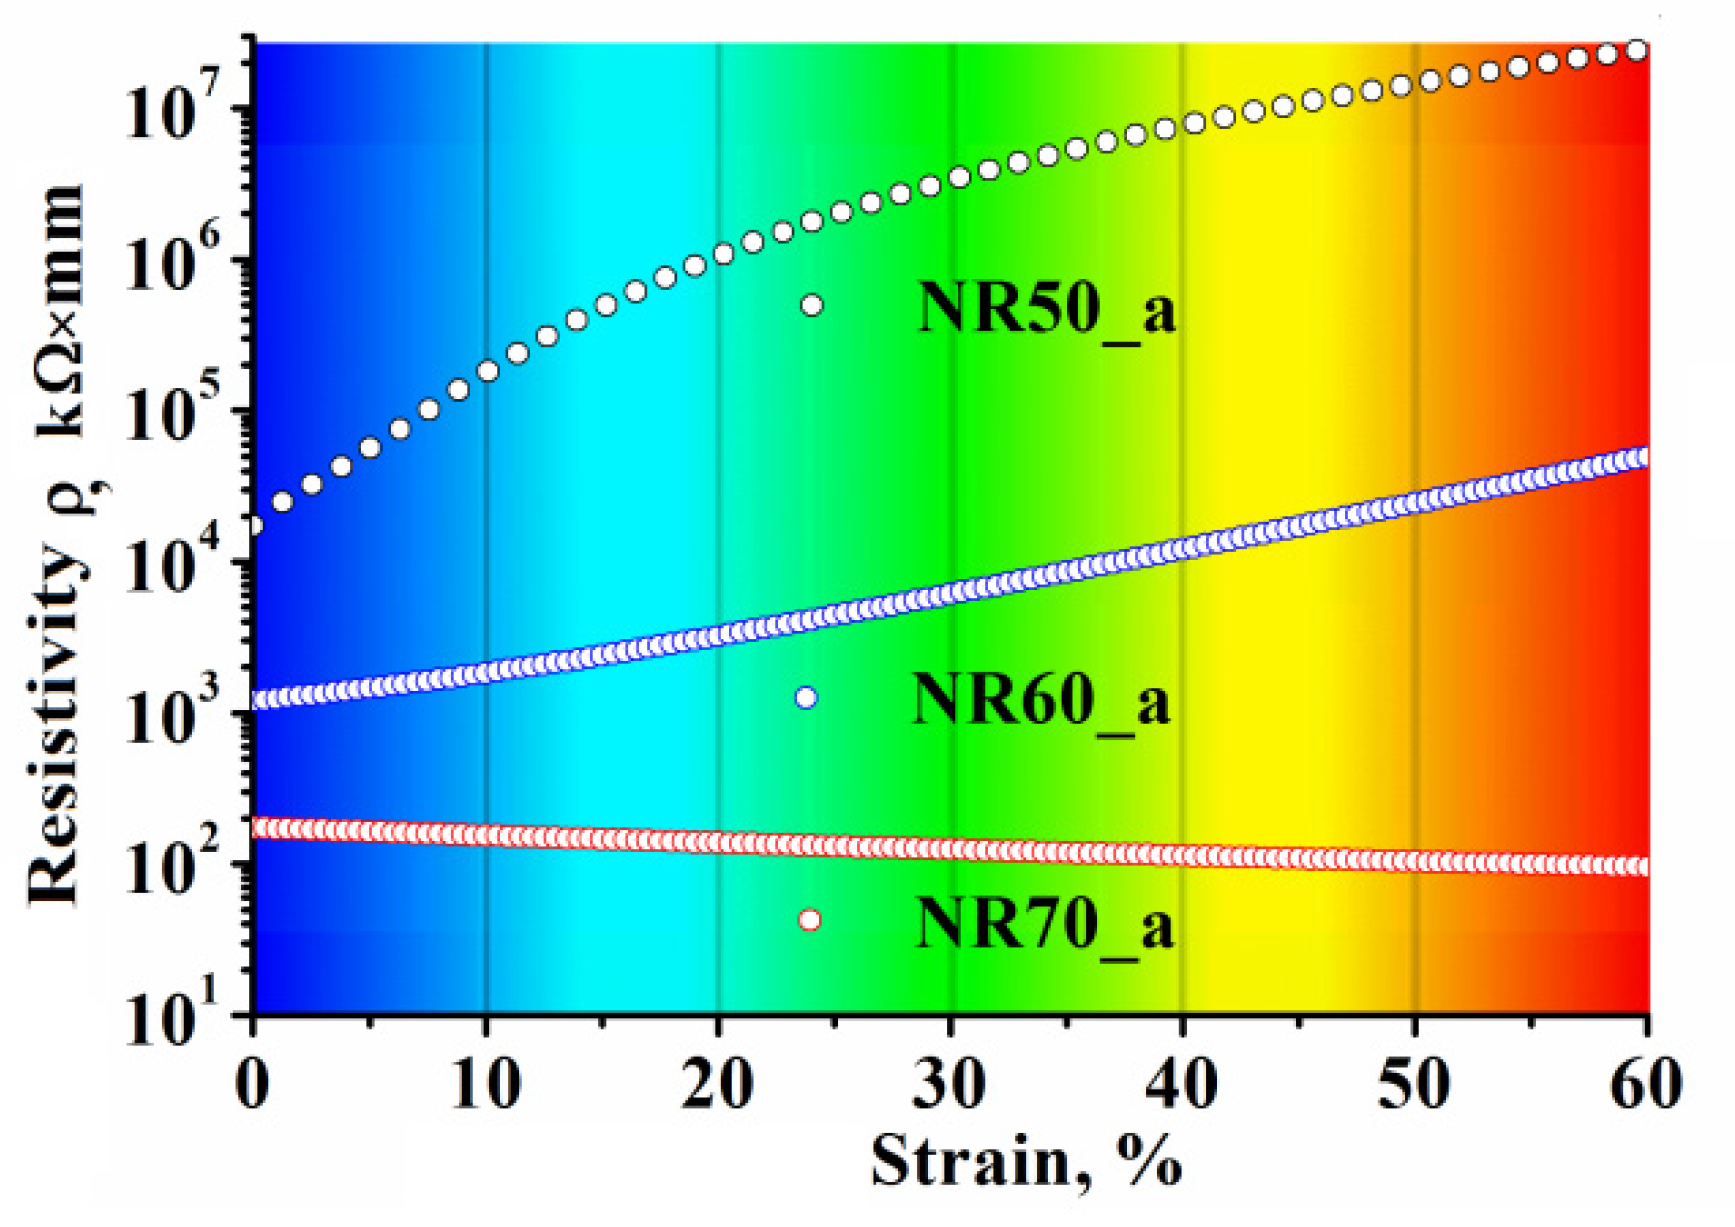
3.1. Local Strain Distribution and Measured EER
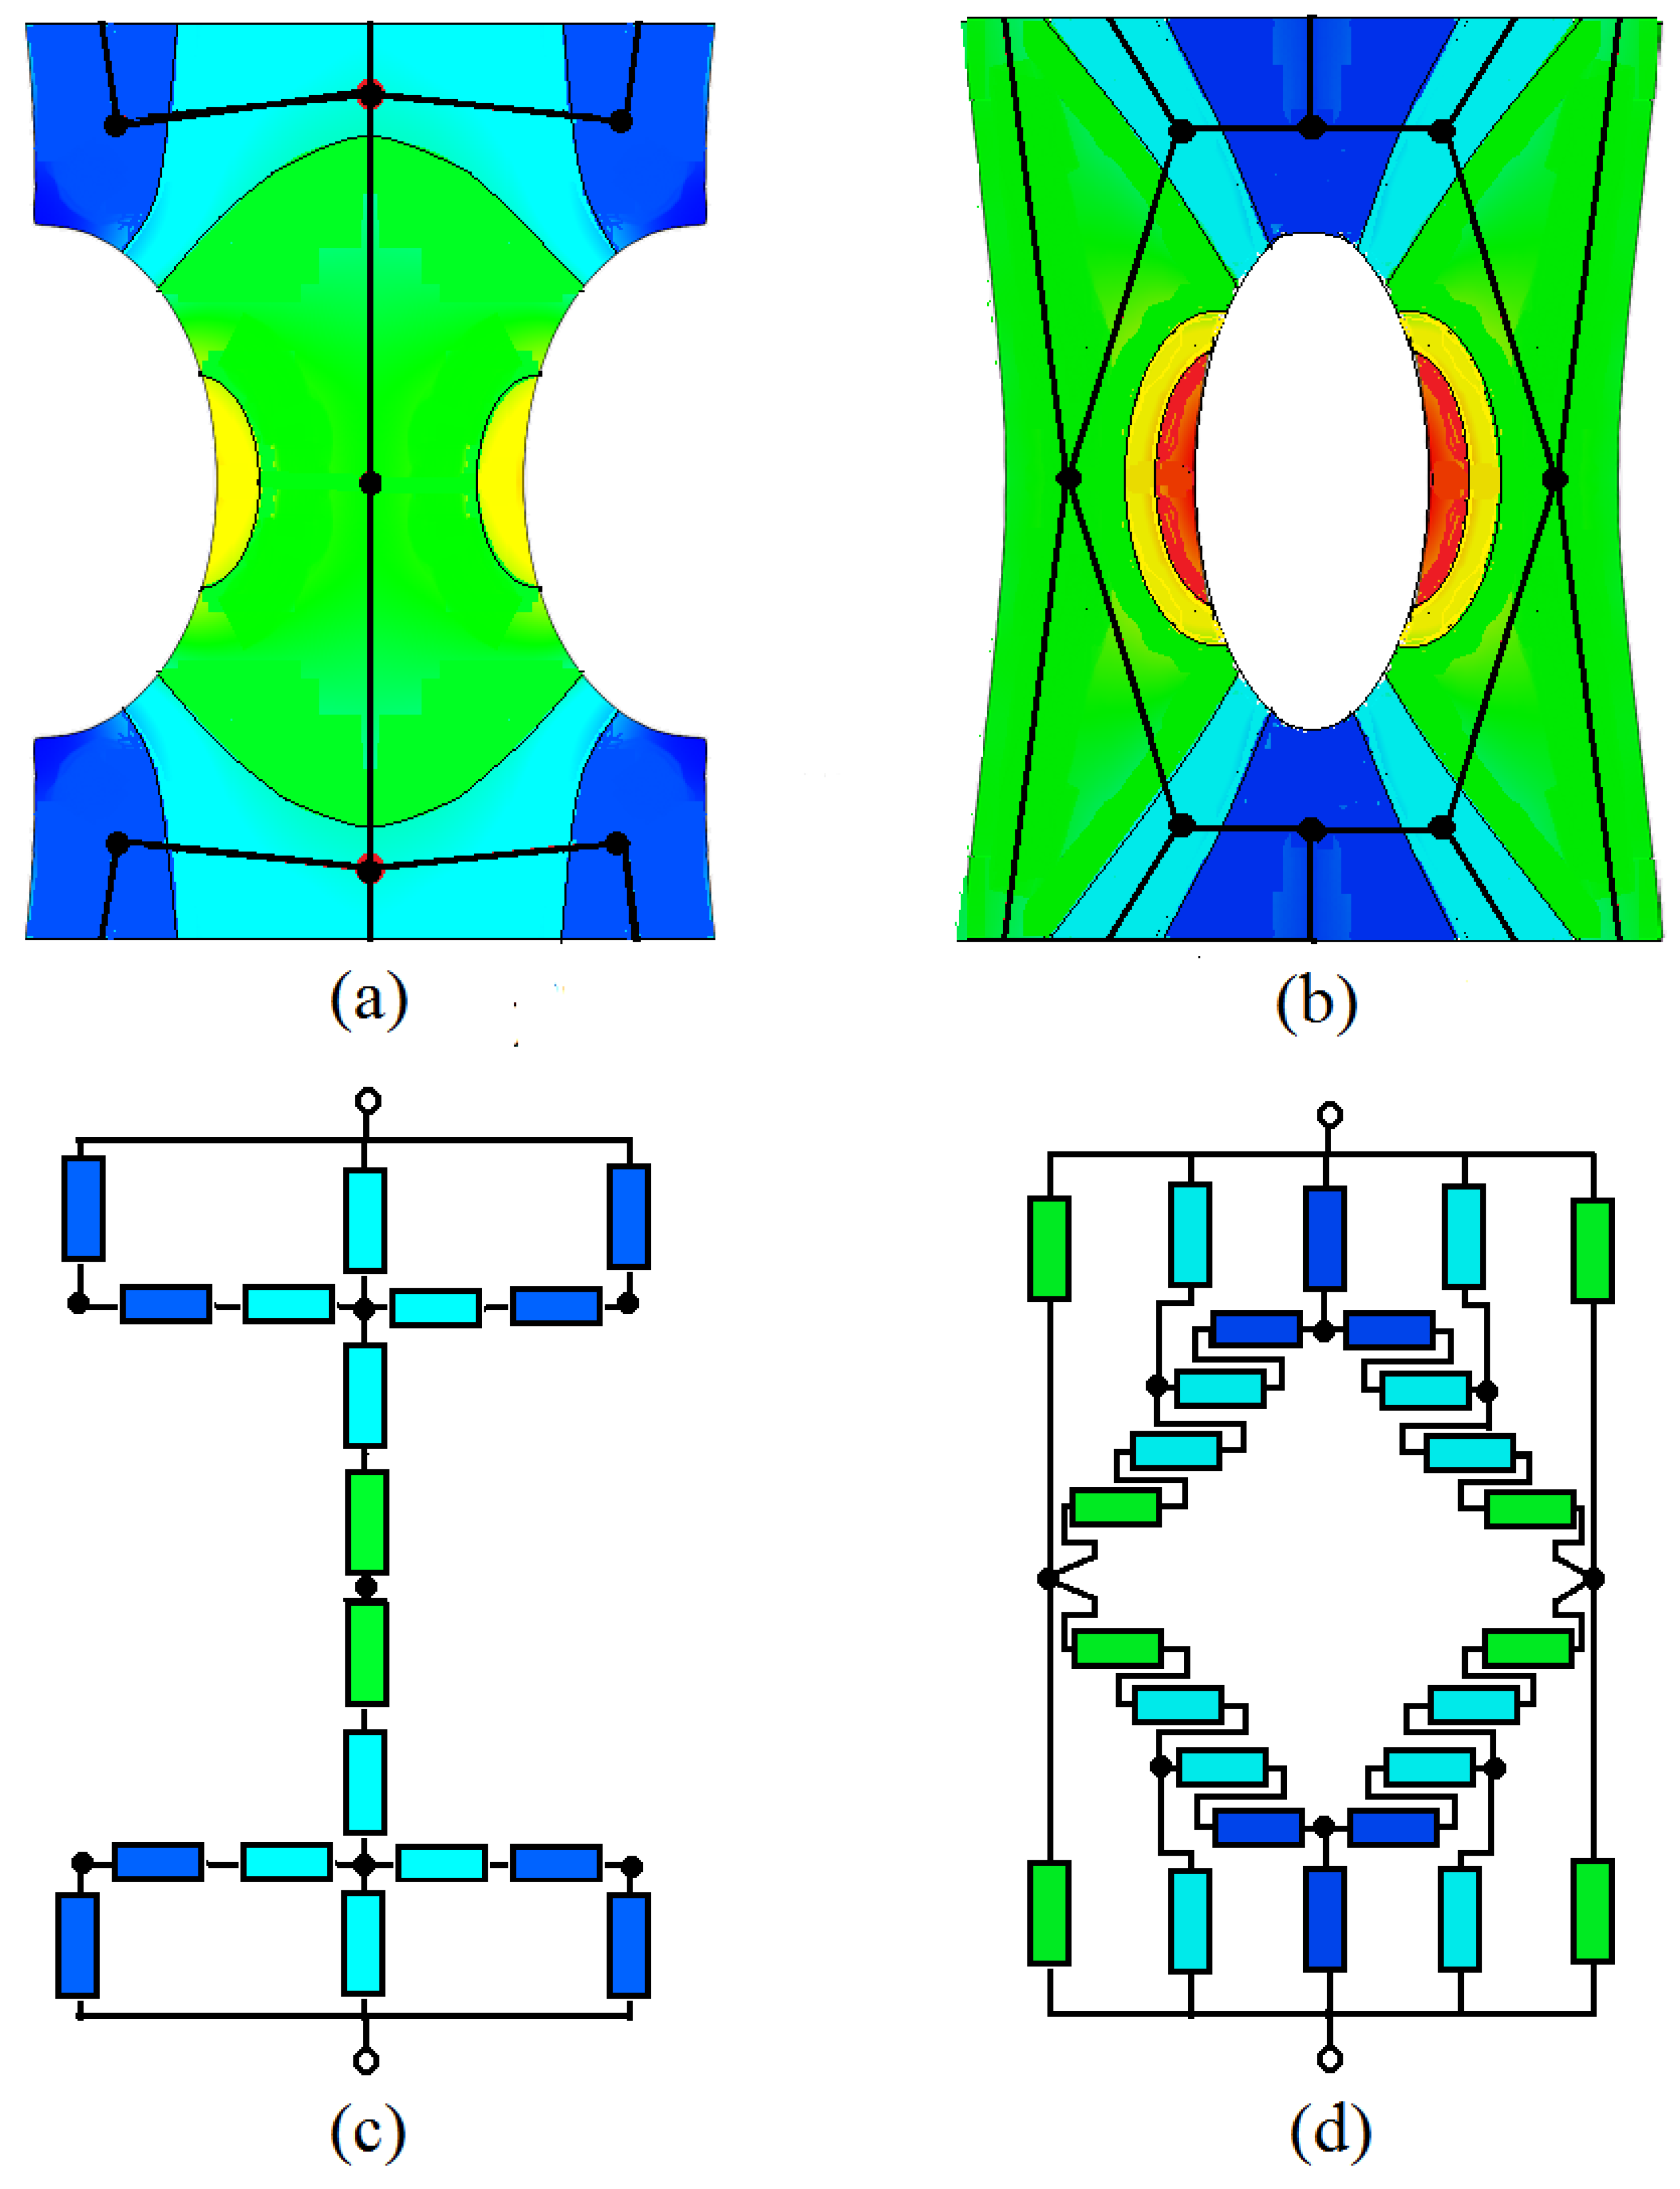
3.2. Current Propagation Mode Switching Effect
3.3. The Deformed Samples EER Estimation
4. Conclusions
Author Contributions
Funding
Institutional Review Board Statement
Data Availability Statement
Conflicts of Interest
Nomenclature
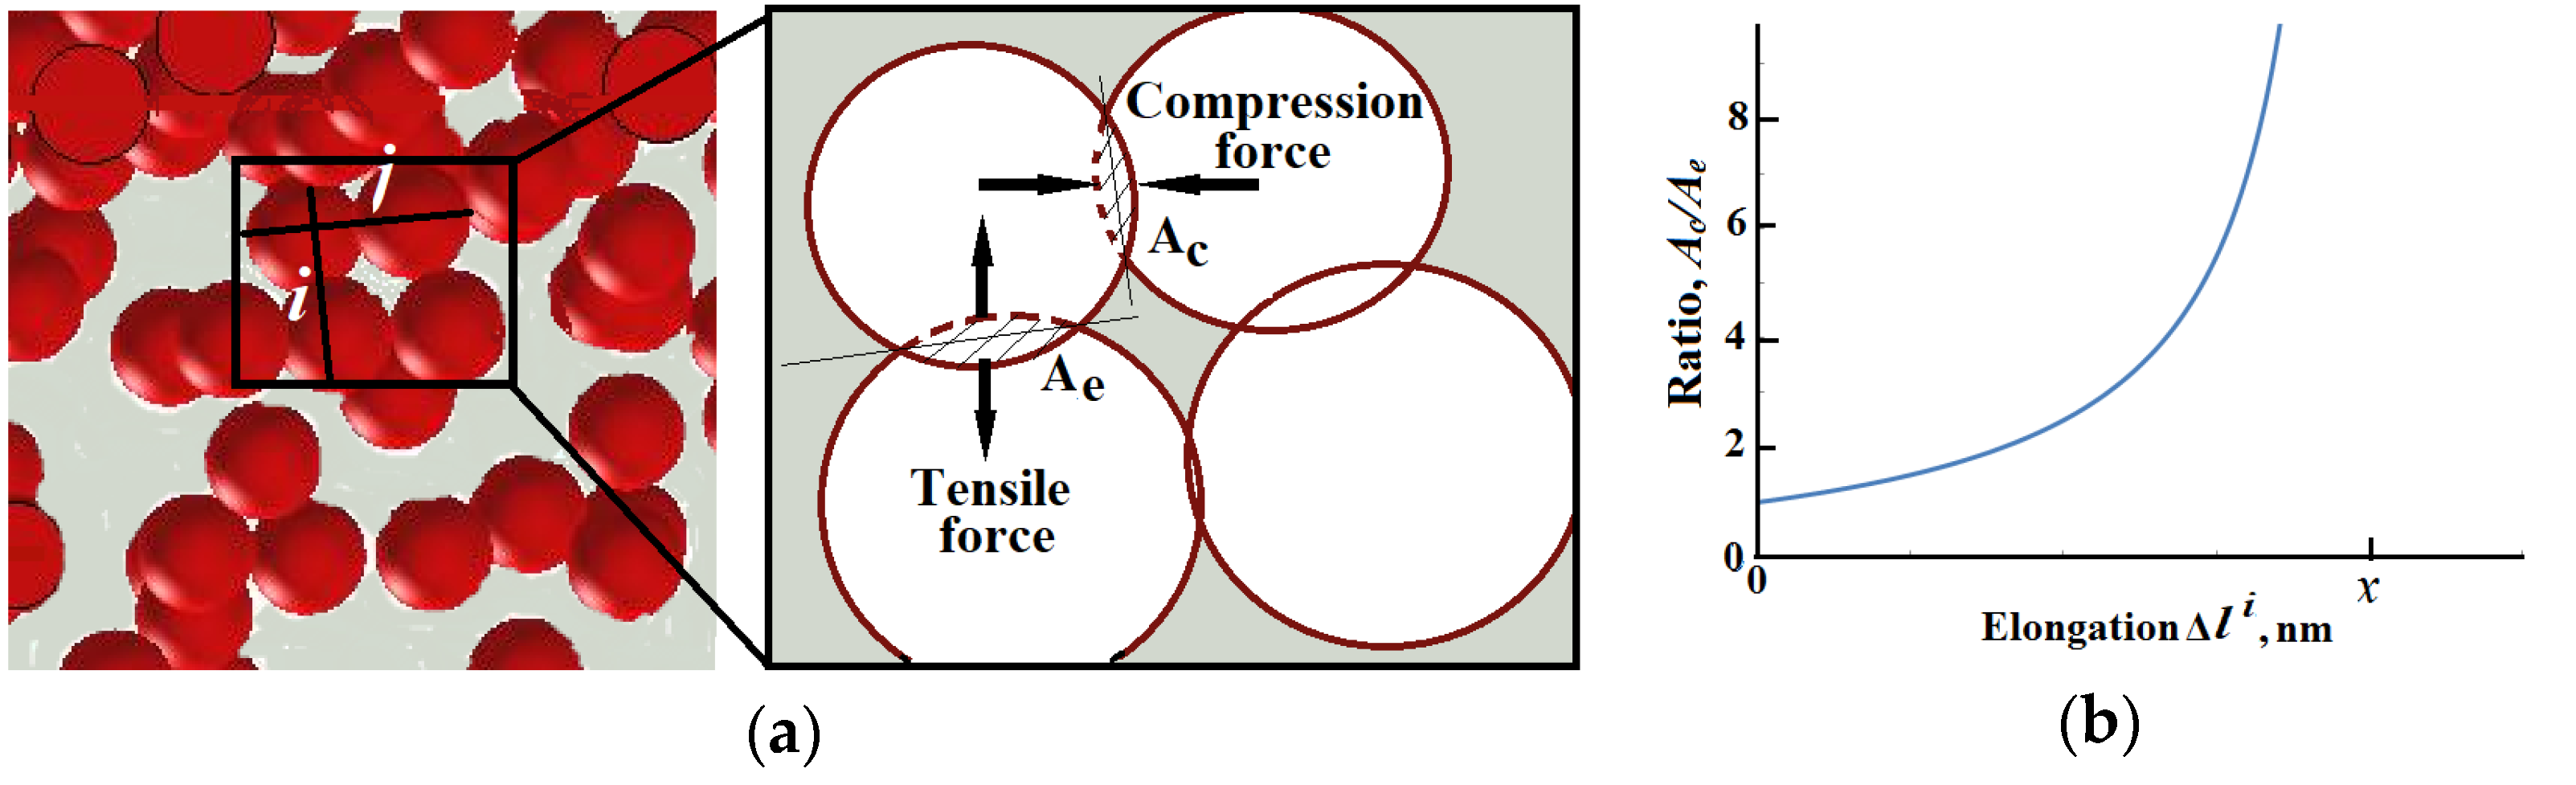
| Ac (nm2) | Contact area between CB particles, aligned perpendicular to the direction of sample contraction. |
| Ae (nm2) | Contact area between CB particles, aligned perpendicular to the direction of sample strain |
| Au (-) | Open loop voltage amplifying coefficient |
| d (mm) | Thickness of sample |
| Δk (mm) | Contraction of sample |
| (nm) | The contraction between two particles forming couple j |
| Δl (mm) | Elongation of sample |
| (nm) | The elongation between two particles forming couple i |
| (mm) | Length of cell i for an imaginary sample partition |
| ΔR/R0 (-) | Normalized resistance |
| (mm) | The width of the sample in position i |
| (A) | The input current passing through operational amplifier |
| Is (A) | Current going through the sample |
| l (mm) | Length of sample |
| ν (-) | Poisson’s ratio |
| Rs (Ω) | Resistance of the sample |
| ROA (Ω) | Internal resistance of operational amplifier |
| (Ωm) | Resistivity |
| Us (V) | Voltage drop across the sample |
| Ui (V) | Inverting input voltage |
| Uo (V) | Output voltage |
| w (mm) | Width of sample |
| x (nm) | The penetration depth between two arbitrary CB particles |
Abbreviations
| AC | Alternating current |
| CB | Carbon black |
| CBS | N-cyclohexyl-2-benzothiazolesulfenamide |
| DIC | Digital Image Correlation |
| DC | Direct current |
| EER | Effective electric resistance |
| EMT | Effective medium theory |
| ERN | Equivalent resistor network |
| HAF | High abrasion furnace |
| NR | Natural rubber |
| OA | Operational amplifier |
| phr | Parts per hundred rubber |
| SIC | Strain induced crystallization |
| ZnO | Zinc oxide |
References
- Wang, S.L.; Wang, P.; Ding, T.H. Piezoresistivity of silicone-rubber/carbon black composites excited by AC electrical field. J. Appl. Polym. Sci. 2009, 113, 337–341. [Google Scholar] [CrossRef]
- Natarajan, T.S.; Eshwaran, S.B.; Stöckelhuber, K.W.; Wießner, S.; Pötschke, P.; Heinrich, G.; Das, A. Strong Strain Sensing Performance of Natural Rubber Nanocomposites. ACS Appl. Mater. Interfaces 2017, 9, 4860–4872. [Google Scholar] [CrossRef] [PubMed]
- Liu, P.; Liu, C.X.; Huang, Y.; Wang, W.H.; Fang, D.; Zhang, Y.G.; Ge, Y.J. Transfer function and working principle of a pressure/temperature sensor based on carbon black/silicone rubber composites. J. Appl. Polym. Sci. 2016, 133, 42979. [Google Scholar] [CrossRef]
- Ciselli, P.; Lu, L.; Busfield, J.; Peijs, T. Piezoresistive polymer composites based on EPDM and MWNTs for strain sensing applications. e-Polymers 2010, 10, 1–13. [Google Scholar] [CrossRef] [Green Version]
- Bakošová, D. The Study of the Distribution of Carbon Black Filler in Rubber Compounds by Measuring the Electrical Conductivity. Manuf. Technol. 2019, 19, 366–370. [Google Scholar] [CrossRef]
- Myles, T.D.; Peracchio, A.A.; Chiu, W.K.S. Extension of anisotropic effective medium theory to account for an arbitrary number of inclusion types. J. Appl. Phys. 2017, 117, 025101. [Google Scholar] [CrossRef]
- Söderberg, M.; Grimvall, G. Conductivity of inhomogeneous materials represented by discrete resistor networks. J. Appl. Phys. 1986, 59, 186–190. [Google Scholar] [CrossRef]
- Niklasson, G.A.; Granqvist, C.G.; Hunderi, O. Effective medium models for the optical properties of inhomogeneous materials. Appl. Opt. 1981, 20, 26–30. [Google Scholar] [CrossRef]
- Ruehli, A.; Antonini, A.; Jiang, L. Circuit Oriented Electromagnetic Modeling Using the PEEC Techniques, 1st ed.; Wiley-IEEE Press: New York City, NY, USA, 2017. [Google Scholar]
- Robertson, C.G.; Stoček, R.; Mars, W.V. The Fatigue Threshold of Rubber and Its Characterization Using the Cutting Method. In Fatigue Crack Growth in Rubber Materials. Advances in Polymer Science; Heinrich, G., Kipscholl, R., Stoček, R., Eds.; Springer: Cham, Switzerland, 2020; pp. 19–38. [Google Scholar] [CrossRef]
- Harea, E.; Datta, S.; Stěnička, M.; Stoček, R. Electrical conductivity degradation of fatigued carbon black reinforced natural rubber composites: Effects of carbon nanotubes and strain amplitudes. Express Polym. Lett. 2019, 13, 1116–1124. [Google Scholar] [CrossRef]
- Harea, E.; Datta, S.; Stěnička, M.; Stoček, R. Undesirable Aspects of Fatigue on Stretchable Elastomer Sensors. In Nanoscience and Nanotechnology in Security and Protection against CBRN Threats; Petkov, P., Achour, M., Popov, C., Eds.; Springer: Dordrecht, The Netherlands, 2020; pp. 95–105. [Google Scholar] [CrossRef]
- Harea, E.; Stoček, R.; Storozhuk, L.; Sementsov, Y.; Kartel, N. Study of tribological properties of natural rubber containing carbon nanotubes and carbon black as hybrid fillers. Appl. Nanosci. 2019, 9, 899–906. [Google Scholar] [CrossRef]
- Bohm, G.G.A.; Nguyen, M.N. Flocculation of carbon black in filled rubber compounds. I. Flocculation occurring in unvucanized compounds during annealing at elevated temperatures. J. Appl. Polym. Sci. 1995, 55, 1041–1050. [Google Scholar] [CrossRef]
- Kraus, G. Reinforcement of elastomers by carbon black. Macromol. Mater. Eng. 1977, 60, 215–248. [Google Scholar] [CrossRef]
- Stauffer, D.; Aharony, A. Introduction to Percolation Theory, 2nd ed.; Taylor and Francis: London, UK, 2017. [Google Scholar] [CrossRef]
- Huang, M.; Tunnicliffe, L.B.; Zhuang, J.; Ren, W.; Yan, H.; Busfield, J.J.C. Strain dependent dielectric behavior of carbon black reinforced natural rubber. Macromolecules 2016, 49, 2339–2347. [Google Scholar] [CrossRef]
- Huang, Y.; Schadler, L.S. Understanding the Strain-Dependent Dielectric Behavior of Carbon Black Reinforced Natural Rubber– An interfacial or bulk phenomenon? Compos. Sci. Technol. 2017, 142, 91–97. [Google Scholar] [CrossRef] [Green Version]
- Gismatulin, A.A.; Kamaev, G.N.; Kruchinin, V.N.; Gritsenko, V.A.; Orlov, O.M.; Chin, A. Charge transport mechanism in the forming-free memristor based on silicon nitride. Sci. Rep. 2021, 11, 2417. [Google Scholar] [CrossRef]
- Stoček, R.; Heinrich, G.; Gehde, M.; Rauschenbach, A. Investigations about notch length in pure-shear test specimen for exact analysis of crack propagation in elastomers. J. Plast. Technol. 2012, 1, 2–22. [Google Scholar]
- Stoček, R.; Heinrich, G.; Gehde, M.; Kipscholl, R. Analysis of dynamic crack propagation in elastomers by simultaneous tensile- and pure-shear-mode testing. In Fracture Mechanics and Statistical Mechanics of Reinforced Elastomeric Blends. Lecture Notes in Applied and Computational Mechanics; Grellmann, W., Heinrich, G., Kaliske, M., Klüppel, M., Schneider, K., Vilgis, T., Eds.; Springer: Berlin, Germany, 2013; pp. 269–301. [Google Scholar] [CrossRef]
- Stoček, R.; Stěnička, M.; Maloch, J. Determining Parametrical Functions Defining the Deformations of a Plane Strain Tensile Rubber Sample. In Fatigue Crack Growth in Rubber Materials. Advances in Polymer Science; Heinrich, G., Kipscholl, R., Stoček, R., Eds.; Springer: Cham, Switzerland, 2020; pp. 19–38. [Google Scholar] [CrossRef]
- Trabelsi, S.; Albouy, P.A.; Rault, J. Effective Local Deformation in Stretched Filled Rubber. Macromolecules 2003, 36, 9093–9099. [Google Scholar] [CrossRef]
- Biben, T.; Munch, E. Strain-Induced Crystallization of Natural Rubber and Cross-Link Densities Heterogeneities. Macromolecules 2014, 47, 5815–5824. [Google Scholar] [CrossRef]
- Middleton, W.I.; Davis, E.W. Skin effect in large stranded conductors at low frequencies. J. Am. Inst. Elect. Eng. 1921, 40, 757–763. [Google Scholar] [CrossRef]
- Franco, S. Design with Operational Amplifiers and Analog Integrated Circuits, 4th ed.; McGraw-Hill: New York, NY, USA, 2015; 672p. [Google Scholar]
- Carter, B.; Mancini, R. Op Amps for Everyone, 5th ed.; Elsevier: Oxford, UK, 2018. [Google Scholar]
- Pilkey, W.D.; Pilkey, D.F. Peterson’s Stress Concentration Factors, 3rd ed.; John Wiley & Sons Inc.: Hoboken, NJ, USA, 2008; pp. 180–184. [Google Scholar]
- Robertson, C.G.; Ned, J.; Hardman, N.J. Nature of Carbon Black Reinforcement of Rubber: Perspective on the Original Polymer Nanocomposite. Polymers 2021, 13, 538. [Google Scholar] [CrossRef]
- Tang, Z.; Jia, S.; Zhou, C.; Li, B. 3D Printing of Highly Sensitive and Large-Measurement-Range Flexible Pressure Sensors with a Positive Piezoresistive Effect. ACS Appl. Mater. Interfaces 2020, 12, 28669–28680. [Google Scholar] [CrossRef] [PubMed]


| NR | Oil | Carbon Black | CBS | Sulfur | ZnO | Stearic Acid | |
|---|---|---|---|---|---|---|---|
| Content in phr * | |||||||
| NR50_# | 100.00 | 10.00 | 50.00 | 1.00 | 2.50 | 5.00 | 2.00 |
| NR60_# | 60.00 | ||||||
| NR70_# | 70.00 | ||||||
 |  |  |  | ||
| 50 phr | ρ, Ωm | 6.80 × 10⁴ | 8.10 × 10⁵ | 3.60 × 10⁶ | 9.20 × 10⁶ |
| R, Ω | 9.50 × 10⁷ | 3.10 × 10⁸ | 3.10 × 10⁹ | 3.10 × 10¹⁰ | |
| 60 phr | ρ, Ωm | 1.40 × 10³ | 2.80 × 10³ | 6.00 × 10³ | 1.40 × 10⁴ |
| R, Ω | 1.90 × 10⁶ | 1.00 × 10⁶ | 5.10 × 10⁶ | 4.60 × 10⁷ | |
| 70 phr | ρ, Ωm | 1.70 × 10² | 1.40 × 10² | 1.20 × 10² | 1.10 × 10² |
| R, Ω | 2.40 × 10² | 5.30 × 101 | 1.10 × 10² | 3.60 × 10² | |
 |  |  |  |  | ||
| 50 phr | ρ, Ωm | 6.80 × 10⁴ | 8.10 × 10⁵ | 3.60 × 10⁶ | 9.20 × 10⁶ | 2.10 × 10⁷ |
| R, Ω | 3.40 × 10⁷ | 1.80 × 10⁹ | 6.30 × 10⁹ | 5.20 × 10¹⁰ | 4.90 × 10¹⁰ | |
| 60 phr | ρ, Ωm | 1.40 × 10³ | 2.80 × 10³ | 6.00 × 10³ | 1.40 × 10⁴ | 3.90 × 10⁴ |
| R, Ω | 7.00 × 10⁵ | 6.10 × 10⁶ | 1.10 × 10⁷ | 7.90 × 10⁷ | 9.30 × 10⁷ | |
| 70 phr | ρ, Ωm | 1.70 × 10² | 1.40 × 10² | 1.20 × 10² | 1.10 × 10² | 9.80 × 101 |
| R, Ω | 8.80 × 10⁴ | 3.10 × 10⁵ | 2.10 × 10⁵ | 6.30 × 10⁵ | 2.30 × 10⁵ | |
Publisher’s Note: MDPI stays neutral with regard to jurisdictional claims in published maps and institutional affiliations. |
© 2021 by the authors. Licensee MDPI, Basel, Switzerland. This article is an open access article distributed under the terms and conditions of the Creative Commons Attribution (CC BY) license (https://creativecommons.org/licenses/by/4.0/).
Share and Cite
Harea, E.; Datta, S.; Stěnička, M.; Maloch, J.; Stoček, R. The Influence of Local Strain Distribution on the Effective Electrical Resistance of Carbon Black Filled Natural Rubber. Polymers 2021, 13, 2411. https://doi.org/10.3390/polym13152411
Harea E, Datta S, Stěnička M, Maloch J, Stoček R. The Influence of Local Strain Distribution on the Effective Electrical Resistance of Carbon Black Filled Natural Rubber. Polymers. 2021; 13(15):2411. https://doi.org/10.3390/polym13152411
Chicago/Turabian StyleHarea, E., S. Datta, M. Stěnička, J. Maloch, and R. Stoček. 2021. "The Influence of Local Strain Distribution on the Effective Electrical Resistance of Carbon Black Filled Natural Rubber" Polymers 13, no. 15: 2411. https://doi.org/10.3390/polym13152411
APA StyleHarea, E., Datta, S., Stěnička, M., Maloch, J., & Stoček, R. (2021). The Influence of Local Strain Distribution on the Effective Electrical Resistance of Carbon Black Filled Natural Rubber. Polymers, 13(15), 2411. https://doi.org/10.3390/polym13152411