
Methotrexate-Loaded Gelatin and Polyvinyl Alcohol (Gel/PVA) Hydrogel as a pH-Sensitive Matrix


 ,
,  ,
,  ,
,  , and
, and 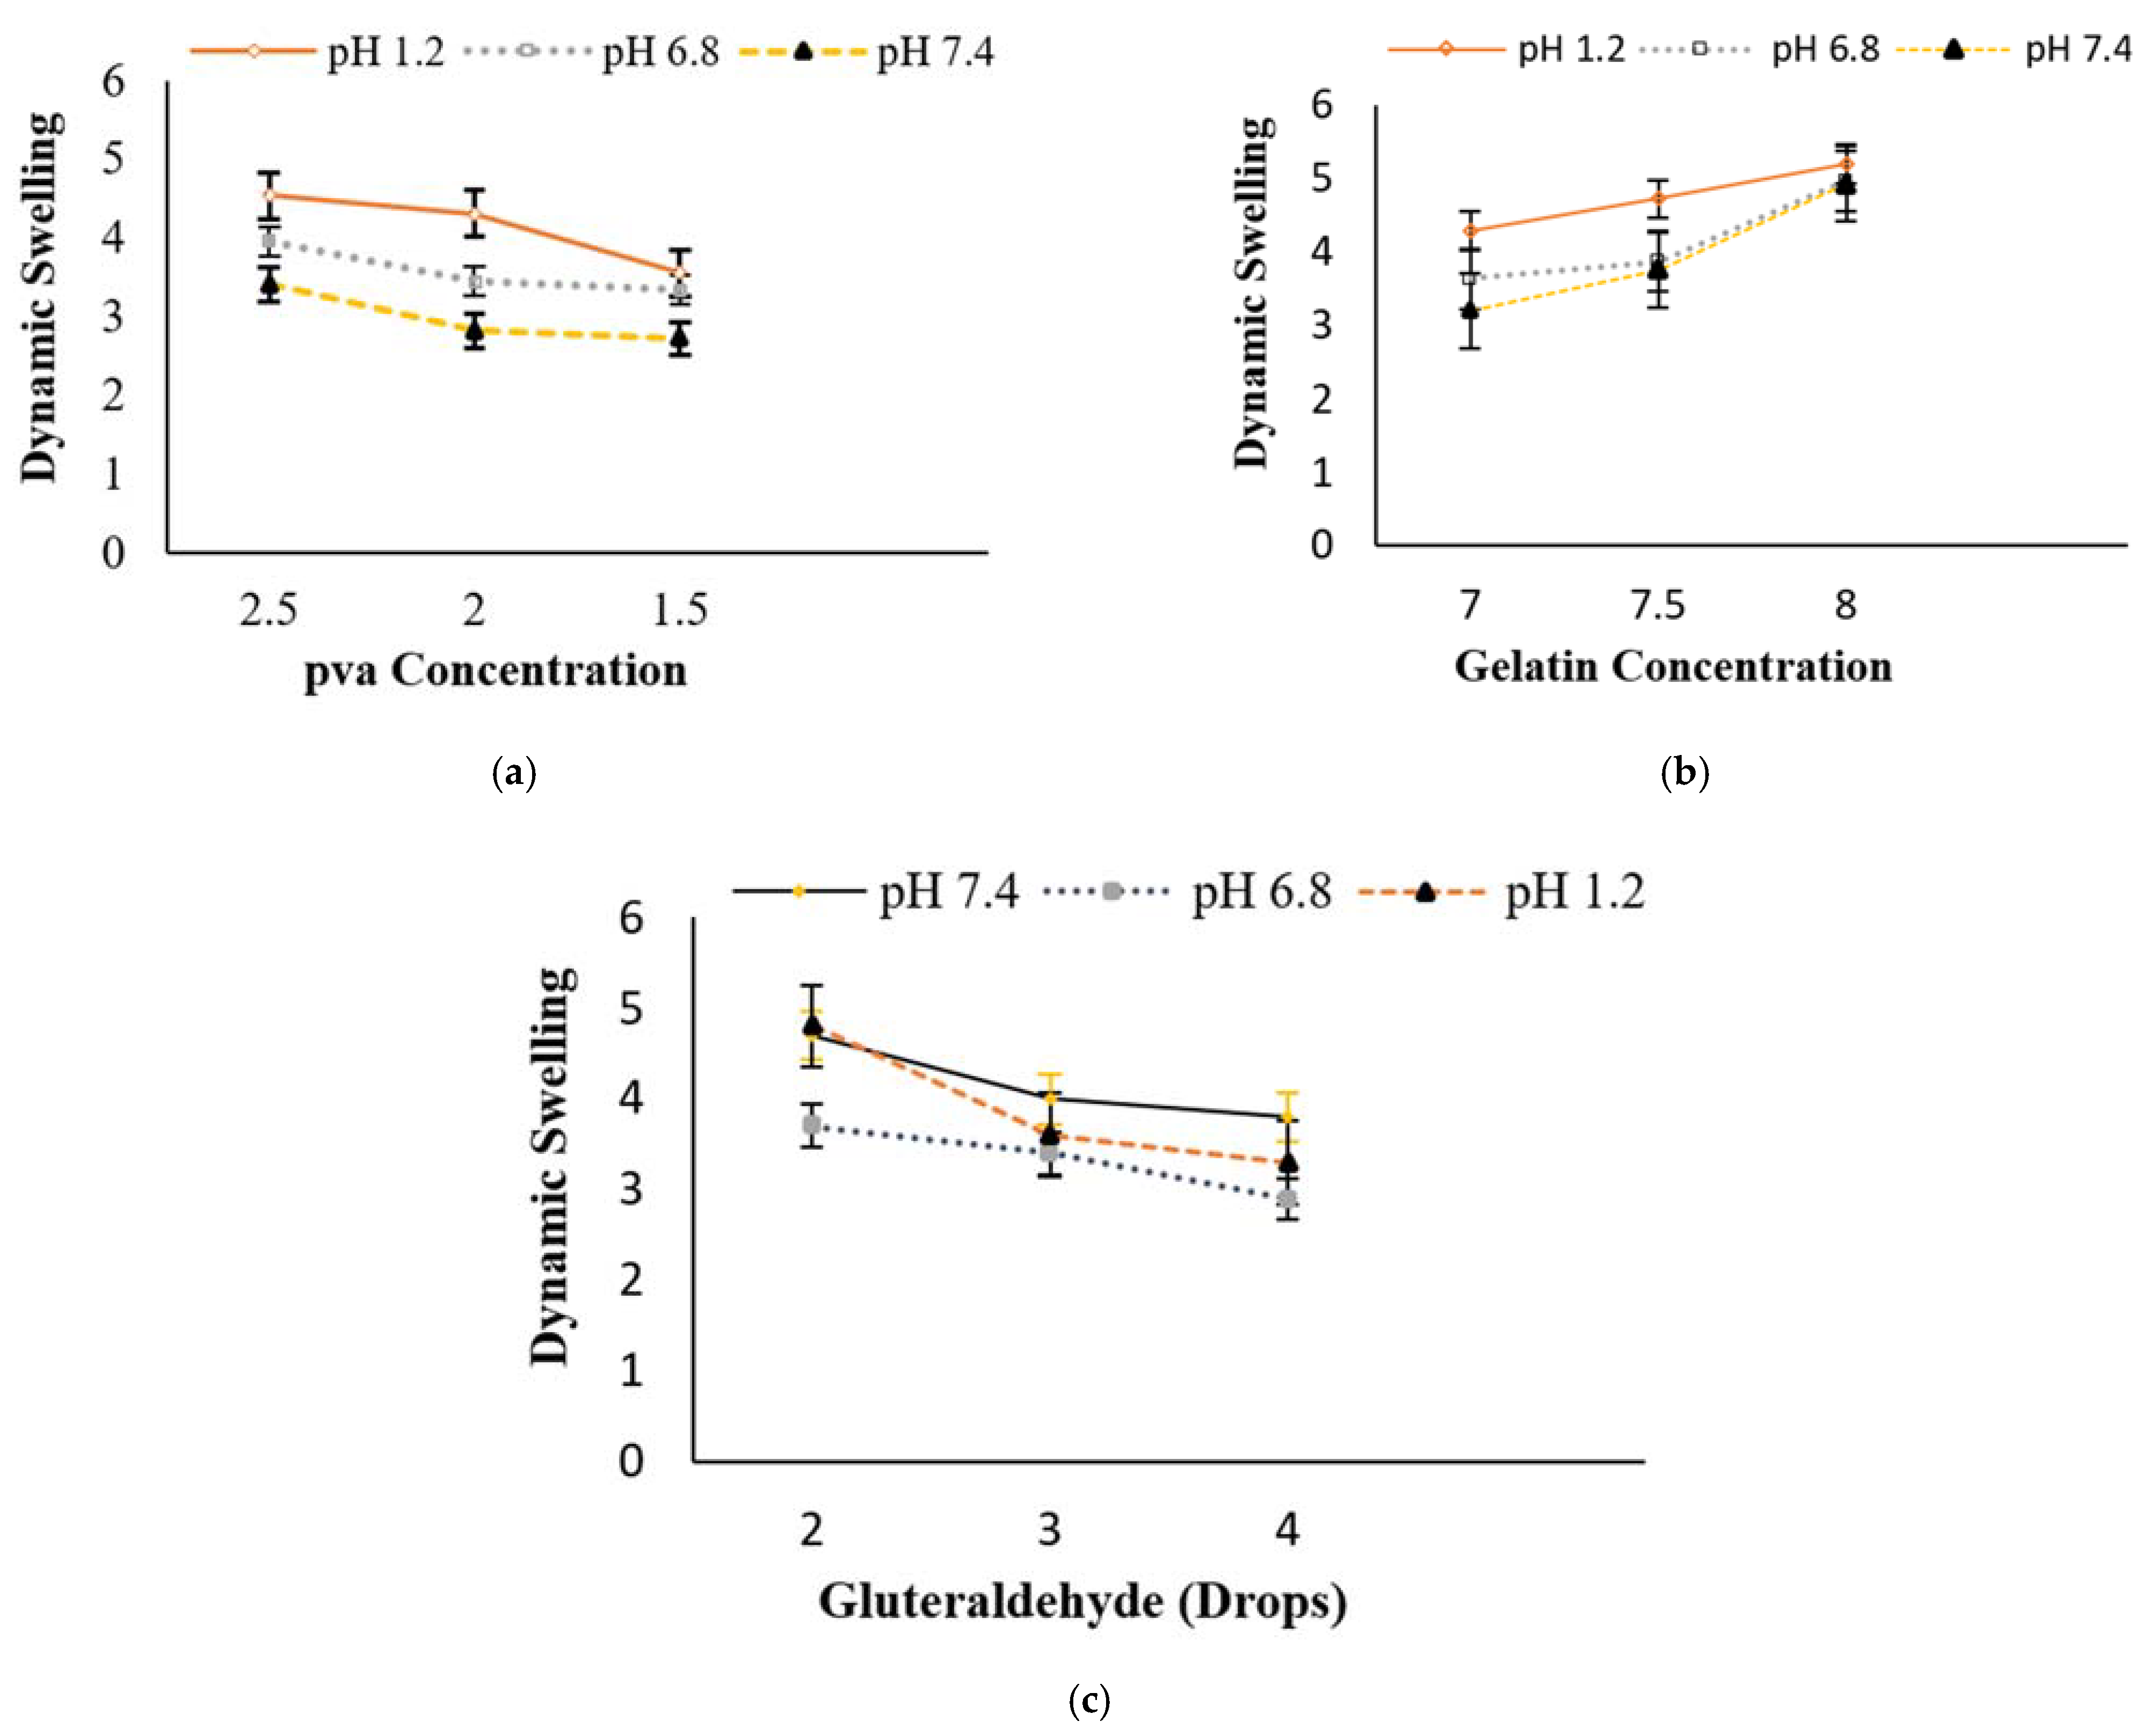
Abstract
:1. Introduction
2. Materials and Methods
2.1. Materials
2.2. Methods
2.2.1. Preparation of Gel/PVA Hybrid Hydrogel
2.2.2. Dynamic and Equilibrium Swelling Characteristic
2.2.3. Diffusion Coefficient
2.2.4. Sol-Gel Analysis
2.2.5. Porosity Measurement
2.2.6. Method of Drug Loading (In Situ Method)
2.2.7. Drug Release
2.3. Characterization
2.3.1. Fourier Transform Infrared Spectroscopy (FT-IR)
2.3.2. Thermal Gravimetric Analysis (TGA)
2.4. Statistical Analysis
3. Results
3.1. Behavior of Swelling Study
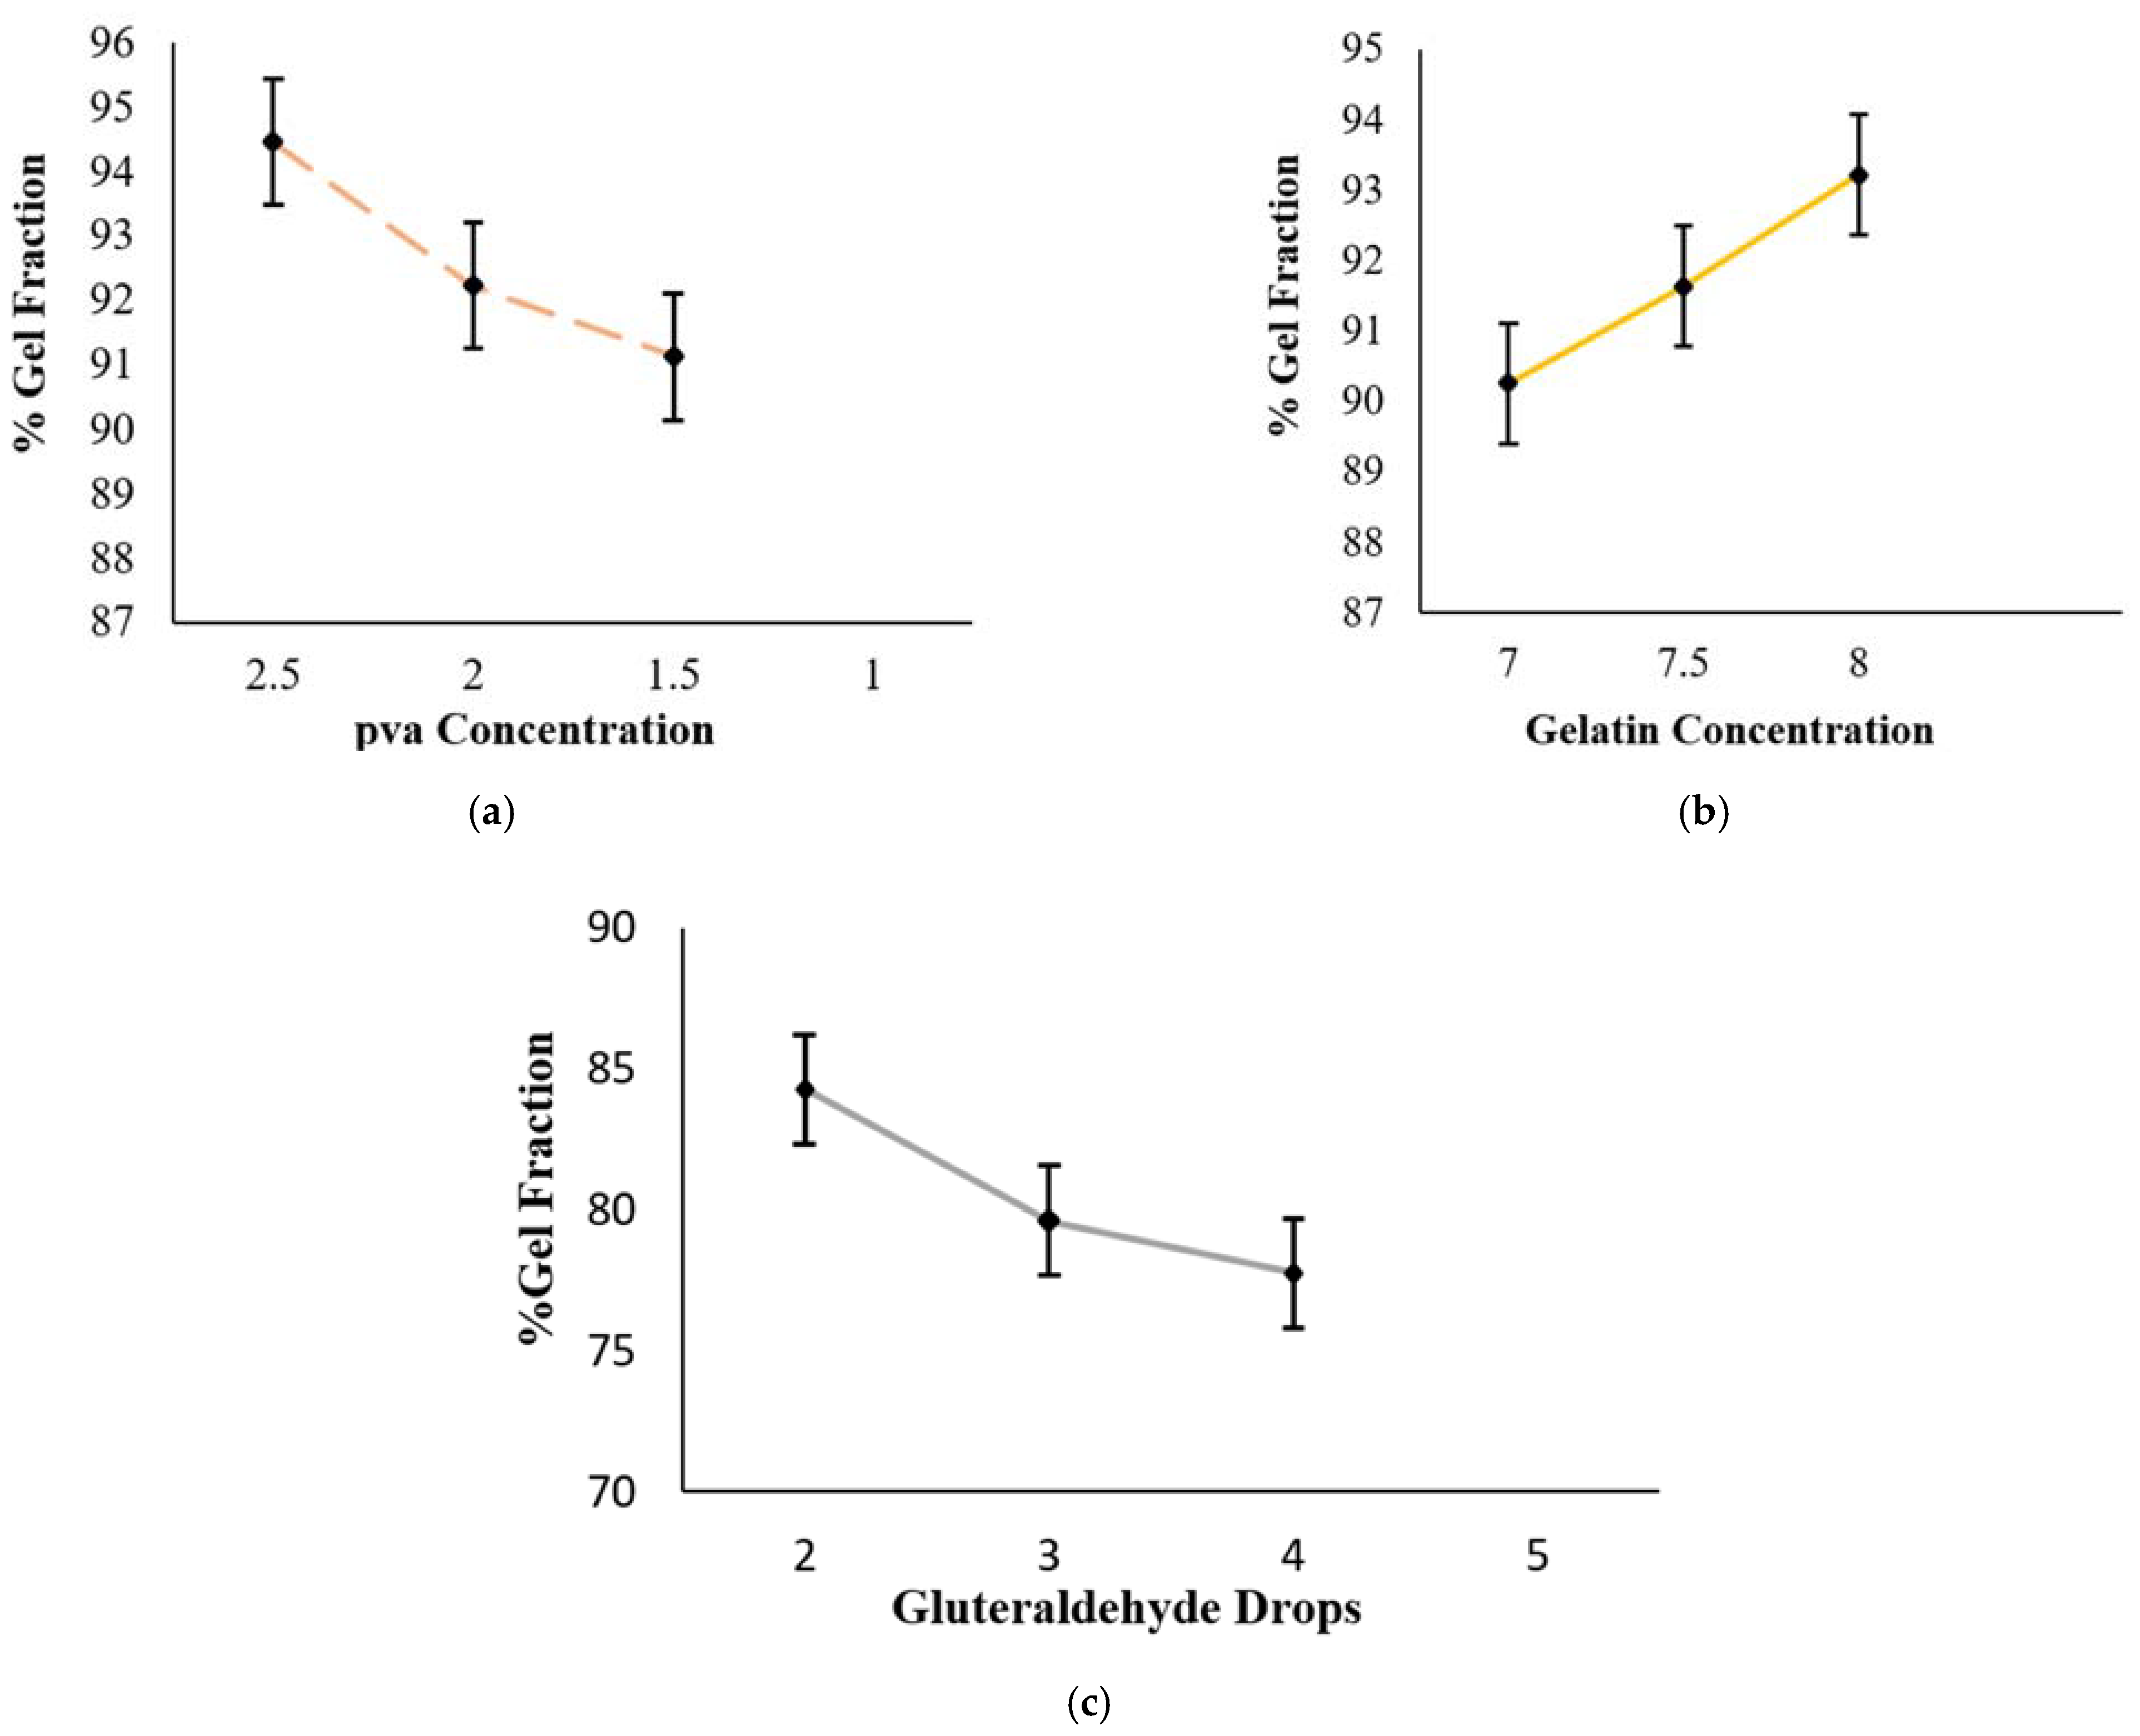
3.2. Sol-Gel Analysis
3.3. Diffusion Coefficient
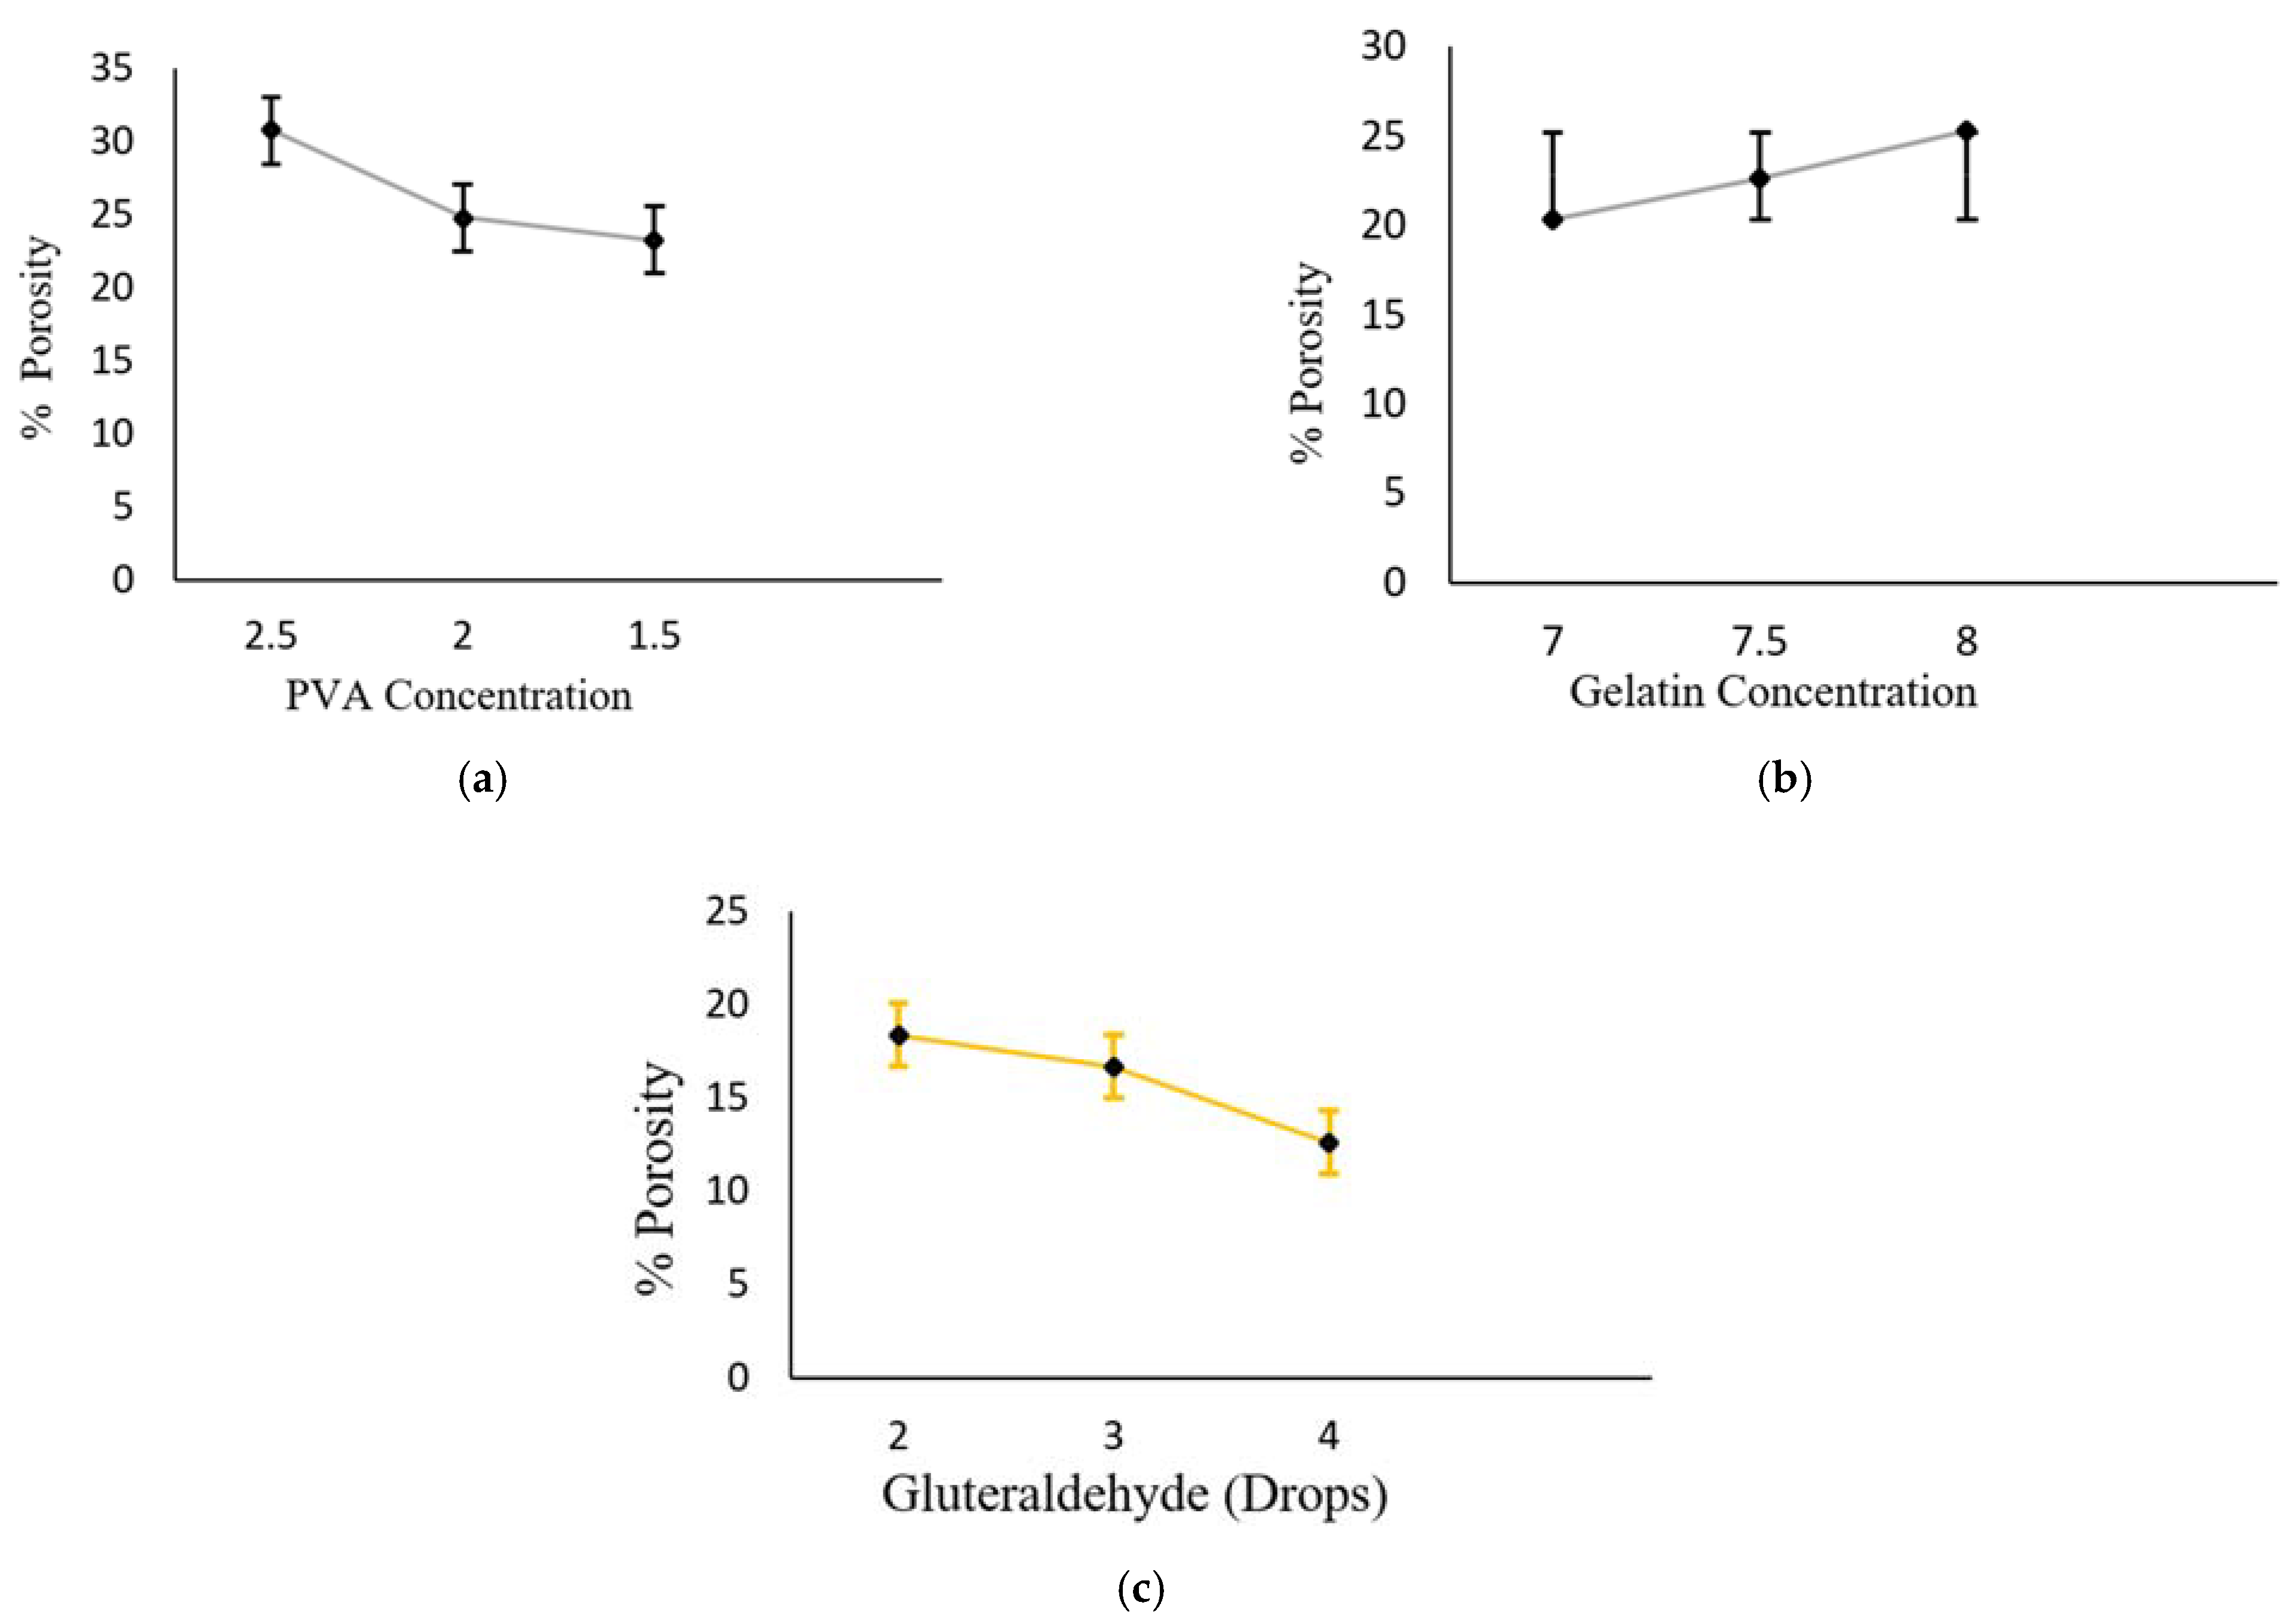
3.4. Measurement Porosity
3.5. In-Situ Drug Loading
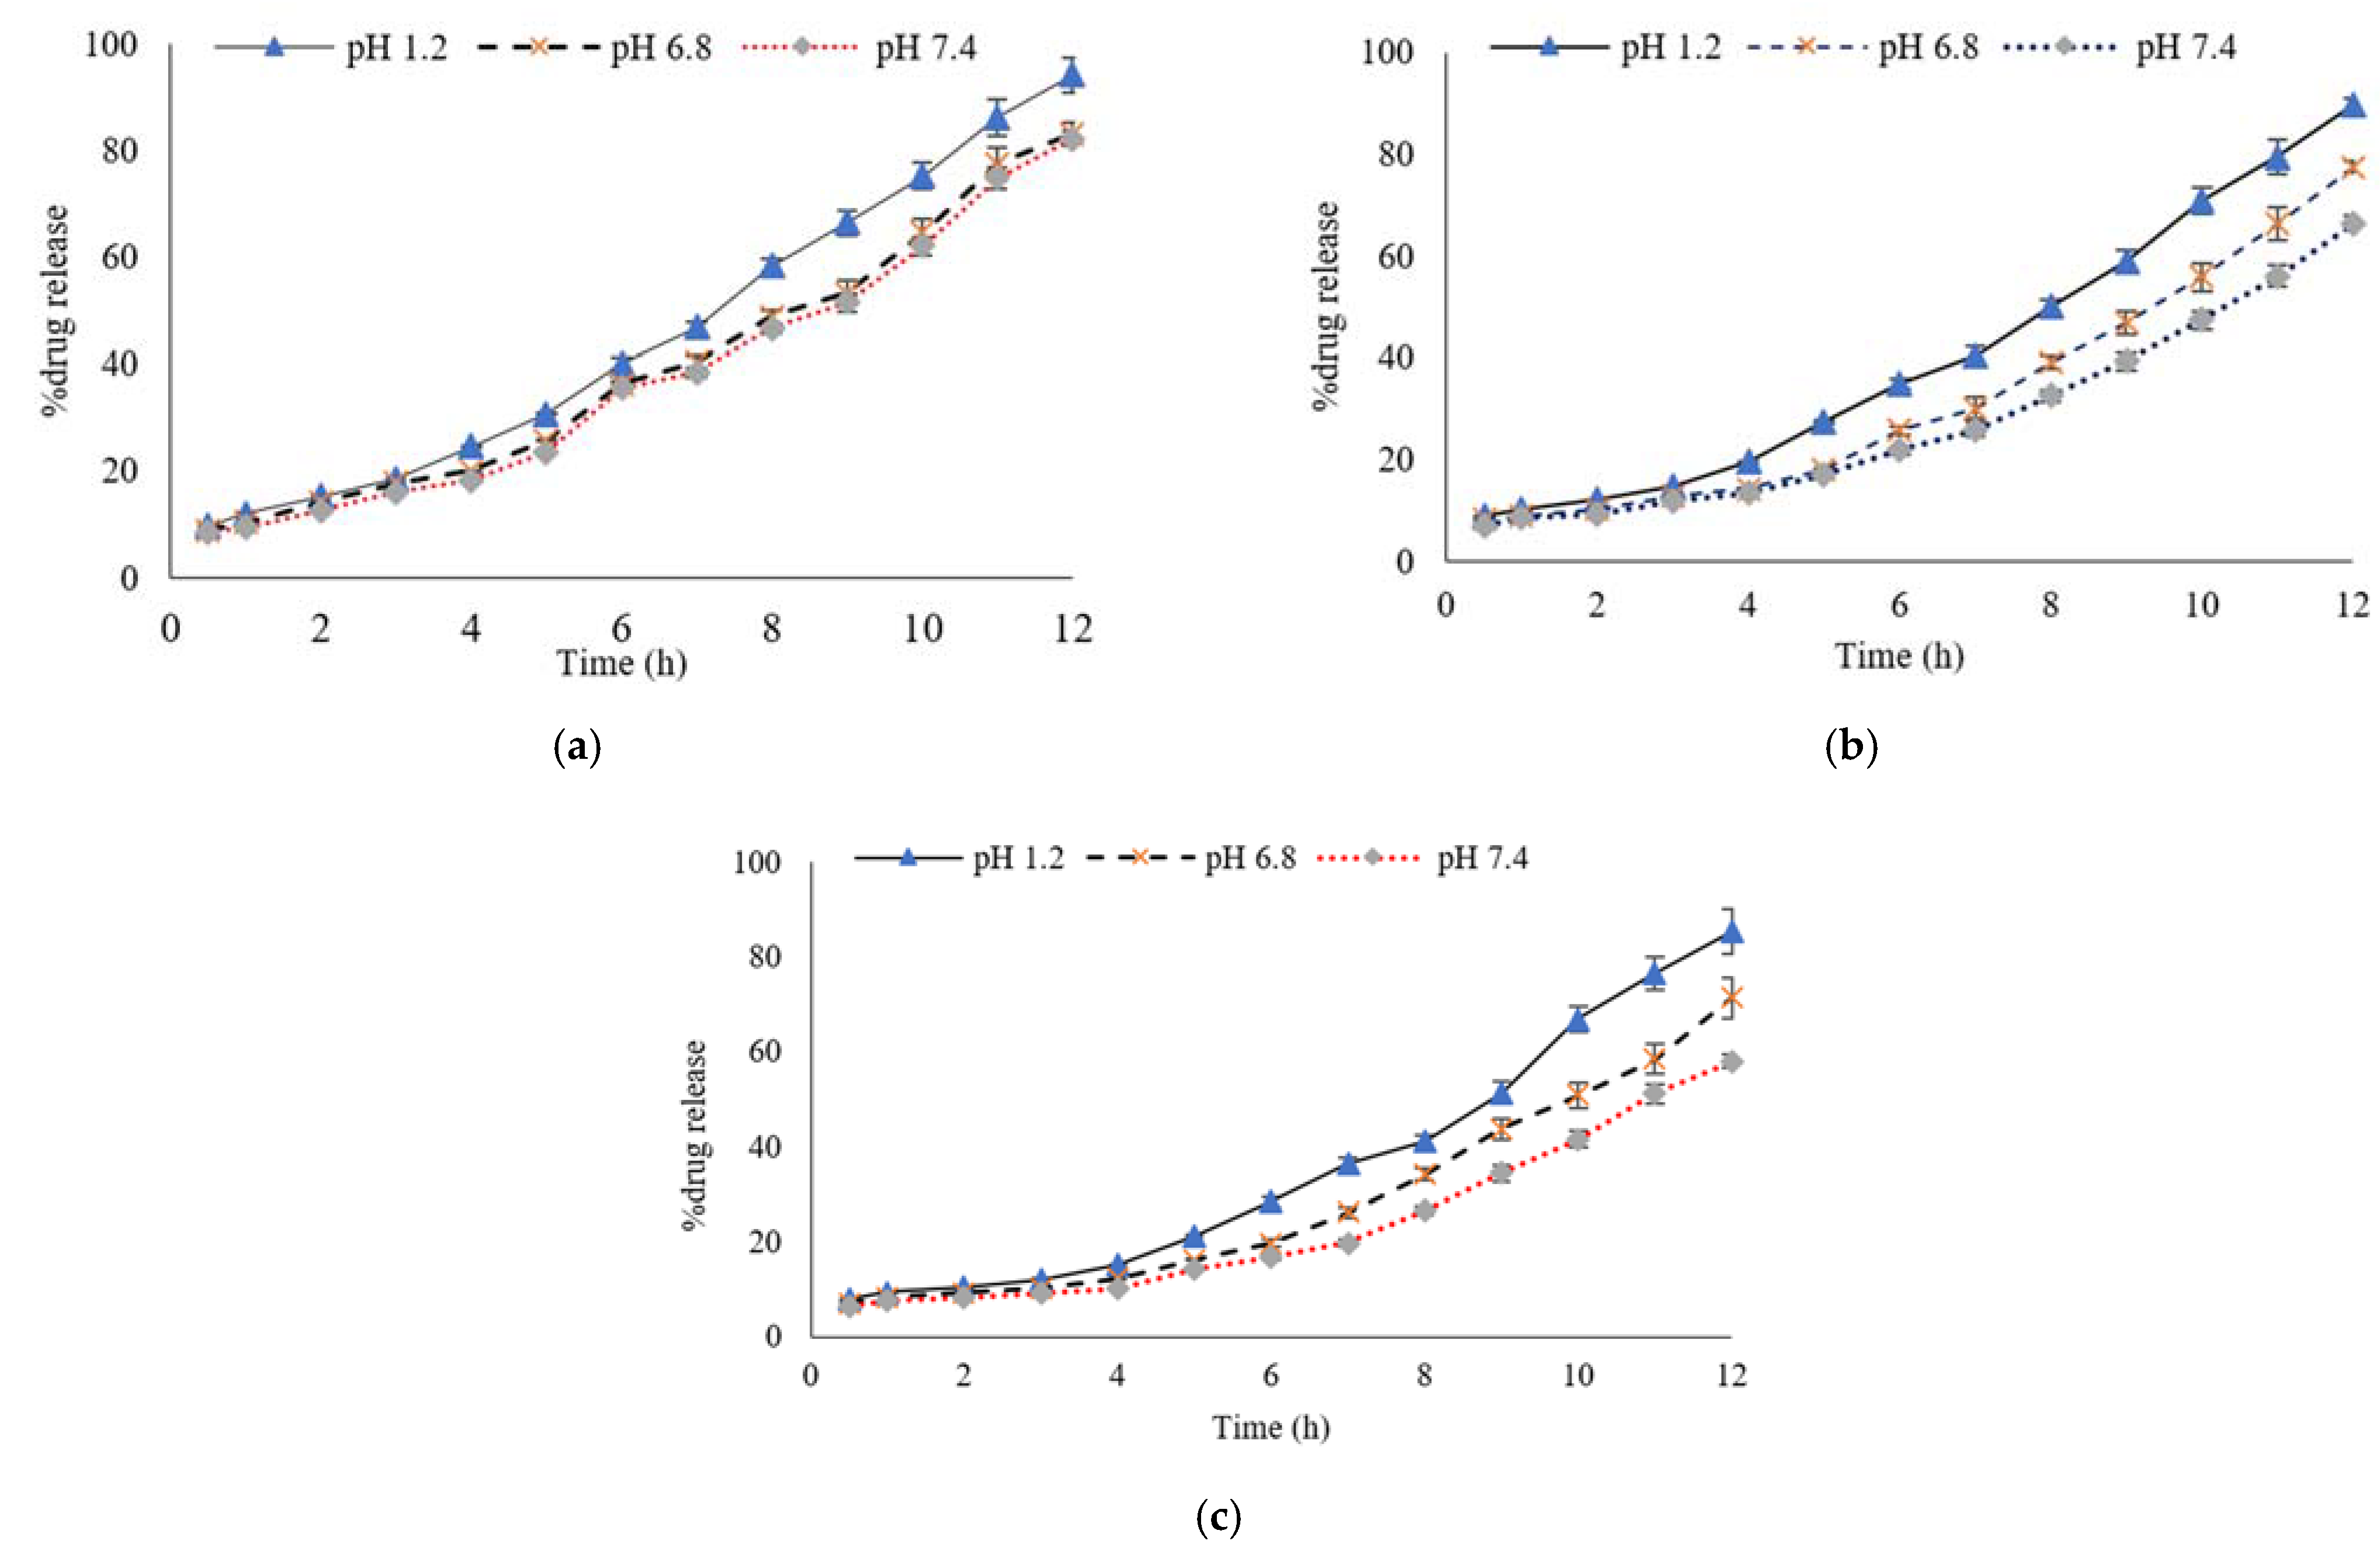
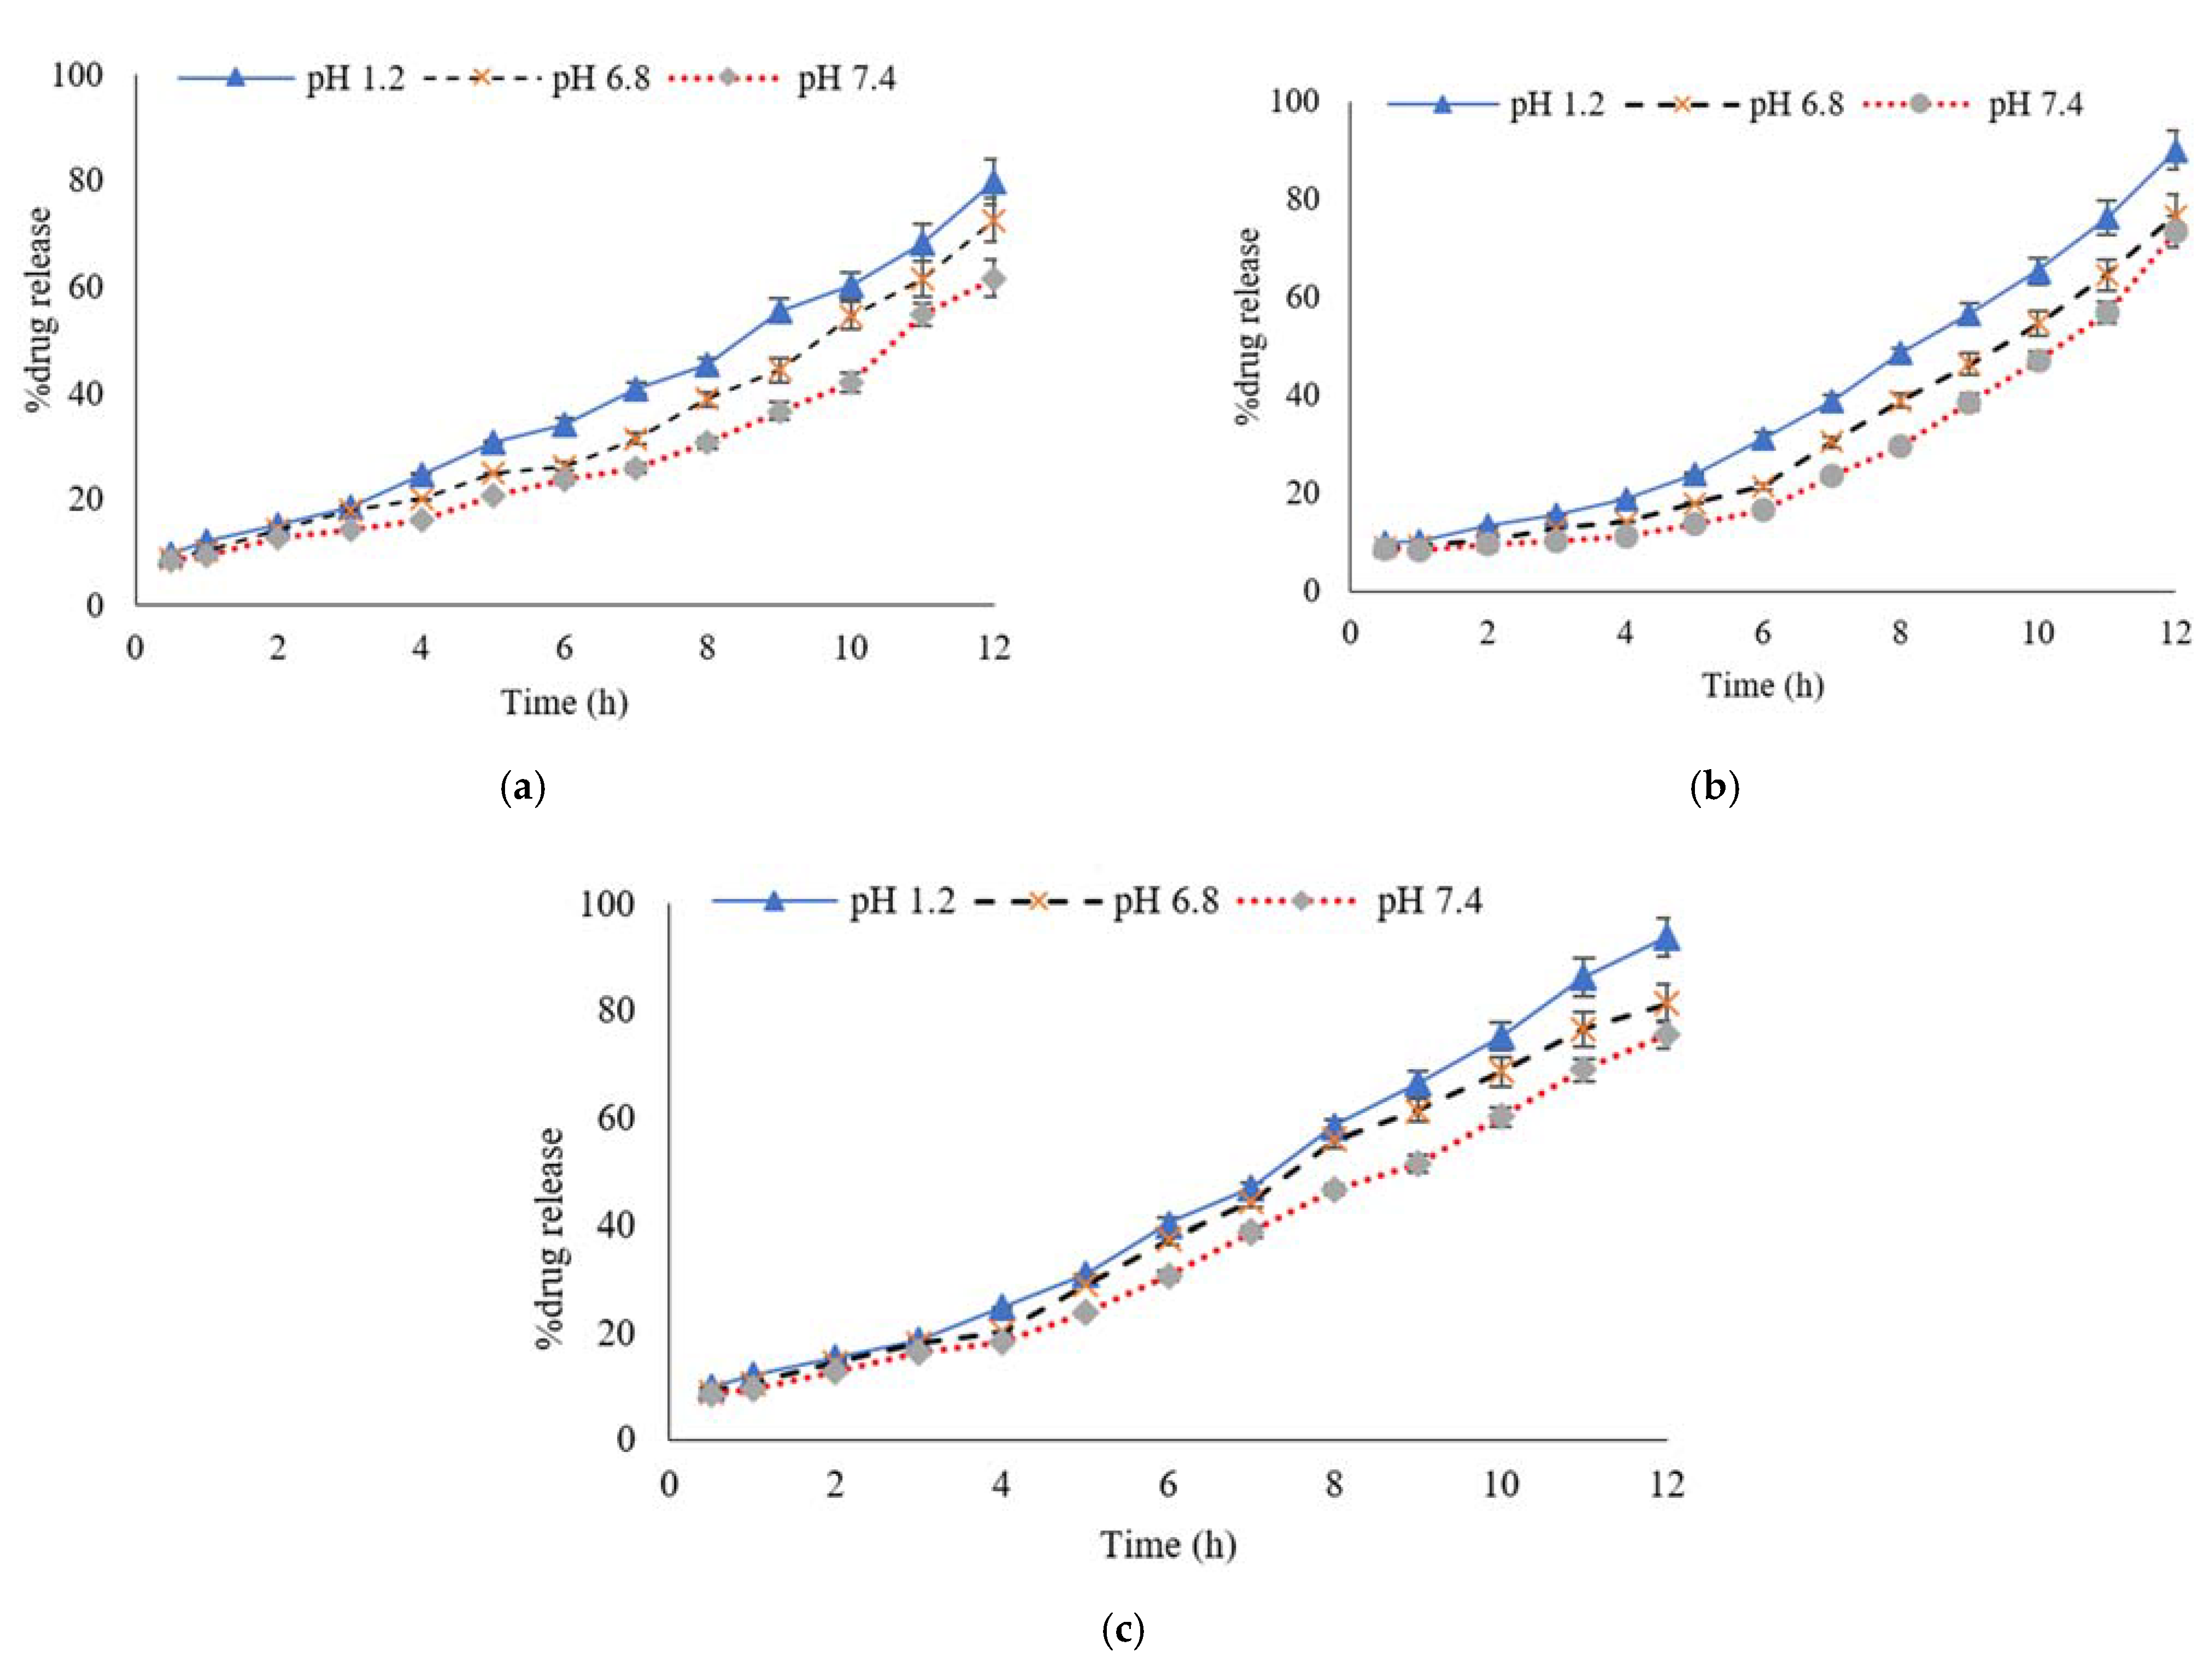
3.6. Percentage of Drug Release Profile
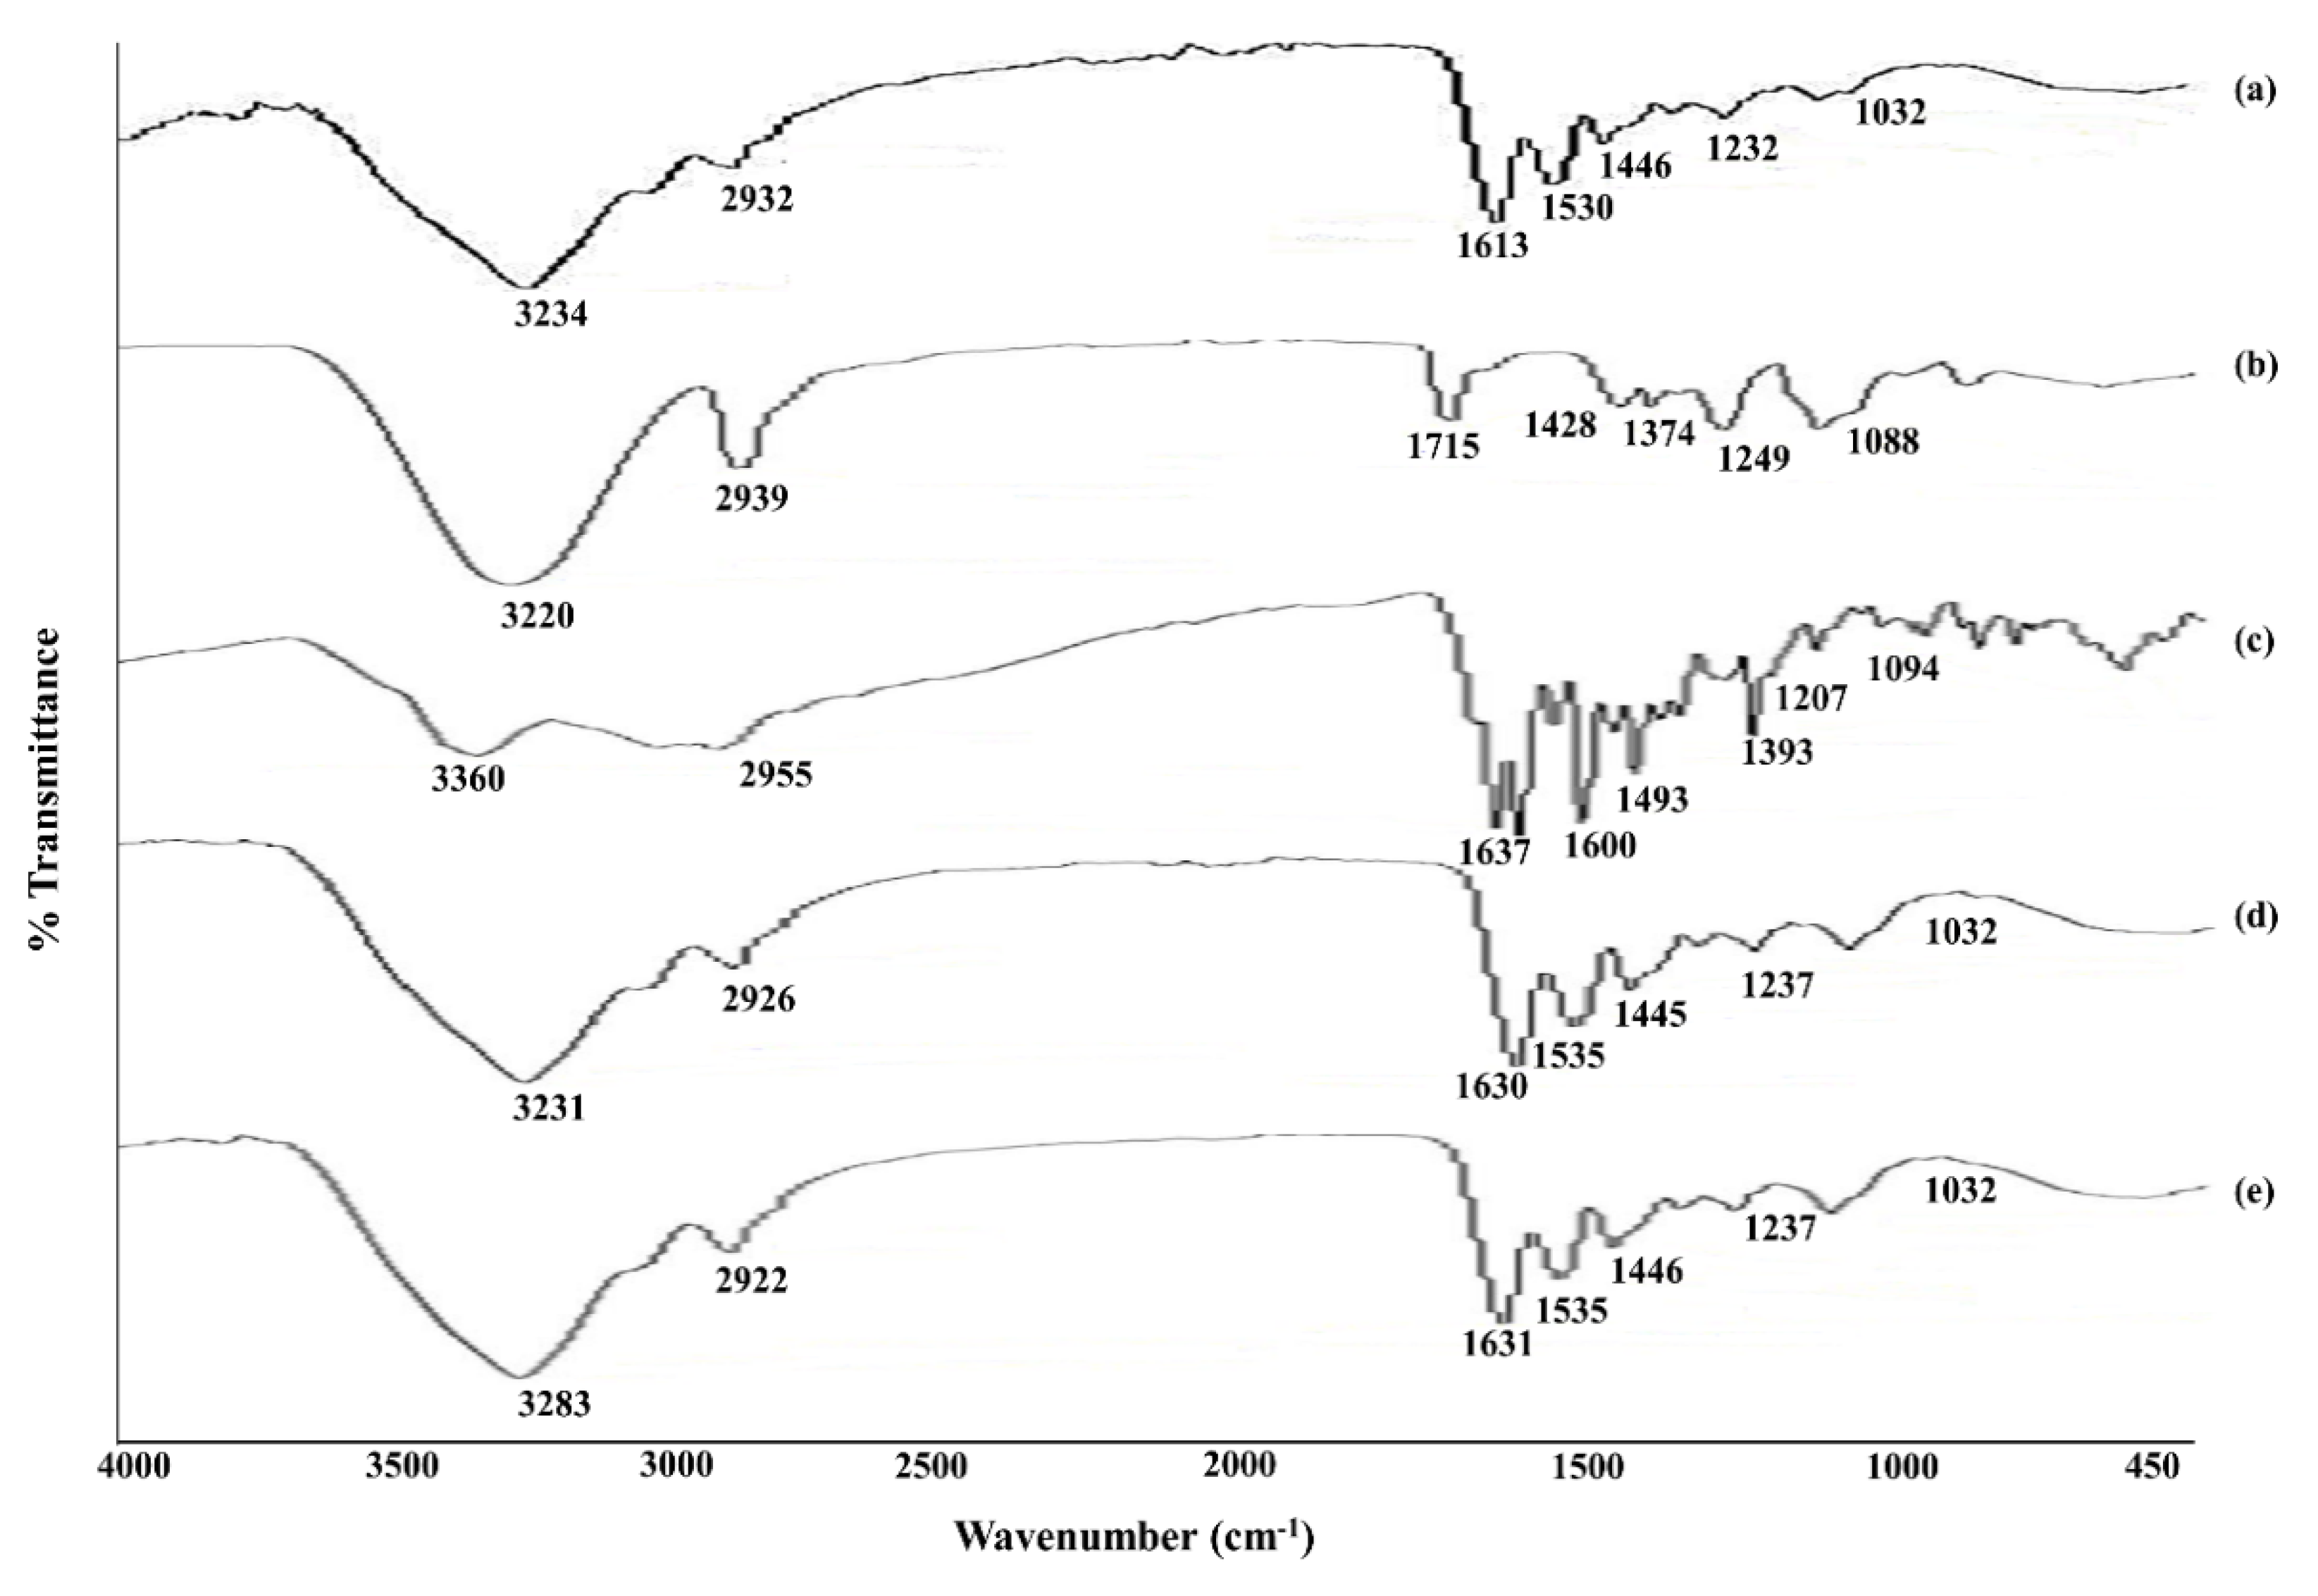
3.7. FT-IR (Fourier Transform Infrared Spectroscopy)
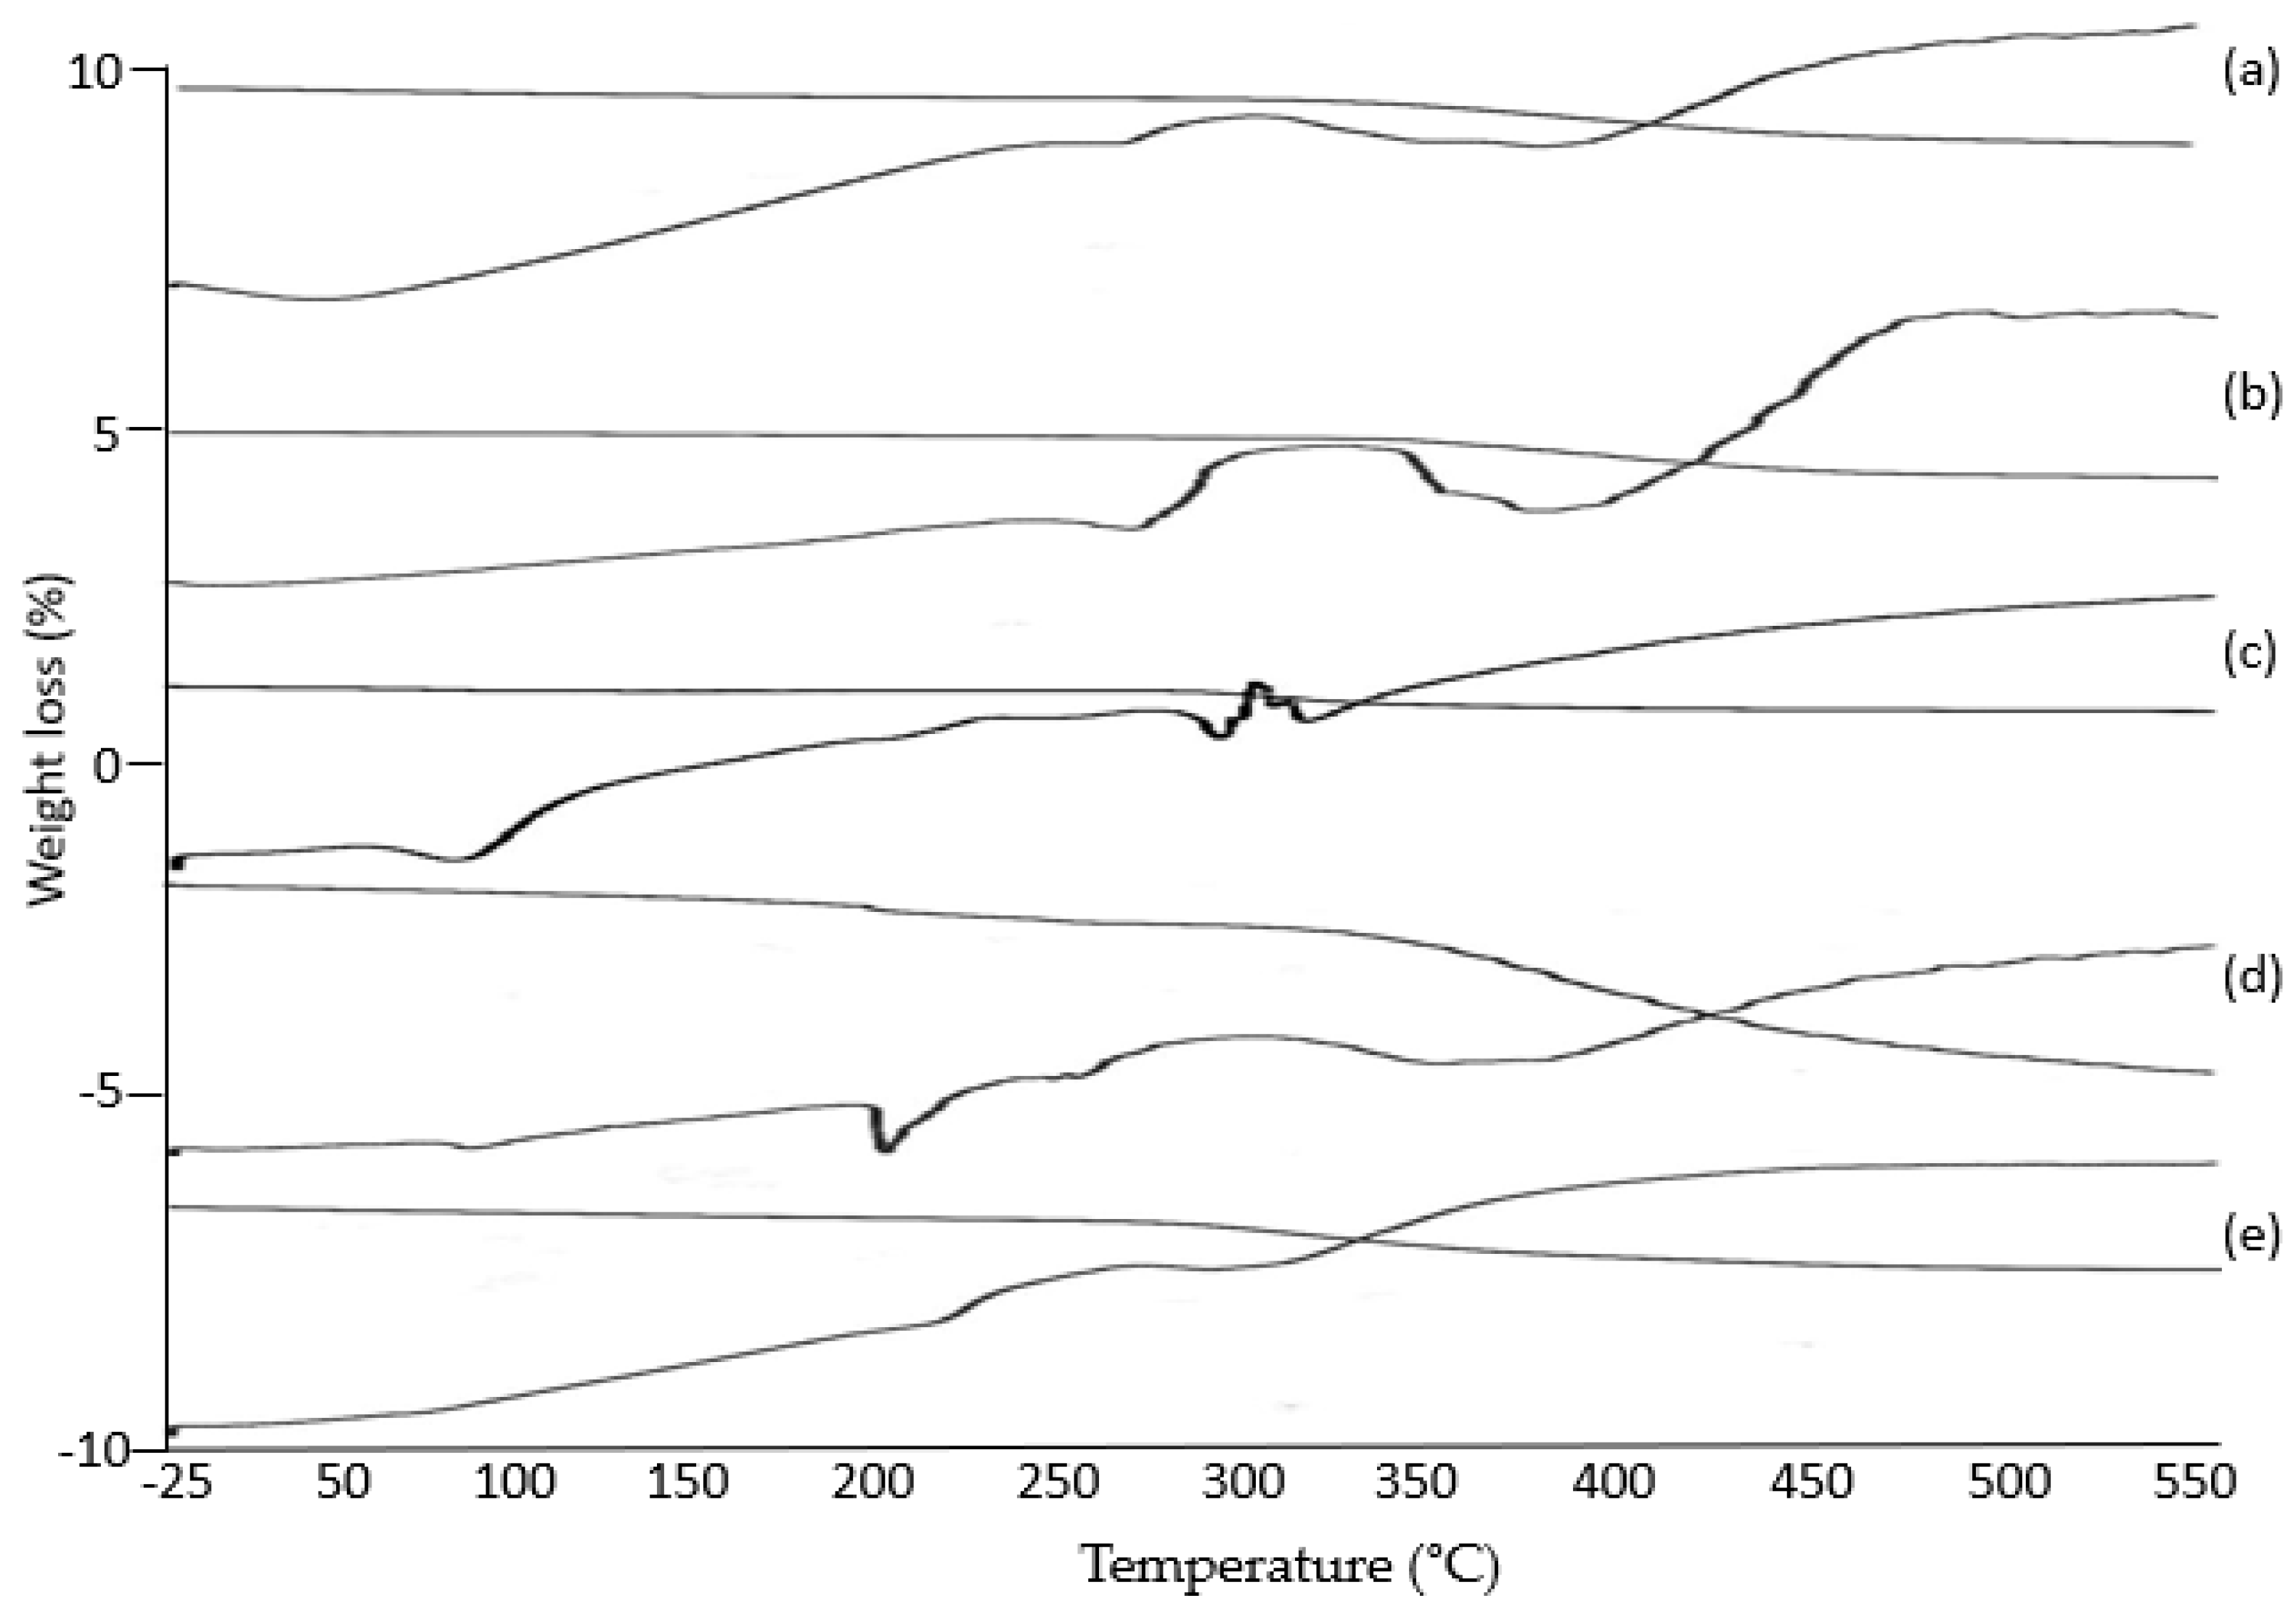
3.8. Thermal Gravimetric Analysis (TGA)
4. Discussion
5. Conclusions
Author Contributions
Funding
Institutional Review Board Statement
Informed Consent Statement
Data Availability Statement
Acknowledgments
Conflicts of Interest
References
- Hudiță, A.; Radu, I.C.; Zaharia, C.; Ion, A.C.; Ginghină, O.; Gălățeanu, B.; Costache, M. Bio-and Hemo-Compatible Silk Fibroin PEGylated Nanocarriers for 5-Fluorouracil Chemotherapy in Colorectal Cancer: In Vitro Studies. Pharmaceutics 2021, 13, 755. [Google Scholar] [CrossRef]
- Schliemann, D.; Paramasivam, D.; Dahlui, M.; Cardwell, C.R.; Somasundaram, S.; Ibrahim Tamin, N.S.B.; Donnelly, M. Change in public awareness of colorectal cancer symptoms following the Be Cancer Alert Campaign in the multi-ethnic population of Malaysia. BMC Cancer 2020, 20, 252. [Google Scholar] [CrossRef] [PubMed]
- Siegel, R.L.; Miller, K.D.; Goding Sauer, A.; Fedewa, S.A.; Butterly, L.F.; Anderson, J.C.; Jemal, A. Colorectal cancer statistics, 2020. CA Cancer J. Clin. 2020, 70, 145–164. [Google Scholar] [CrossRef] [PubMed] [Green Version]
- Kim, S.J.; Lee, K.J.; Kim, I.Y.; Kim, S.I. Swelling kinetics of interpeneterating polymer hydrogels composed of poly (vinyl alcohol)/chitosan. J. Macromol. Sci. A 2003, 40, 501–510. [Google Scholar] [CrossRef]
- Saarai, A.; Sedlacek, T.; Kasparkova, V. Characterization of sodium alginate/gelatin –based hydrogels for wound dressing. J. Appl. Polym. Sci. 2012, 126, E79–E88. [Google Scholar] [CrossRef]
- Bahrami, S.B.; Kordestani, S.S.; Mirzadeh, H.; Mansoori, P. Poly (vinyl alcohol)-chitosan blends: Preparation, echanical and physical properties. Iran. Polym. J. 2003, 12, 139–146. [Google Scholar]
- Khan, S.U.; Ranjha, N.M. Effect of degree of crosslinking on swelling and on drug release of low viscous chitosan/poly (vinyl alcohol) hydrogel. Polym. Bull. 2014, 71, 2133–2158. [Google Scholar] [CrossRef]
- Shukla, S.; Bajpai, A.K.; Kulkarin, R.A. Preparation, characterization, and water-sorption study of poly (vinyl alcohol) based hydrogels with grafted hydrophilic and hydrophobic segments. J. Appl. Polym. Sci. 2005, 95, 1129–1142. [Google Scholar] [CrossRef]
- Tareq, A.Z.; Hussein, M.S.; Mustafa, A.M. Synthesis and characterization of PVA-Gelatin hydrogel membranes for controlled delivery of captopril. Int. Res. J. Pure Appl. Chem. 2016, 12, 1–10. [Google Scholar] [CrossRef]
- Sung, J.H.; Hwang, M.R.; Kim, J.O.; Lee, J.H.; Kim, Y.I.; Kim, J.H.; Chang, S.W.; Jin, S.G.; Kim, J.A.; Lyoo, W.S.; et al. Gel characterization and in vivo evaluation of minocycline-loaded wound dressing with enhanced wound healing using poly (vinyl alcohol) and chitosan. Int. J. Pharm. 2010, 392, 232–240. [Google Scholar] [CrossRef]
- Chen, S.; Liu, M.; Jin, S.; Wang, B. Preparation of ionic-crosslinlked chitosan-based gel beads & effect of reaction conditions on drug release. Int. J. Pharm. 2008, 349, 180–187. [Google Scholar]
- Yin, L.; Fei, L.; Cui, F.; Tang, C.; Yin, C. Superporous hydrogels containing poly (acrylicacid-co-acrylamide)/O-carboxymethyl chitosan interpenetrating polymer networks. Biomaterials 2010, 28, 1258–1266. [Google Scholar] [CrossRef]
- Priscila, M.A.A.; Rosemarya, C.; Izabel, C.F.M.; Carla, G.L.; Ana Monica, Q.B.B.; Paulo, J.A.S. Development of films based on blends of gelatin and poly (vinyl alcohol) cross linked with glutaraldehyde. Food Hydrocoll. 2011, 25, 1751–1757. [Google Scholar]
- Mirzaie, Z.; Reisi-Vanani, A.; Barati, M. Polyvinyl alcohol-sodium alginate blend, composited with 3D-graphene oxide as a controlled release system for curcumin. J. Drug Deliv. Sci. Technol. 2019, 50, 380–387. [Google Scholar] [CrossRef]
- Shafagh, N.; Sabzi, M.; Afshari, M.J. Development of pH-sensitive and antibacterial gelatin/citric acid/Ag nanocomposite hydrogels with potential for biomedical applications. J. Polym. Res. 2018, 25, 259. [Google Scholar] [CrossRef]
- Thakur, S.; Govender, P.P.; Mamo, M.A.; Tamulevicius, S.; Thakur, V.K. Recent progress in gelatin hydrogel nanocomposites for water purification and beyond. Vacuum 2017, 146, 396–408. [Google Scholar] [CrossRef] [Green Version]
- Tenesa, A.; Dunlop, M.G. New insights into the etiology of colorectal cancer from genome-wide association studies. Nat. Rev. Genet. 2009, 10, 353–358. [Google Scholar] [CrossRef]
- Terzic, J.; Grivennikov, S.; Karin, E.; Karin, M. Inflammation and colon cancer. Gastroenterology 2010, 138, 2014–2101. [Google Scholar] [CrossRef] [PubMed]
- Chourasia, M.K.; Jain, S.K. Polysaccharides for Colon Targeted Drug Delivery. Drug Deliv. 2004, 11, 129–148. [Google Scholar] [CrossRef] [Green Version]
- Sinha, V.R.; Mittal, B.R.; Buhtani, K.K.; Rachna, K. Colonic drug delivery of 5-fluorouracil: An in vitro evaluation. Int. J. Pharm. 2004, 269, 101–108. [Google Scholar] [CrossRef] [PubMed]
- Schmaljohann, D. Thermo and pH responsive polymers in drug delivery. Adv. Drug Deliv. Rev. 2006, 58, 1655–1670. [Google Scholar] [CrossRef]
- Sharpe, A.L.; Daily, M.A.; Horava, D.S.; Peppas, A.N. Therapeutic applications of hydrogels in oral drug delivery. Expert Opin. Drug Deliv. 2014, 11, 901–915. [Google Scholar] [CrossRef] [PubMed] [Green Version]
- Liu, X.M.; Wang, L.S.; Wang, L.; Huang, J.; He, C. The effect of salt and pH on the phase-transition behaviors of temperature-sensitive copolymers based on N-isopropylacrylamide. Biomaterials 2004, 25, 5659–5666. [Google Scholar] [CrossRef] [PubMed]
- Zhang, H.; Guo, S.; Fu, S.; Zaho, Y. A Near-Infrared Light-Responsive Hybrid Hydrogel Based on UCST Triblock Copolymer and Gold Nanorods. Polymers 2017, 9, 238. [Google Scholar] [CrossRef] [Green Version]
- Anirudhan, T.; Mohan, A.M.J.R.A. Novel pH switchable gelatin based hydrogel for the controlled delivery of the anti-cancer drug 5-fluorouracil. RSC Adv. 2014, 4, 12109–12118. [Google Scholar] [CrossRef]
- Silva, L.P.D.; Jha, A.K.; Correlo, V.M.; Marques, A.P.; Reis, R.L.; Healy, K.E. Gellan Gum Hydrogels with Enzyme-Sensitive Biodegradation and Endotheileal Cell Biorecognition Sites. Adv. Healthc. Mater. 2018, 7, 686–700. [Google Scholar] [CrossRef] [PubMed]
- Dehshahri, A.; Kumar, A.; Madamsetty, V.S.; Uzieliene, I.; Tavakol, S.; Azedi, F.; Thakur, V.K. New Horizons in Hydrogels for Methotrexate Delivery. Gels 2021, 7, 2. [Google Scholar] [CrossRef] [PubMed]
- Shabir, F.; Erum, A.; Tulain, U.R.; Hussain, M.A.; Ahmad, M.; Akhter, F. Preparation and characterization of pH sensitive crosslinked Linseed polysaccharides-co-acrylic acid/methacrylic acid hydrogels for controlled delivery of ketoprofen. Des. Monomers Polym. 2017, 20, 485–495. [Google Scholar] [CrossRef]
- Khan, S.; Anwar, N. Gelatin/carboxymethyl cellulose based stimuli-responsive hydrogels for controlled delivery of 5-fluorouracil, development, in vitro characterization, in vivo safety and bioavailability evaluation. Carbohydr. Polym. 2021, 257, 117617. [Google Scholar] [CrossRef] [PubMed]
- Deepa, G.; Thulasidasan, A.K.T.; Anto, R.J.; Pillai, J.J.; Kumar, G.V. Cross-linked acrylic hydrogel for the controlled delivery of hydrophobic drugs in cancer therapy. Int. J. Nanomed. 2012, 7, 4077. [Google Scholar]
- Xu, Y.; Yang, H.; Zhu, H.; Jiang, L.; Yang, H. Self-healing gelatin-based shape memory hydrogels via quadruple hydrogen bonding and coordination crosslinking for controlled delivery of 5-fluorouracil. J. Biomater. Sci. Polym. Ed. 2020, 31, 712–728. [Google Scholar] [CrossRef]
- Valuev, I.L.; Vanchugova, L.V.; Valuev, L.I. Glucose-Sensitive Hydrogel Systems. Polym. Sci. 2011, 53, 385–389. [Google Scholar] [CrossRef]
- Charron, P.N.; Braddish, T.A.; Oldinski, R.A. PVA-gelatin hydrogels formed using combined theta-gel and cryo-gel fabrication techniques. J. Mech. Behav. Biomed. 2019, 92, 90–96. [Google Scholar] [CrossRef]
- Pawde, S.M.; Deshmukh, K. Characterization of polyvinyl alcohol/gelatin blend hydrogel films for biomedical applications. J. Appl. Polym. Sci. 2008, 109, 3431–3437. [Google Scholar] [CrossRef]
- Azad, A.K.; Al-Mahmood, S.M.A.; Chatterjee, B.; Wan Sulaiman, W.M.A.; Elsayed, T.M.; Doolaanea, A.A. Encapsulation of black seed oil in alginate beads as a ph-sensitive carrier for intestine-targeted drug delivery: In vitro, in vivo and ex vivo study. Pharmaceutics 2020, 12, 219. [Google Scholar] [CrossRef] [Green Version]
- Abdel Bary, E.M.; Harmal, A.N.; Saeed, A.; Gouda, M.A. Design, synthesis, characterization, swelling and in vitro drug release behavior of composite hydrogel beads based on methotrexate and chitosan incorporating antipyrine moiety. Polym. Plast. Technol. Eng. 2018, 57, 1906–1914. [Google Scholar] [CrossRef]
- Ranjha, N.M.; Hanif, M.; Afzal, Z.; Abbas, G. Diffusion coefficient, porosity measurement, dynamic and equilibrium swelling studies of acrylic acid/polyvinyl alcohol (aa/pva) hydrogels. Pak. J. Pharm. Sci. 2015, 1, 48–57. [Google Scholar] [CrossRef]
- Li, C.P.; Weng, M.C.; Huang, S.L. Preparation and Characterization of pH Sensitive Chitosan/3-Glycidyloxypropyl Trimethoxysilane (GPTMS) Hydrogels by Sol-Gel Method. Polymers 2020, 12, 1326. [Google Scholar] [CrossRef] [PubMed]
- Kalantari, K.; Mostafavi, E.; Saleh, B.; Soltantabar, P.; Webster, T.J. Chitosan/PVA hydrogels incorporated with green synthesized cerium oxide nanoparticles for wound healing applications. Eur. Polym. J. 2020, 134, 109853. [Google Scholar] [CrossRef]
- De Piano, R.; Caccavo, D.; Cascone, S.; Festa, C.; Lamberti, G.; Barba, A.A. Drug release from hydrogel-based matrix systems partially coated: Experiments and modeling. J. Drug Deliv. Sci. Technol. 2021, 61, 102146. [Google Scholar] [CrossRef]
- Erceg, T.; Stupar, A.; Cvetinov, M.; Vasić, V.; Ristić, I. Investigation the correlation between chemical structure and swelling, thermal and flocculation properties of carboxymethylcellulose hydrogels. J. Appl. Polym. Sci. 2021, 138, 50240. [Google Scholar] [CrossRef]
- Najafipour, A.; Gharieh, A.; Fassihi, A.; Sadeghi-Aliabadi, H.; Mahdavian, A.R. MTX-loaded dual thermoresponsive and pH-responsive magnetic hydrogel nanocomposite particles for combined controlled drug delivery and hyperthermia therapy of cancer. Mol. Pharm. 2020, 18, 275–284. [Google Scholar] [CrossRef]
- Varma, M.V.; Kaushal, A.M.; Garg, A.; Garg, S. Factors affecting mechanism and kinetics of drug release from matrix-based oral controlled drug delivery systems. Am. J. Drug Deliv. 2004, 2, 43–57. [Google Scholar] [CrossRef]
- Mahdavinia, G.R.; Mosallanezhad, A.; Soleymani, M.; Sabzi, M. Magnetic-and pH-responsive κ-carrageenan/chitosan complexes for controlled release of methotrexate anticancer drug. Int. J. Biol. Macromol. 2017, 97, 209–217. [Google Scholar] [CrossRef] [PubMed]
- Fuliaş, A.; Popoiu, C.; Vlase, G.; Vlase, T.; Oneţiu, D.; Săvoiu, G.; Ledeţi, I. Thermoanalytical and spectroscopic study on methotrexate–active substance and tablet. Dig. J. Nanomater. Biostruct. 2014, 9, 93–98. [Google Scholar]
- Yang, K.H.; Lindberg, G.; Soliman, B.; Lim, K.; Woodfield, T.; Narayan, R.J. Effect of Photoinitiator on Precursory Stability and Curing Depth of Thiol-Ene Clickable Gelatin. Polymers 2021, 13, 1877. [Google Scholar] [CrossRef]
- Bawa, P.; Pillay, V.; Choonara, Y.E.; Du Toit, L.C. Stimuli responsive polymers and their applications in drug delivery. Biomed. Mater. 2009, 4, 022001. [Google Scholar] [CrossRef]
- He, C.; Kim, S.W.; Lee, D.S. In-situ gelling stimuli-sensitive block copolymer hydrogels for drug delivery. J. Control. Release 2008, 127, 189–207. [Google Scholar] [CrossRef]
- Gupta, P.; Vermani, K.; Garg, S. Hydrogels: From controlled release to pH-responsivedrug delivery. Drug Discov. Today 2002, 7, 569–579. [Google Scholar] [CrossRef]
- Nawaz, S.; Khan, S.; Farooq, U.; Haider, M.S.; Ranjha, N.M.; Rasul, A.; Nawaz, A.; Arshad, N.; Hameed, R. Biocompatible hydrogel for the controlled delivery of the anti-hypertensive agent: Development, characterization and in vitro evaluation. Des. Monomers Polym. 2018, 21, 18–32. [Google Scholar] [CrossRef] [Green Version]
- Vadia, N.; Rajput, S. Study on formulation variables of methotrexate loaded mesoporous MCM-41 nanoparticles for dissolution enhancement. Eur. J. Pharm. Sci. 2012, 45, 8–18. [Google Scholar] [CrossRef]
- Ciekot, J.; Goszczynski, T.; Boratynki, J. Methods for methotrexate determination in macromolecular conjugates drug carrier. Acta Pol. Pharm. 2012, 69, 1342–1346. [Google Scholar] [PubMed]
- Herfarth, H.H.; Osterman, M.T.; Isaacs, K.L.; Lewis, J.D.; Sands, B.E. Efficacy of Methotrexate in Ulcerative Colitis: Failure or Promise. Inflamm. Bowel Dis. 2012, 16, 1421–1430. [Google Scholar] [CrossRef]
- Imanishi, H.; Okamura, N.; Yagi, M.; Noro, Y.; Moriya, Y.; Nakamura, T.; Hayakawa, A.; Takeshima, Y.; Sakaeda, T.; Matsuo, M.; et al. Genetic polymorphisms associated with adverse events and elimination of methotrexate in the childhood acute lymphoblastic leukemia and malignant lymphoma. J. Hum. Genet. 2007, 52, 166–171. [Google Scholar] [CrossRef] [PubMed] [Green Version]
- Stewart, J.S.; Cohen, E.E.; Licitra, L.; Van Herpen, C.M.; Khorprasert, C.; Soulieres, D.; Vodvarka, P.; Rischin, D.; Garin, A.M.; Hirsch, F.R.; et al. Phase III study of gefitinib compared with intravenous methotrexate for recurrent squamous cell carcinoma of the head and neck. J. Clin. Oncol. 2009, 27, 1864–1871. [Google Scholar] [CrossRef]
- Norman, J. Osteosarcoma: Review of the Past, Impact on the Future. The American Experience. Pediatric Adolesc. Osteosarcoma 2009, 152, 239–262. [Google Scholar]
- Terakawa, T.; Miyake, H.; Muramaki, M.; Takenaka, A.; Fujisawa, M. Salvage chemotherapy with methotrexate, etoposide and actinomycin D in men with metastatic noneminomatous germ cell tumors with choriocarcinoma component: A preliminary report. Int. J. Urol. 2010, 17, 881–885. [Google Scholar] [CrossRef] [PubMed]
- Szekanecz, E.; Andras, C.; Sandor, Z.; Antal-Szalmas, P.; Szanto, J.; Tamasi, L.; Kiss, E.; Szekanecz, Z. Malignancies and soluble tumor antigens in rheumatoid arthritis. Auto Immun. Rev. 2006, 6, 42–47. [Google Scholar] [CrossRef] [PubMed]
- Ha, J.H.; Lim, J.H.; Kim, J.W.; Cho, H.Y.; Jo, S.G.; Lee, S.H.; Eom, J.Y.; Lee, J.M.; Chung, B.G. Conductive GelMA–Collagen–AgNW Blended Hydrogel for Smart Actuator. Polymers 2021, 13, 1217. [Google Scholar] [CrossRef]
- Kalb, E.R.; Strober, B.; Weinstein, G.; Lebwohl, M. Methotrexate and Psoriasis: 2009 National Psoriasis Foundation Consensus Conference. J. Am. Acad Dermatol. 2009, 60, 824–837. [Google Scholar] [CrossRef]
- Zuckerman, S.T.; Rivera-Delgado, E.; Haley, R.M.; Korley, J.N.; von Recum, H.A. Elucidating the Structure-Function Relationship of Solvent and Cross-Linker on Affinity-Based Release from Cyclodextrin Hydrogels. Gels 2020, 6, 9. [Google Scholar] [CrossRef] [PubMed] [Green Version]
- Kannagi, R.; Izawa, M.; Koike, T.; Miyazaki, K.; Kimura, N. Carbohydrate-mediated cell adhesion in cancer metastasis and angiogenesis. Cancer Sci. 2004, 95, 377–384. [Google Scholar] [CrossRef] [PubMed]
- Mudassir, J.; Ranjha, N.M. Dynamic and equilibrium swelling studies: Cross-linked pH sensitive methyl methacrylate-co-itaconic acid (MMA-co-IA) hydrogels. J. Polym. Res. 2008, 15, 195–203. [Google Scholar] [CrossRef]
- Tekko, I.A.; Chen, G.; Domínguez-Robles, J.; Thakur, R.R.S.; Hamdan, I.M.; Vora, L.; Donnelly, R.F. Development and characterisation of novel poly (vinyl alcohol)/poly (vinyl pyrrolidone)-based hydrogel-forming microneedle arrays for enhanced and sustained transdermal delivery of methotrexate. Int. J. Pharm. 2020, 586, 119580. [Google Scholar] [CrossRef] [PubMed]


Publisher’s Note: MDPI stays neutral with regard to jurisdictional claims in published maps and institutional affiliations. |
© 2021 by the authors. Licensee MDPI, Basel, Switzerland. This article is an open access article distributed under the terms and conditions of the Creative Commons Attribution (CC BY) license (https://creativecommons.org/licenses/by/4.0/).
Share and Cite
Akhlaq, M.; Azad, A.K.; Ullah, I.; Nawaz, A.; Safdar, M.; Bhattacharya, T.; Uddin, A.B.M.H.; Abbas, S.A.; Mathews, A.; Kundu, S.K.; et al. Methotrexate-Loaded Gelatin and Polyvinyl Alcohol (Gel/PVA) Hydrogel as a pH-Sensitive Matrix. Polymers 2021, 13, 2300. https://doi.org/10.3390/polym13142300
Akhlaq M, Azad AK, Ullah I, Nawaz A, Safdar M, Bhattacharya T, Uddin ABMH, Abbas SA, Mathews A, Kundu SK, et al. Methotrexate-Loaded Gelatin and Polyvinyl Alcohol (Gel/PVA) Hydrogel as a pH-Sensitive Matrix. Polymers. 2021; 13(14):2300. https://doi.org/10.3390/polym13142300
Chicago/Turabian StyleAkhlaq, Muhammad, Abul Kalam Azad, Inam Ullah, Asif Nawaz, Muhammad Safdar, Tanima Bhattacharya, A. B. M. Helal Uddin, Syed Atif Abbas, Allan Mathews, Sukalyan Kumar Kundu, and et al. 2021. "Methotrexate-Loaded Gelatin and Polyvinyl Alcohol (Gel/PVA) Hydrogel as a pH-Sensitive Matrix" Polymers 13, no. 14: 2300. https://doi.org/10.3390/polym13142300
APA StyleAkhlaq, M., Azad, A. K., Ullah, I., Nawaz, A., Safdar, M., Bhattacharya, T., Uddin, A. B. M. H., Abbas, S. A., Mathews, A., Kundu, S. K., Miret, M. M., Murthy, H. C. A., & Nagaswarupa, H. P. (2021). Methotrexate-Loaded Gelatin and Polyvinyl Alcohol (Gel/PVA) Hydrogel as a pH-Sensitive Matrix. Polymers, 13(14), 2300. https://doi.org/10.3390/polym13142300