
The Evaluation of Torrefied Wood Using a Cone Calorimeter


Abstract
1. Introduction
2. Materials and Methods
3. Results and Discussion
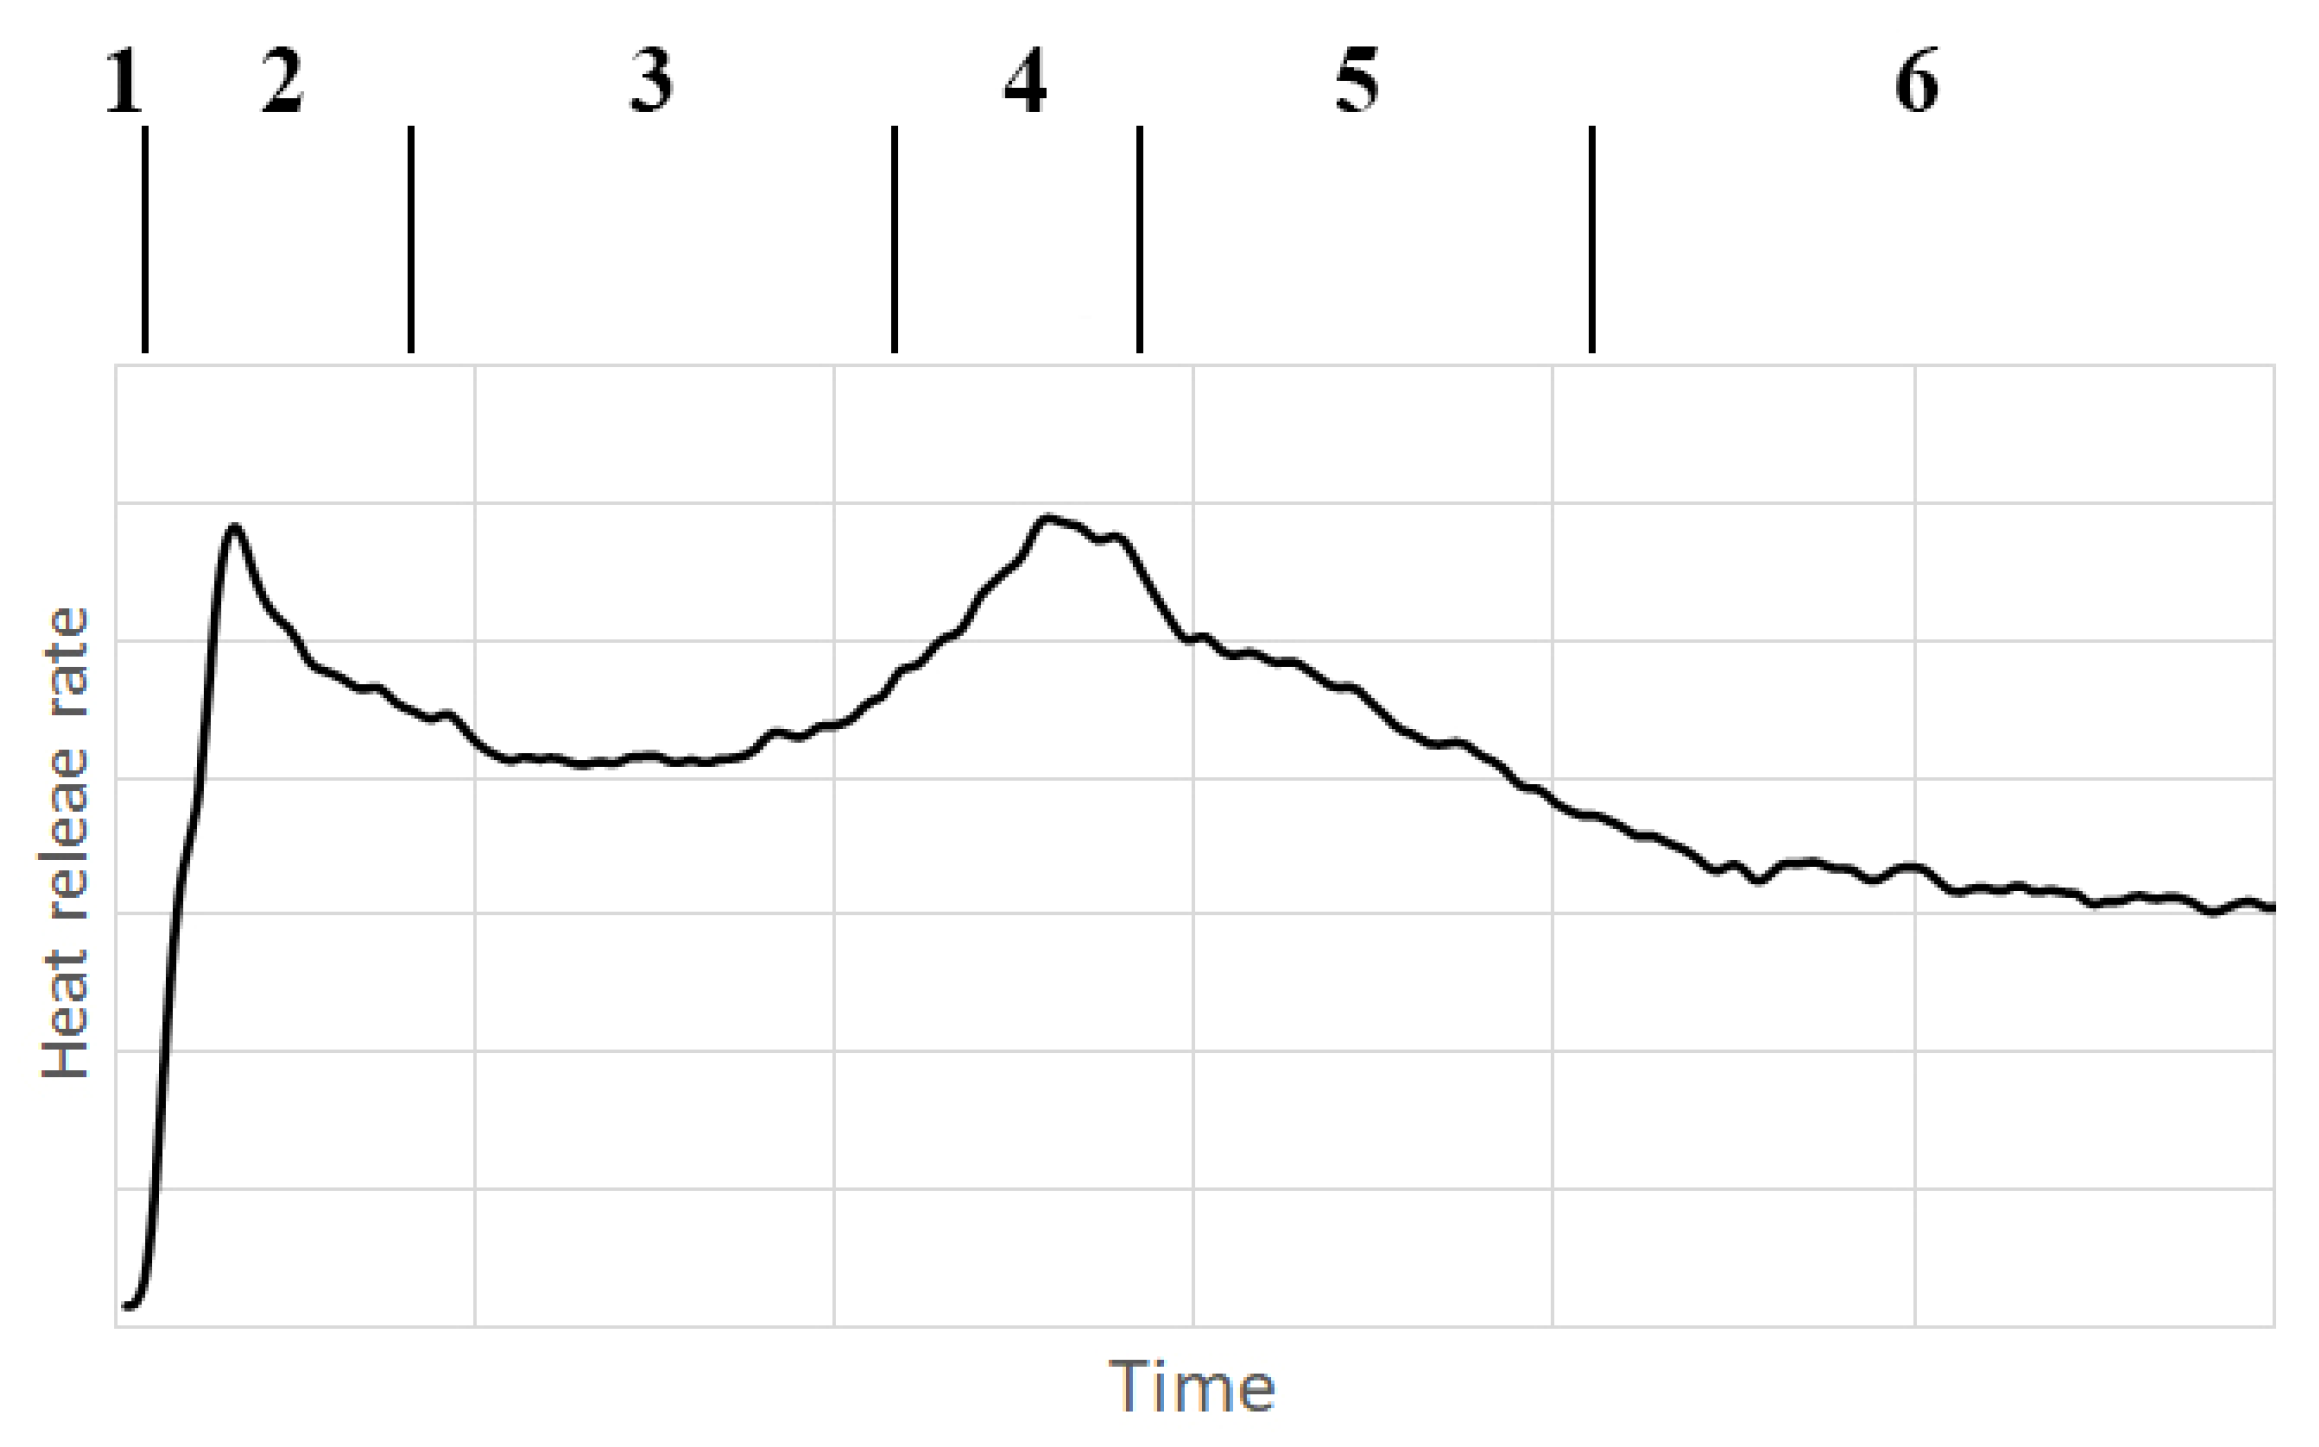
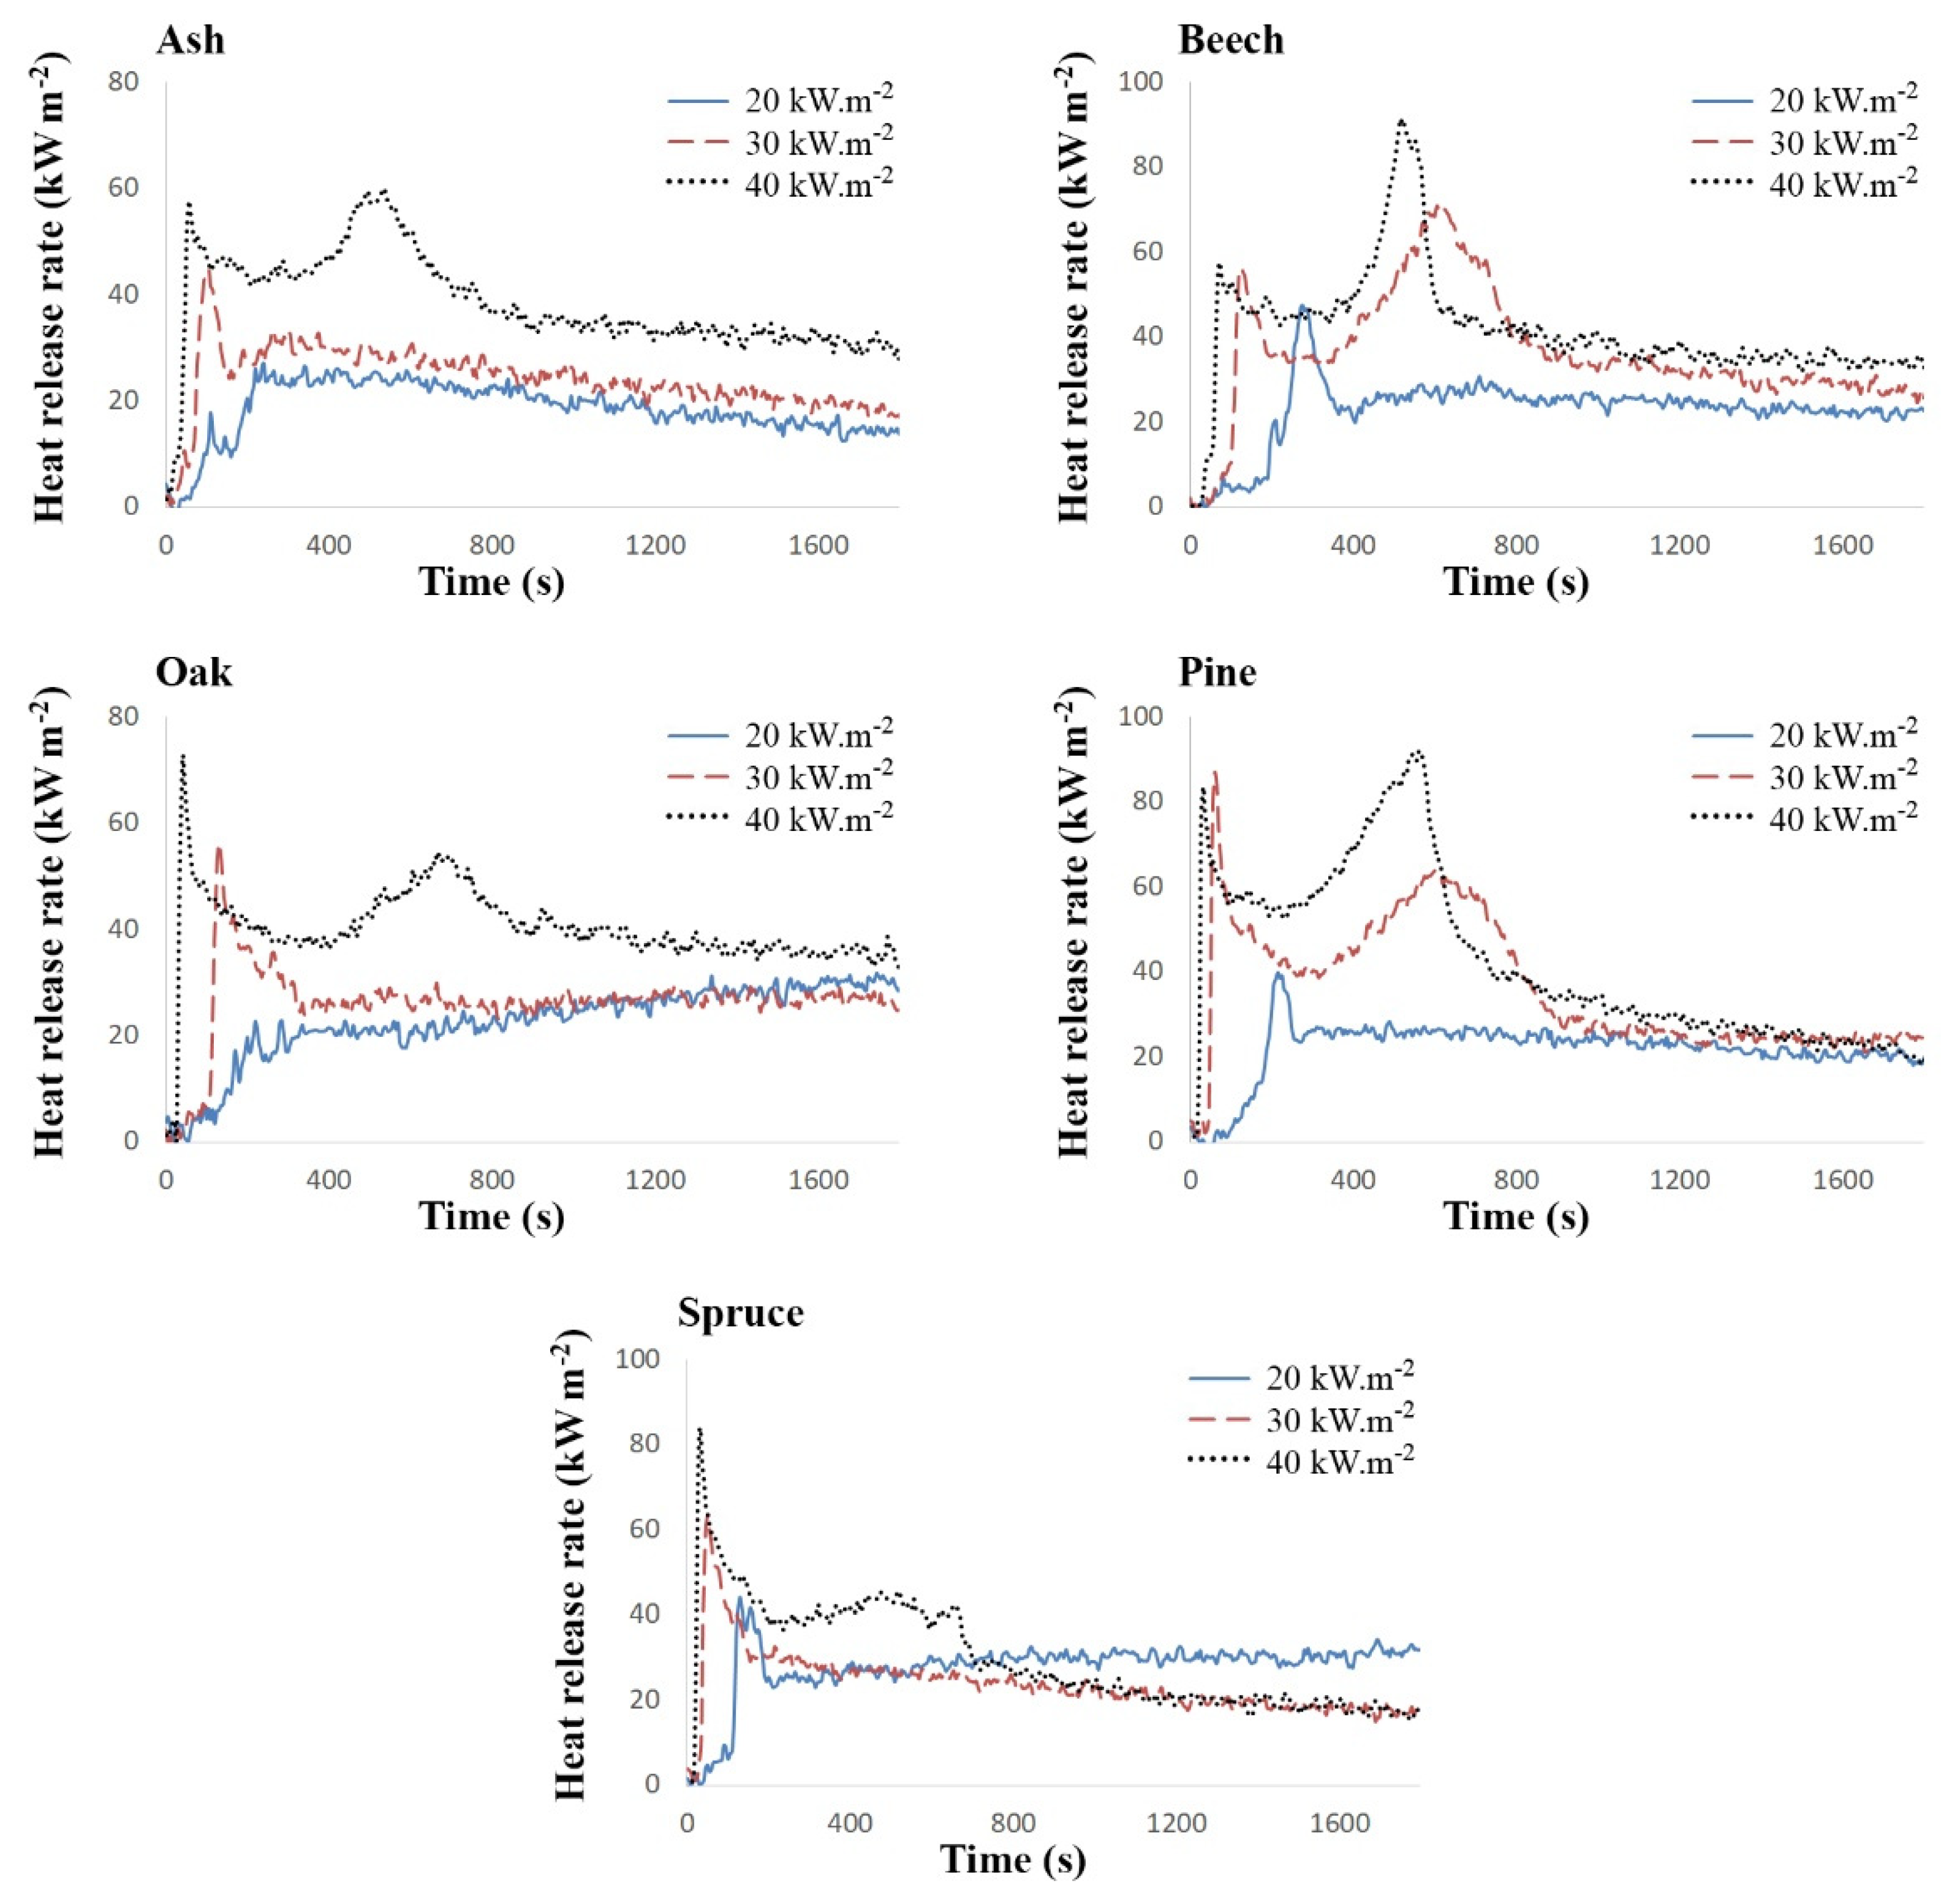
- The pre-initiation phase (the rate of heat release is essentially equal to zero, no visual changes in the samples can be observed),
- The initiation phase (heat release rate rapidly increases and then falls, it is possible to see the beginning of combustion),
- The even combustion phase (the rate of heat release is relatively constant, combustion appears even),
- The sample overheat phase (the heat release rate increases and reaches its second peak, it is possible to observe a stronger flame),
- The low combustion phase (the heat release rate decreases, it is possible to observe a decrease in the intensity of the flame, leading to extinction), and
- The heterogeneous combustion phase (the speed of heat release slowly decreases; it is possible to observe blazing of the sample).
4. Conclusions
Author Contributions
Funding
Conflicts of Interest
References
- Zorpas, A.A.; Pociovălişteanu, D.M.; Georgiadou, L.; Voukkali, I. Environmental and technical evaluation of the use of alternative fuels through multi-criteria analysis model. Prog. Ind. Ecol. 2016, 10, 3–15. [Google Scholar] [CrossRef]
- Brundtland Commission. Our common future, Chapter 2: Towards sustainable development. In World Commission on Environment and Development (WCED); United Nation: Geneva, Switzerland, 1987. [Google Scholar]
- Medic, D.; Darr, M.; Potter, B.; Shah, A. Effects of torrefaction process parameters on biomass feedstock upgrading. Fuel 2012, 91, 147–154. [Google Scholar] [CrossRef]
- International Energy Agency. Renewables Information: Overview; International Energy Agency: Paris, France, 2017. [Google Scholar]
- Lu, K.M.; Lee, W.J.; Chen, W.H.; Lin, T.C. Thermogravimetric analysis and kinetics of co-pyrolysis of raw/torrefied wood and coal blends. Appl. Ener. 2013, 105, 57–65. [Google Scholar] [CrossRef]
- Chen, W.H.; Kuo, P.C. Isothermal torrefaction kinetics of hemicellulose, cellulose, lignin and xylan using thermogravimetric analysis. Energy 2011, 36, 6451–6460. [Google Scholar] [CrossRef]
- Van der Stelt, M.J.C.; Gerhauser, H.; Kiel, J.H.A.; Ptasinski, K.J. Biomass upgrading by torrefaction for the production of biofuels: A review. Biomass Bioenergy 2011, 35, 3748–3762. [Google Scholar] [CrossRef]
- Bridgeman, T.G.; Jones, J.M.; Shield, I.; Williams, P.T. Torrefaction of reed canary grass, wheat straw and willow to enhance solid fuel qualities and combustion properties. Fuel 2008, 87, 844–856. [Google Scholar] [CrossRef]
- Prins, M.J.; Ptasinski, K.J.; Janssen, F.J.J.G. Torrefaction of wood: Part 1. Weight loss kinetics. J. Anal. Appl. Pyrolysis 2006, 77, 28–34. [Google Scholar] [CrossRef]
- Bourgois, J.; Bartholin, M.C.; Guyonnet, R. Thermal treatment of wood: Analysis of the obtained product. Wood Sci. Technol. 1989, 23, 303–310. [Google Scholar] [CrossRef]
- Chen, W.H.; Hsu, H.C.; Lu, K.M.; Lee, W.J.; Lin, T.C. Thermal pretreatment of wood (Lauan) block by torrefaction and its influence on the properties of the biomass. Energy 2011, 36, 3012–3021. [Google Scholar] [CrossRef]
- Wannapeera, J.; Worasuwannarak, N. Examinations of chemical properties and pyrolysis behaviors of torrefied woody biomass prepared at the same torrefaction mass yields. J. Anal. Appl. Pyrol. 2015, 115, 279–287. [Google Scholar] [CrossRef]
- Magdziarz, A.; Wilk, M.; Straka, R. Combustion process of torrefied wood biomass. J. Therm. Anal. Calorim. 2017, 127, 1339–1349. [Google Scholar] [CrossRef]
- Mi, B.; Liu, Z.; Hu, W.; Wei, P.; Jiang, Z.; Fei, B. Investigating pyrolysis and combustion characteristics of torrefied bamboo, torrefied wood and their blends. Biores. Technol. 2016, 209, 50–55. [Google Scholar] [CrossRef] [PubMed]
- Phanphanich, M.; Mani, S. Impact of torrefaction on the grindability and fuel characteristics of forest biomass. Bioresour. Technol. 2011, 102, 1246–1253. [Google Scholar] [CrossRef] [PubMed]
- Prins, M.J.; Ptasinski, K.J.; Janssen, F.J. More efficient biomass gasification via torrefaction. Energy 2006, 31, 3458–3470. [Google Scholar] [CrossRef]
- Statistical Office of the Slovak Republic. Waste in Slovak Republic in 2019; Statistical Office of the Slovak Republic: Bratislava, Slovakia, 2020; p. 99.
- Antov, P.; Savov, V.; Krišt’ák, L.; Réh, R.; Mantanis, G.I. Eco-friendly, high-density fiberboards bonded with urea-formaldehyde and ammonium lignosulfonate. Polymers 2021, 13, 220. [Google Scholar] [CrossRef]
- Statistical Office of the Slovak Republic. Forest Management in the Slovak Republic in 2005–2009; Statistical Office of the Slovak Republic: Bratislava, Slovakia, 2010; p. 53.
- Ministry of Agriculture and Development of the Slovak Republic, National Forest Centre. Green report. In Report on the Forest Sector of the Slovak Republic 2019; Ministry of Agriculture and Development of the Slovak Republic, National Forest Centre: Bratislava, Slovakia, 2020; p. 68. [Google Scholar]
- Vandličková, M.; Marková, I.; Makovická Osvaldová, L.; Gašpercová, S.; Svetlík, J.; Vraniak, J. Tropical wood dusts—granulometry, morfology and ignition temperature. Appl. Sci. 2020, 10, 7608. [Google Scholar] [CrossRef]
- Wang, Z.; Ning, X.; Zhu, K.; Hu, J.; Yang, H.; Wang, J. Evaluating the thermal failure risk of large-format lithium-ion batteries using a cone calorimeter. J. Fire Sci. 2019, 37, 81–95. [Google Scholar] [CrossRef]
- Cai, W.; Zhao, Z.; Wang, W.; Guo, W.; Wang, X.; Hu, Y. Combustion behavior characterization of major crops through cone calorimeter. Fire Mater. 2020, 44, 693–703. [Google Scholar] [CrossRef]
- Liu, Z.; Hu, W.; Jiang, Z.; Mi, B.; Fei, B. Investigating combustion behaviors of bamboo, torrefied bamboo, coal and their respective blends by thermogravimetric analysis. Renew. Energ. 2016, 87, 346–352. [Google Scholar] [CrossRef]
- EN ISO 18123:2015—Solid biofuels. Determination of the Content of Volatile Matter; International Organization for Standardization: Geneva, Switzerland, 2015. [Google Scholar]
- EN ISO 18122: 2015—Solid Biofuels. Determination of Ash Content; International Organization for Standardization: Geneva, Switzerland, 2015. [Google Scholar]
- Bach, Q.V.; Skreiberg, Ø. Upgrading biomass fuels via wet torrefaction: A review and comparison with dry torrefaction. Renew. Sustain. Energy Rev. 2016, 54, 665–677. [Google Scholar] [CrossRef]
- ISO 5660-1:2015—Reaction to fire tests. Heat Release, Smoke Production and Mass Loss Rate. Part 1: Heat Release Rate (Cone Calorimeter Method) and Smoke Production Rate (Dynamic Measurement); International Organization for Standardization: Geneva, Switzerland, 2015. [Google Scholar]
- Ferek, R.J.; Reid, J.S.; Hobbs, P.V.; Blake, D.R.; Liousse, C. Emission factors of hydrocarbons, halocarbons, trace gases and particles from biomass burning in Brazil. J. Geophys. Res. Atmos. 1998, 103, 32107–32118. [Google Scholar] [CrossRef]
- Fateh, T.; Rogaume, T.; Luche, J.; Richard, F.; Jabouille, F. Characterization of the thermal decomposition of two kinds of plywood with a cone calorimeter—FTIR apparatus. J. Anal. Appl. Pyrol. 2014, 107, 87–100. [Google Scholar] [CrossRef]
- Xu, Q.; Chen, L.; Harries, K.A.; Zhang, F.; Liu, Q.; Feng, J. Combustion and charring properties of five common constructional wood species from cone calorimeter tests. Constr. Build. Mater. 2015, 96, 416–427. [Google Scholar] [CrossRef]
- Spearpoint, M.J.; Quintiere, J.G. Predicting the piloted ignition of wood in the cone calorimeter using an integral model—effect of species, grain orientation and heat flux. Fire Saf. J. 2001, 36, 391–415. [Google Scholar] [CrossRef]
- Hagen, M.; Hereid, J.; Delichatsios, M.A.; Zhang, J.; Bakirtzis, D. Flammability assessment of fire-retarded Nordic Spruce wood using thermogravimetric analyses and cone calorimetry. Fire Saf. J. 2009, 44, 1053–1066. [Google Scholar] [CrossRef]
- Wang, Y.; Zhao, J. Facile preparation of slag or fly ash geopolymer composite coatings with flame resistance. Constr. Build. Mater. 2019, 203, 655–661. [Google Scholar] [CrossRef]
- Ritchie, S.J.; Steckler, K.D.; Hamins, A.; Cleary, T.G.; Yang, J.C.; Kashiwagi, T. The effect of sample size on the heat release rate of charring materials. Fire Saf. Sci. 1997, 5, 177–188. [Google Scholar] [CrossRef]
- Osvaldová Makovická, L.; Castellanos, J.-R.S. Burning rate of selected hardwood tree species. Acta Fac. Xylologiae Zvolen Publica Slovaca 2019, 61, 91–97. [Google Scholar]
- Bourgois, J.; Guyonnet, R. Characterization and analysis of torrefied wood. Wood Sci. Technol. 1988, 22, 143–155. [Google Scholar] [CrossRef]
- Manouchehrinejad, M.; Van Giesen, I.; Mani, S. Grindability of torrefied wood chips and wood pellets. Fuel Process. Technol. 2018, 182, 45–55. [Google Scholar] [CrossRef]
- Lee, Y.; Yang, W.; Chae, T.; Kang, B.; Park, J.; Ryu, C. Comparative Characterization of a Torrefied Wood Pellet under Steam and Nitrogen Atmospheres. Energy Fuel. 2018, 32, 5109–5114. [Google Scholar] [CrossRef]
- Strandberg, M.; Olofsson, I.; Pommer, L.; Wiklund-Lindström, S.; Åberg, K.; Nordin, A. Effects of temperature and residence time on continuous torrefaction of spruce wood. Fuel Process. Technol. 2015, 134, 387–398. [Google Scholar] [CrossRef]
- Yang, I.; Cooke-Willis, M.; Song, B.; Hall, P. Densification of torrefied Pinus radiata sawdust as a solid biofuel: Effect of key variables on the durability and hydrophobicity of briquettes. Fuel Process. Technol. 2021, 214, 106719. [Google Scholar] [CrossRef]
- Ranzi, E.; Faravelli, T.; Manenti, F. Pyrolysis, gasification, and combustion of solid fuels. Adv. Chem. Eng. 2016, 49, 1–94. [Google Scholar]
- Elaieb, M.T.; Khouaja, A.; Khouja, M.L.; Valette, J.; Volle, G.; Candelier, K. Comparative study of local tunisian woods properties and the respective qualities of their charcoals produced by a new industrial eco-friendly carbonization process. Waste Biomass Valori. 2018, 9, 1199–1211. [Google Scholar] [CrossRef]
- Prins, M.J.; Ptasinski, K.J.; Janssen, F.J.J.G. From coal to biomass gasification: Comparison of thermodynamic efficiency. Energy 2007, 32, 1248–1259. [Google Scholar] [CrossRef]
- Tran, H.C.; White, R.H. Burning rate of solid wood measured in a heat release rate calorimeter. Fire Mater. 1992, 16, 197–206. [Google Scholar] [CrossRef]
- Luptáková, J.; Kačík, F.; Mitterová, I.; Zachar, M. Influence of Temperature of Thermal Modification on the Fire-technical Characteristics of Spruce Wood. BioResources 2019, 14, 3795–3807. [Google Scholar]
- Martinka, J.; Hroncová, E.; Chrebet, T.; Balog, K. The influence of spruce wood heat treatment on its thermal stability and burning process. Eur. J. Wood Wood Prod. 2014, 72, 477–486. [Google Scholar] [CrossRef]
- Xing, D.; Li, J. Effects of heat treatment on thermal decomposition and combustion performance of Larix spp. wood. BioResources 2014, 9, 4274–4287. [Google Scholar] [CrossRef]
- Lahtela, V.; Kärki, T. The influence of melamine impregnation and heat treatment on the fire performance of Scots pine (Pinus sylvetris) wood. Fire Mater. 2016, 40, 731–737. [Google Scholar] [CrossRef]
- Batiot, B.; Luche, J.; Rogaume, T. Thermal and chemical analysis of flammability and combustibility of fir wood in cone calorimeter coupled to FTIR apparatus. Fire Mater. 2014, 38, 418–431. [Google Scholar] [CrossRef]
- Moghtaderi, B.; Novozhilov, V.; Fletcher, D.F.; Kent, J.H. A new correlation for bench-scale piloted ignition data of wood. Fire Saf. J. 1997, 29, 41–59. [Google Scholar] [CrossRef]
- Xu, Q.; Chen, L.; Harries, K.A.; Li, X. Combustion performance of engineered bamboo from cone calorimeter tests. Eur. J. Wood Wood Prod. 2017, 75, 161–173. [Google Scholar] [CrossRef]
- Park, H.J.; Lee, S.M. Combustion Characteristics of Spruce Wood by Pressure Impregnation with Waterglass and Carbon Dioxide. Fire Sci. Eng. 2012, 26, 18–23. [Google Scholar] [CrossRef][Green Version]
- Shields, T.J.; Silcock, G.W.; Murray, J.J. Evaluating ignition data using the flux time product. Fire Mater. 1994, 18, 243–254. [Google Scholar] [CrossRef]
- Maake, T.; Asante, J.; Mwakikunga, B. Fire performance properties of commonly used South African hardwood. J. Fire Sci. 2020, 38, 415–432. [Google Scholar] [CrossRef]


| Torrefied Wood | Weight of Raw Samples (g) | Weight of Torrefied Samples (g) | Mass Yield of Torrefied Wood (%) |
|---|---|---|---|
| Ash | 127.95 (±2.01) | 48.31 (±2.39) | 37.77 (±2.13) |
| Beech | 131.11 (±4.28) | 50.52 (±3.24) | 38.51 (±1.65) |
| Oak | 127.06 (±3.12) | 58.91 (±3.30) | 46.40 (±3.05) |
| Pine | 88.28 (±3.04) | 38.98 (±1.44) | 44.20 (±2.30) |
| Spruce | 81.05 (±1.88) | 35.91 (±1.33) | 44.30 (±1.23) |
| Torrefied Wood | Proximate Analysis (%) | Ultimate Analysis (%) | ||||||
|---|---|---|---|---|---|---|---|---|
| Volatile Matter | Fixed Carbon | Ash | C | H | O a | N | S | |
| Ash | 36.78 (±2.68) | 62.11 (±2.54) | 1.11 (±0.31) | 71.27 (±0.62) | 3.79 (±0.07) | 23.52 (±0.22) | 0.22 (±0.04) | 0.08 (±0.03) |
| Beech | 41.88 (±0.34) | 57.16 (±0.18) | 0.96 (±0.24) | 70.55 (±0.57) | 4.03 (±0.07) | 24.23 (±0.27) | 0.23 (±0.07) | 0.00 (±0.00) |
| Oak | 42.16 (±0.35) | 57.41 (±0.53) | 0.44 (±0.20) | 69.57 (±0.56) | 4.21 (±0.09) | 25.61 (±0.28) | 0.16 (±0.06) | 0.01 (±0.01) |
| Pine | 44.60 (±1.67) | 54.70 (±1.69) | 0.70 (±0.07) | 72.57 (±0.72) | 4.61 (±0.08) | 21.91 (±0.30) | 0.19 (±0.03) | 0.02 (±0.01) |
| Spruce | 42.53 (±2.47) | 56.80 (±2.26) | 0.67 (±0.22) | 70.59 (±0.63) | 4.27 (±0.06) | 24.34 (±0.25) | 0.13 (±0.03) | 0.00 (±0.00) |
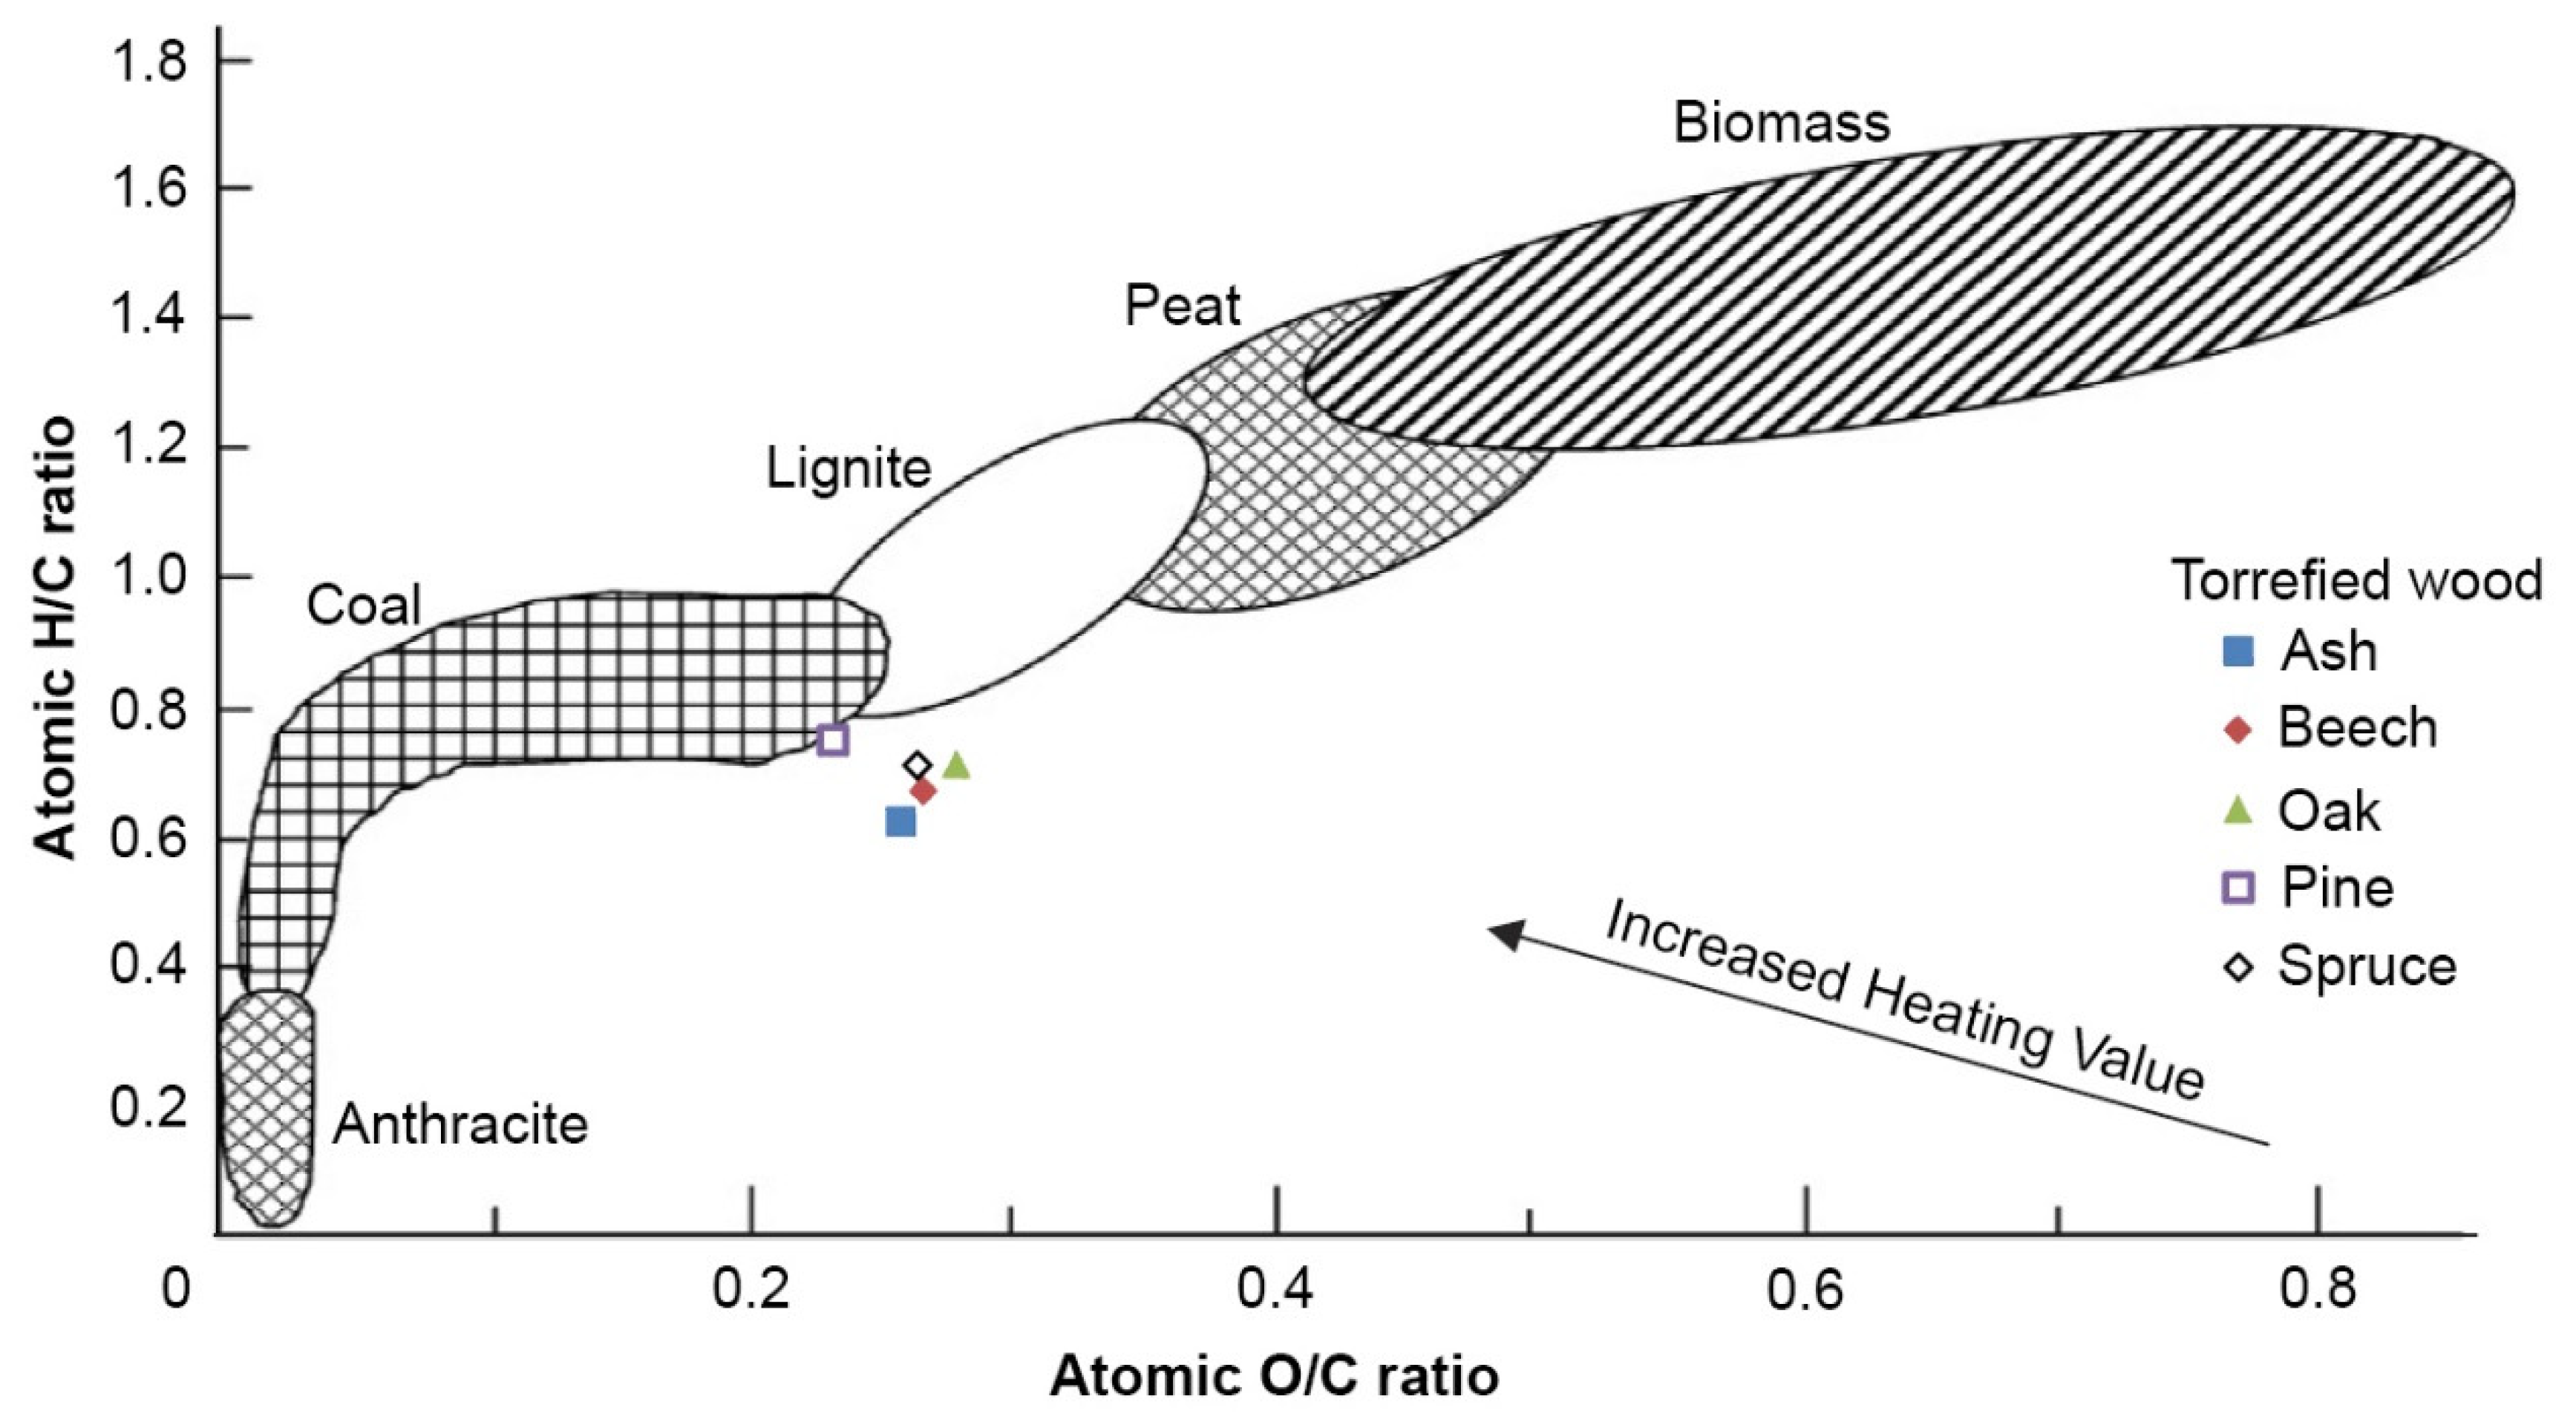
| Torrefied Wood | HHV (kJ g−1) | Energy Yield (%) | Atomic O/C Ratio (-) | Atomic H/C Ratio (-) |
|---|---|---|---|---|
| Ash | 28.79 (±0.3) | 54.57 (±2.90) | 0.26 | 0.63 |
| Beech | 28.25 (±0.7) | 55.02 (±1.99) | 0.27 | 0.68 |
| Oak | 28.18 (±0.1) | 66.58 (±4.45) | 0.28 | 0.72 |
| Pine | 30.26 (±1.0) | 63.83 (±1.09) | 0.23 | 0.76 |
| Spruce | 28.64 (±0.7) | 63.22 (±1.94) | 0.27 | 0.72 |
| Torrefied Wood | External Heat Flux | pHRR [kW m−2] | Time to pHRR [s] | Time to Ignition [s] | Average HRR [kW m−2] | ||||
|---|---|---|---|---|---|---|---|---|---|
| First | Second | First | Second | 300 s | 600 s | 1200 s | |||
| Ash | 20 | 27.08 | - | 240 | - | 180 | 23.59 | 23.62 | 21.57 |
| 30 | 44.72 | 33.44 | 105 | 260 | 69 | 30.74 | 29.71 | 27.05 | |
| 40 | 57.68 | 60.00 | 55 | 535 | 35 | 44.92 | 48.37 | 42.43 | |
| Beech | 20 | 47.52 | 30.83 | 275 | 710 | 246 | 28.67 | 28.18 | 26.53 |
| 30 | 56.49 | 71.09 | 125 | 615 | 102 | 38.43 | 48.17 | 42.33 | |
| 40 | 57.79 | 91.54 | 70 | 515 | 51 | 46.56 | 54.31 | 46.76 | |
| Oak | 20 | 22.82 | 31.74 | 285 | 1745 | 165 | 19.23 | 20.03 | 22.61 |
| 30 | 56.22 | 29.86 | 130 | 655 | 107 | 32.79 | 29.72 | 28.08 | |
| 40 | 72.78 | 54.34 | 40 | 670 | 24 | 43.68 | 42.92 | 42.90 | |
| Pine | 20 | 39.75 | 28.19 | 215 | 490 | 181 | 27.26 | 26.56 | 25.01 |
| 30 | 86.86 | 64.12 | 60 | 605 | 45 | 47.24 | 50.37 | 42.60 | |
| 40 | 83.620 | 91.99 | 30 | 560 | 17 | 58.34 | 67.01 | 51.61 | |
| Spruce | 20 | 44.16 | 34.38 | 130 | 1695 | 110 | 28.05 | 27.59 | 28.75 |
| 30 | 63.43 | - | 50 | - | 33 | 35.07 | 30.76 | 26.73 | |
| 40 | 83.99 | 49.08 | 30 | 125 | 17 | 46.79 | 44.25 | 35.12 | |
| ANOVA Coefficients | Average HRR in Time Interval [s] | ||
|---|---|---|---|
| 300 | 600 | 1200 | |
| p (wood species) | 0.0108 | 0.0218 | 0.1009 |
| F (wood species) | 6.8152 | 5.3207 | 2.7934 |
| Fcrit (wood species) | 3.8379 | 3.8379 | 3.8379 |
| p (heat flux) | 1.38 × 10⁻⁵ | 0.0002 | 0.0009 |
| F (heat flux) | 61.62 | 28.65 | 18.65 |
| Fcrit (heat flux) | 4.4589 | 4.4589 | 4.4589 |
| Torrefied Wood | Combustion Efficiency [%] | ||
|---|---|---|---|
| qe = 20 kW m−2 | qe = 30 kW m−2 | qe = 40 kW m−2 | |
| Ash | 75.1 (6.8) bc | 80.7 (9.5) | 89.4 (5.4) |
| Beech | 74.7 (7.2) abd | 87.9 (5.8) a | 92.1 (4.5) a |
| Oak | 61.8 (10.2) | 73.1 (9.3) | 88.5 (5.5) |
| Pine | 72.3 (6.9) a | 87.6 (6.1) a | 92.2 (4.2) a |
| Spruce | 74.4 (7.0) cd | 77.8 (4.8) | 85.7 (7.4) |
| ANOVA Coefficients | Heat flux [kW·m−2] | ||
|---|---|---|---|
| 20 | 30 | 40 | |
| p | 3.9 × 10−137 | 2.7 × 10−183 | 1 × 10−66 |
| F | 192.03 | 272.77 | 85.75 |
| Fcrit | 2.38 | 2.38 | 2.38 |
| Torrefied Wood | Critical Heat Flux [kW m−2] | Thermal Response Parameter [kW s0.5 m−2] | R2 [-] | Ignition Temperature [°C] |
|---|---|---|---|---|
| Ash | 5.7 | 240 | 0.9997 | 303 |
| Beech | 4.67 | 297 | 0.9981 | 277 |
| Oak | 13.2 | 179 | 0.8590 | 428 |
| Pine | 15.2 | 134 | 0.9959 | 452 |
| Spruce | 8.9 | 152 | 0.9984 | 365 |
| Ignition Parameter | Value ± Standard Deviation |
|---|---|
| Critical heat flux [kW·m−2] | 9.5 ± 4.6 |
| Thermal response parameter [kW·s0.5·m−2] | 200.4 ± 67.3 |
| Ignition temperature [°C] | 365 ± 76 |
| Wood | Critical Heat Flux [kW m−2] | Thermal Response Parameter [kW s0.5 m−2] | Ignition Temperature [°C] | Source |
|---|---|---|---|---|
| Douglas fir | 18 | 182 | 478 | [31] |
| Scots pine | 19 | 164 | 488 | [31] |
| Southern pine | 19 | 201 | 488 | [31] |
| Shorea | 16 | 152 | 456 | [31] |
| Merbau | 40 | 275 | 643 | [31] |
| Redwood | 15.5 | - | 375 | [32] |
| Red oak | 108 | - | 304 | [32] |
| Douglas fir | 16.0 | - | 384 | [32] |
| Maple | 13.9 | - | 354 | [32] |
| Nordic spruce | 19.0 | 291 | 488 | [33] |
| Fir | 11.6–12.0 | 128–144 | 372.7 | [50] |
| Radiata pine | 13.2 | - | - | [51] |
| Pacific maple | 10.3 | - | - | [51] |
| Sugar pine | 14.0 | - | - | [51] |
| Bamboo | 6.0–8.0 | 235–376 | 297–340 | [52] |
| Spruce | 10.1 | - | - | [53] |
| Softwood | 10.0 | - | - | [54] |
| Leadwood | 15.0 | 376.2 | - | [55] |
| Mopani | 14.4 | 161.2 | - | [55] |
| Tamboti | 5.9 | 352.7 | - | [55] |
| Stinkwood | 9.2 | 173.6 | - | [55] |
| Real Yellowwood | 1.3 | 232.2 | - | [55] |
Publisher’s Note: MDPI stays neutral with regard to jurisdictional claims in published maps and institutional affiliations. |
© 2021 by the authors. Licensee MDPI, Basel, Switzerland. This article is an open access article distributed under the terms and conditions of the Creative Commons Attribution (CC BY) license (https://creativecommons.org/licenses/by/4.0/).
Share and Cite
Rantuch, P.; Martinka, J.; Ház, A. The Evaluation of Torrefied Wood Using a Cone Calorimeter. Polymers 2021, 13, 1748. https://doi.org/10.3390/polym13111748
Rantuch P, Martinka J, Ház A. The Evaluation of Torrefied Wood Using a Cone Calorimeter. Polymers. 2021; 13(11):1748. https://doi.org/10.3390/polym13111748
Chicago/Turabian StyleRantuch, Peter, Jozef Martinka, and Aleš Ház. 2021. "The Evaluation of Torrefied Wood Using a Cone Calorimeter" Polymers 13, no. 11: 1748. https://doi.org/10.3390/polym13111748
APA StyleRantuch, P., Martinka, J., & Ház, A. (2021). The Evaluation of Torrefied Wood Using a Cone Calorimeter. Polymers, 13(11), 1748. https://doi.org/10.3390/polym13111748