
Analysis of Raised Feature Failures on 3D Printed Injection Moulds


Abstract

1. Introduction
1.1. Injection Moulding (IM)
1.2. Rapid Tooling (RT)
1.3. Shortcomings of 3D Printed Injection Moulds (3DIM)
1.4. Current State of the Art
1.5. Overview of the Paper
2. Materials and Methods
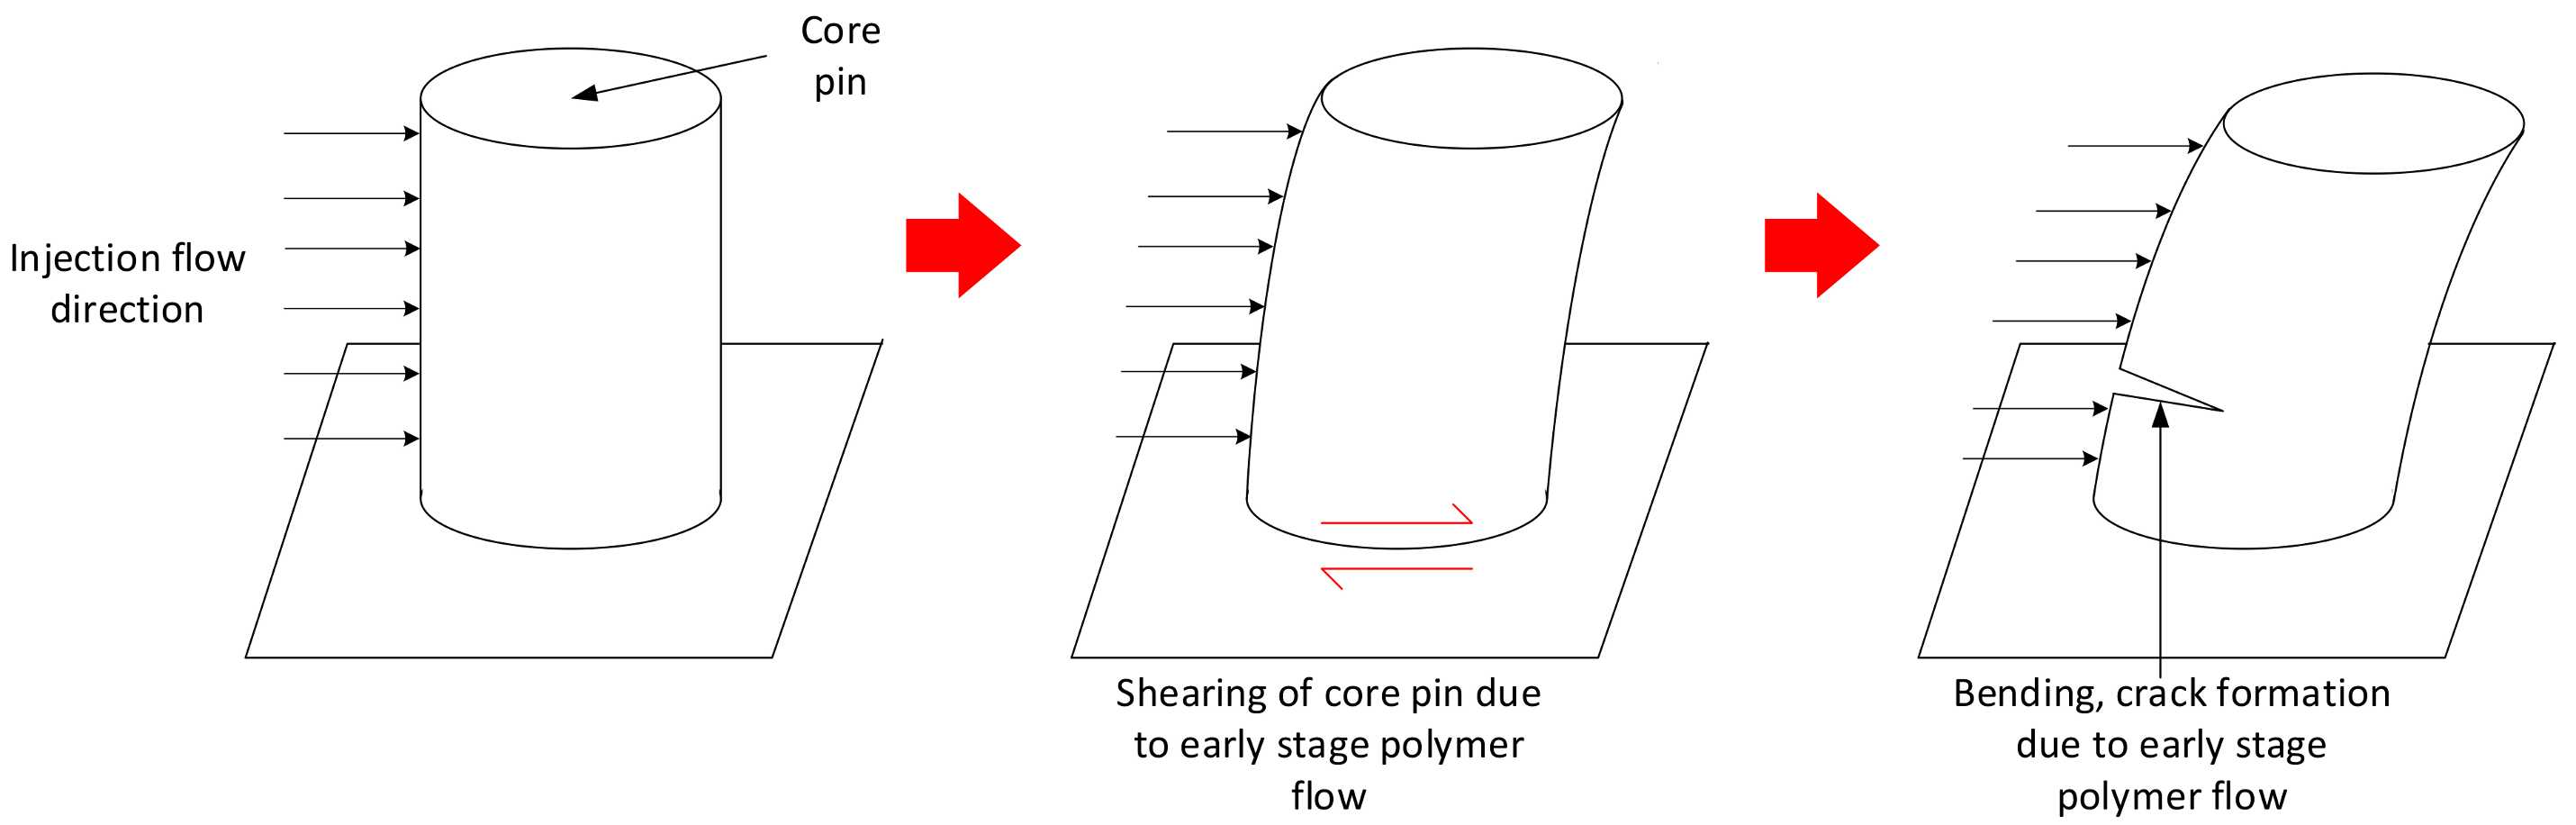
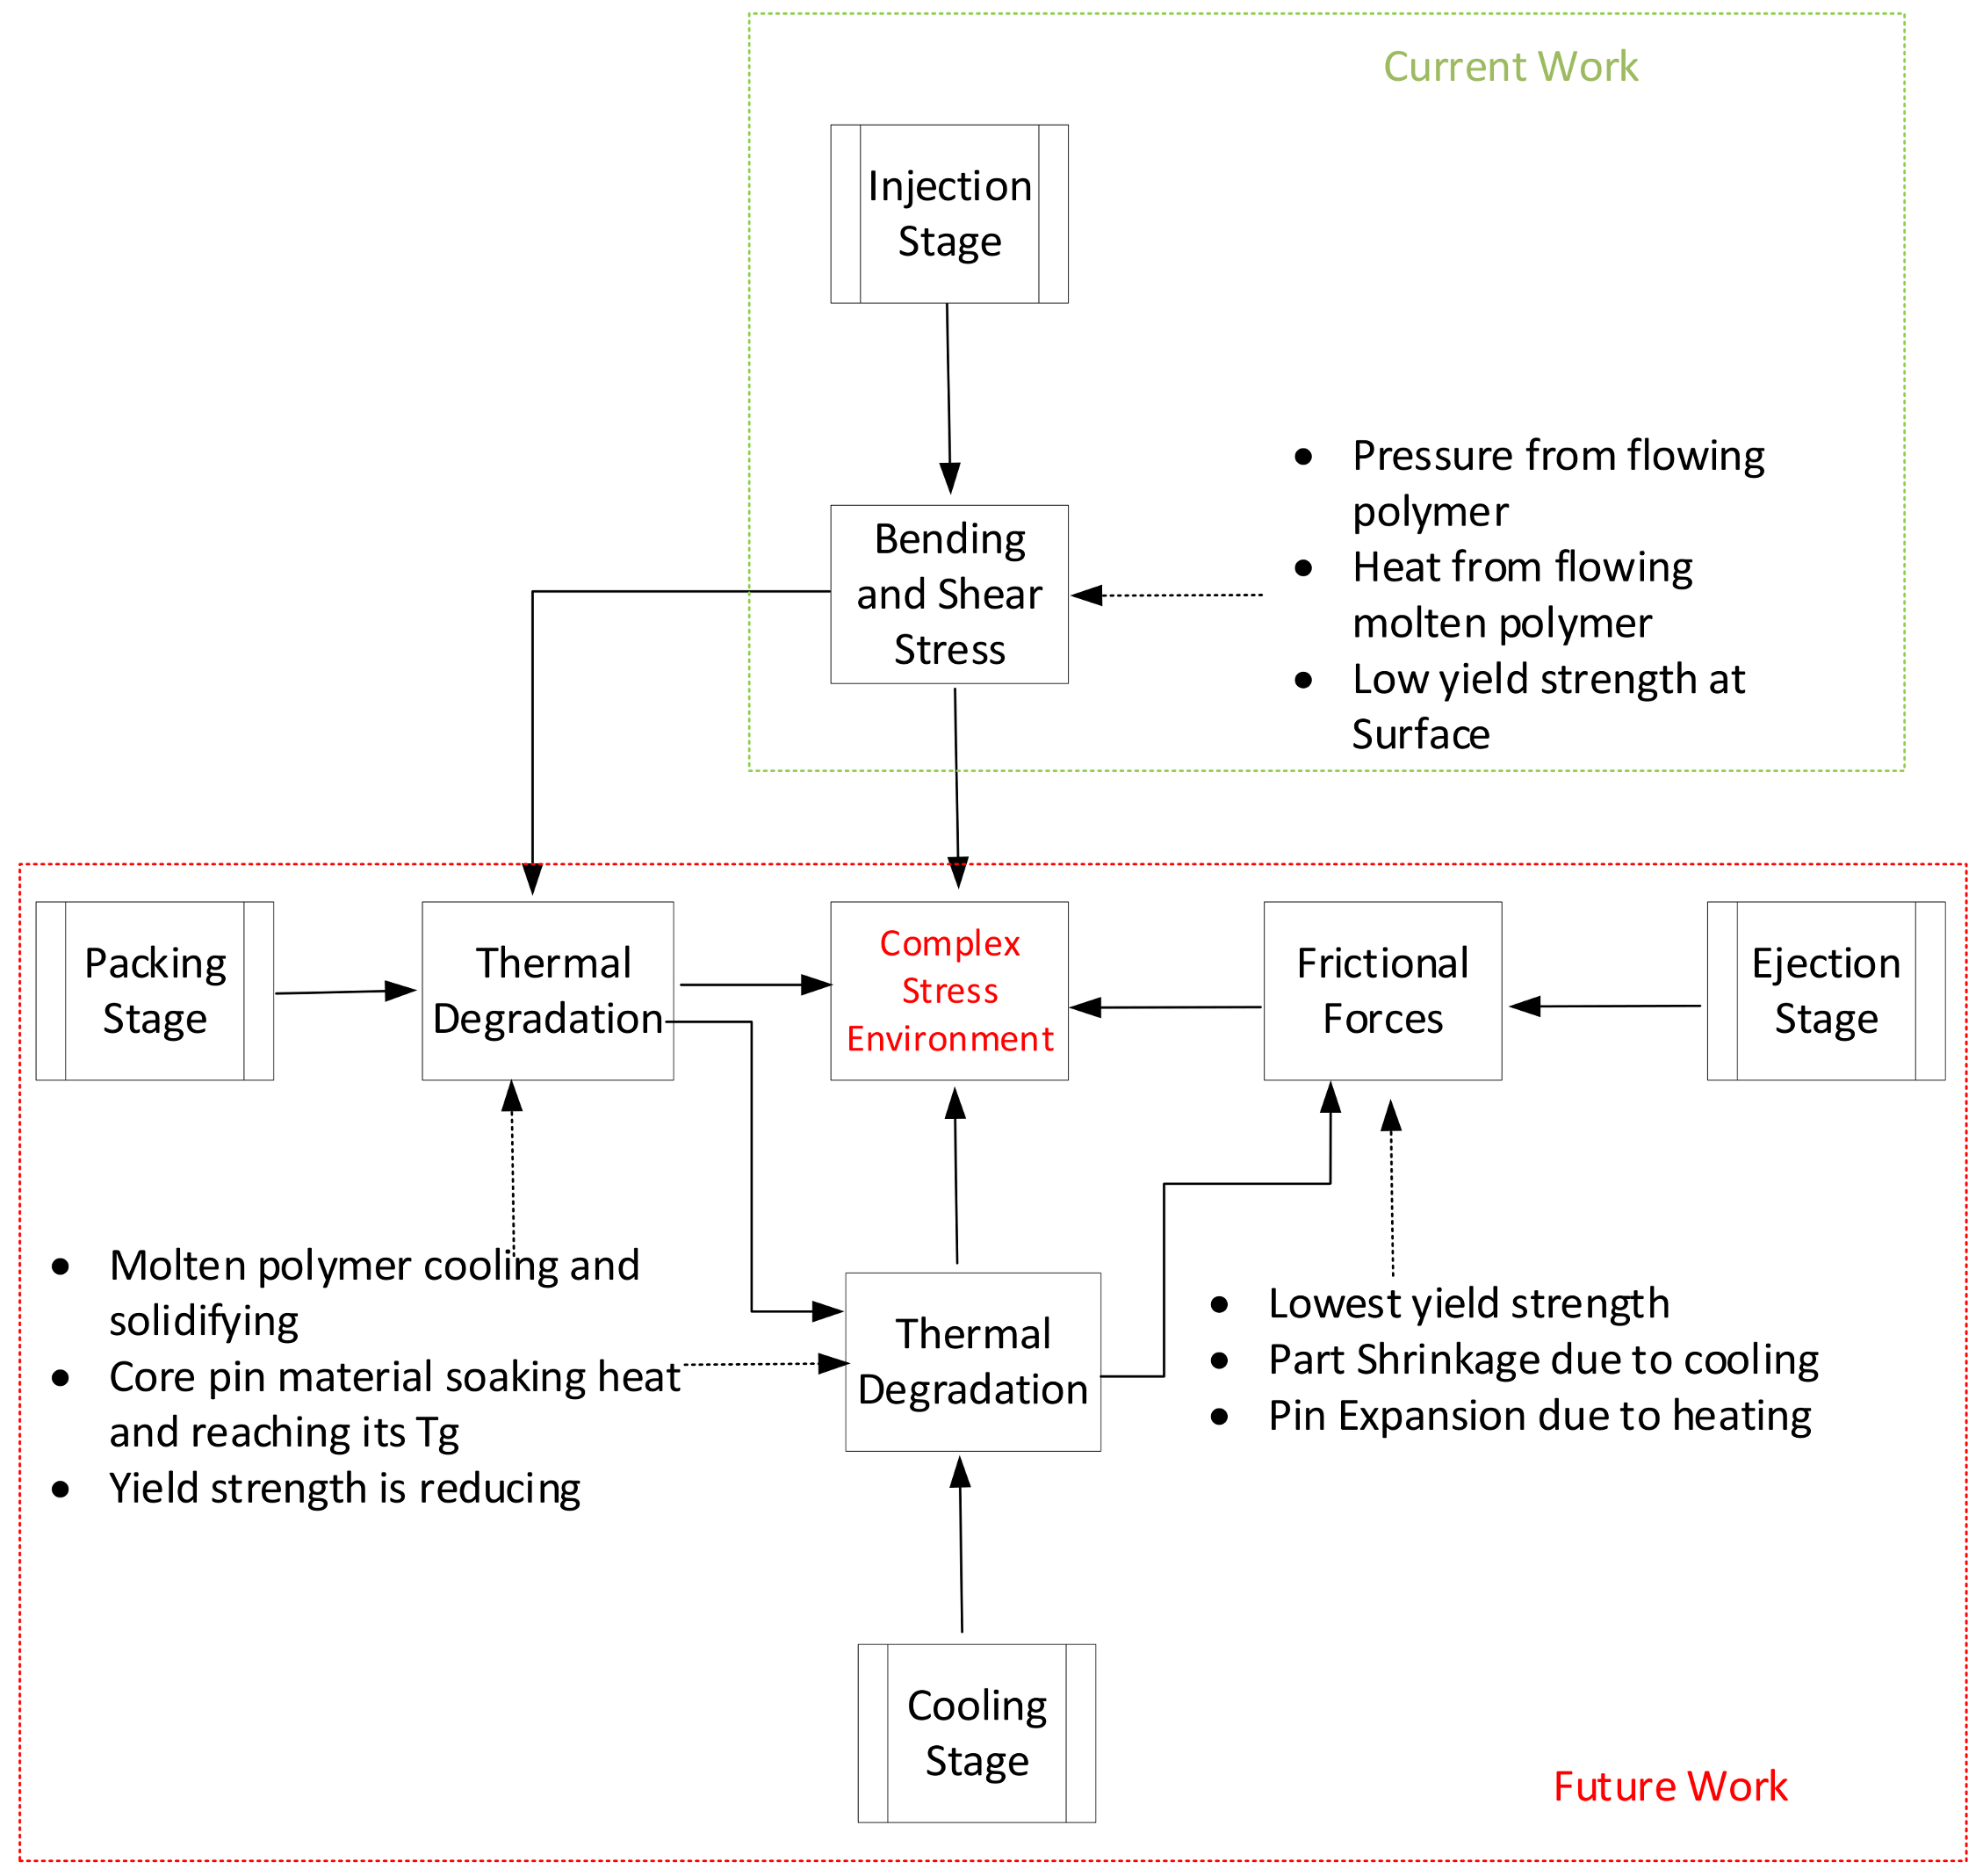
2.1. Hypothesised Failure Mode: Pin Bending Due to Injection Pressure
2.2. Approach
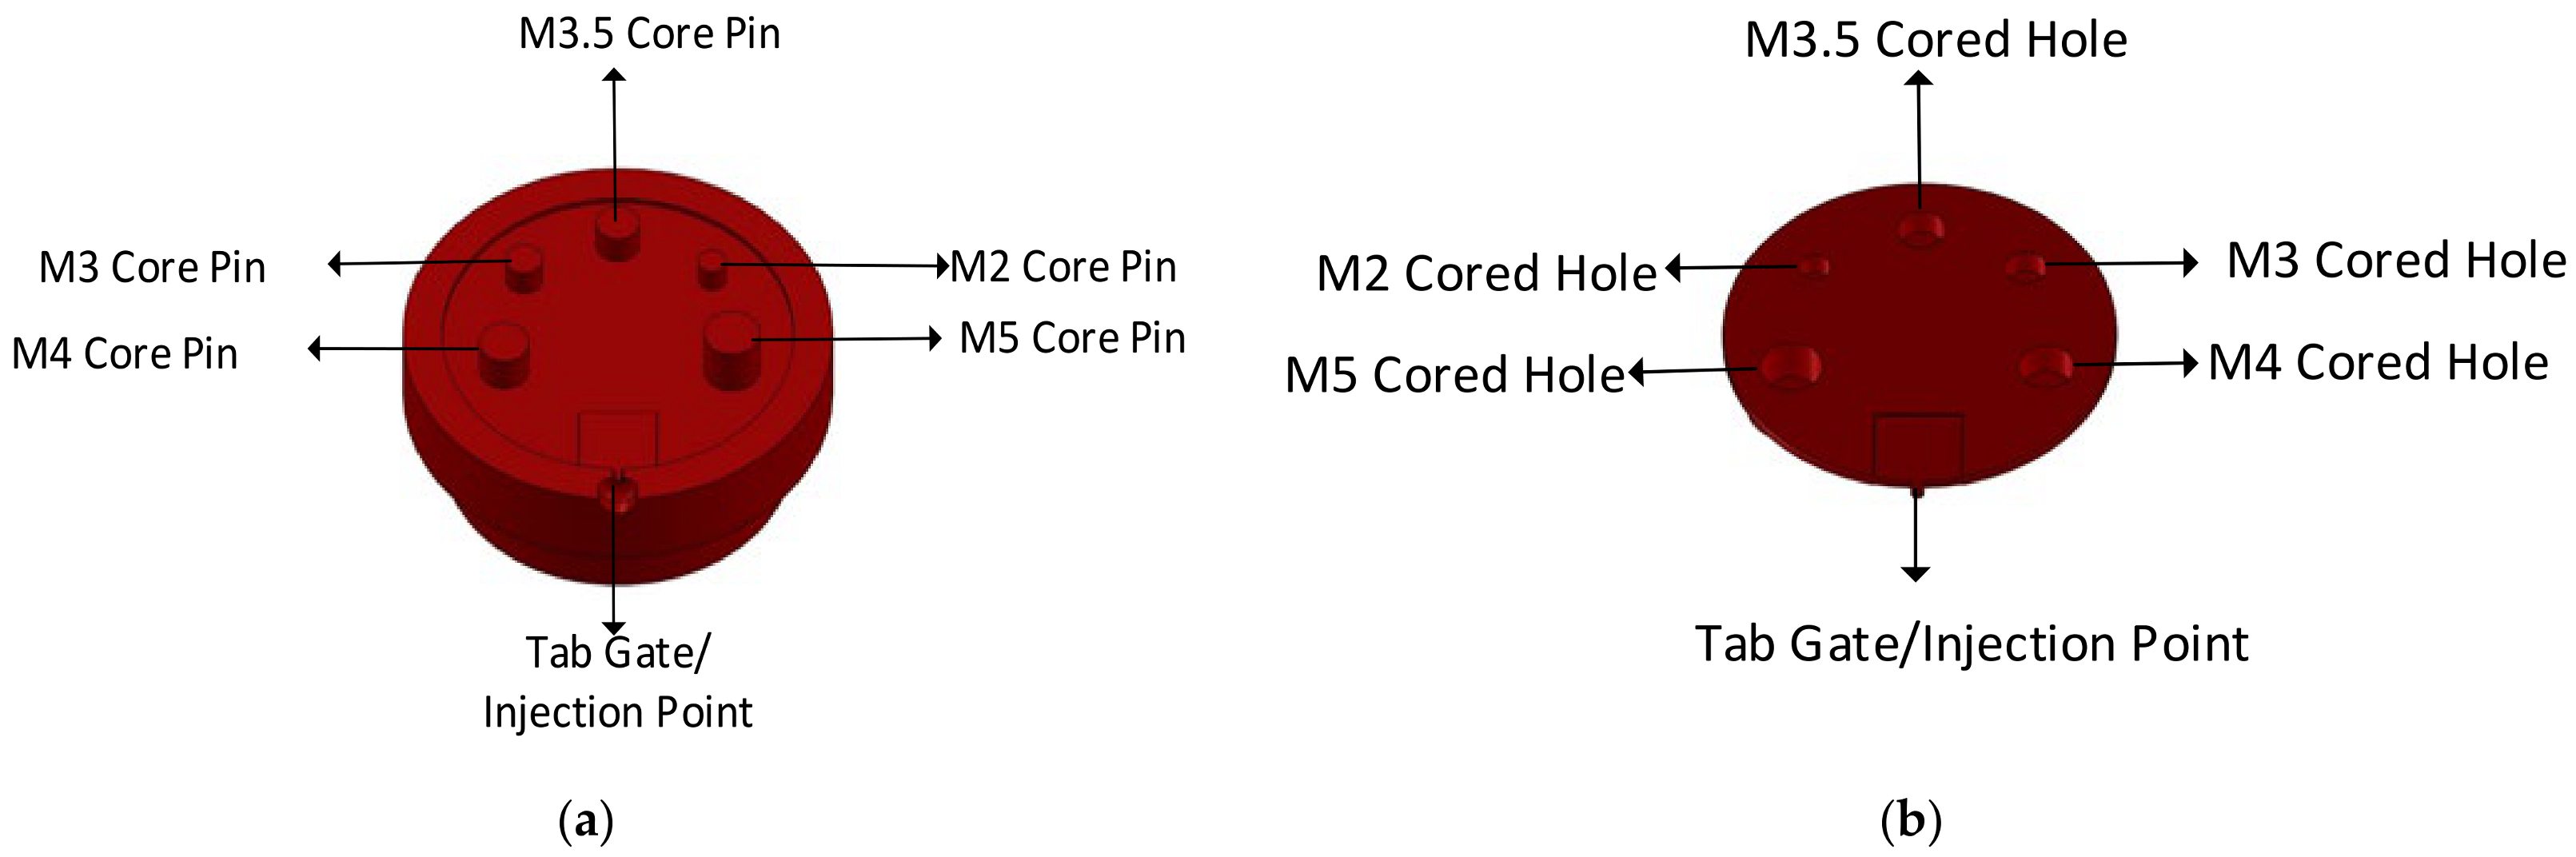
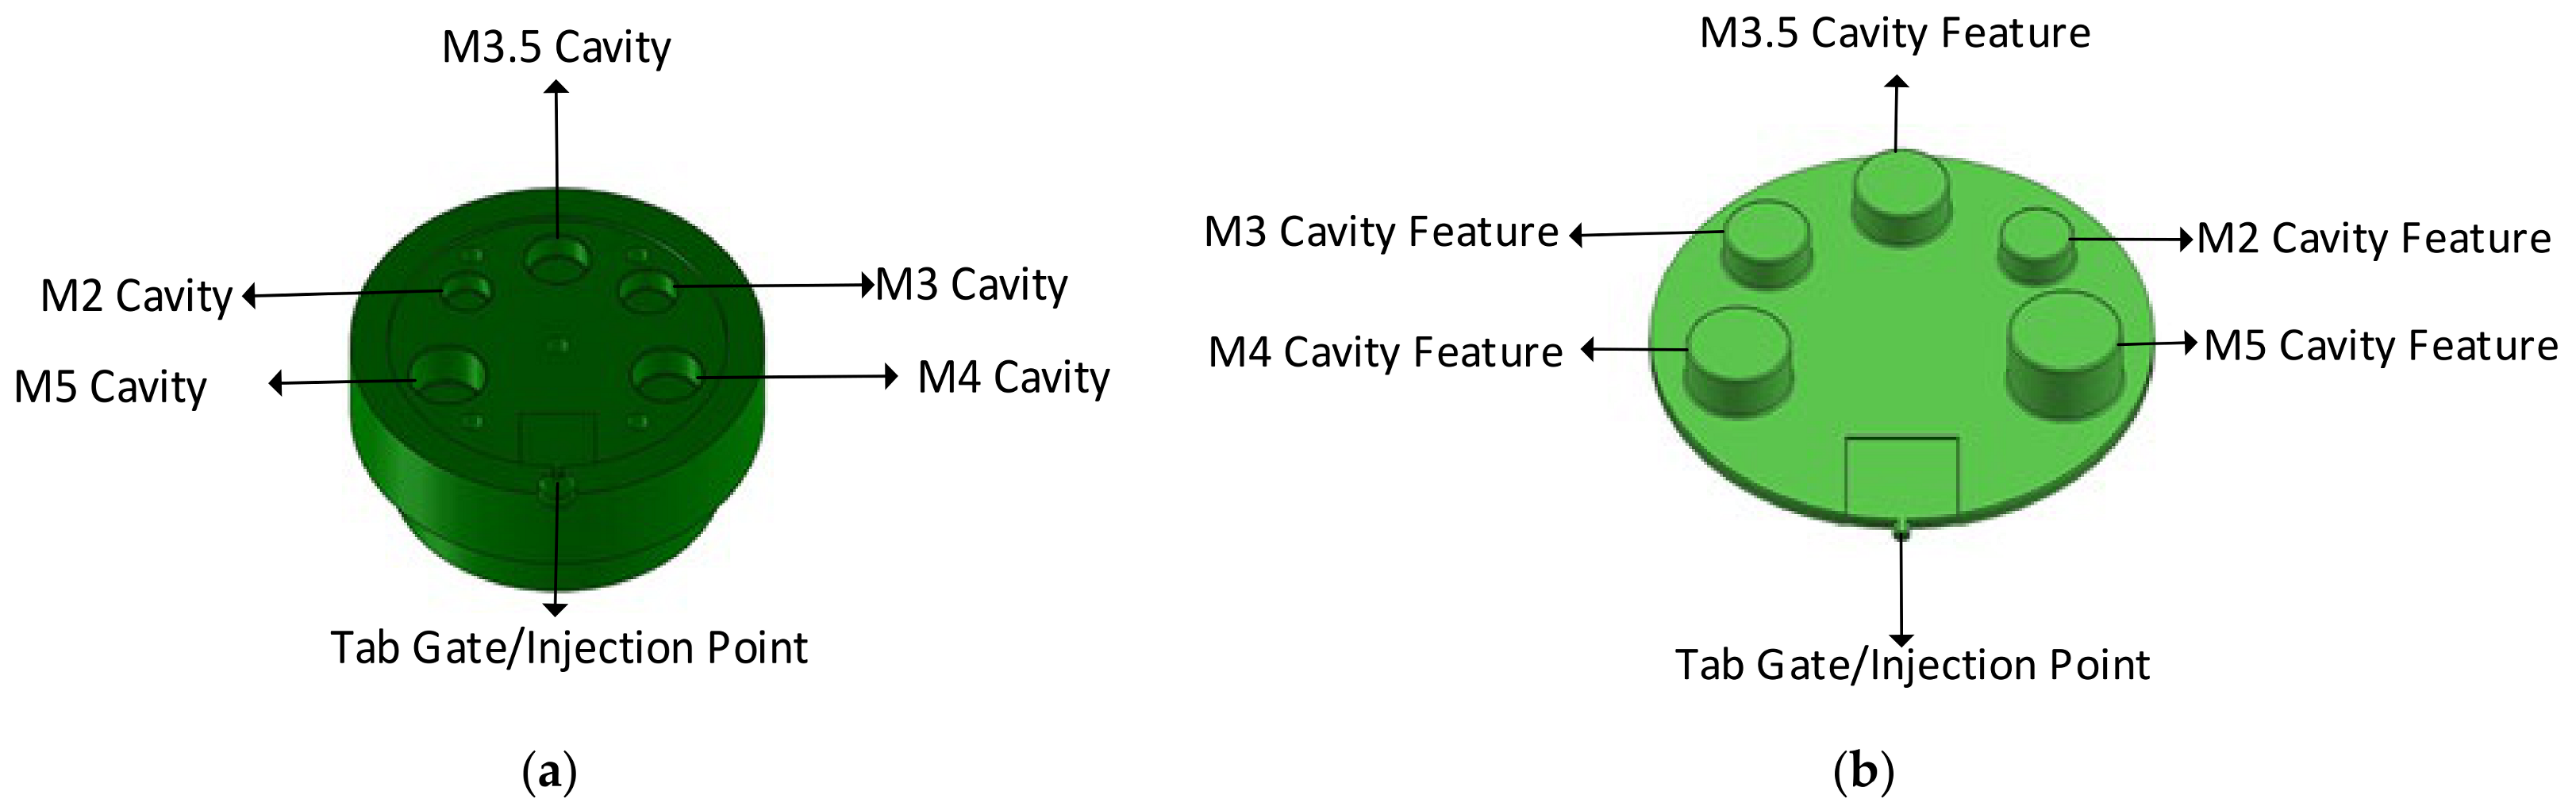
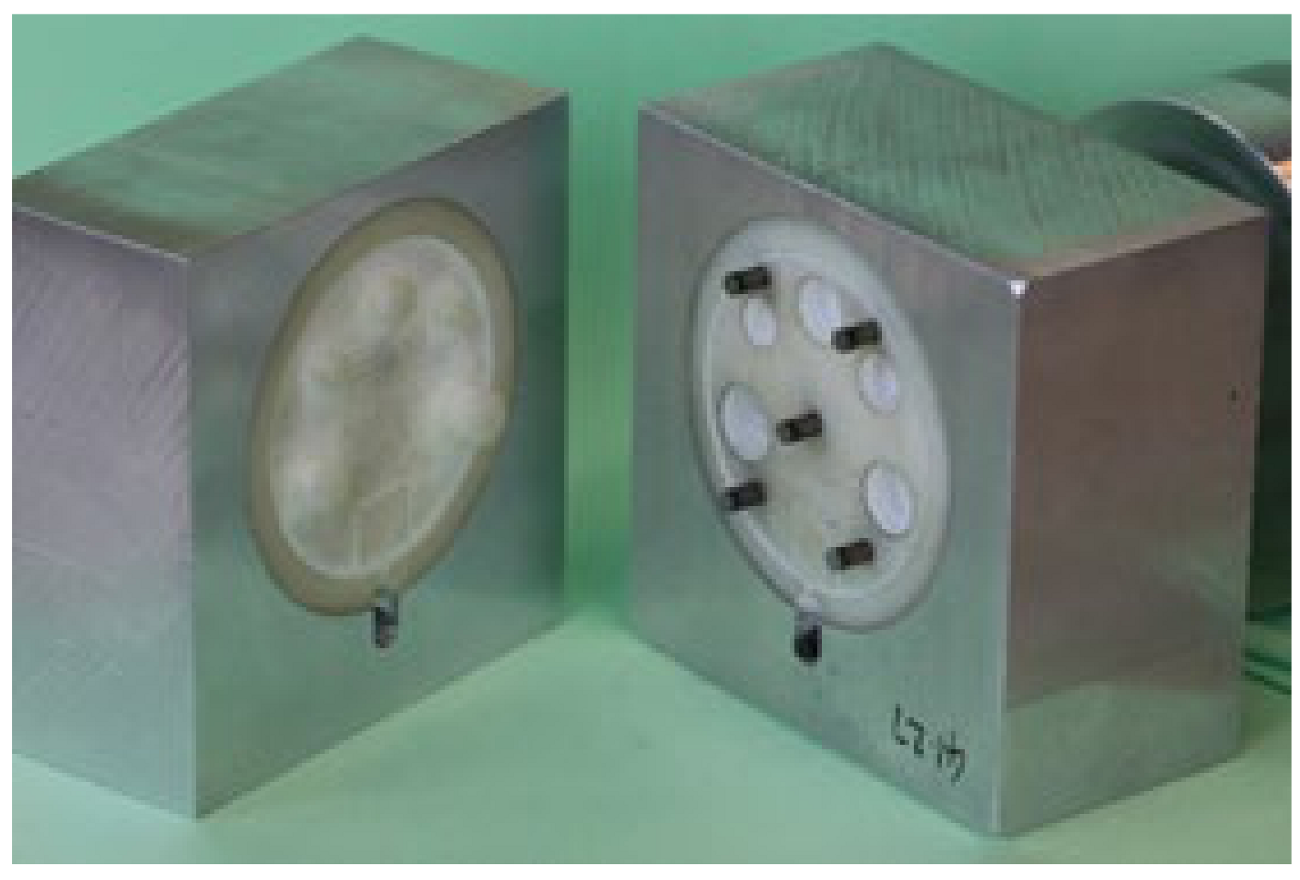
2.2.1. Design of a Representative Tool
2.2.2. Theoretical Analysis
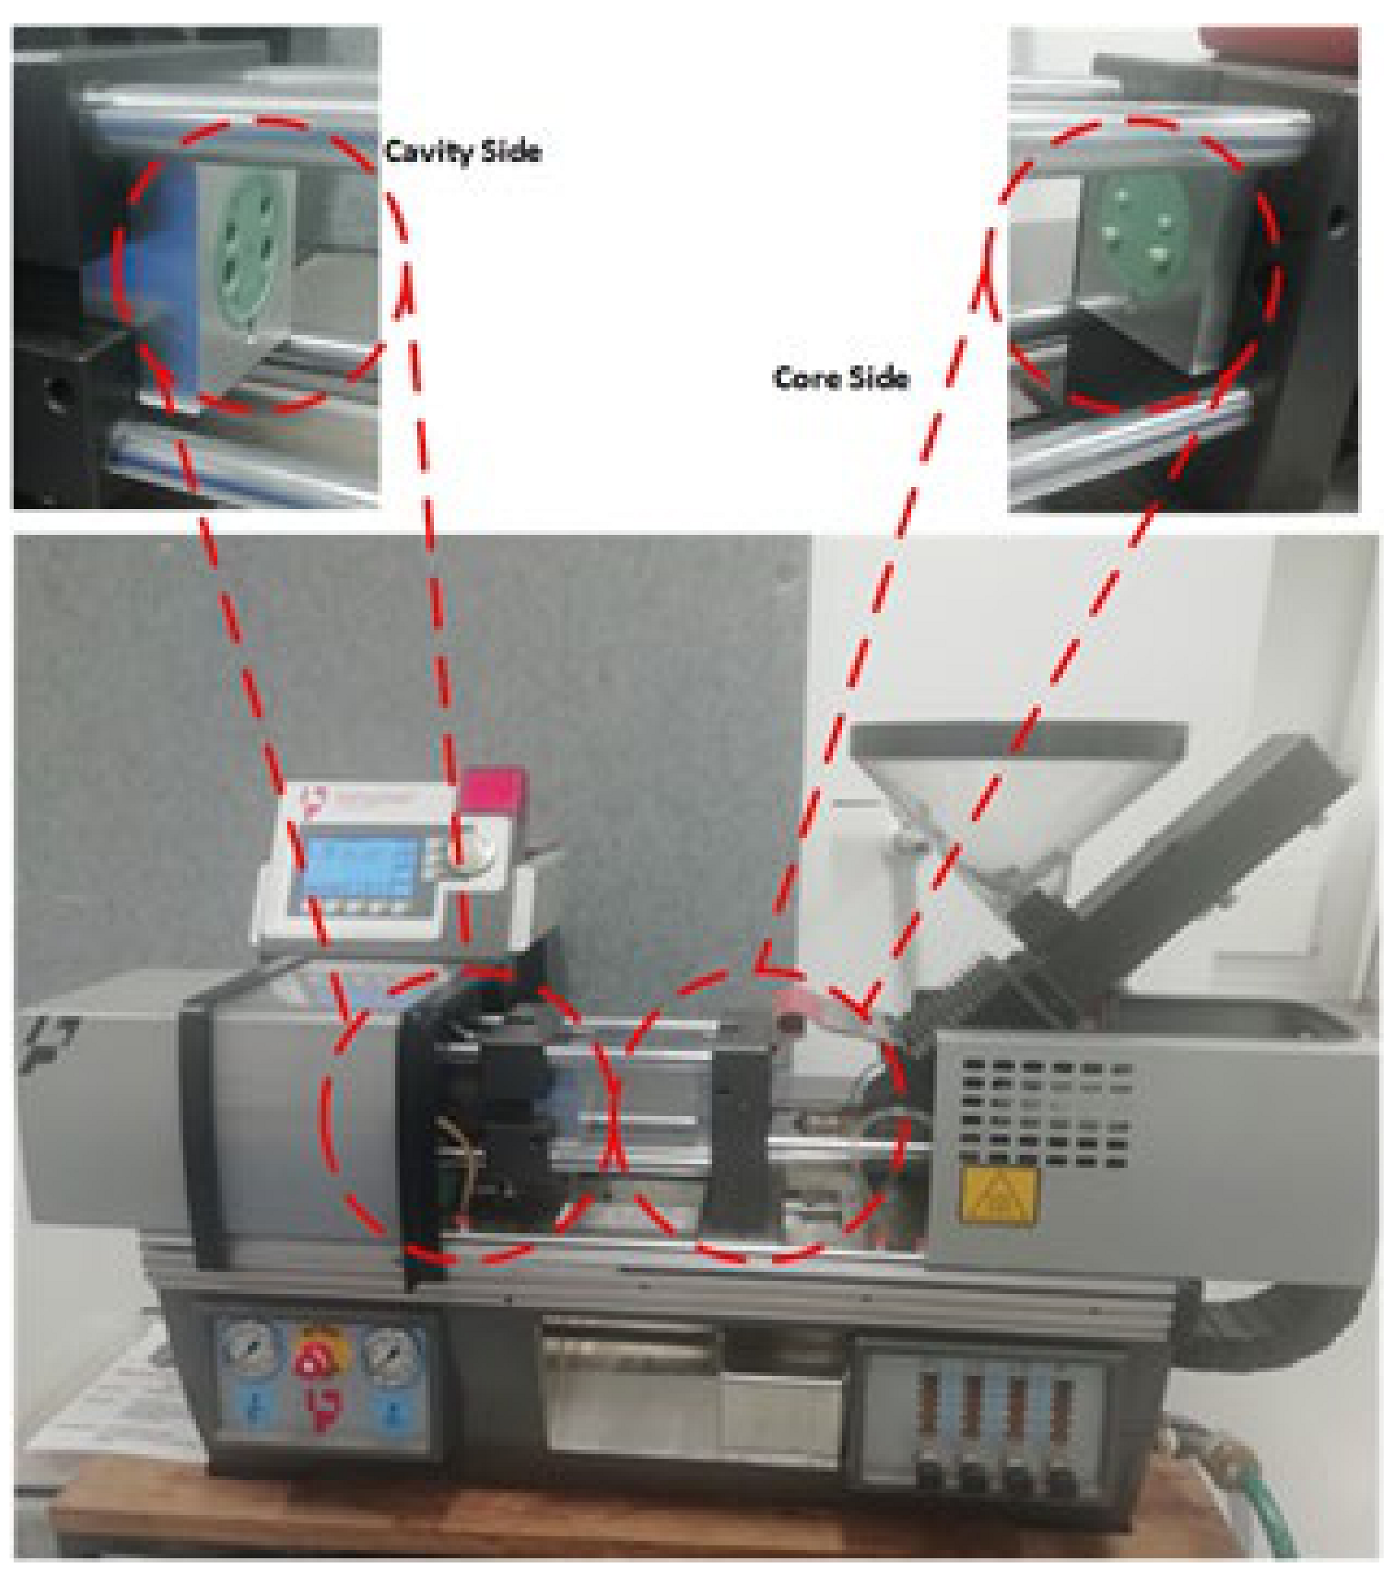
2.2.3. Empirical Testing
3. Results
3.1. Theoretical Results
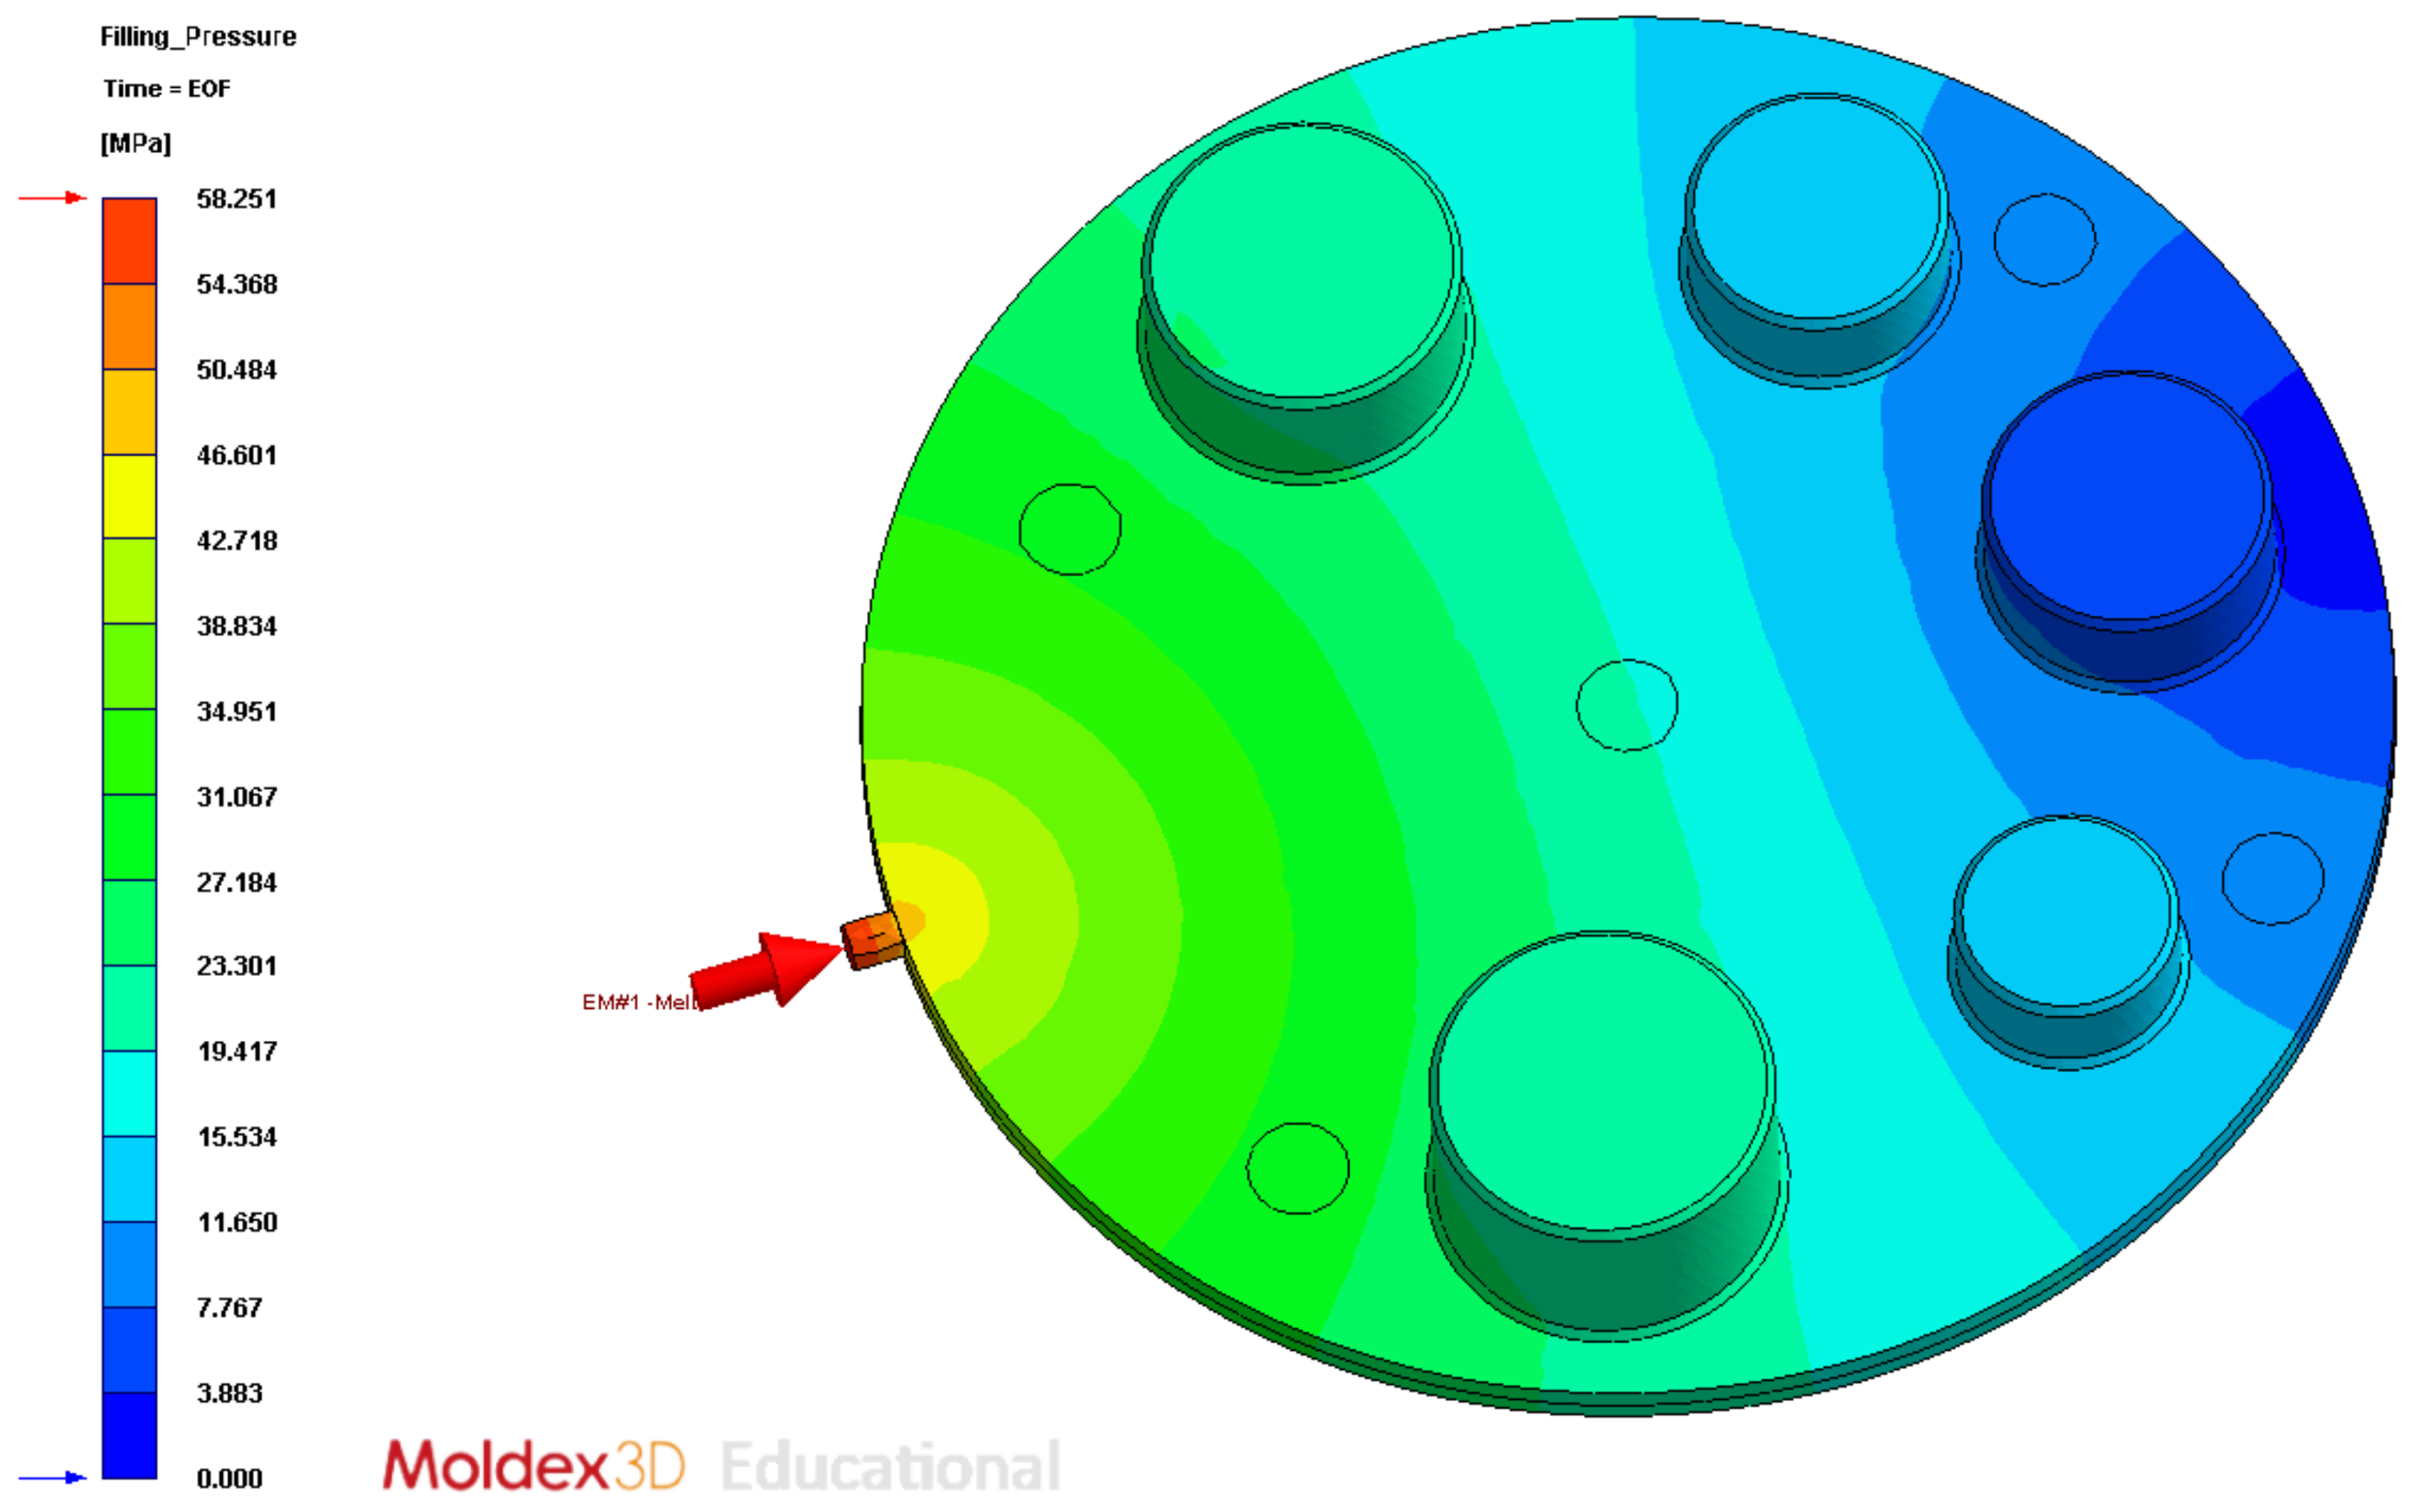
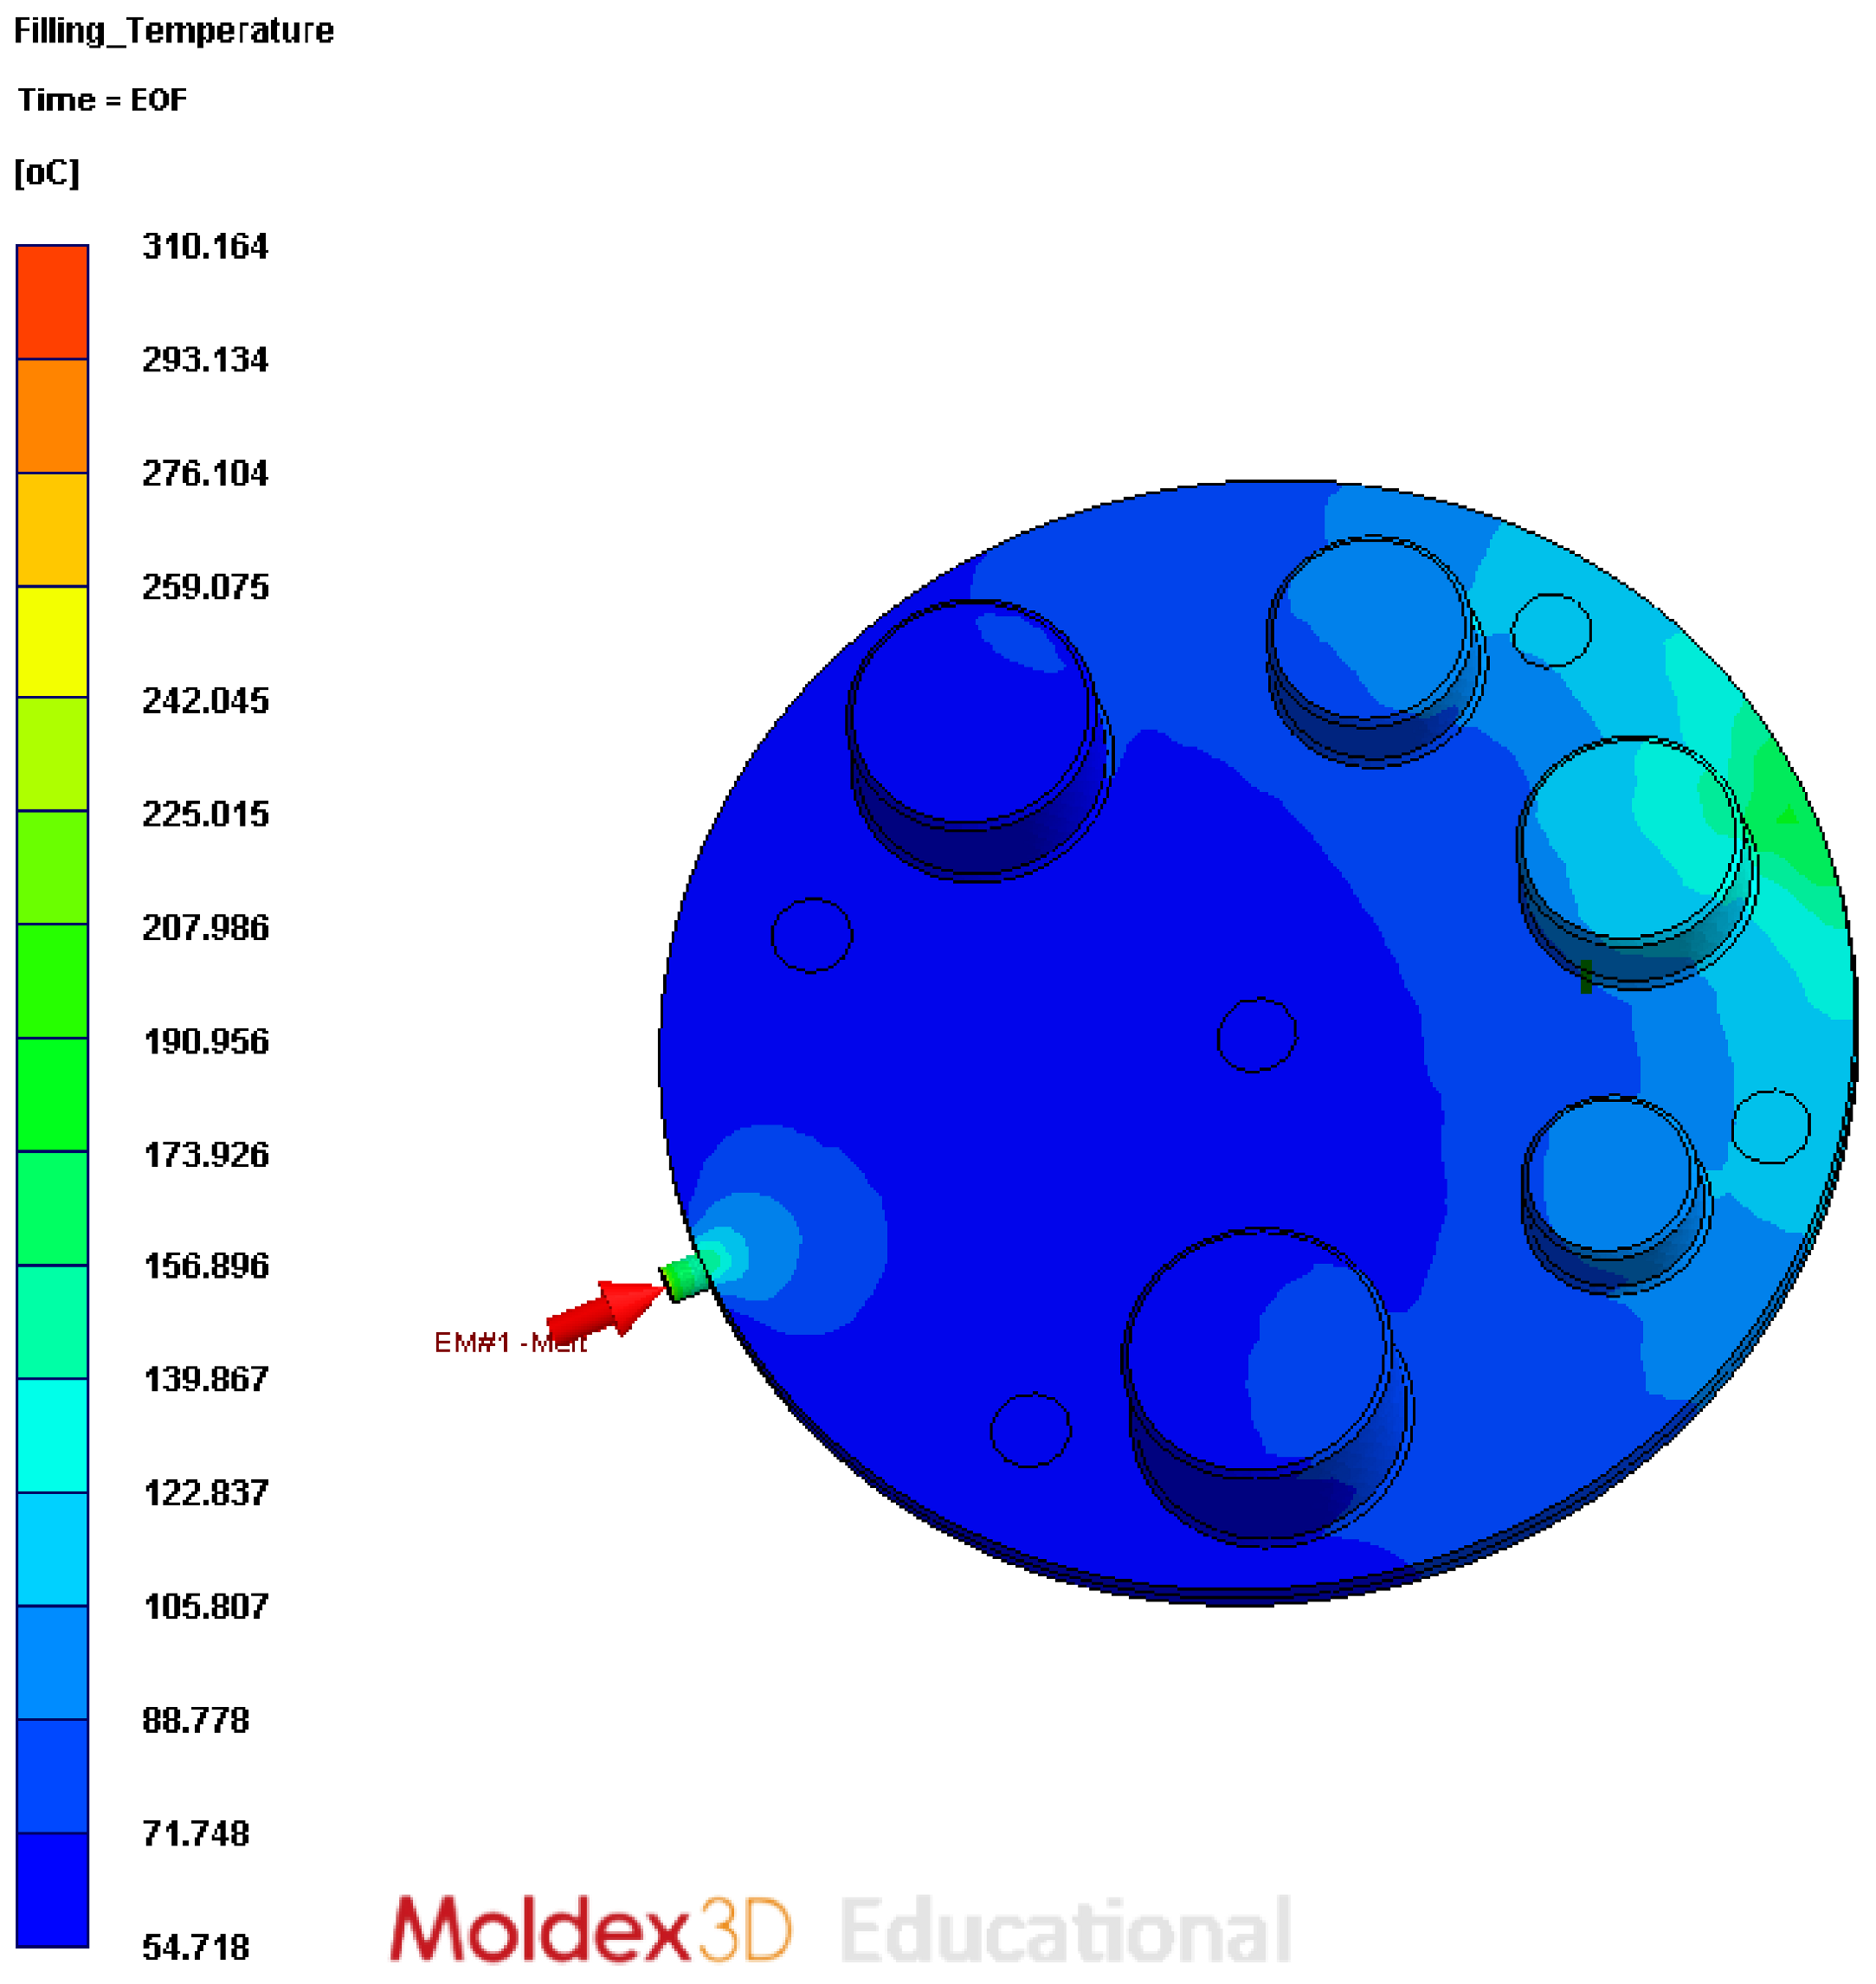
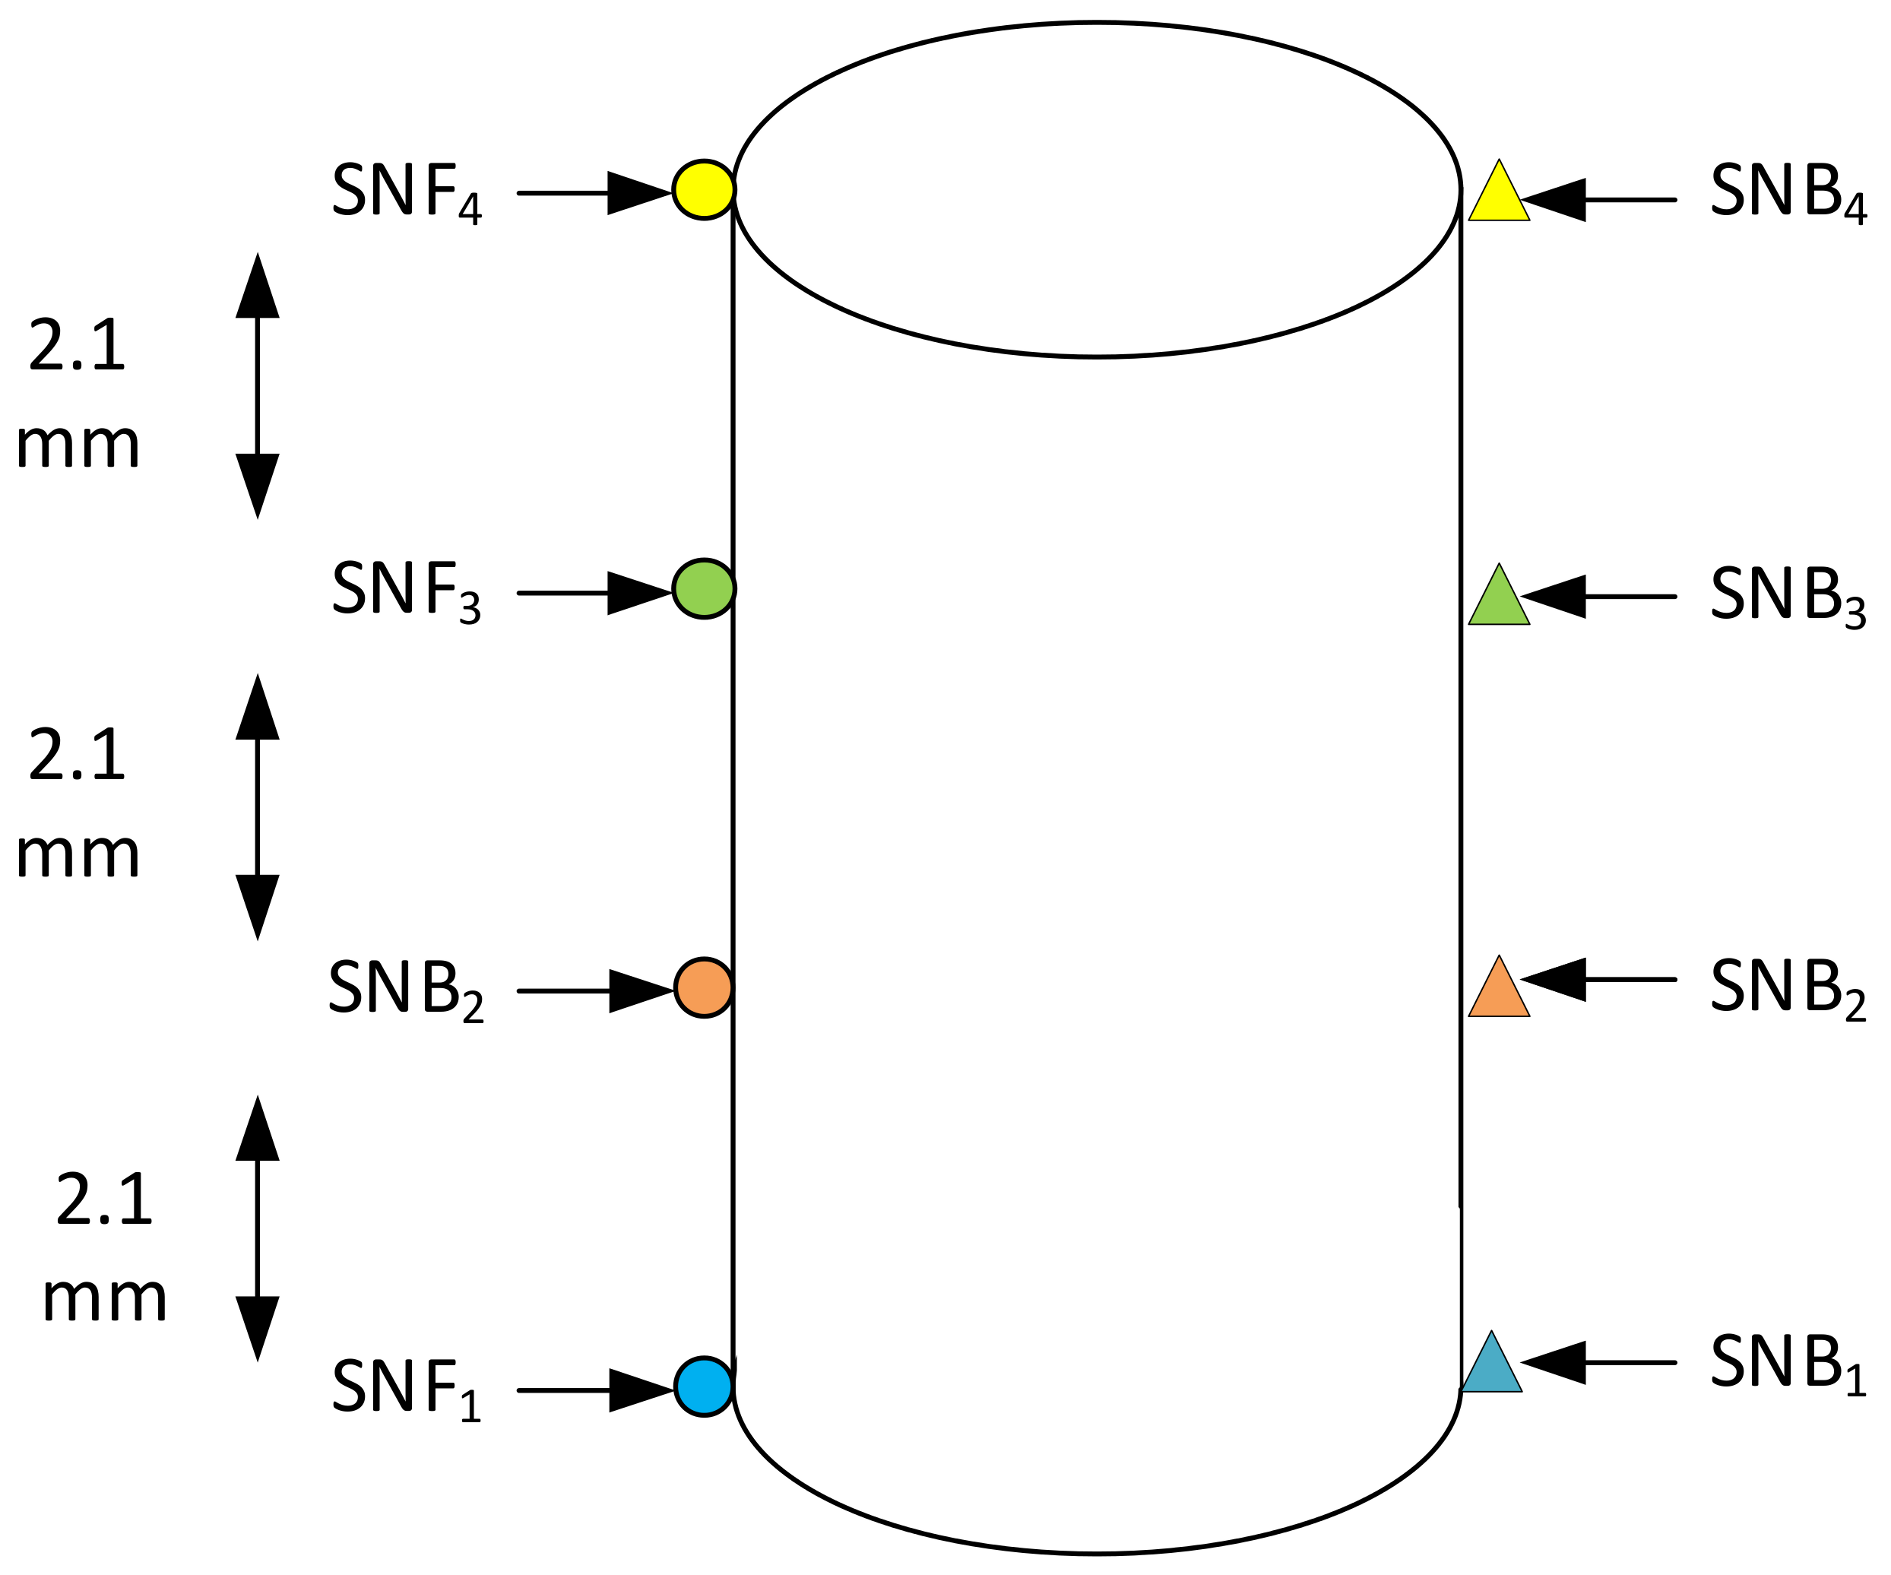
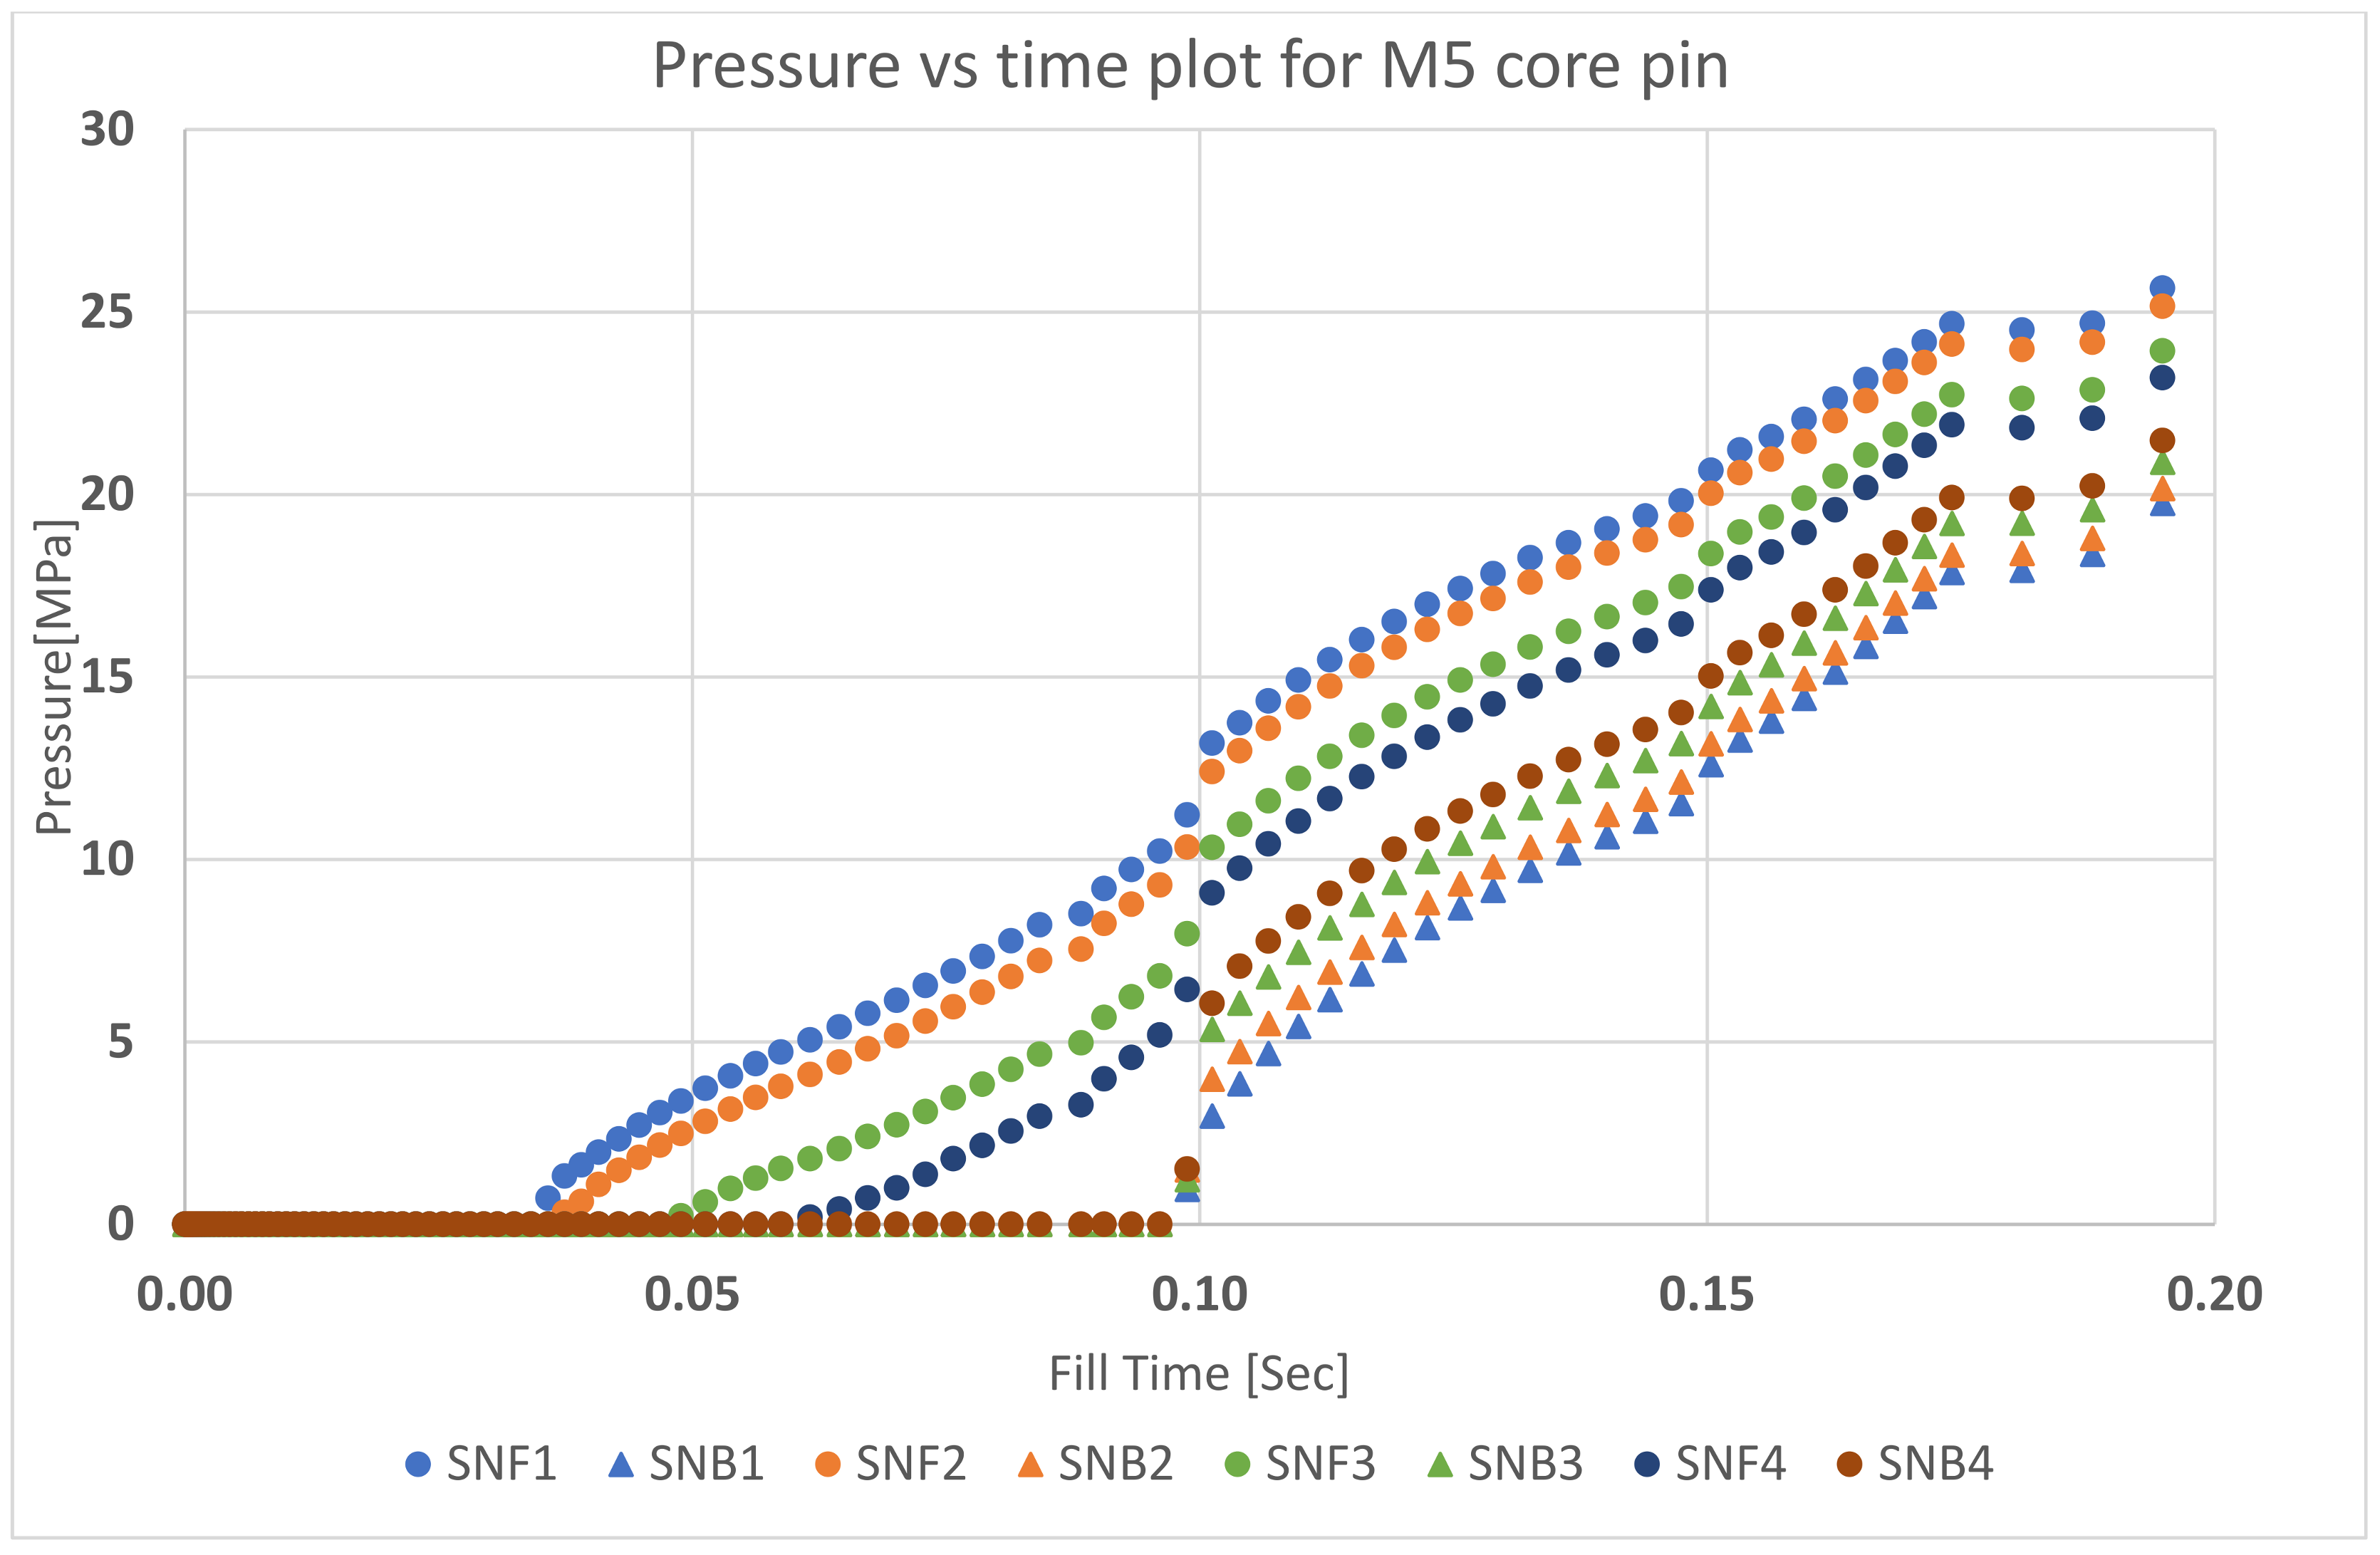
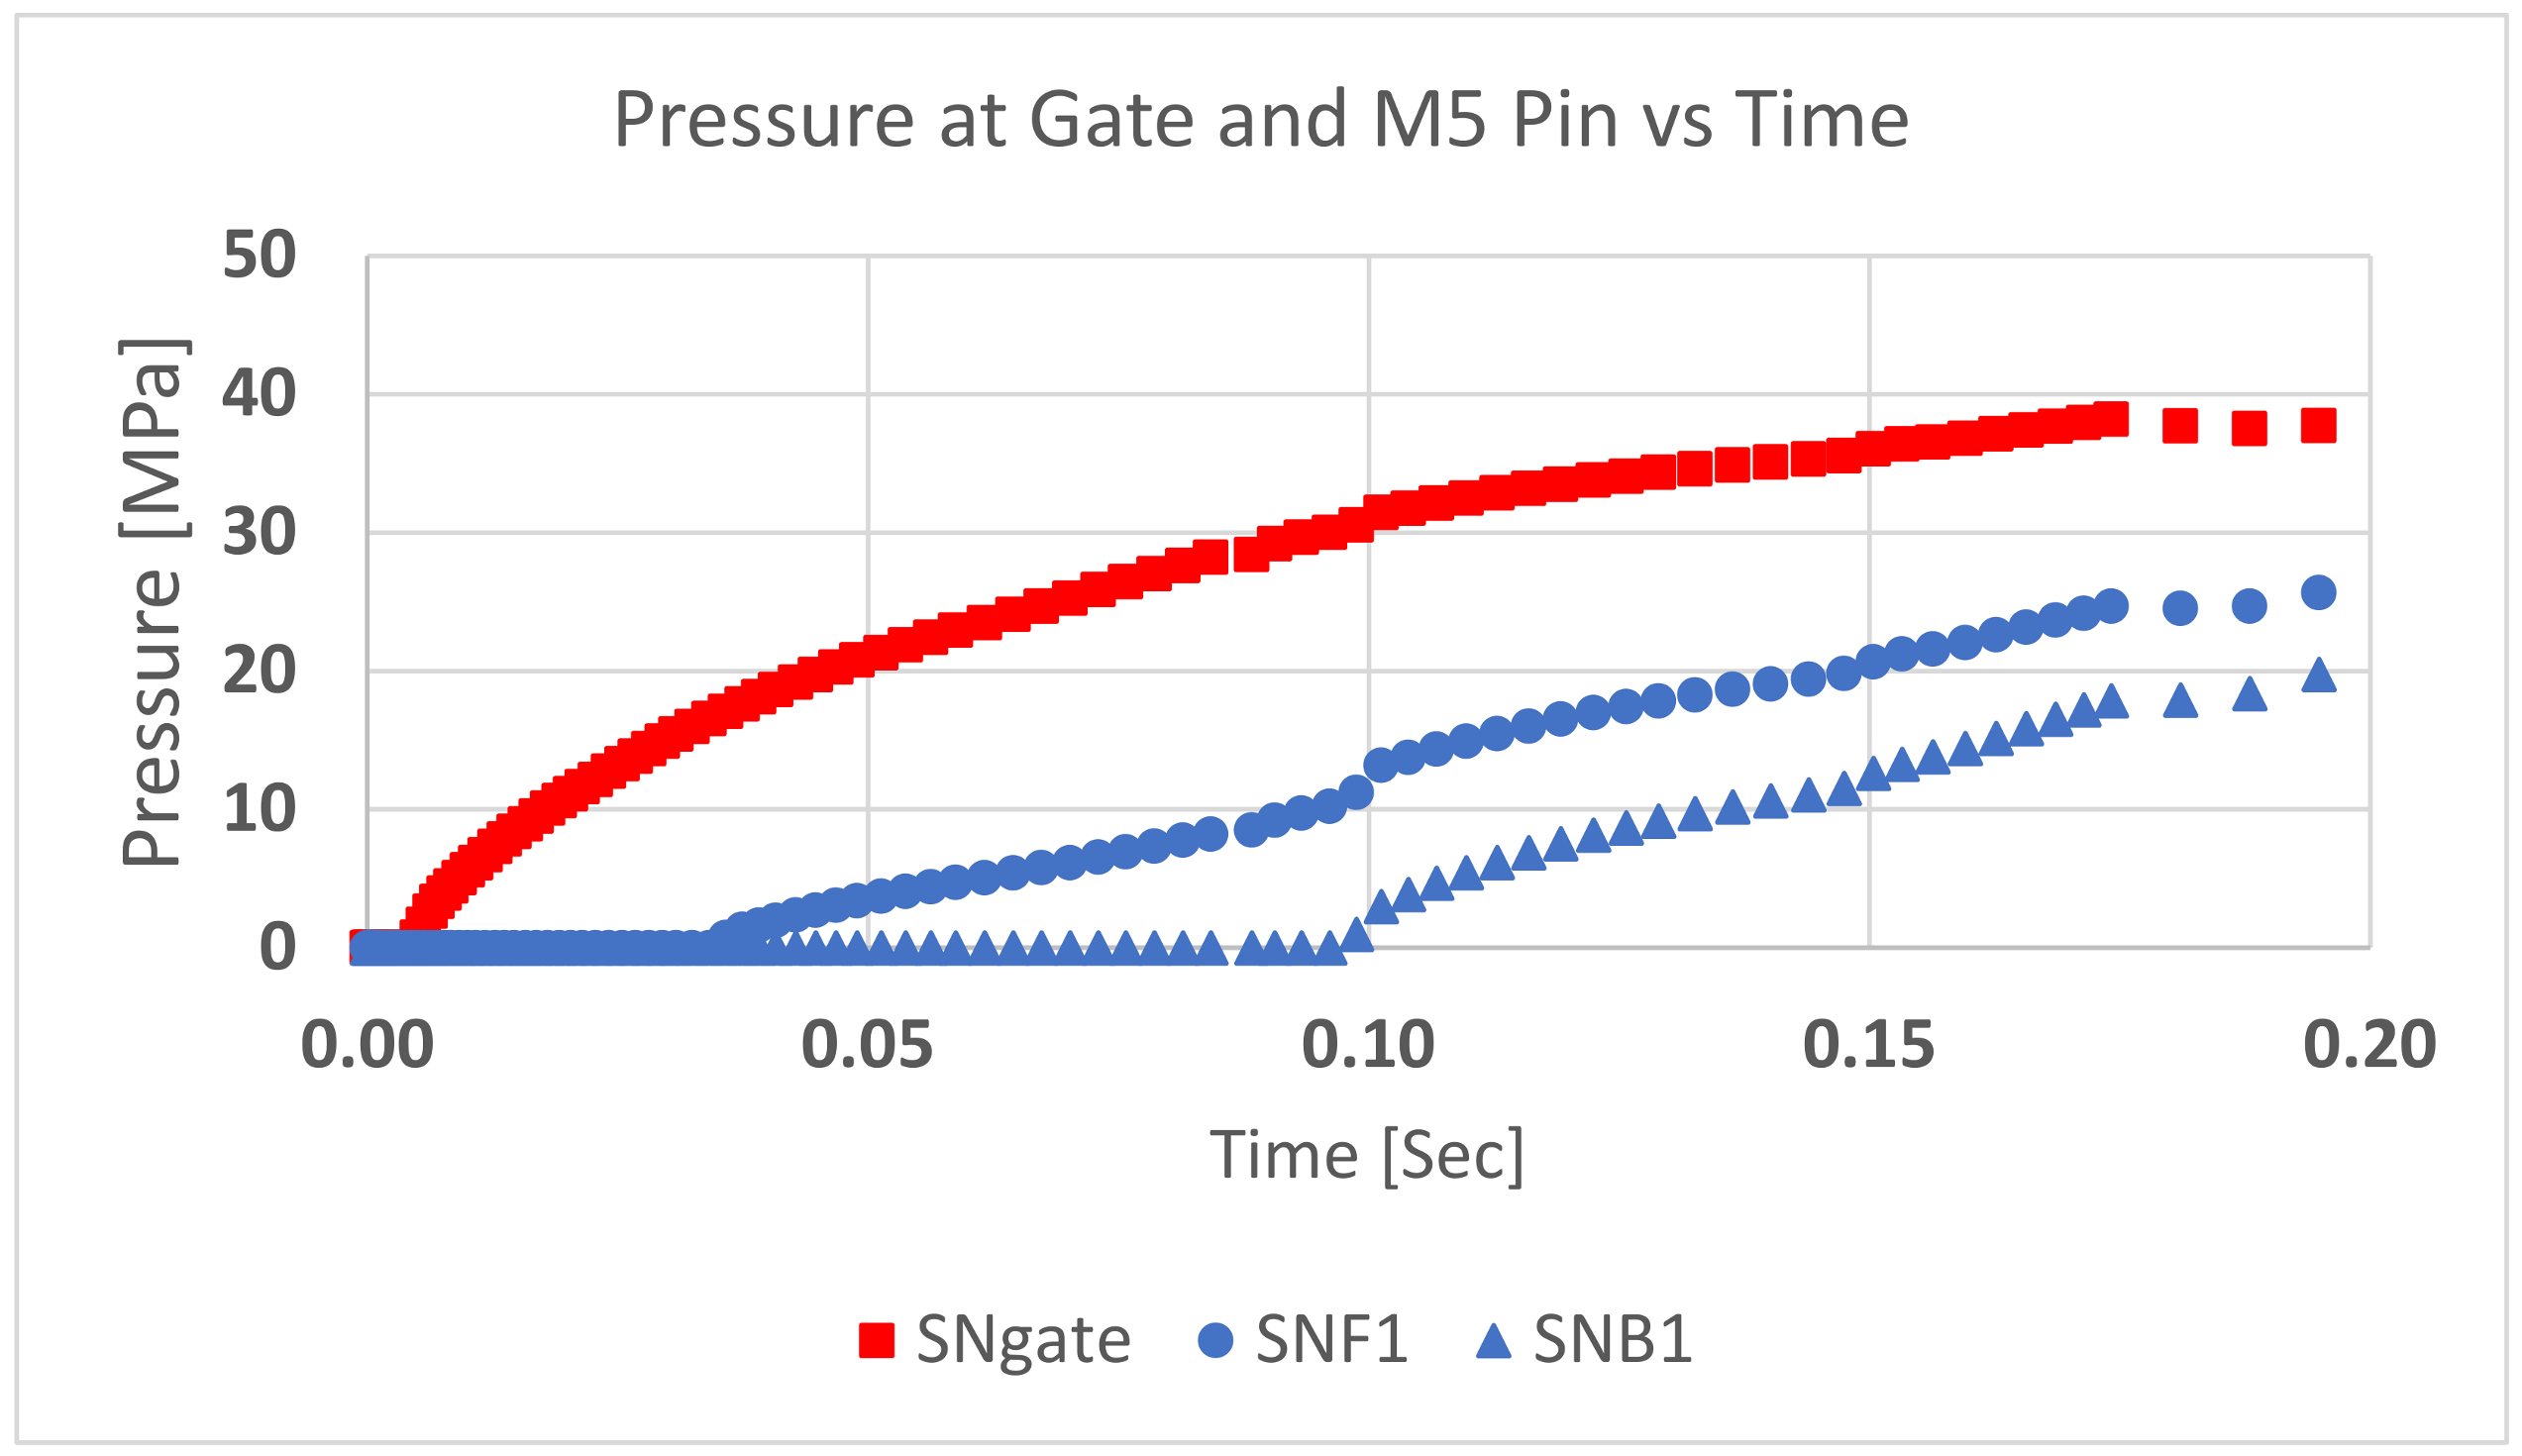
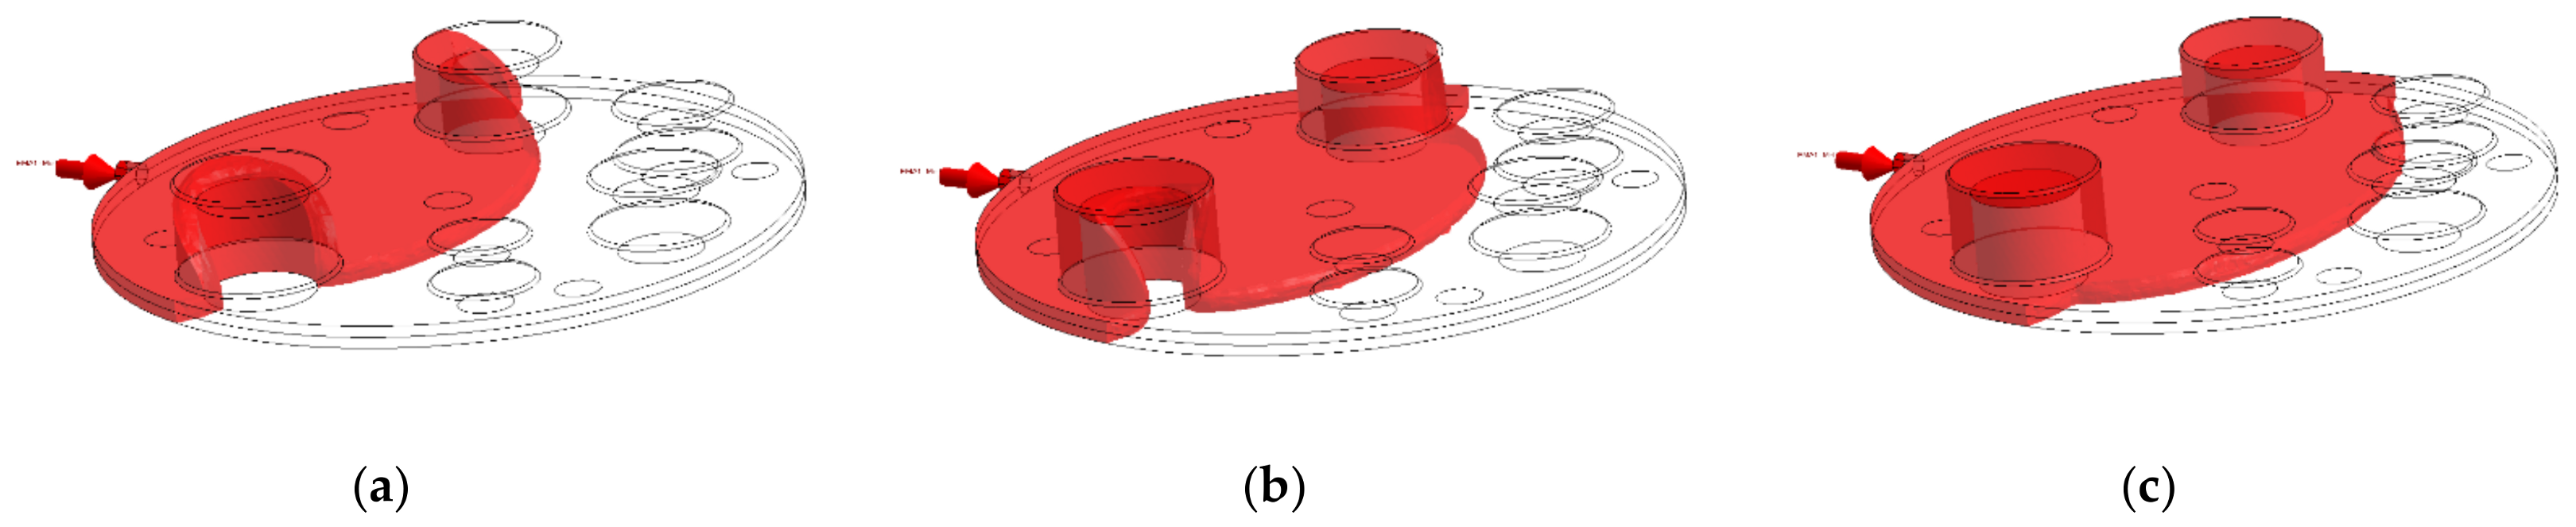
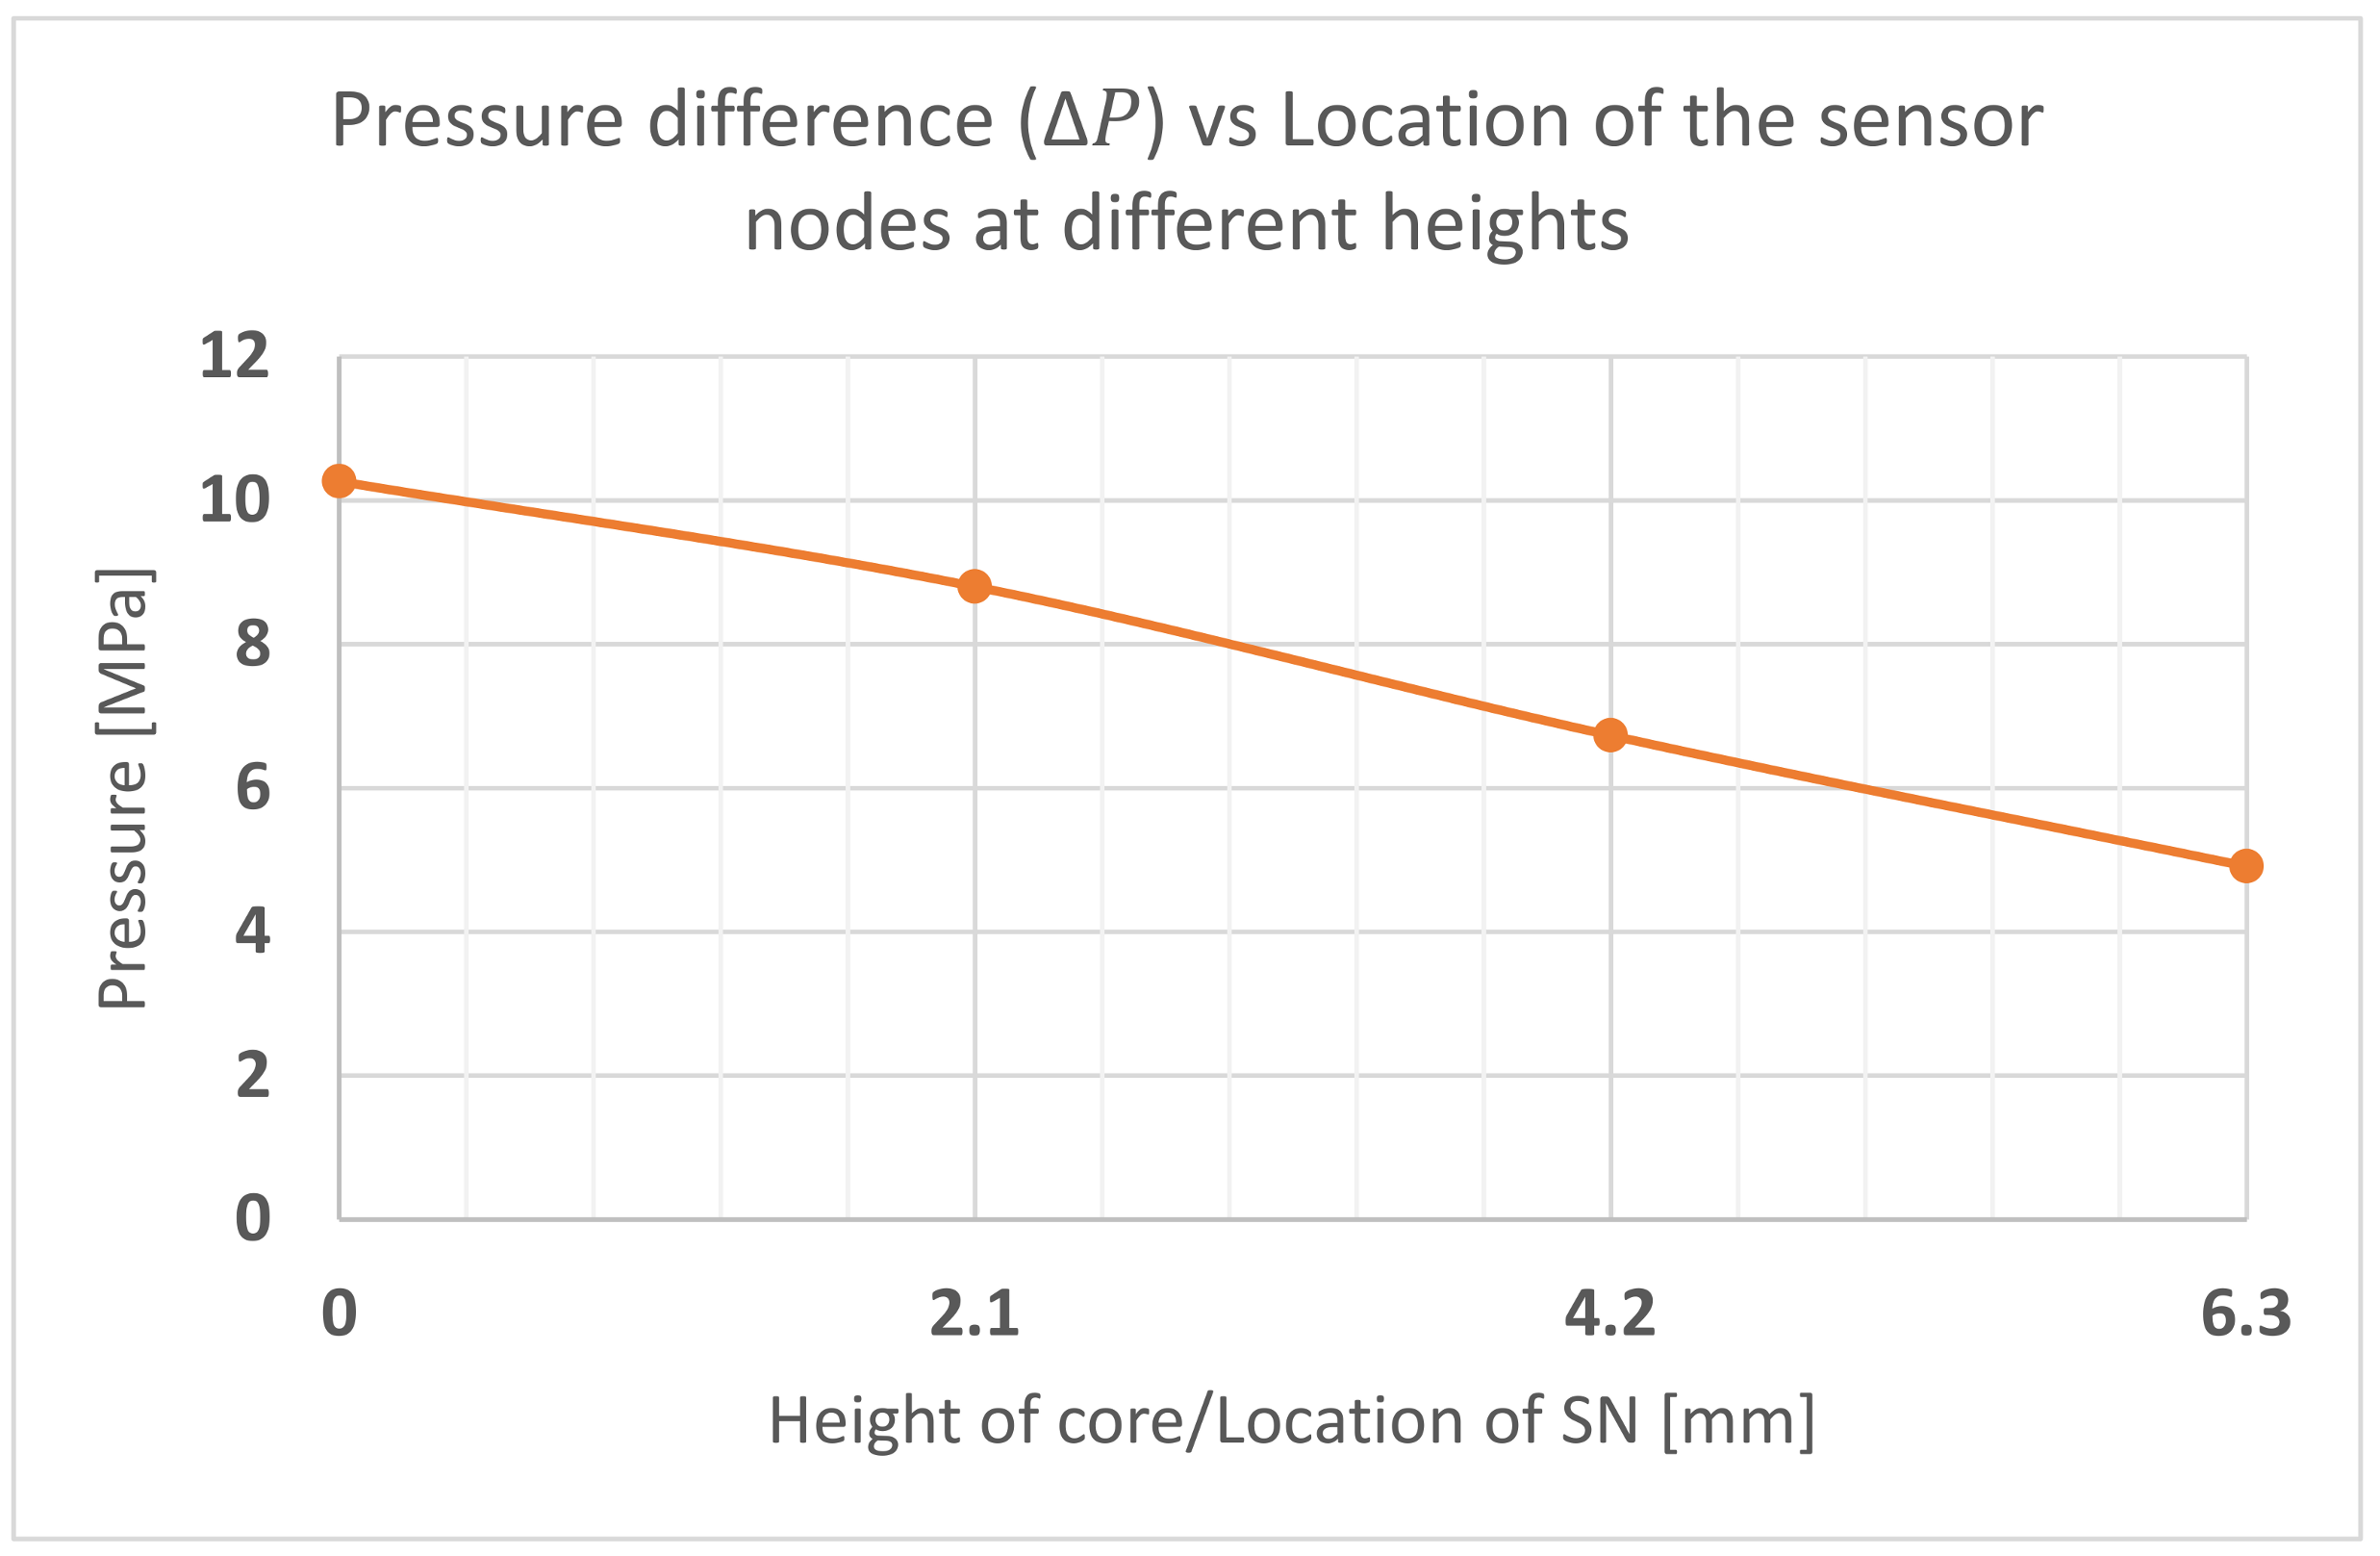
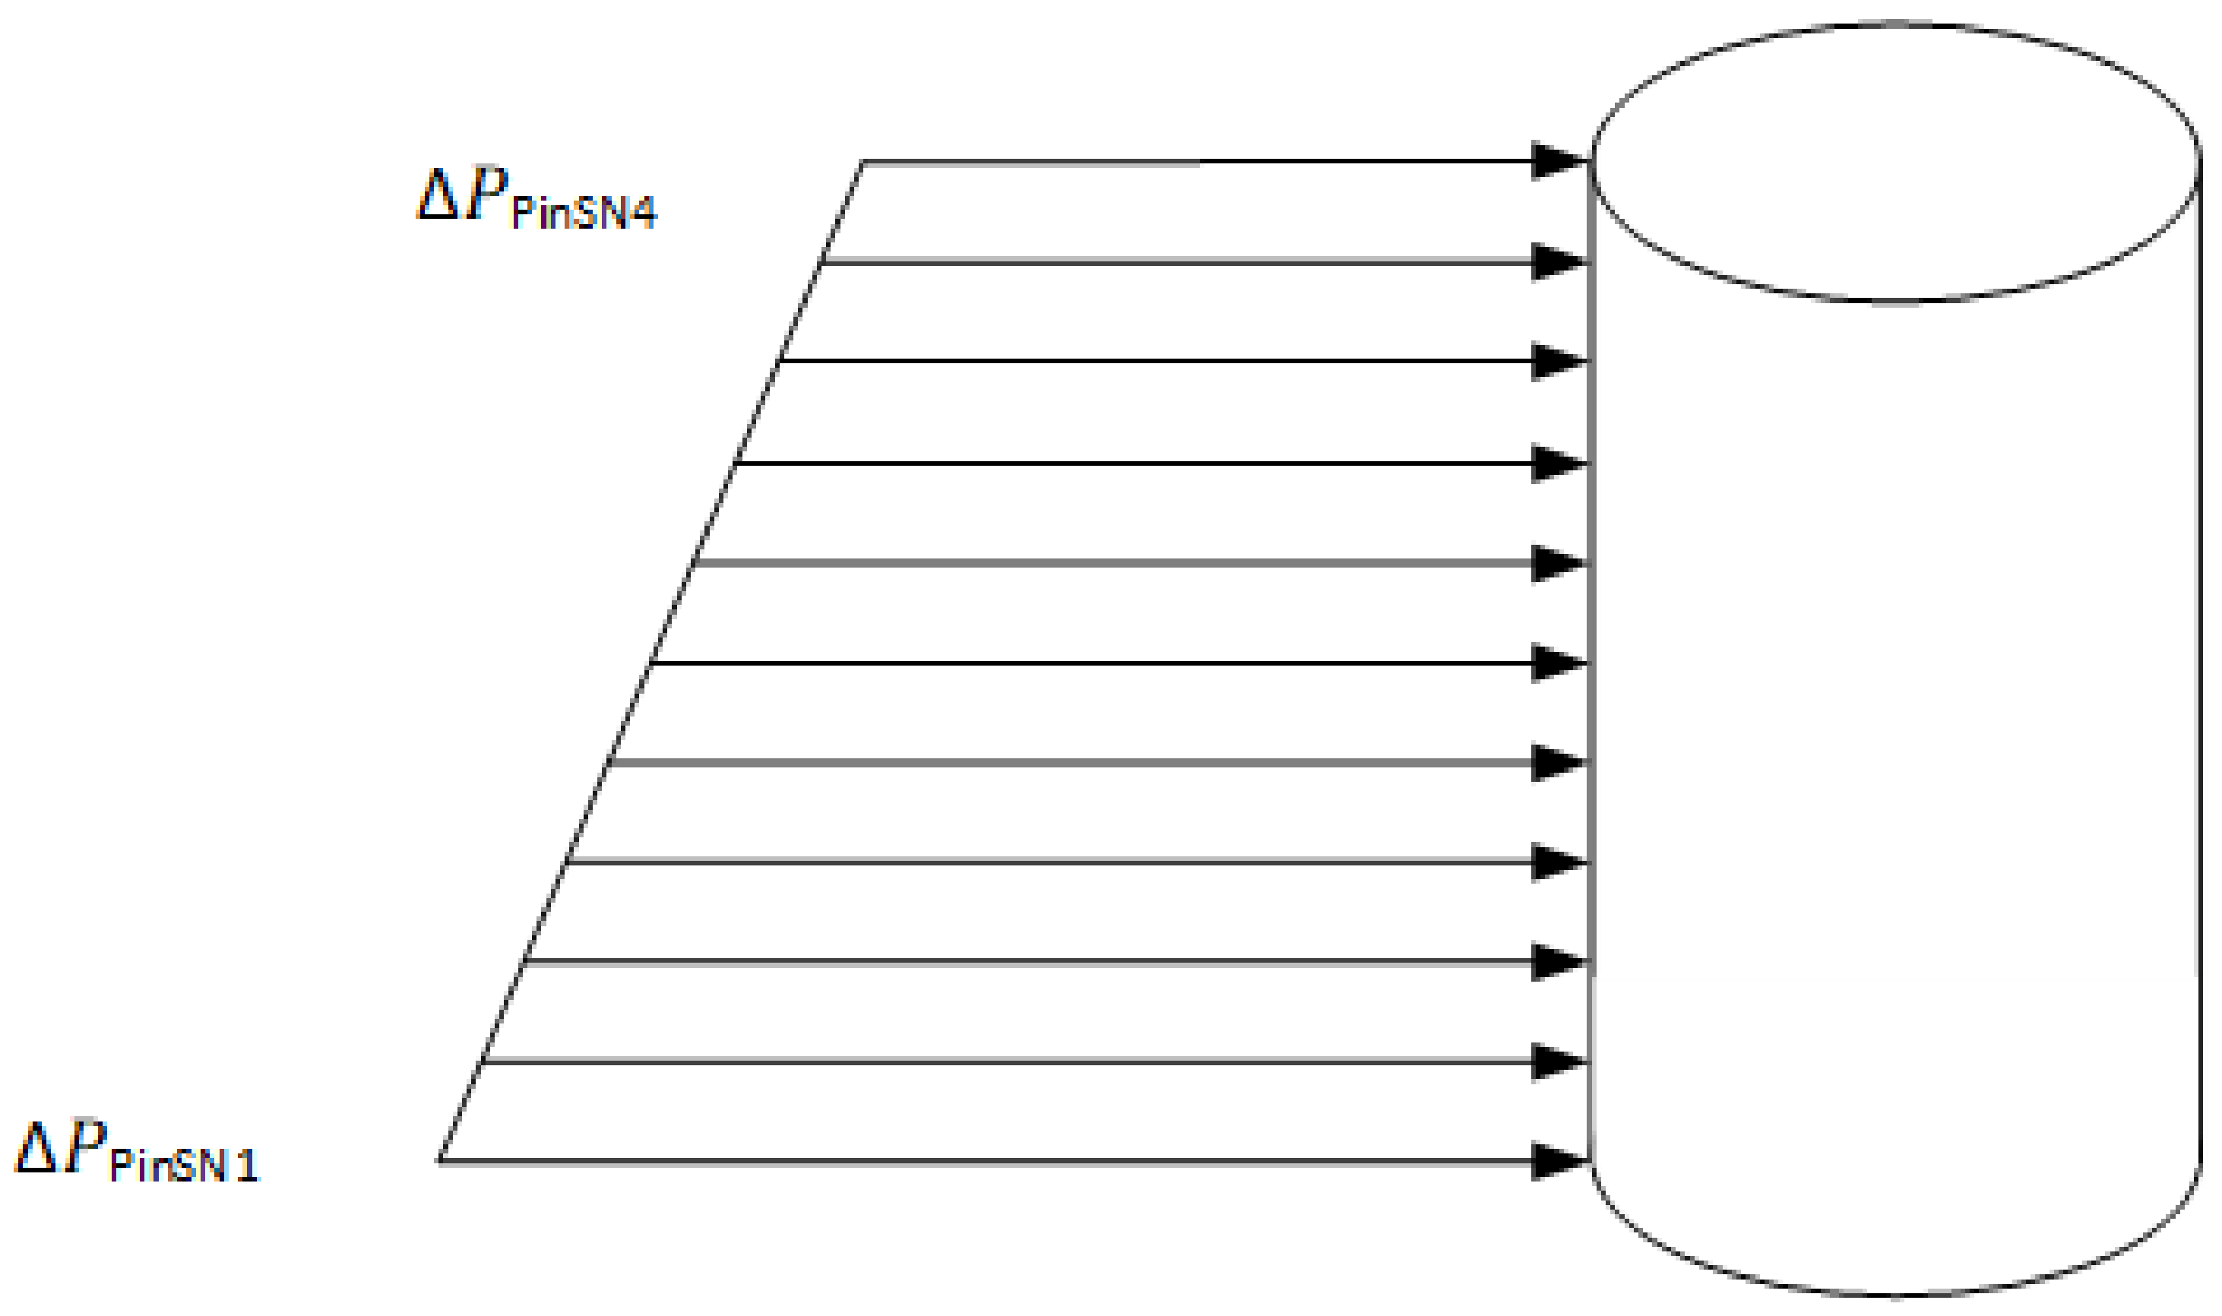
3.1.1. Pressure on the Pin
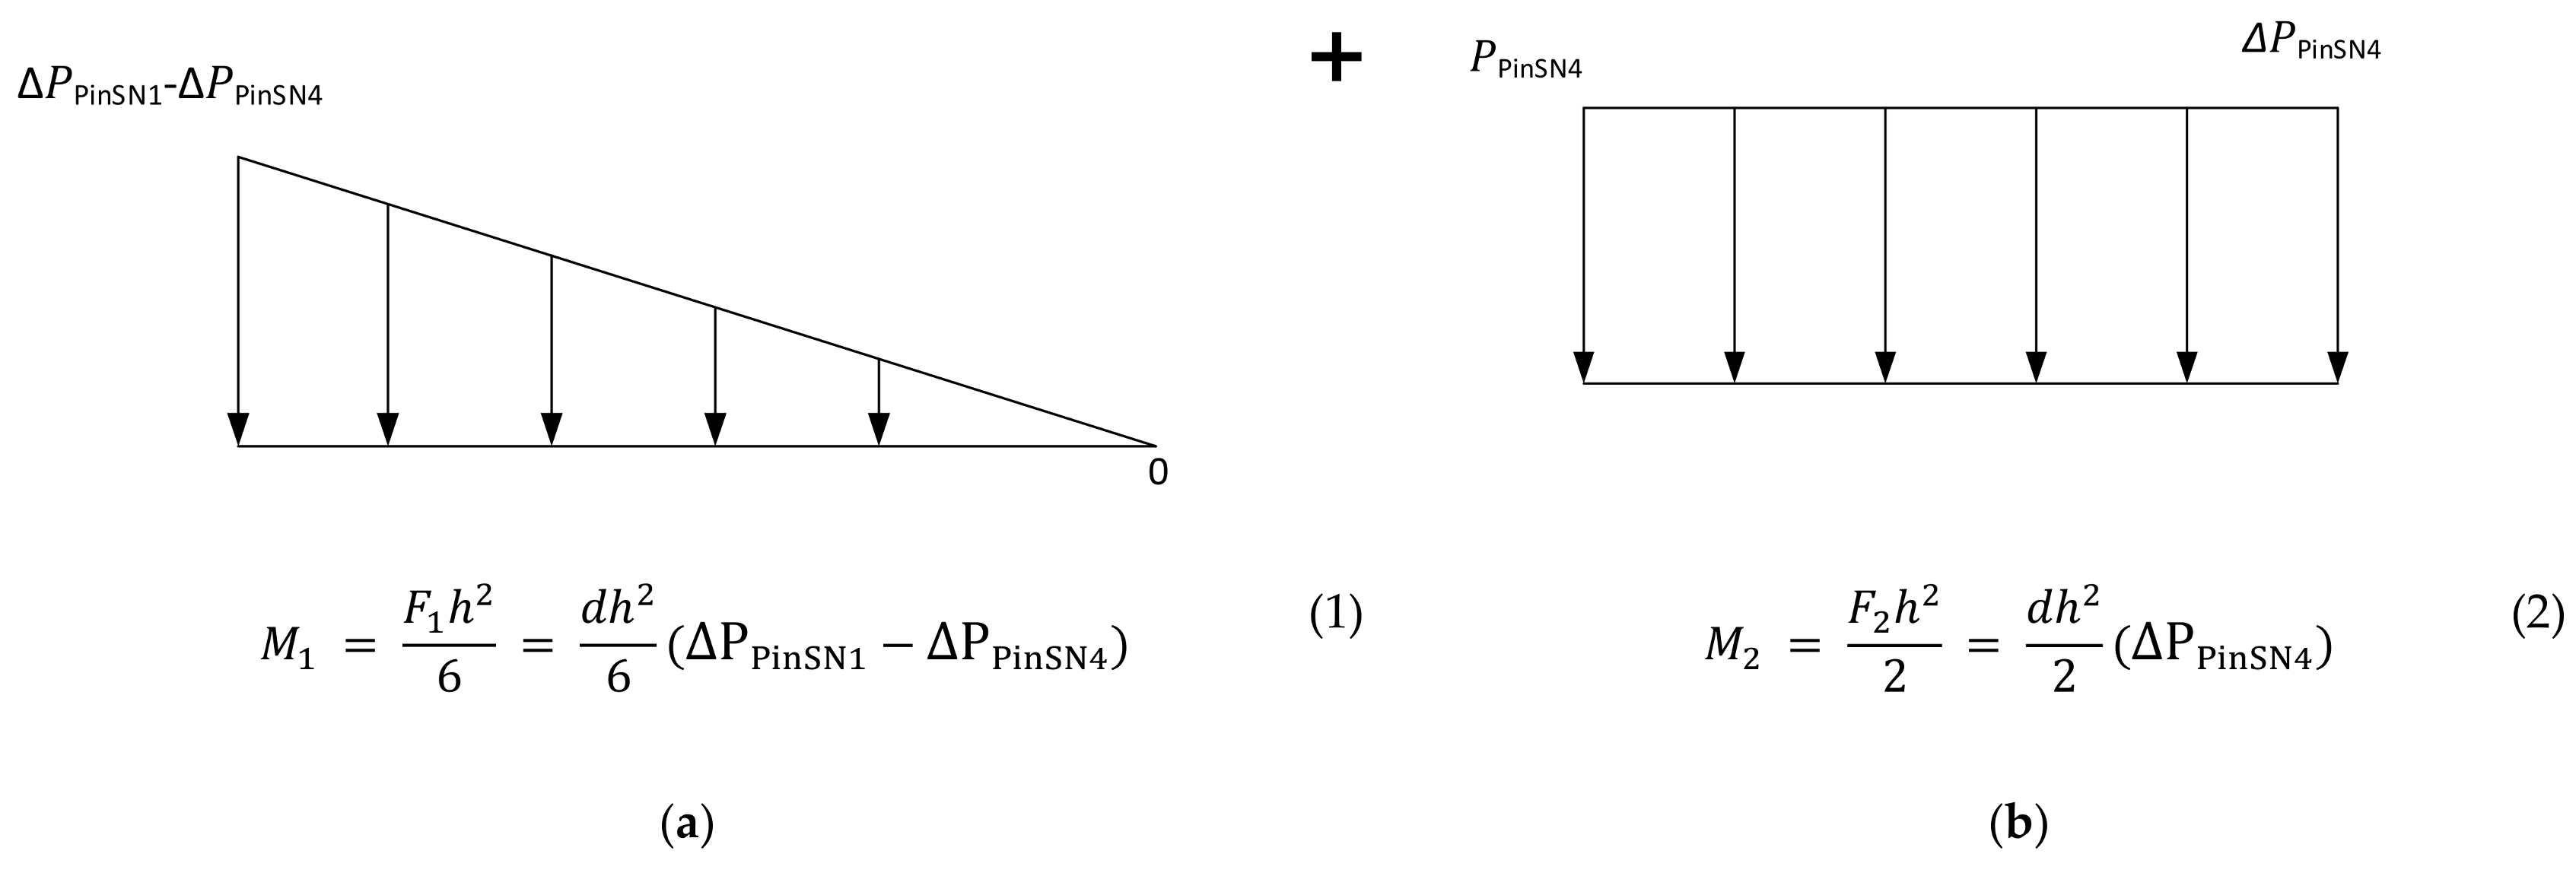
3.1.2. Bending Stress
3.1.3. Shear Stress
- for bending:
- for shear:
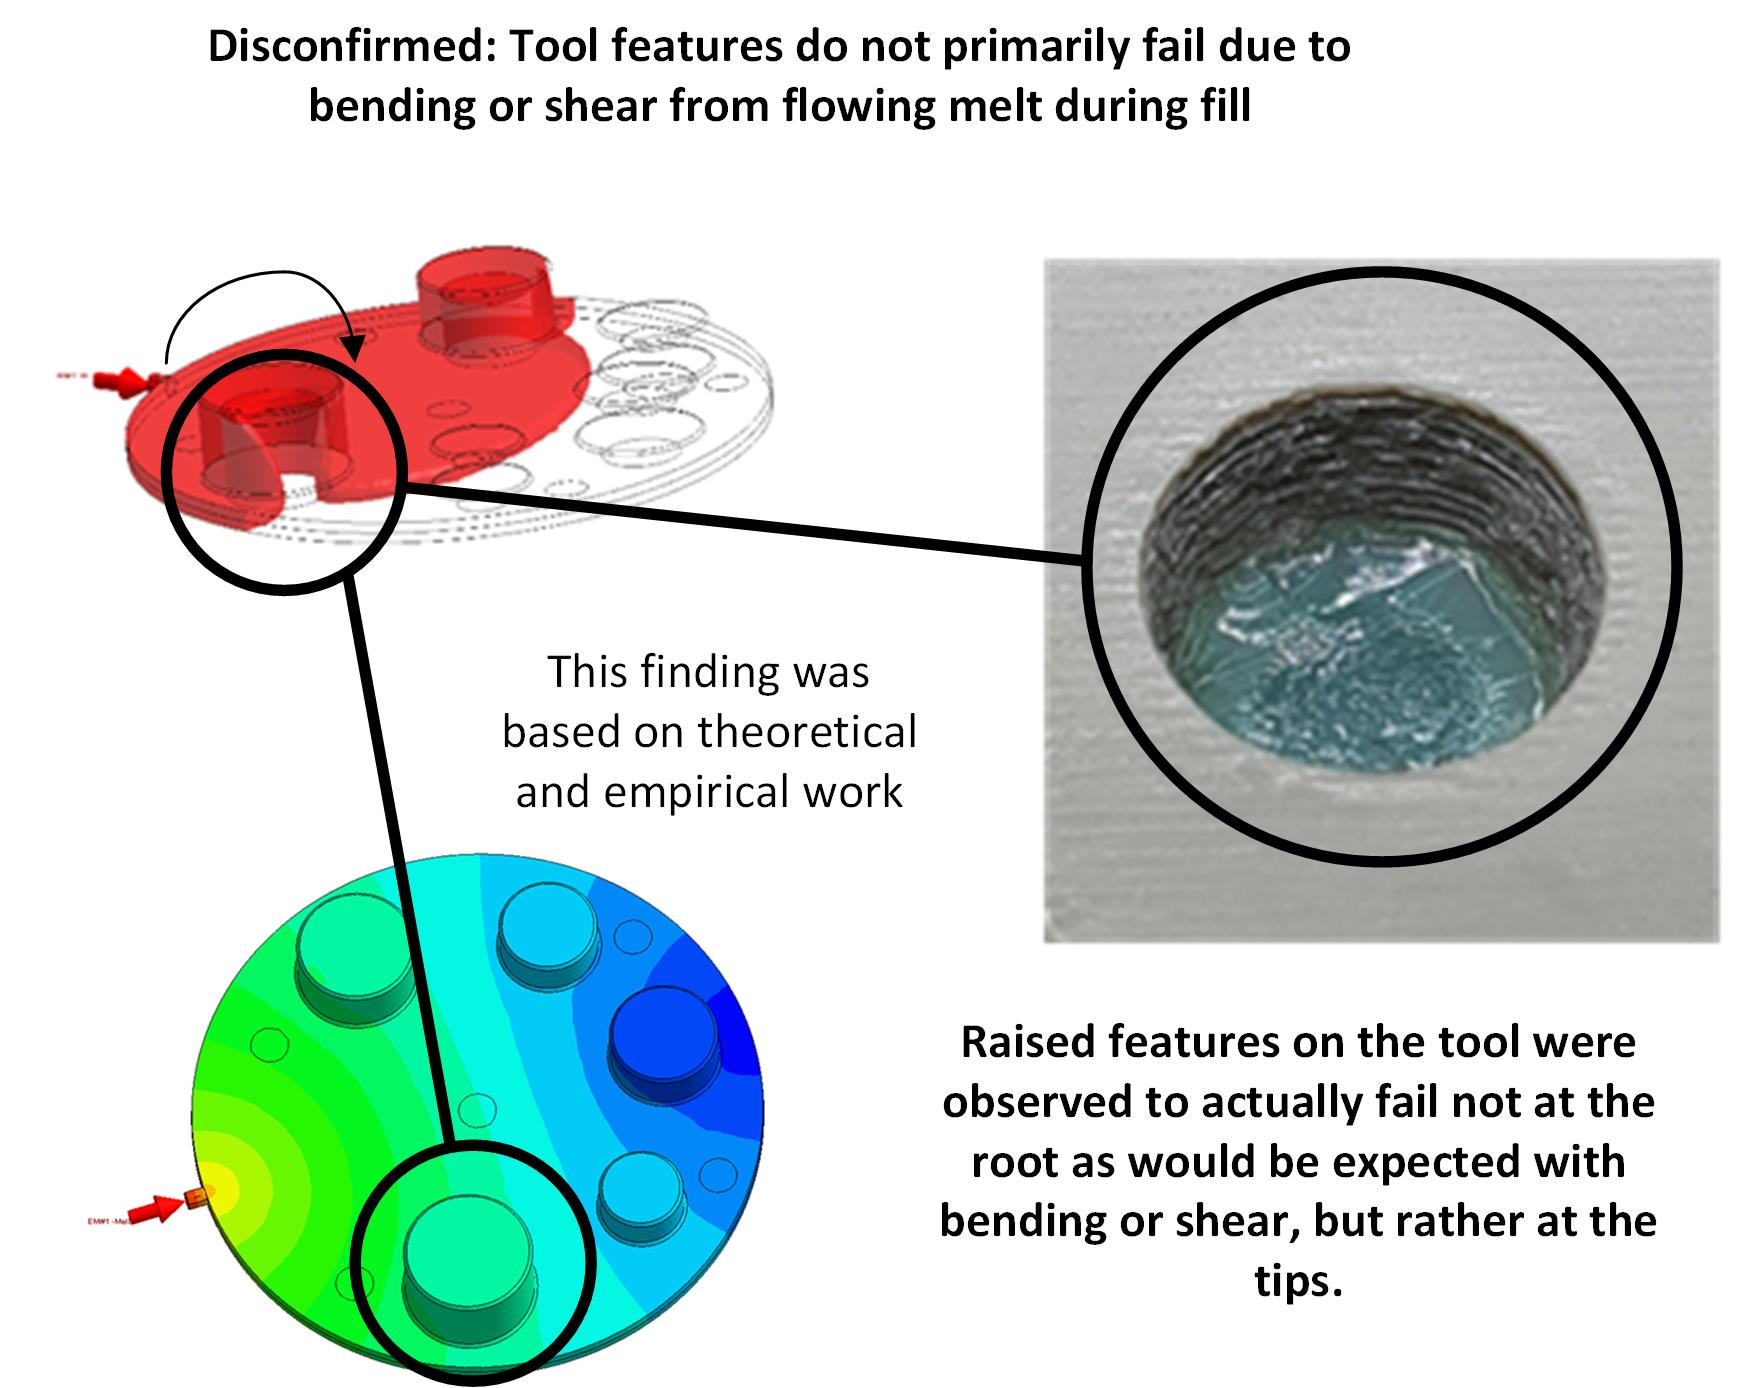
3.1.4. Rejection of the Hypothesis
3.2. Experimental Validation
3.2.1. 3DIM Insert A (Visijet M3-X)
- Shots 1–3:
- The moulding run commenced with a lower shot volume of 75% and incrementally increased to 85% and 95% for 2nd and 3rd shot. The part shows incomplete fill at the furthest distance from the gate around the M3.5 core pin. Note that the gate is at the bottom of the part on the opposite end of M3.5 core pin.
- Shot 3:
- M2 core pin failed. This was the most slender and shortest of the pins.
- Shot 4:
- Full shot, but the M2 hole is solid and filled with injection material for the rest of the sequence (M2 core pin from the tool is broken in previous shot).
- Shot 5:
- Full shot, M5 core pin initial failure.
- Shot 6:
- M5 core pin has a further failure. Incomplete fill arises at the furthest distance from the gate, around the M3.5 core pin. For explanation of this phenomenon, see below.
- Shot 7:
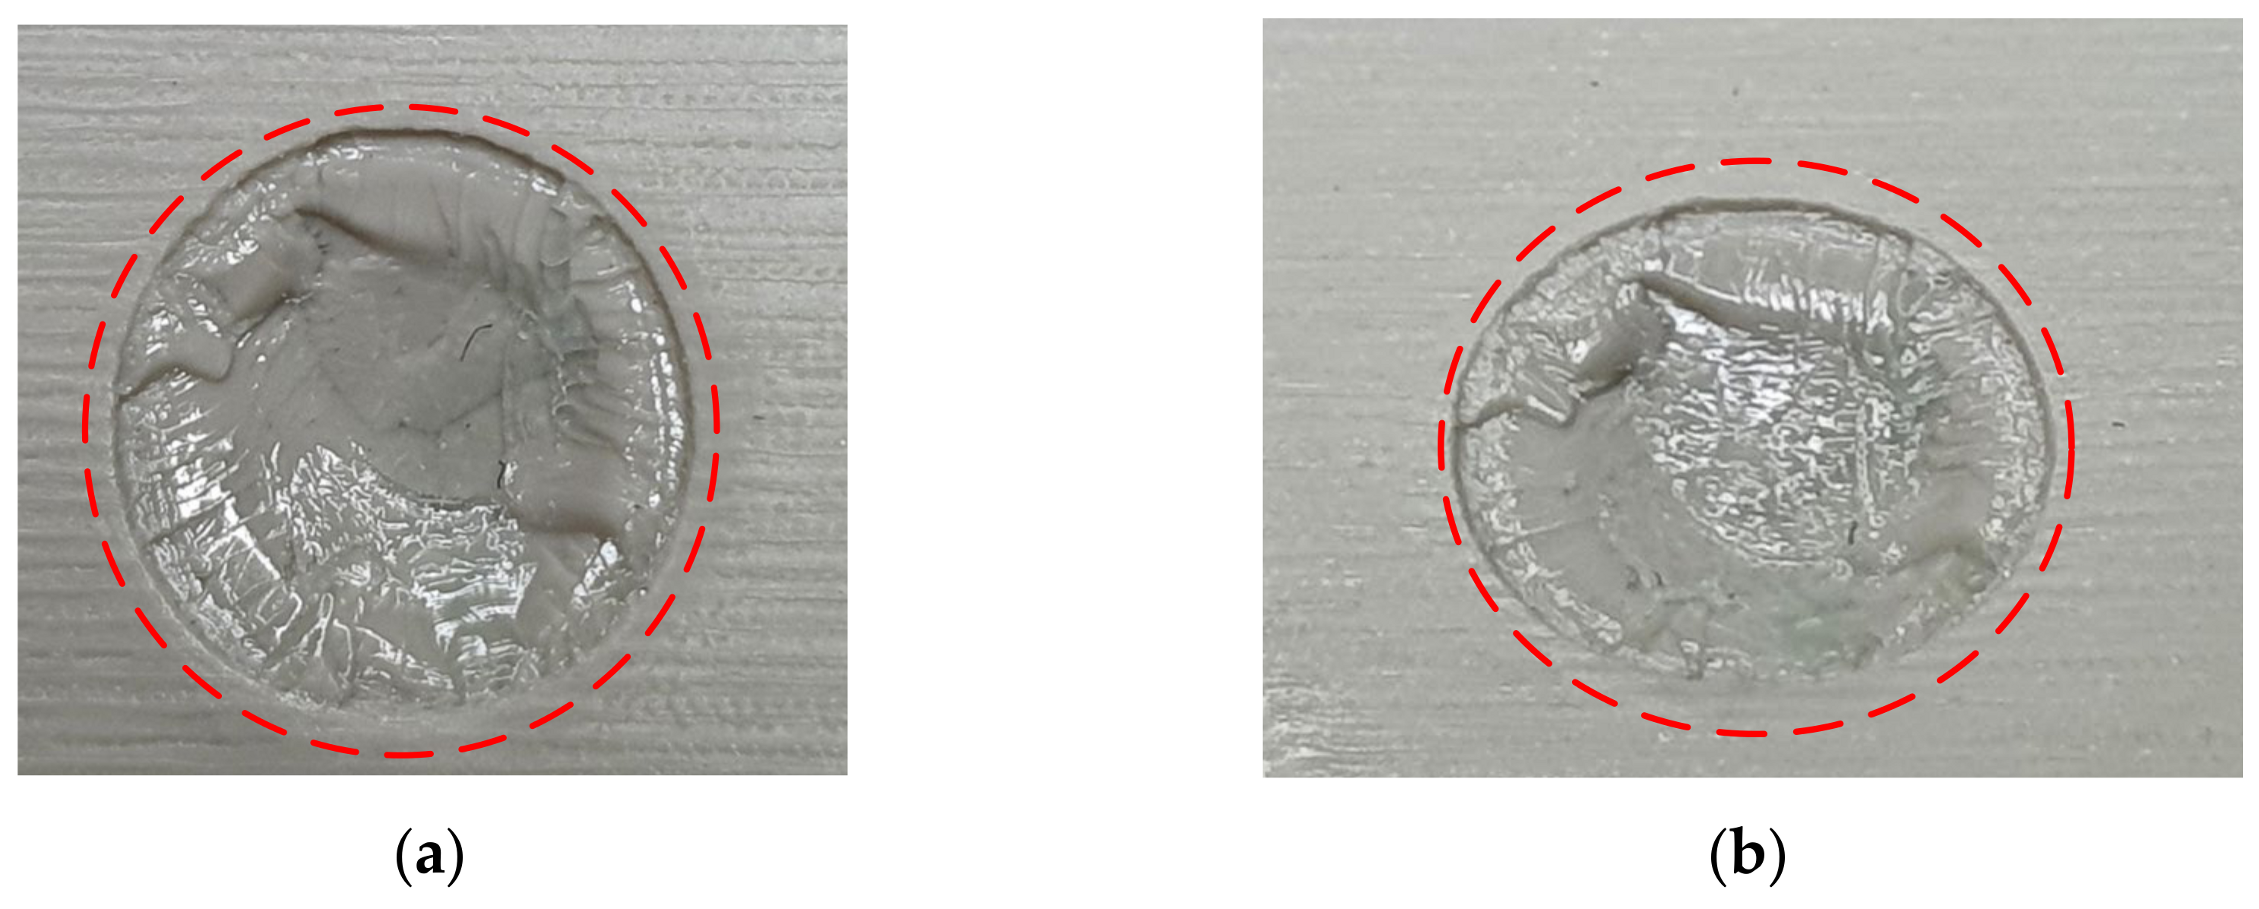
- M4 core pin fails. The M5 hole is solid and filled with injection material for the rest of the sequence. Incomplete fill apparent around the M3.5 core pin: see corresponding cavity face in Figure 22b.
- Shot 8:
- M4 hole is solid and filled with injection material for the rest of the sequence. M5 core pin has a further small avulsion failure. Incomplete fill arises at the furthest distance from the gate.
- Shot 9:
- M3 core pin fails. Incomplete fill arises at the furthest distance from the gate.
- Shot 10:
- M3 core pin has a further failure. Incomplete fill arises at the furthest distance from the gate.
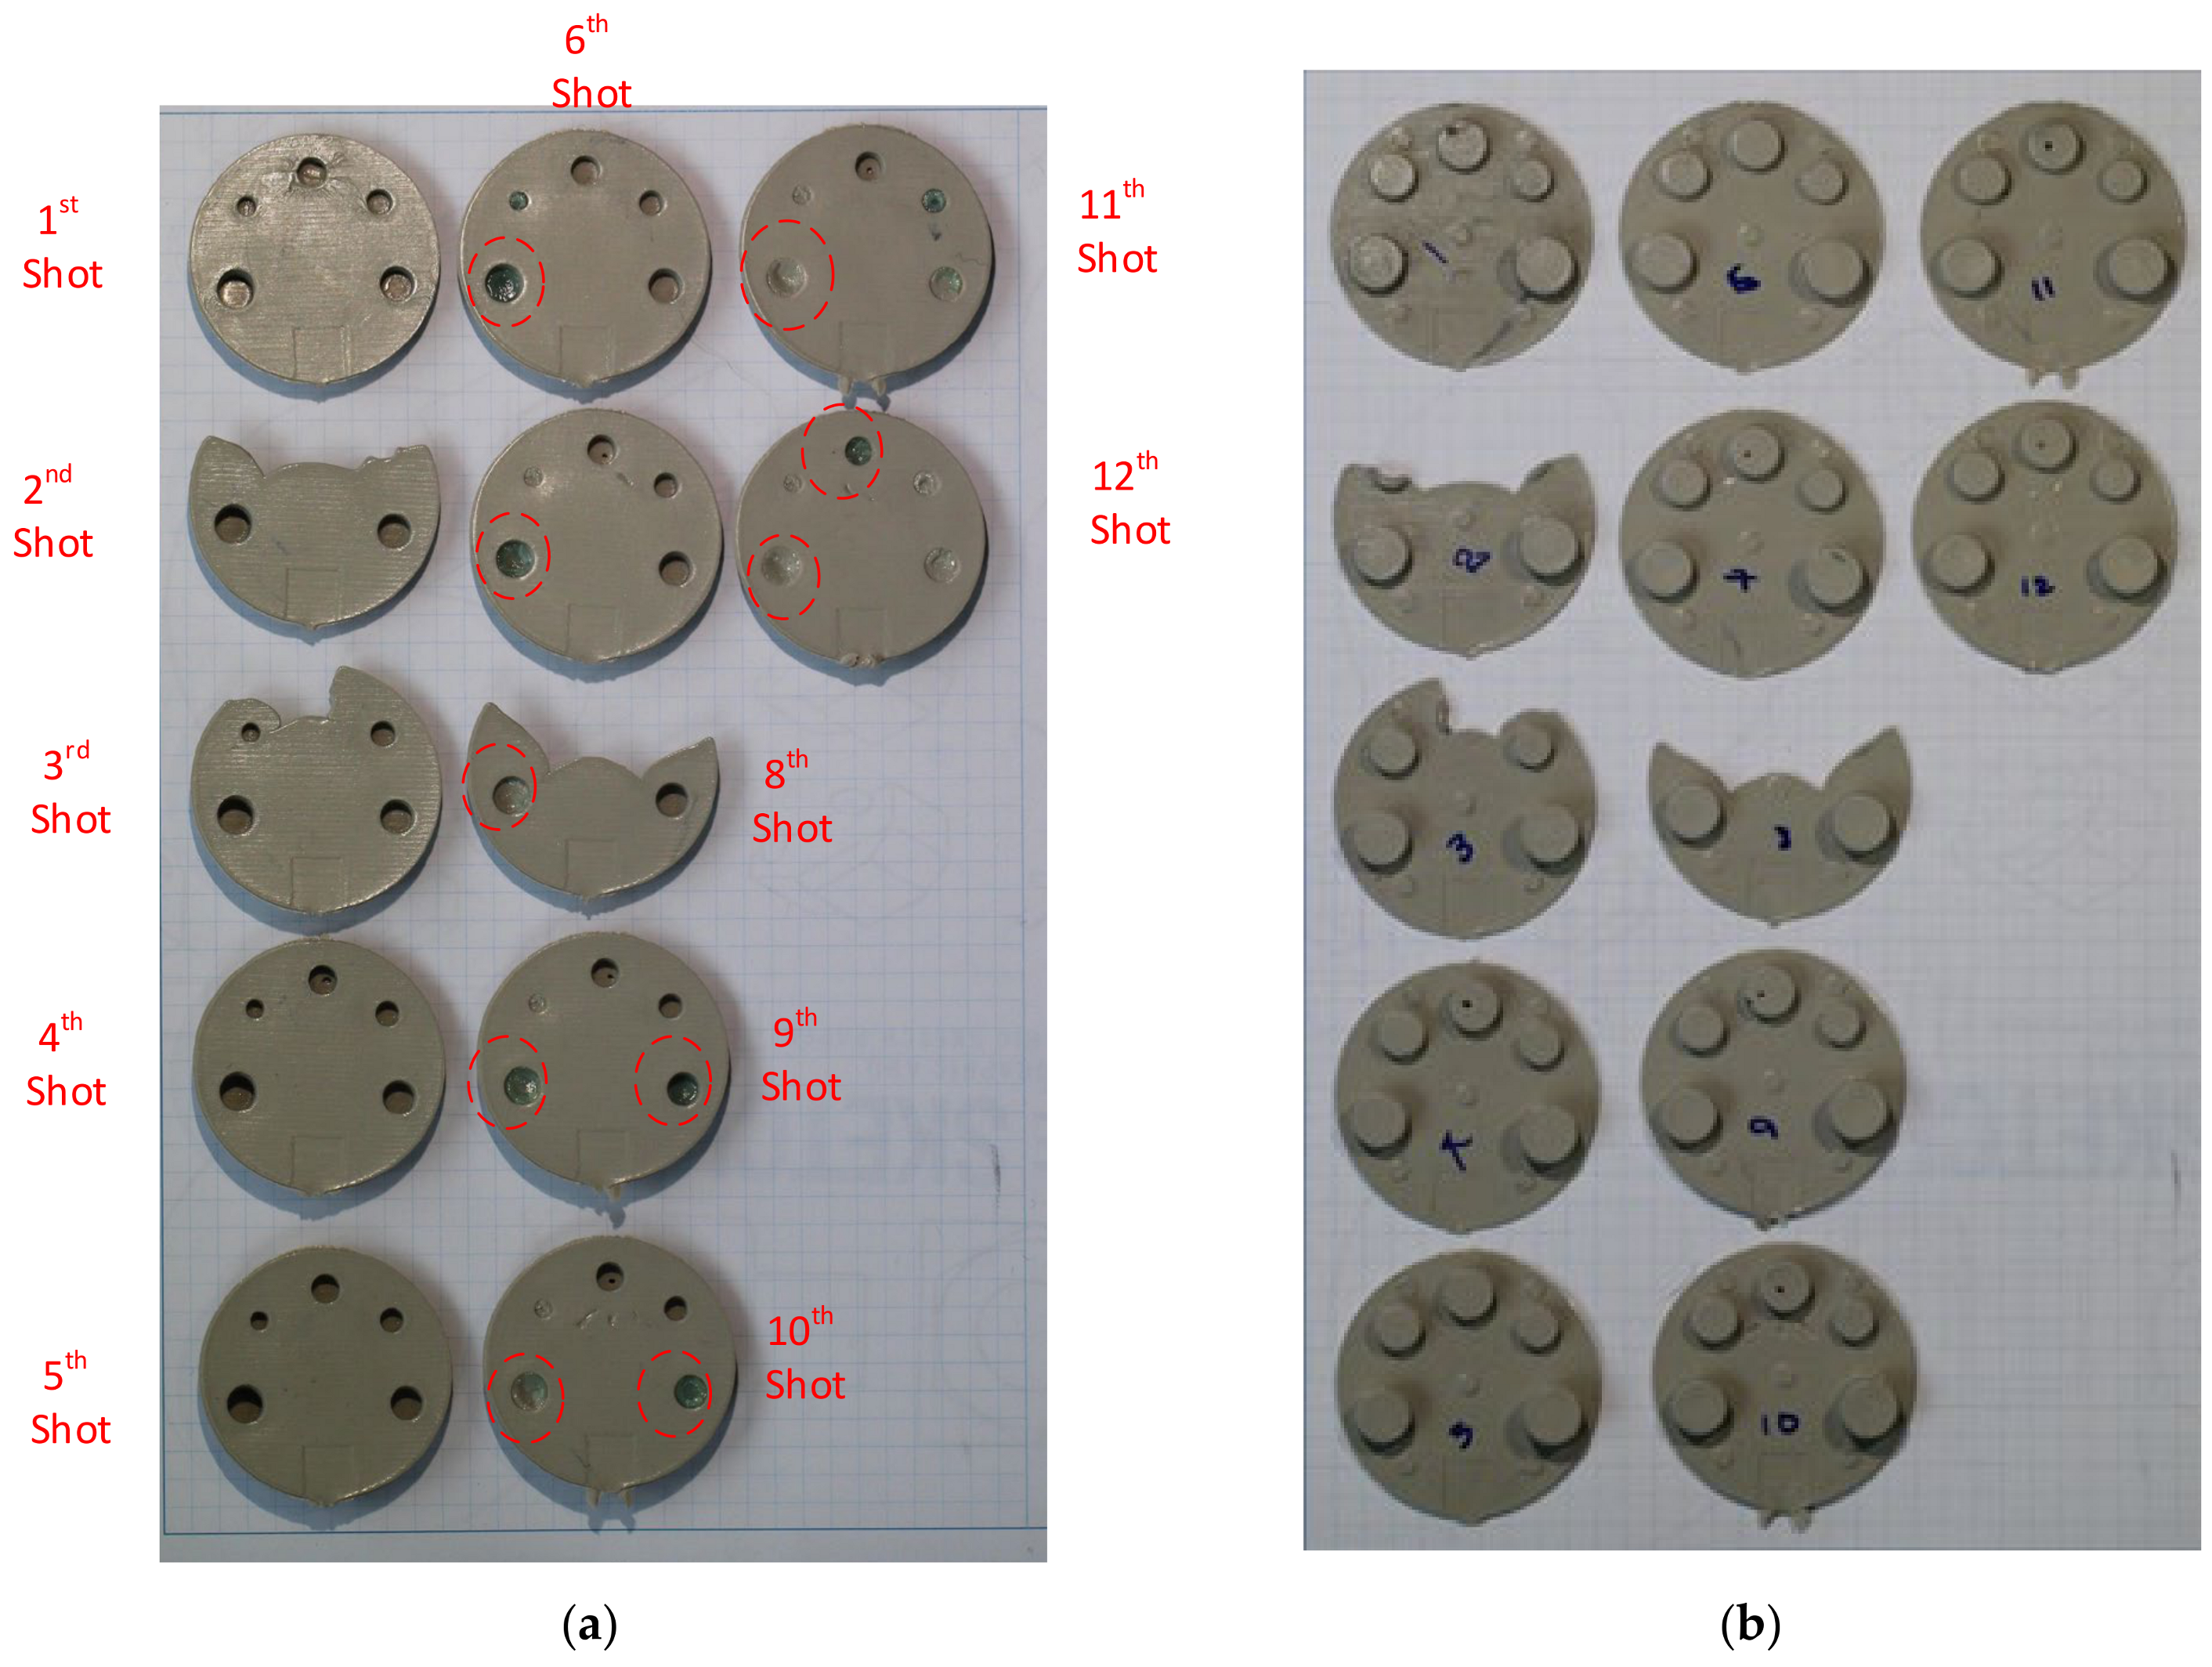
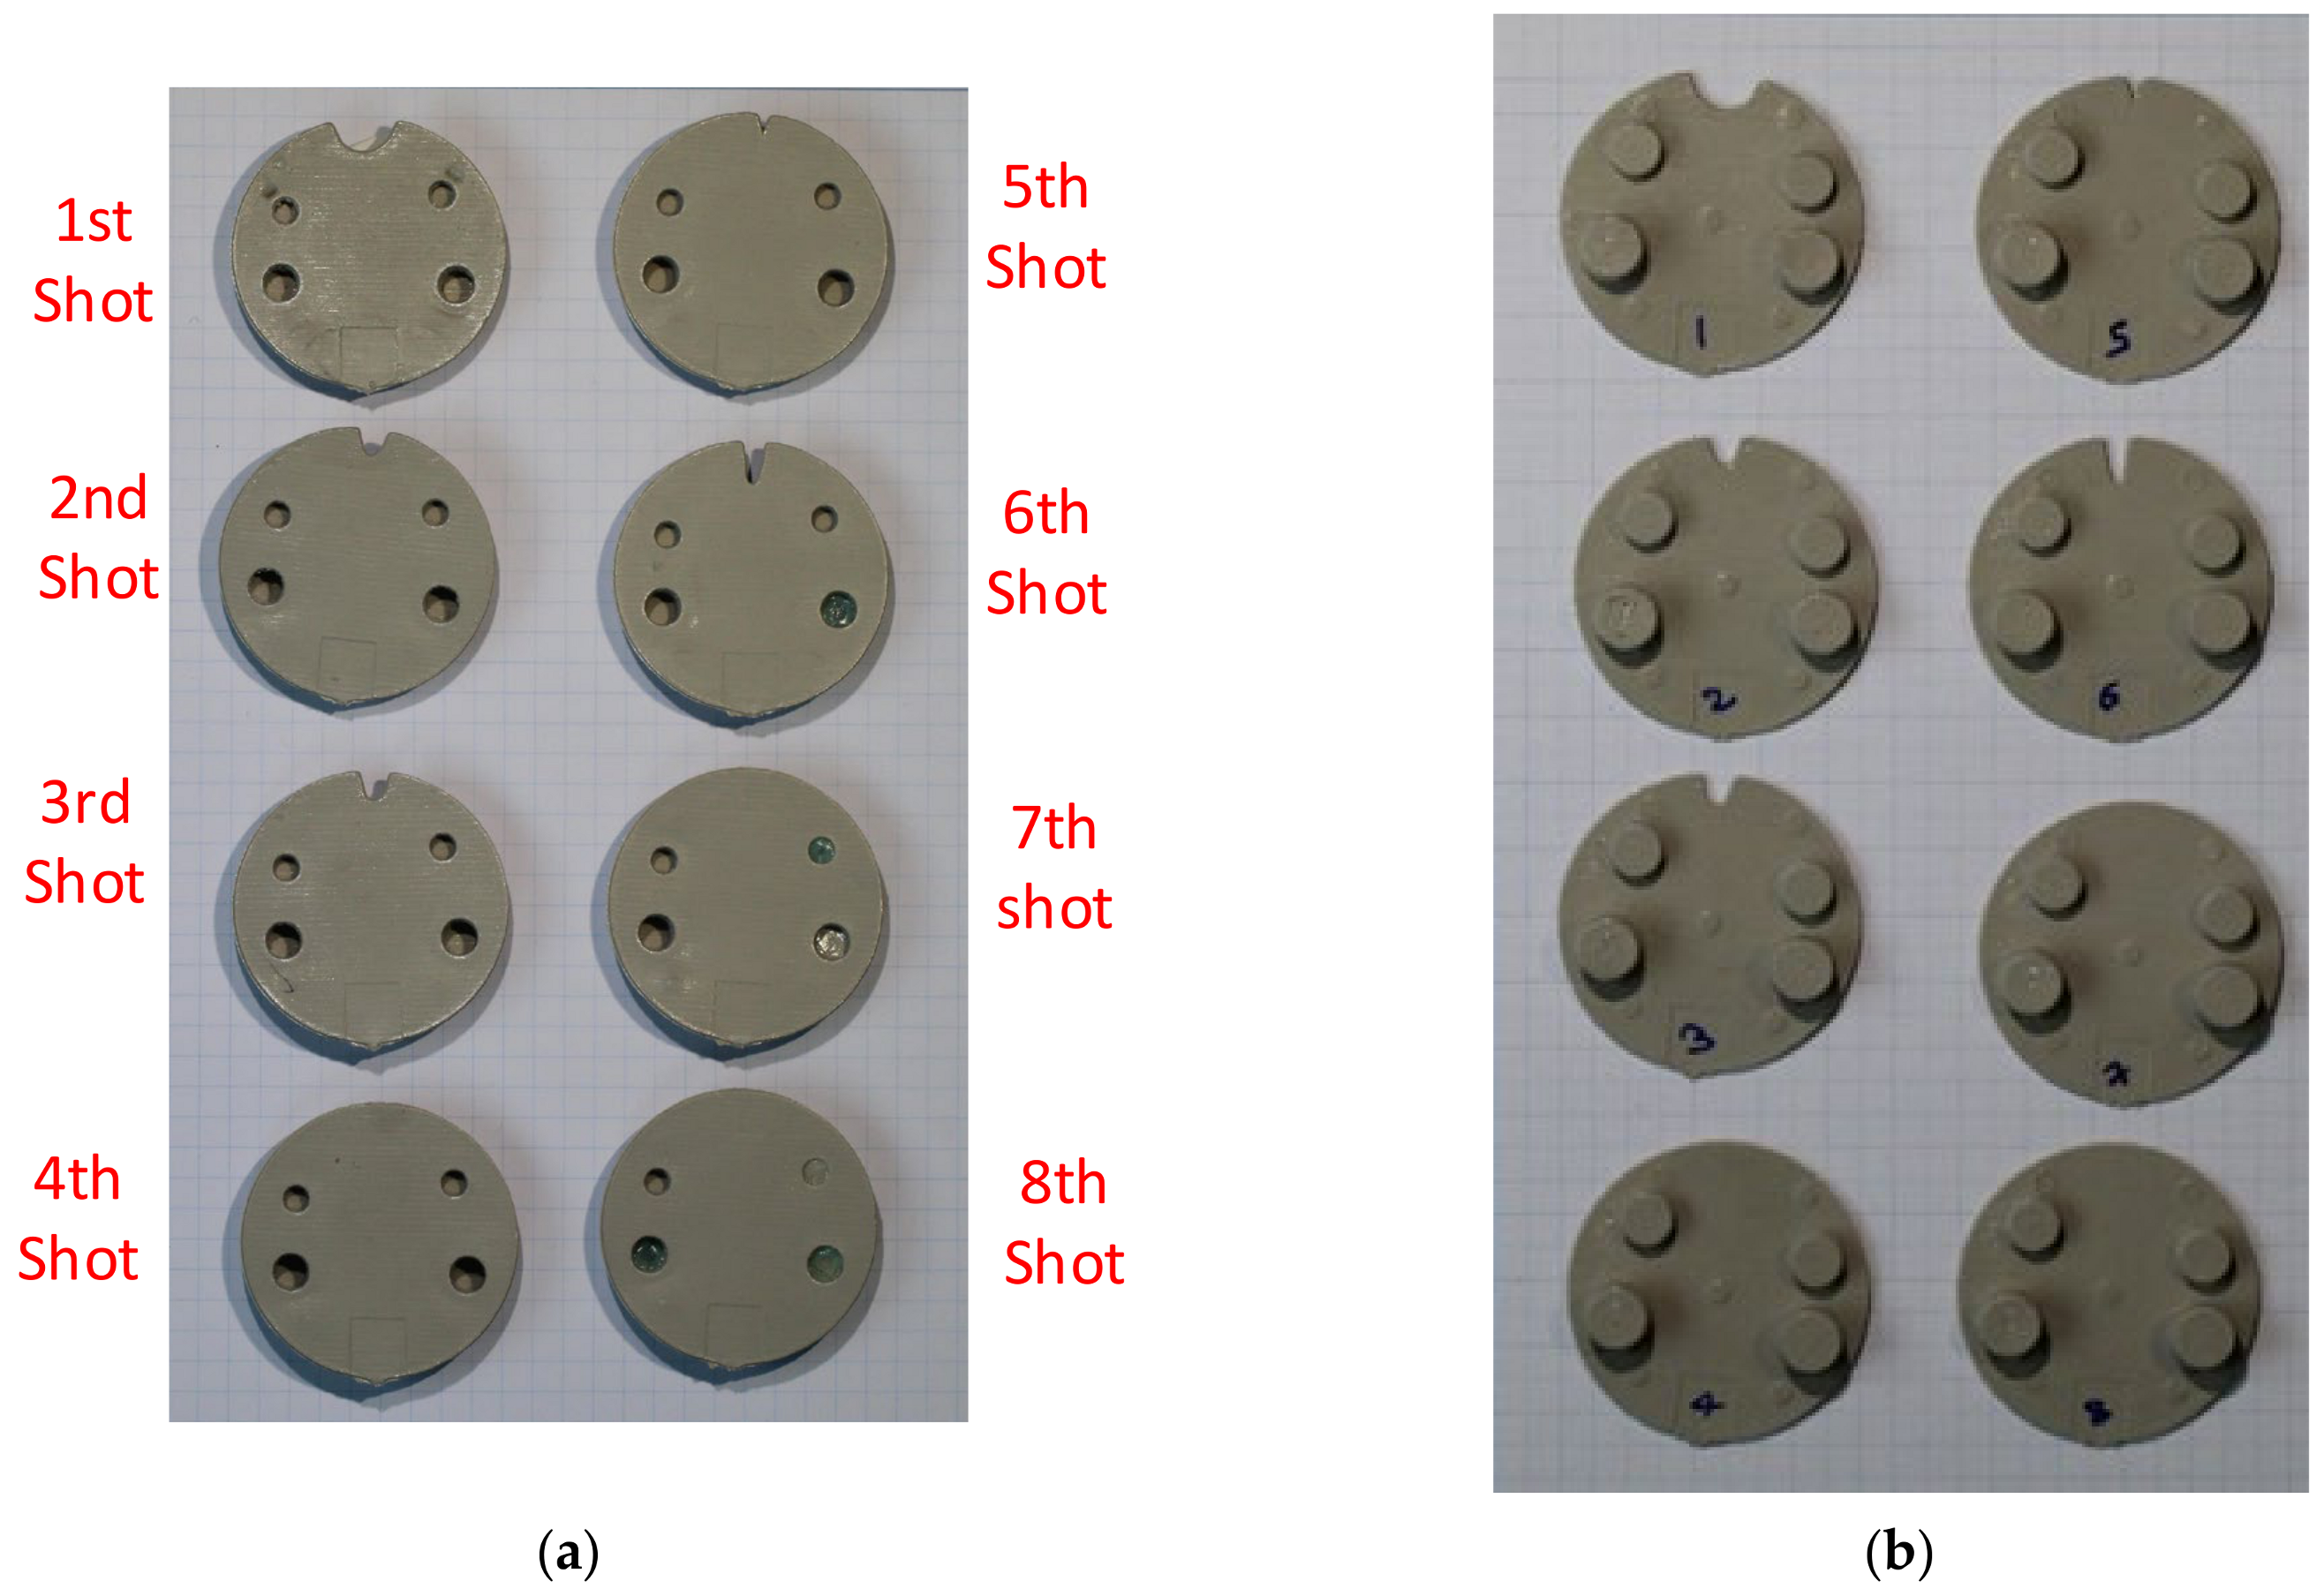
3.2.2. 3DIM Insert B (Digital ABS)
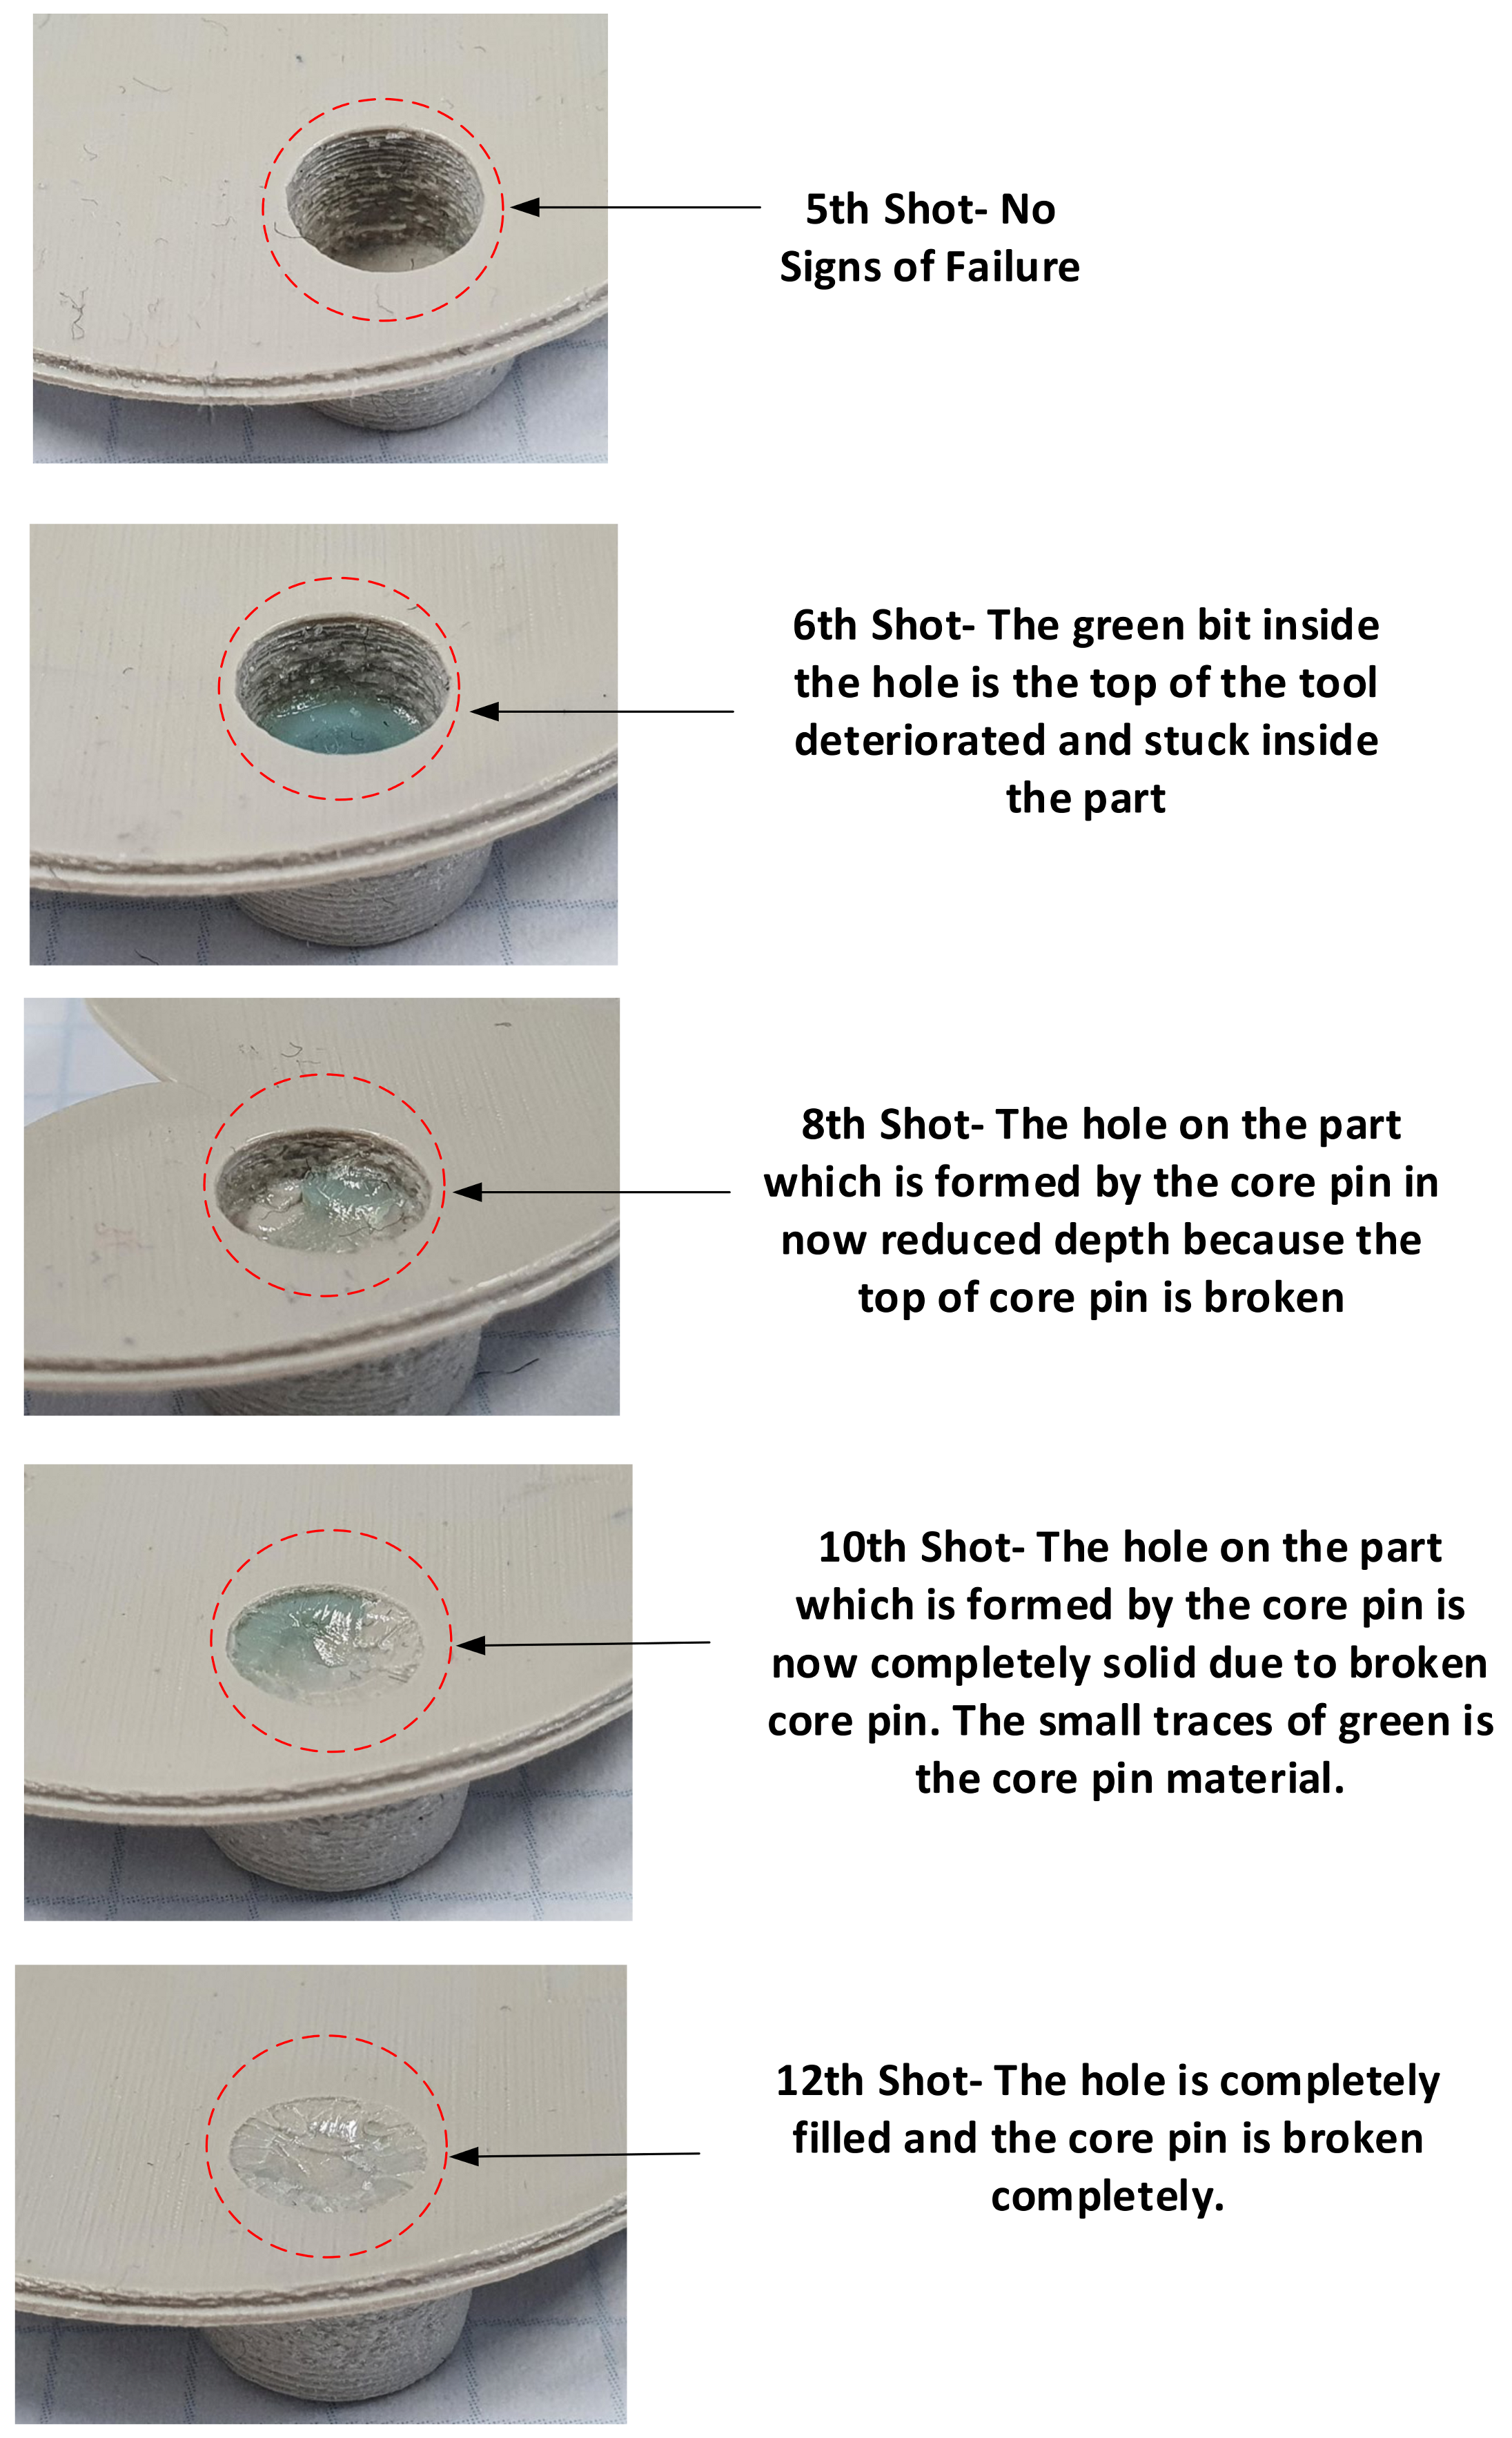
- 6th shot—top part of the M2 core pin
- 6th shot—top part of the M5 core pin
- 7th shot—top part of the M5 core pin
- 9th shot—M4 and M5 core pin
- 11th shot—M3 core pin
- 12th shot—top part of the M3.5 core pin
3.2.3. 3DIM Insert C (Digital ABS)
- 6th shot—top part of the M4 core pin.
- 7th shot—top part of the M2 core pin.
- 8th shot—top part of the M5 core pin
4. Discussion
4.1. Findings
4.2. Limitations of the Research
4.3. Implications for Future Research
5. Conclusions
Author Contributions
Funding
Institutional Review Board Statement
Informed Consent Statement
Data Availability Statement
Acknowledgments
Conflicts of Interest
References
- Kazmer, D.O. Injection Mold Design Engineering, 2nd ed.; Hanser Publications: Cincinnati, OH, USA, 2016. [Google Scholar]
- Rosato, D.V.; Rosato, D.V. Injection Molding Handbook: The Complete Molding Operation Technology, Performance, Economics, 2nd ed.; Chapman & Hall: New York, NY, USA, 1995. [Google Scholar]
- Wagner, S.M.; Walton, R.O. Additive manufacturing’s impact and future in the aviation industry. Prod. Plan. Control 2016, 27, 1124–1130. [Google Scholar] [CrossRef]
- Sachs, E.; Cima, M.; Cornie, J. Three-Dimensional Printing: Rapid Tooling and Prototypes Directly from a CAD Model. CIRP Ann. 1990, 39, 201–204. [Google Scholar] [CrossRef]
- Mendible, G.A.; Rulander, J.A.; Johnston, S.P. Comparative study of rapid and conventional tooling for plastics injection molding. Rapid Prototyp. J. 2017, 23, 344–352. [Google Scholar] [CrossRef]
- Kumar, S.; Singh, A.K. Volumetric shrinkage estimation of benchmark parts developed by rapid tooling mold insert. Sādhanā 2020, 45, 139. [Google Scholar] [CrossRef]
- Rajaguru, J.; Duke, M.; Au, C. Development of rapid tooling by rapid prototyping technology and electroless nickel plating for low-volume production of plastic parts. Int. J. Adv. Manuf. Technol. 2015, 78, 31–40. [Google Scholar] [CrossRef]
- Yarlagadda, P.K.D.V.; Wee, L.K. Design, development and evaluation of 3D mold inserts using a rapid prototyping technique and powder-sintering process. Int. J. Prod. Res. 2006, 44, 919–938. [Google Scholar] [CrossRef]
- Rahmati, S.; Dickens, P. Rapid tooling analysis of Stereolithography injection mould tooling. Int. J. Mach. Tools Manuf. 2007, 47, 740–747. [Google Scholar] [CrossRef]
- Noble, J.; Walczak, K.; Dornfeld, D. Rapid Tooling Injection Molded Prototypes: A Case Study in Artificial Photosynthesis Technology. Procedia CIRP 2014, 14, 251–256. [Google Scholar] [CrossRef]
- Gardan, J. Additive manufacturing technologies: State of the art and trends. Int. J. Prod. Res. 2016, 54, 3118–3132. [Google Scholar] [CrossRef]
- Kuo, C.-C.; Chen, W.-J. Development and application of intelligent monitoring system for rapid tooling applied in low-pressure injection molding. Int. J. Adv. Manuf. Technol. 2020, 111, 3453–3467. [Google Scholar] [CrossRef]
- Chua, C.K.; Leong, K.F.; Liu, Z.H. Rapid Tooling in Manufacturing. In Handbook of Manufacturing Engineering and Technology; Nee, A.Y.C., Ed.; Springer London: London, UK, 2015; pp. 2525–2549. [Google Scholar] [CrossRef]
- Weiss, L.E.; Gursoz, E.; Prinz, F.; Fussell, P.; Mahalingam, S.; Patrick, E. A rapid tool manufacturing system based on stereolithography and thermal spraying. Manuf. Rev. 1990, 3, 40–48. [Google Scholar]
- Hopkinson, N.; Dickens, P. Predicting stereolithography injection mould tool behaviour using models to predict ejection force and tool strength. Int. J. Prod. Res. 2000, 38, 3747–3757. [Google Scholar] [CrossRef]
- Tábi, T.; Kovács, N.K.; Sajó, I.E.; Czigány, T.; Hajba, S.; Kovács, J.G. Comparison of thermal, mechanical and thermomechanical properties of poly(lactic acid) injection-molded into epoxy-based Rapid Prototyped (PolyJet) and conventional steel mold. J. Therm. Anal. Calorim. 2016, 123, 349–361. [Google Scholar] [CrossRef]
- Segal, J.I.C.; Campbell, R.I. A review of research into the effects of rapid tooling on part properties. Rapid Prototyp. J. 2001, 7, 9. [Google Scholar] [CrossRef]
- Colton, J.S.; Crawford, J.; Pham, G.; Rodet, V.; Wang, K.K. Failure of Rapid Prototype Molds during Injection Molding. CIRP Ann. 2001, 50, 129–132. [Google Scholar] [CrossRef]
- Rahmati, S.; Dickens, P. Stereolithography for injection mould tooling. Rapid Prototyp. J. 1997, 3, 53–60. [Google Scholar] [CrossRef]
- Park, H.; Cha, B.; Cho, S.; Kim, D.; Choi, J.H.; Pyo, B.-G.; Rhee, B. A study on the estimation of plastic deformation of metal insert parts in multi-cavity injection molding by injection-structural coupled analysis. Int. J. Adv. Manuf. Technol. 2016, 83, 2057–2069. [Google Scholar] [CrossRef]
- Harris, R.; Hopkinson, N.; Newlyn, H.; Hague, R.; Dickens, P. Layer thickness and draft angle selection for stereolithography injection mould tooling. Int. J. Prod. Res. 2002, 40, 719–729. [Google Scholar] [CrossRef]
- Bagalkot, A.; Pons, D.; Symons, D.; Clucas, D. Categorization of Failures in Polymer Rapid Tools Used for Injection Molding. Processes 2019, 7, 17. [Google Scholar] [CrossRef]
- Bagalkot, A.; Pons, D.; Clucas, D.; Symons, D. A methodology for setting the injection moulding process parameters for polymer rapid tooling inserts. Rapid Prototyp. J. 2019, 25, 1493–1505. [Google Scholar] [CrossRef]
- Digital ABS Plus. Available online: http://www.stratasys.com/materials/search/digital-abs-plus (accessed on 5 January 2018).
- Form 3. Available online: https://formlabs.com/3d-printers/form-3/ (accessed on 24 February 2021).
- ProX. Available online: https://www.3dsystems.com/3d-printers/plastic (accessed on 24 February 2021).
- Polyjet. Available online: https://www.stratasys.com/polyjet-technology (accessed on 24 February 2021).
- Solidscape. Available online: https://www.solidscape.com/ (accessed on 24 February 2021).
- XJET. Available online: https://www.xjet3d.com/ (accessed on 24 February 2021).
- Accura Bluestone. Available online: https://www.3dsystems.com/materials/accura-bluestone (accessed on 5 August 2020).
- SPIROL. Available online: https://www.spirol.com (accessed on 25 March 2021).
- SOLIDWORKS. Available online: https://www.solidworks.com/ (accessed on 25 February 2021).
- Moldex3D. Available online: https://www.moldex3d.com/en/ (accessed on 25 February 2021).
- Hopkinson, N.; Dickens, P.M. Using stereolithography tools for injection moulding: Research into tensile tool failure and unexpected benefits of the process. Proc. Inst. Mech. Eng. 2000, 214, 9. [Google Scholar] [CrossRef]


| Name | Diameter (mm) | Height (mm) | Aspect Ratio | Distance from Gate (mm) |
|---|---|---|---|---|
| M2 Core Pin | 3.63 | 3.18 | 1.14 | 35.8 |
| M3 Core Pin | 4.75 | 3.56 | 1.33 | 35.8 |
| M3.5 Core Pin | 5.54 | 3.81 | 1.45 | 39.45 |
| M4 Core Pin | 6.38 | 4.7 | 1.35 | 23.71 |
| M5 Core Pin | 7.16 | 6.35 | 1.12 | 23.71 |
| MJ Machine 1 | MJ Machine 2 | |
|---|---|---|
| Material | Visijet M3X | Digital ABS |
| Machine | Projet 3500 | Object Connex 350 |
| Manufacturer | 3D Systems | Stratasys |
| Layer Thickness | 30 Microns | 30 Microns |
| Print Mode | Not Applicable | Matte |
| Cleaning | Water Jet Cleaning | Water Jet Cleaning |
| Description | Value |
|---|---|
| Resin | Lexan 943-A |
| Manufacturer | Sabic Innovative Plastics |
| Type | Polycarbonate |
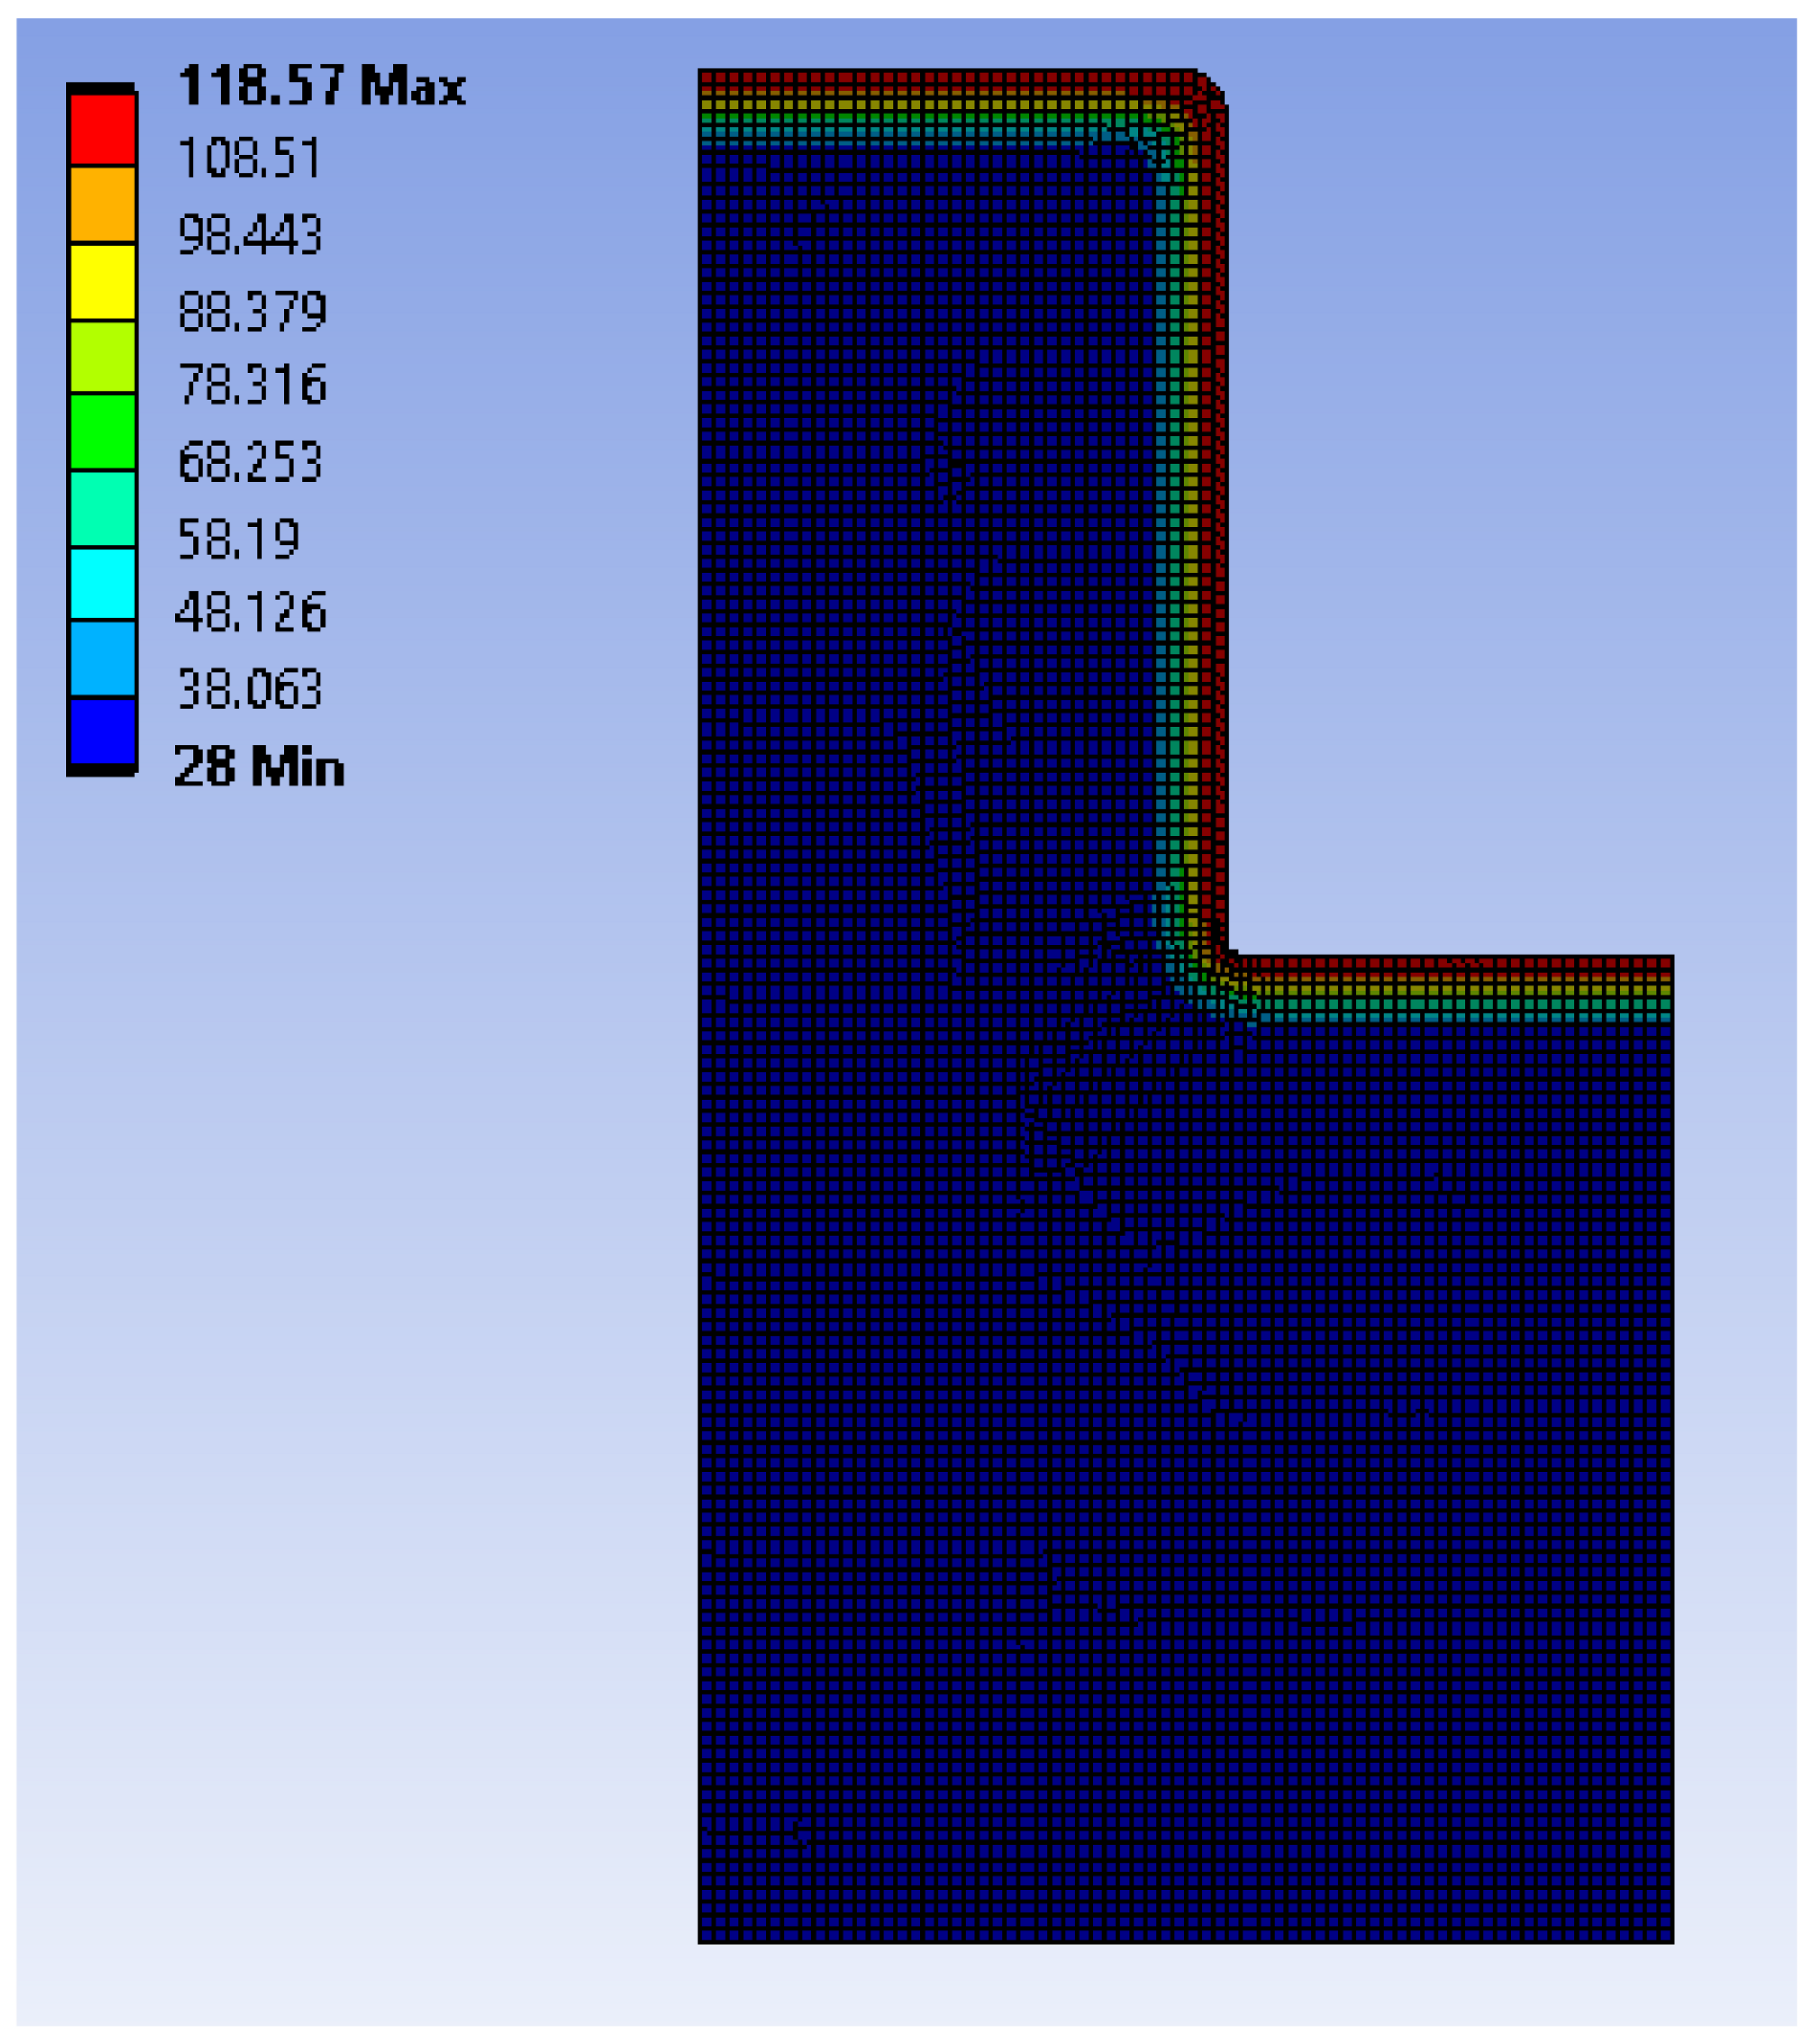
| Mould Temperature | 28 °C |
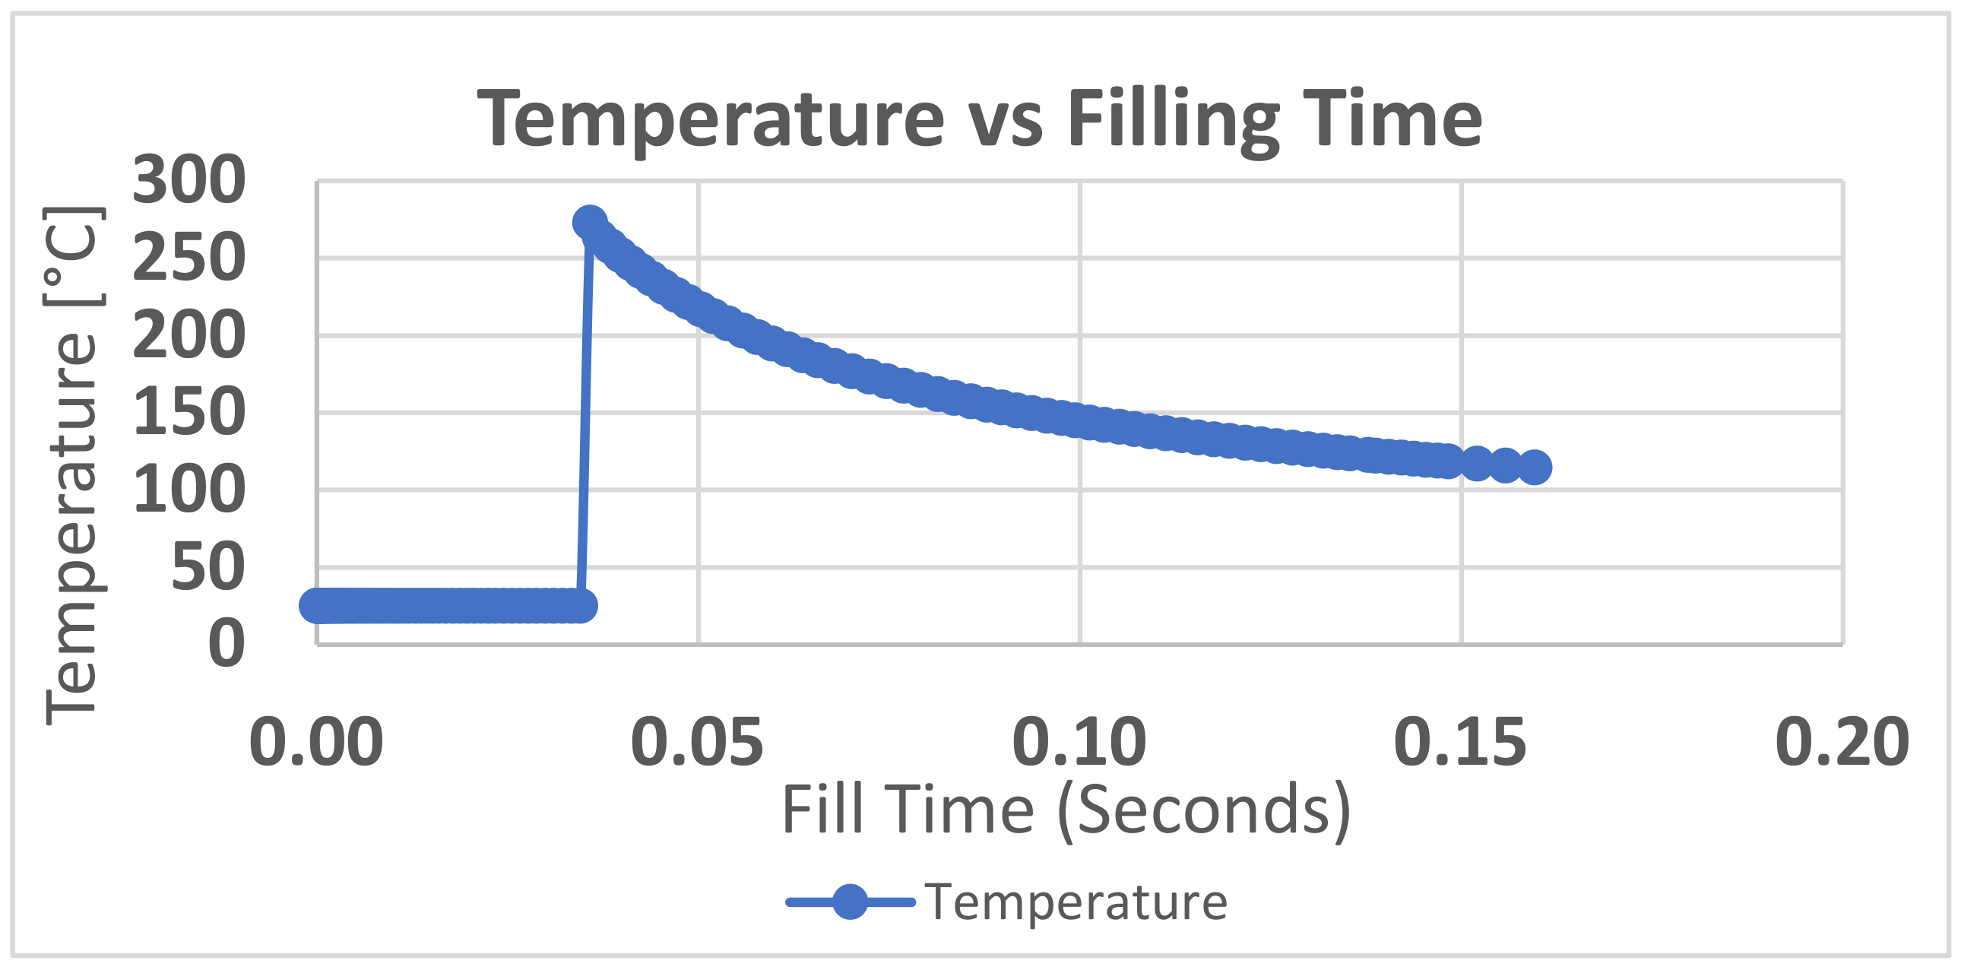
| Melt Temperature | 300 °C |
| Injection Pressure | 60 MPa |
| Fill Time | 0.2 Seconds |
| Cooling Time | 45 Seconds |
| Mould Open Time | Open until the mould temperature returned to 28 °C |
| Symbol | Parameter |
|---|---|
| Maximum bending stress | |
| Injection pressure at the first point of contact (front face) | |
| Injection pressure at last point of contact (back face) | |
| Sensor number [1,2,3,4] | |
| M | Internal bending moment |
| y | Perpendicular distance from neutral axis |
| I | Moment of inertia of the section |
| Height of the core pin | |
| Diameter of the pin |
| Symbol | Parameter |
|---|---|
| Maximum shear stress | |
| Injection pressure at the first point of contact (front face) | |
| Injection pressure at last point of contact (back face) | |
| Sensor number [1,2,3,4] |
| Name | Diameter (mm) | Height (mm) | Shear Stress (MPa) | ||
|---|---|---|---|---|---|
| M2 Core Pin | 3.63 | 3.18 | 11.75 | 3.69 | 0.14 |
| M3 Core Pin | 4.75 | 3.56 | 8.65 | 3.16 | 0.14 |
| M3.5 Core Pin | 5.54 | 3.81 | 10.49 | 4.37 | 0.18 |
| M4 Core Pin | 6.38 | 4.7 | 16.77 | 6.33 | 0.08 |
| M5 Core Pin | 7.16 | 6.35 | 27.50 | 8.06 | 0.09 |
| Name | Diameter (mm) | Height (mm) | Shear Stress (MPa) | ||
|---|---|---|---|---|---|
| M2 Core Pin | 2.63 | 3.18 | 20.22 | 3.69 | 0.14 |
| M3 Core Pin | 3.75 | 3.56 | 13.87 | 4.08 | 0.14 |
| M3.5 Core Pin | 4.54 | 3.81 | 15.63 | 5.33 | 0.18 |
| M4 Core Pin | 5.38 | 4.7 | 23.58 | 7.50 | 0.08 |
| M5 Core Pin | 6.16 | 6.35 | 37.15 | 9.37 | 0.09 |
| Shot Number | M5 Hole Depth on the Part | Intended Value (mm) | Deviation (mm) |
|---|---|---|---|
| 1 | 6.33 | 6.35 | −0.2 |
| 2 | 6.33 | 6.35 | −0.2 |
| 3 | 6.32 | 6.35 | −0.3 |
| 4 | 6.40 | 6.35 | +0.05 |
| 5 | 6.38 | 6.35 | +0.03 |
| 6 | 3.89 | 6.35 | −2.46 |
| 7 | 2.85 | 6.35 | −3.5 |
| 8 | 2.45 | 6.35 | −3.9 |
| 9 | 1.07 | 6.35 | −5.38 |
| 10 | 0.98 | 6.35 | −5.37 |
| 11 | 0.90 | 6.35 | −5.45 |
| 12 | 0.42 | 6.35 | −5.93 |
| Indicative Comparison for Parts That Fit within a 100 × 100 mm Footprint | Aluminium/Steel Tooling | Polymer 3DIM Tooling | Metal 3DIM |
|---|---|---|---|
| Lead time | 2 weeks | 1 day | 2 days |
| Cost of producing the tool, materials and machine costs (NZD indicative) | $500–$3000 Requires highly skilled labour | $1000 Easy to implement | $5000 Easy to produce tool, but requires specialized equipment and labour for post-processing |
| Dependency on complexity of geometry | HIGH: Cost and time highly dependent on complexity | NONE: Cost and time not dependent on complexity | NONE: Cost and time not dependent on complexity |
| Tool Life | 10,000 shots Low dependency on injection material | 0–100 shots High dependency on injection material | 5000 shots Low dependency on injection material |
| Cycle time | 1 s (conformal cooling is expensive to incorporate) | 30 s (conformal cooling ineffective) | 0.5 s (conformal cooling easy to include) |
| 1 | Moulding Stage | Cause | Failure Mode | Status |
|---|---|---|---|---|
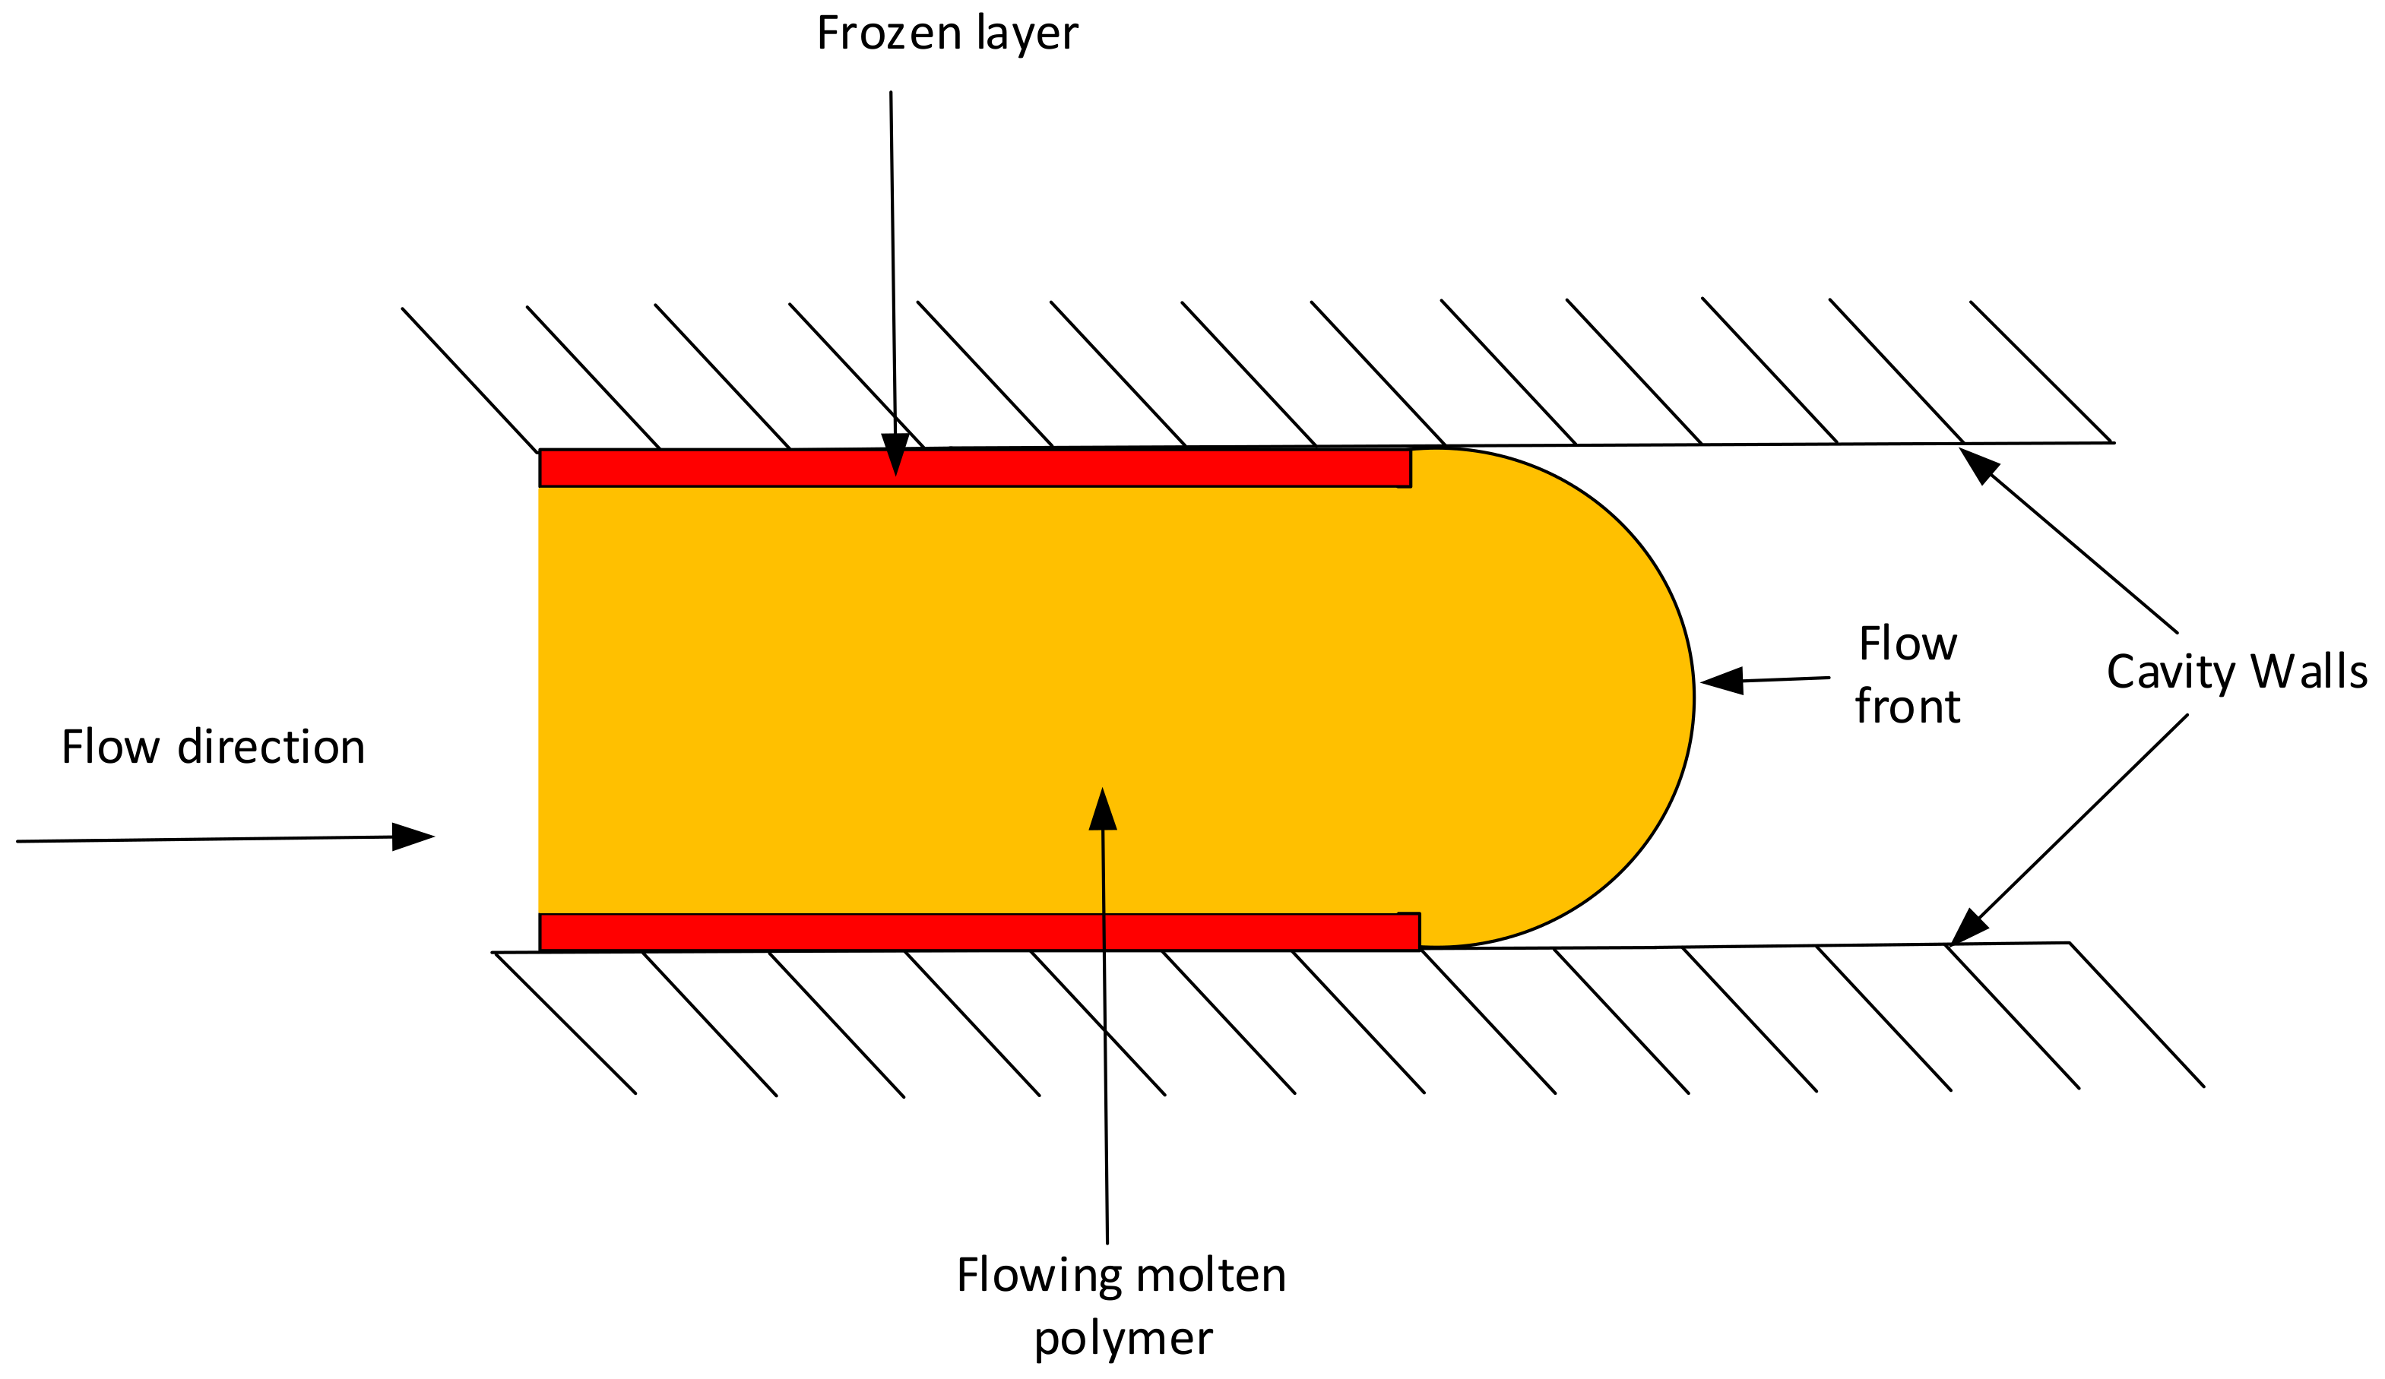
| 2 | Injection Stage | Flow pressure exerted by the incoming molten polymer. | Bending Failure | Current Work (Not a critical failure, unless wrong process setting used) |
| Shear Failure | ||||
| 3 | Packing Stage | Flow pressure exerted by molten polymer and heat transfer between molten polymer and 3DIM. | Thermal degradation | |
| 4 | Cooling Stage | Heat transfer between molten polymer and 3DIM (Shrinkage of part due to cooling and expansion | Stress due to interference | Future Work |
| 5 | Ejection Stage | Surface roughness due to layered process of 3D printing. Shrinkage of part and expansion of tool. Inadequate draft angles | Edge Failure | Future Work |
| Ejection Failure |
Publisher’s Note: MDPI stays neutral with regard to jurisdictional claims in published maps and institutional affiliations. |
© 2021 by the authors. Licensee MDPI, Basel, Switzerland. This article is an open access article distributed under the terms and conditions of the Creative Commons Attribution (CC BY) license (https://creativecommons.org/licenses/by/4.0/).
Share and Cite
Bagalkot, A.; Pons, D.; Symons, D.; Clucas, D. Analysis of Raised Feature Failures on 3D Printed Injection Moulds. Polymers 2021, 13, 1541. https://doi.org/10.3390/polym13101541
Bagalkot A, Pons D, Symons D, Clucas D. Analysis of Raised Feature Failures on 3D Printed Injection Moulds. Polymers. 2021; 13(10):1541. https://doi.org/10.3390/polym13101541
Chicago/Turabian StyleBagalkot, Anurag, Dirk Pons, Digby Symons, and Don Clucas. 2021. "Analysis of Raised Feature Failures on 3D Printed Injection Moulds" Polymers 13, no. 10: 1541. https://doi.org/10.3390/polym13101541
APA StyleBagalkot, A., Pons, D., Symons, D., & Clucas, D. (2021). Analysis of Raised Feature Failures on 3D Printed Injection Moulds. Polymers, 13(10), 1541. https://doi.org/10.3390/polym13101541