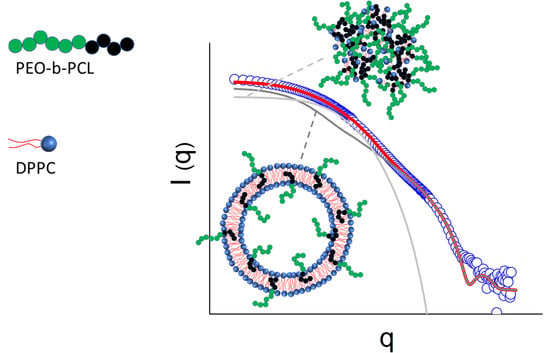
Formation of Uni-Lamellar Vesicles in Mixtures of DPPC with PEO-b-PCL Amphiphilic Diblock Copolymers

 ,
,  ,
, 
 and
and 
Abstract
:
1. Introduction
2. Materials and Methods
2.1. Materials
2.2. Sample Preparation
2.3. Small Angle Neutron Scattering Experiments
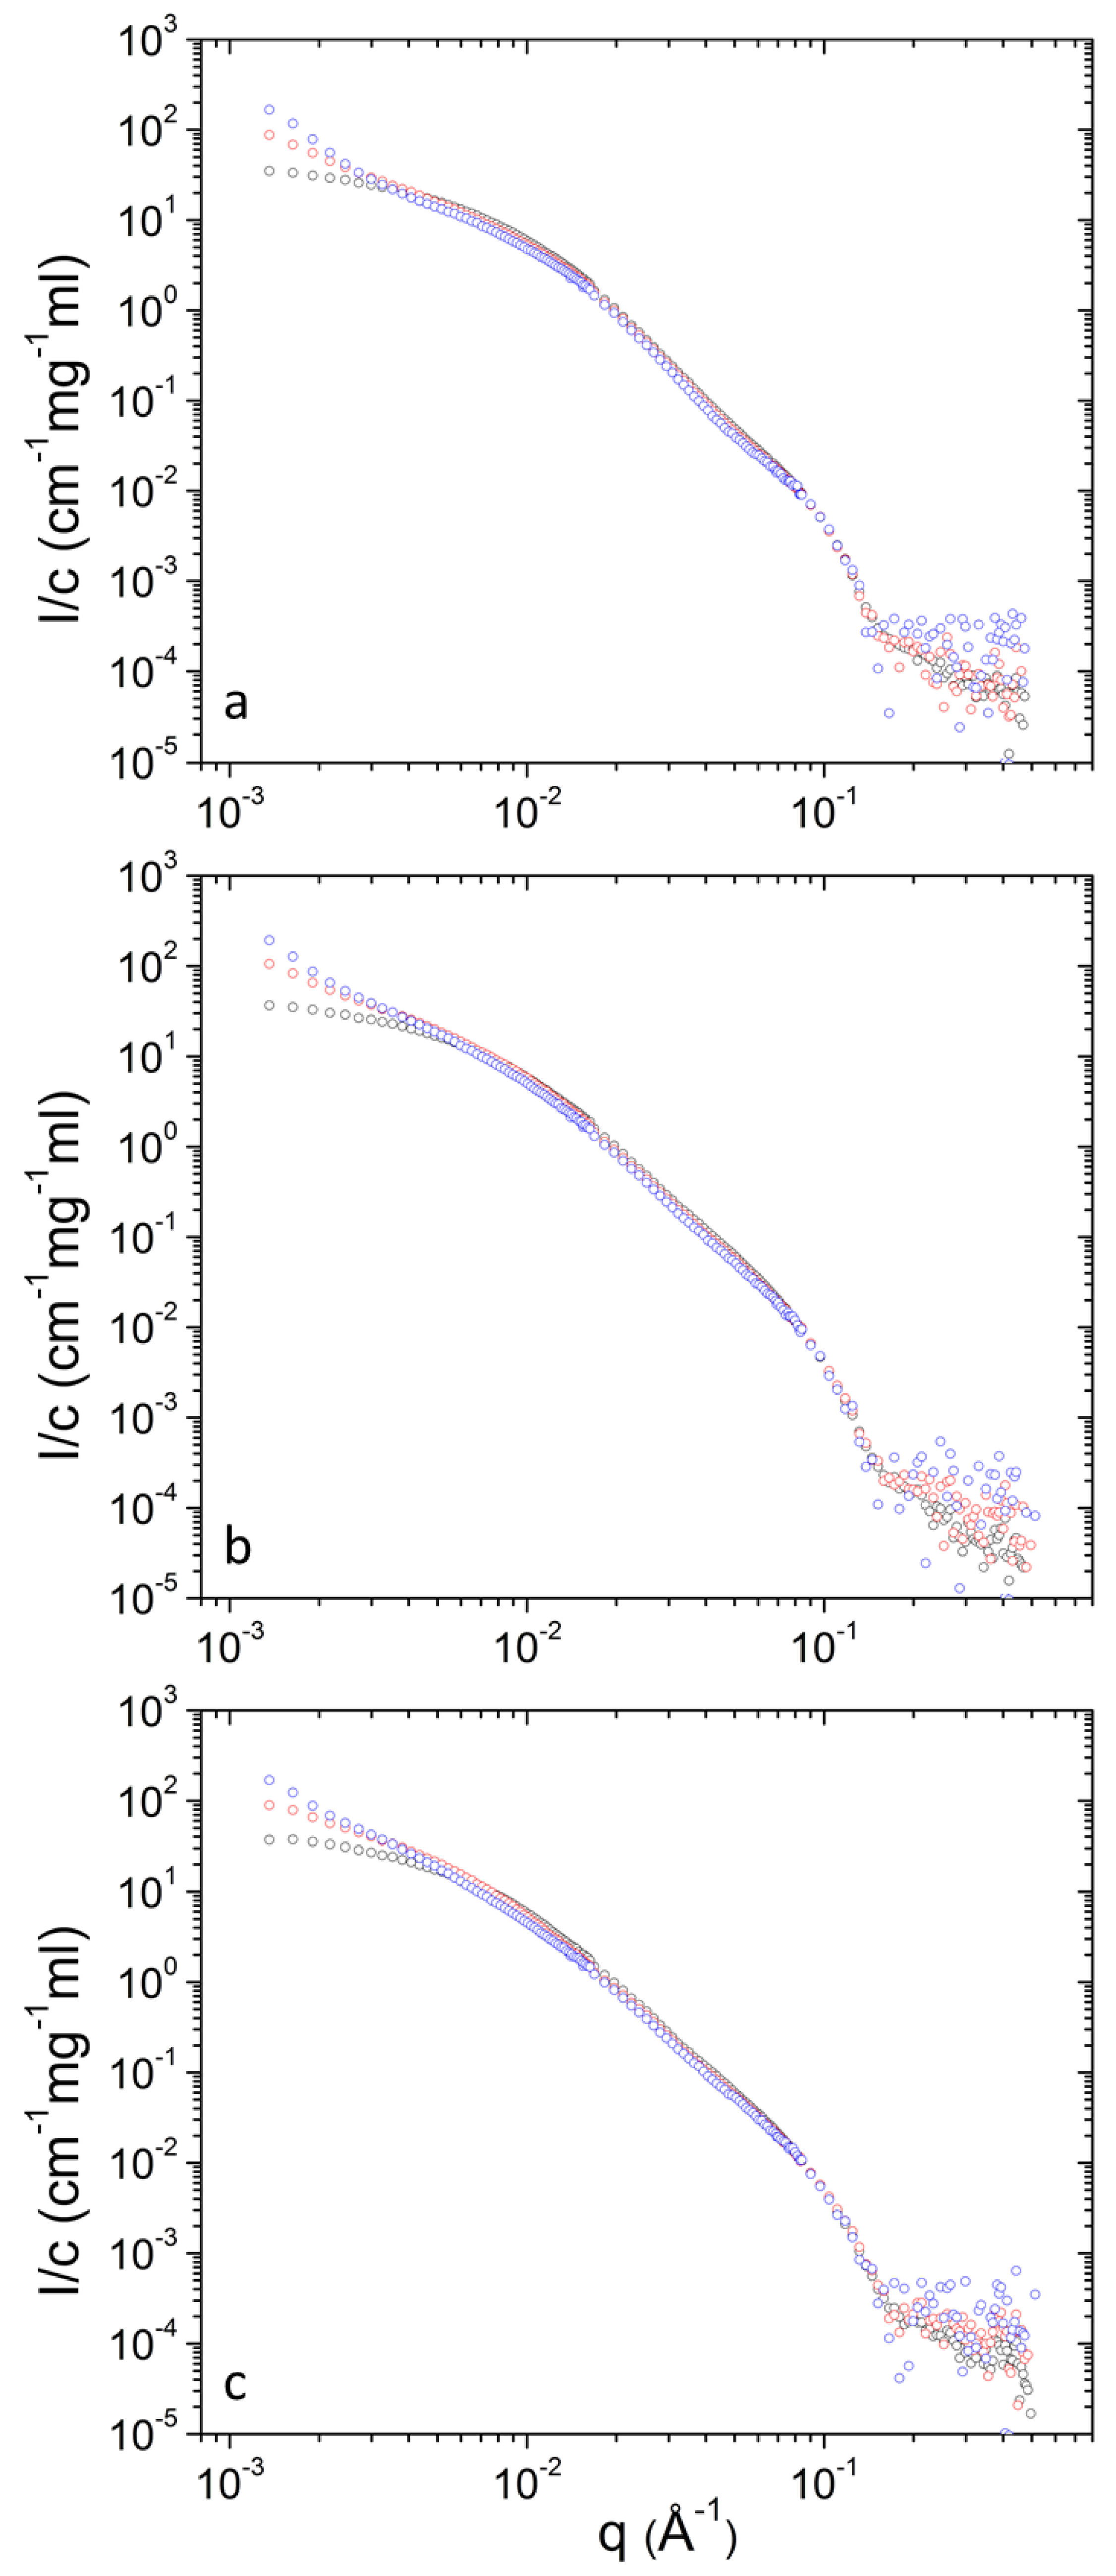
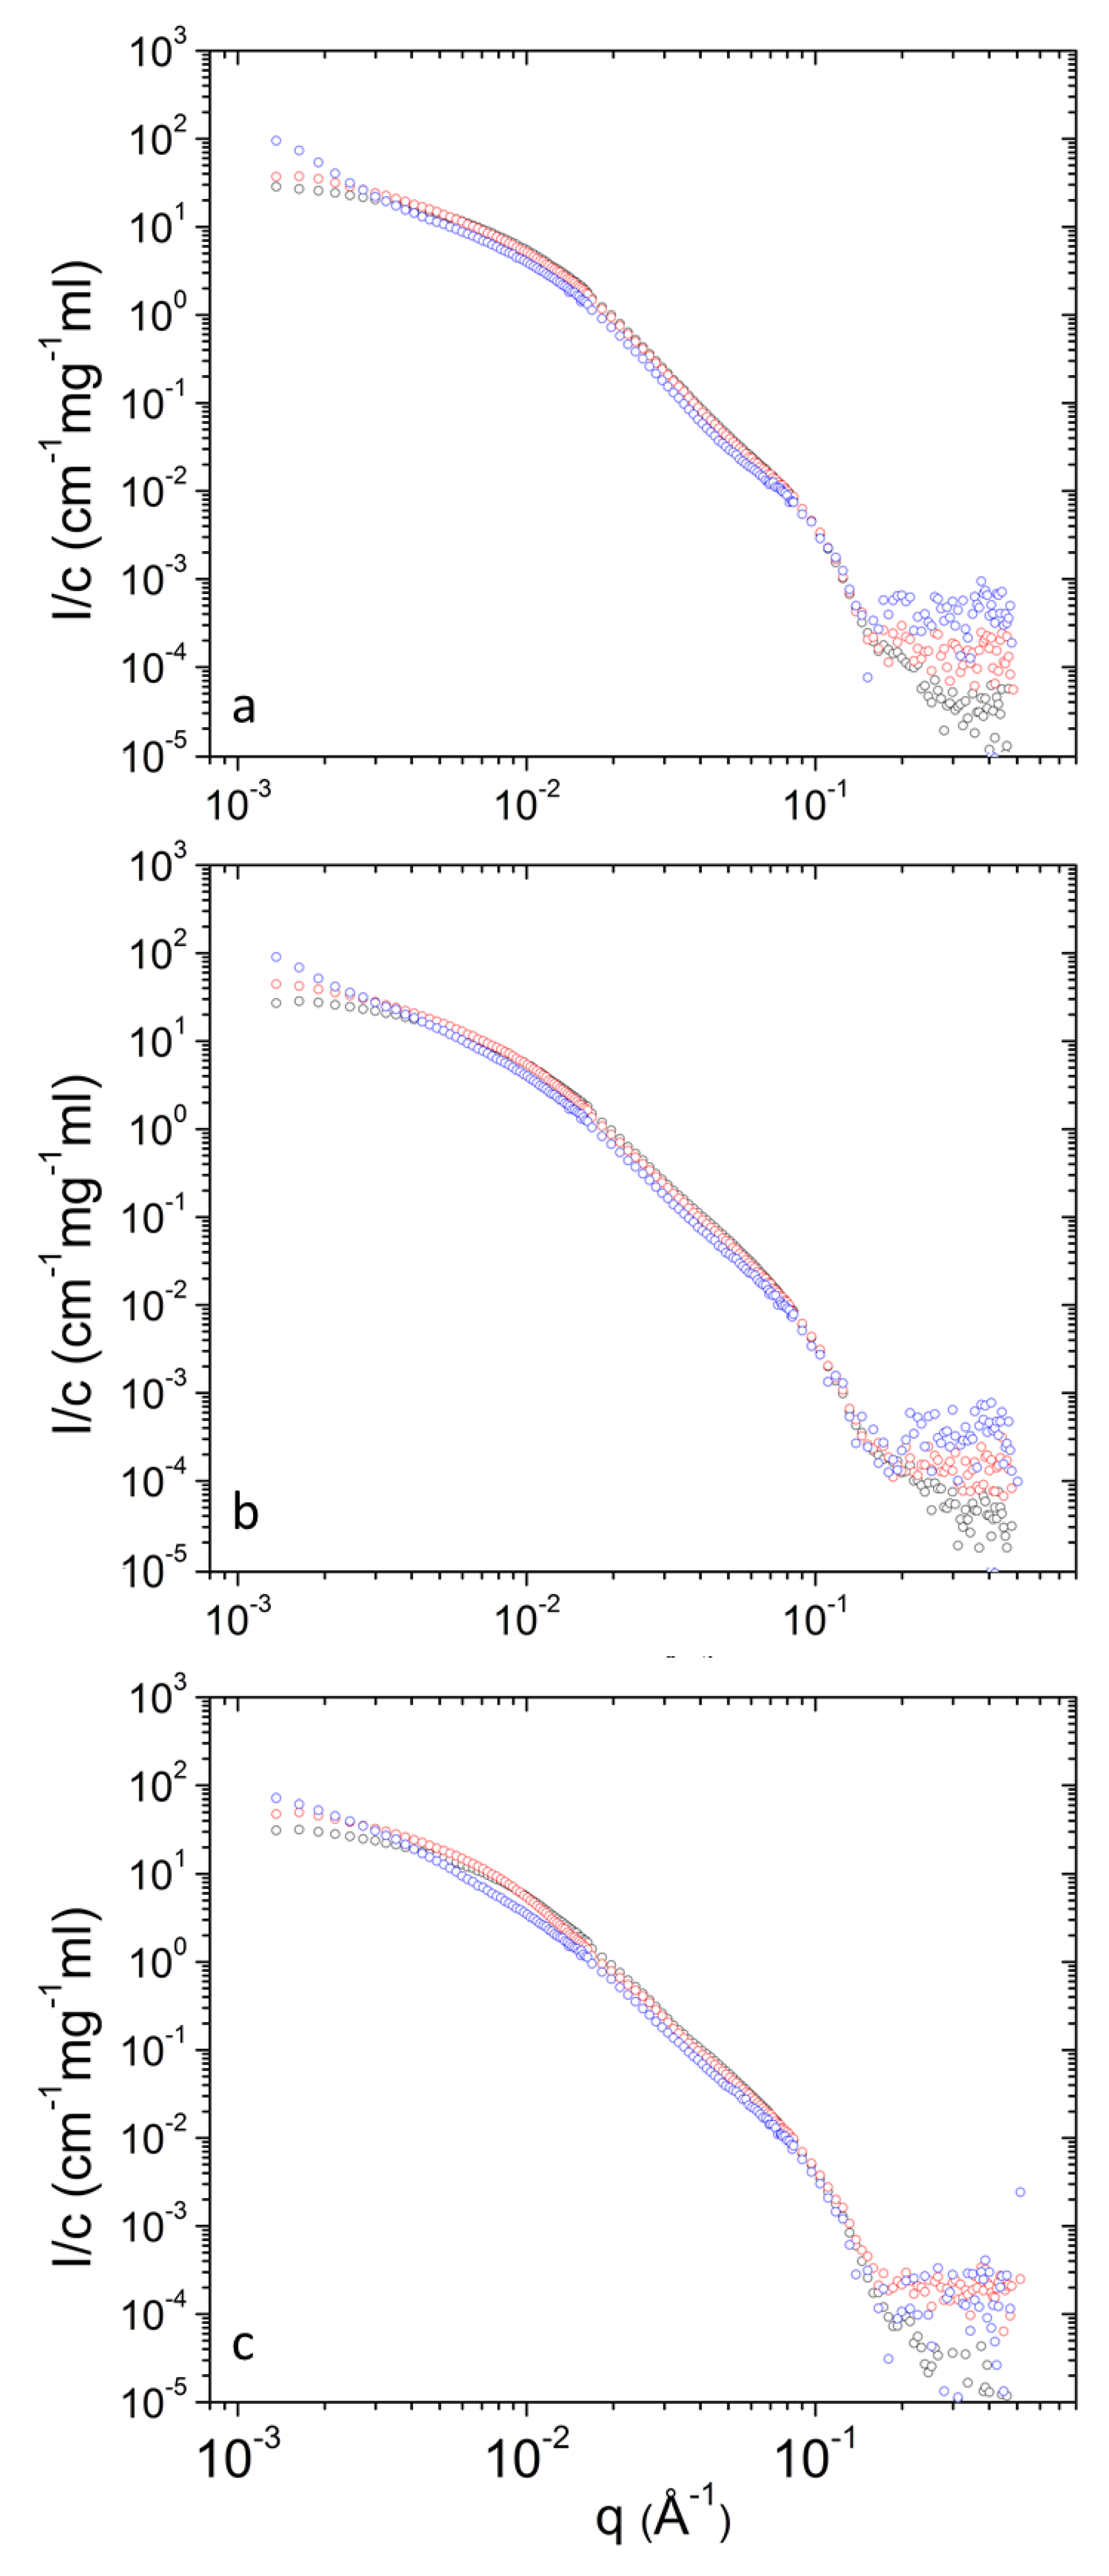
3. Results and Discussion
4. Conclusions
Supplementary Materials
Author Contributions
Funding
Acknowledgments
Conflicts of Interest
References
- Qhattal, H.S.S.; Hye, T.; Alali, A.; Liu, X. Hyaluronan polymer length, grafting density, and surface poly(ethylene glycol) coating influence in vivo circulation and tumor targeting of hyaluronan-grafted liposomes. ACS Nano 2014, 8, 5423–5440. [Google Scholar] [CrossRef] [PubMed]
- Kanamala, M.; Palmer, B.D.; Wilson, W.R.; Wu, Z. Characterization of a smart pH-cleavable PEG polymer towards the development of dual pH-sensitive liposomes. Int. J. Pharm. 2018, 548, 288–296. [Google Scholar] [CrossRef] [PubMed]
- Aoki, I.; Yoneyama, M.; Hirose, J.; Minemoto, Y.; Koyama, T.; Kokuryo, D.; Bakalova, R.; Murayama, S.; Saga, T.; Aoshima, S.; et al. Thermoactivatable polymer-grafted liposomes for low-invasive image-guided chemotherapy. Transl. Res. 2015, 166, 660–673. [Google Scholar] [CrossRef] [PubMed]
- Stark, B.; Debbage, P.; Andreae, F.; Mosgoeller, W.; Prassl, R. Association of vasoactive intestinal peptide with polymer-grafted liposomes: Structural aspects for pulmonary delivery. Biochim. Biophys. Acta Biomembr. 2007, 1768, 705–714. [Google Scholar] [CrossRef] [Green Version]
- Park, S.-I.; Lee, E.-O.; Yang, H.-M.; Park, C.W.; Kim, J.-D. Polymer-hybridized liposomes of poly(amino acid) derivatives as transepidermal carriers. Colloids Surf. B Biointerface 2013, 110, 333–338. [Google Scholar] [CrossRef]
- Immordino, M.L.; Dosio, F.; Cattel, L. Stealth liposomes: Review of the basic science, rationale, and clinical applications, existing and potential. Int. J. Nanomed. 2006, 1, 297–315. [Google Scholar]
- Allen, T.M.; Cullis, P.R. Liposomal drug delivery systems: From concept to clinical applications. Adv. Drug Deliv. Rev. 2013, 65, 36–48. [Google Scholar] [CrossRef]
- Kristensen, K.; Engel, T.B.; Stensballe, A.; Simonsen, J.B.; Andresen, T.L. The hard protein corona of stealth liposomes is sparse. J. Control Release 2019, 307, 1–15. [Google Scholar] [CrossRef]
- Papageorgiou, F.; Pippa, N.; Naziris, N.; Demetzos, C. Physicochemical study of the protein–liposome interactions: Influence of liposome composition and concentration on protein binding. J. Liposome Res. 2019, 29, 313–321. [Google Scholar] [CrossRef]
- Dash, T.K.; Konkimalla, V.B. Poly-є-caprolactone based formulations for drug delivery and tissue engineering: A review. J. Control Release 2012, 158, 15–33. [Google Scholar] [CrossRef]
- Chang, L.; Deng, L.; Wang, W.; Lv, Z.; Hu, F.; Dong, A.; Zhang, J. Poly(ethyleneglycol)-b-Poly(ε-caprolactone-co-γ-hydroxyl-ε- caprolactone) Bearing Pendant Hydroxyl Groups as Nanocarriers for Doxorubicin Delivery. Biomacromolecules 2012, 13, 3301–3310. [Google Scholar] [CrossRef] [PubMed]
- Wang, Z.; Wei, Y.; Fang, G.; Hong, D.; An, L.; Jiao, T.; Shi, Y.; Zang, A. Colorectal cancer combination therapy using drug and gene co-delivered, targeted poly(ethylene glycol)-ε-poly(caprolactone) nanocarriers. Drug Des. Devel. 2018, 12, 3171–3180. [Google Scholar] [CrossRef] [PubMed] [Green Version]
- Pippa, N.; Kaditi, E.; Pispas, S.; Demetzos, C. PEO-b-PCL–DPPC chimeric nanocarriers: Self-assembly aspects in aqueous and biological media and drug incorporation. Soft Matter 2013, 9, 4073–4082. [Google Scholar] [CrossRef]
- Pippa, N.; Naziris, N.; Stellas, D.; Massala, C.; Zouliati, K.; Pispas, S.; Demetzos, C.; Forys, A.; Marcinkowski, A.; Trzebicka, B. PEO-b-PCL grafted niosomes: The cooperativilty of amphiphilic components and their properties In Vitro and In Vivo. Colloids Surf. B Biointerfaces 2019, 177, 338–345. [Google Scholar] [CrossRef] [PubMed]
- Drazenovic, J.; Wang, H.; Roth, K.; Zhang, J.; Ahmed, S.; Chen, Y.; Bothun, G.; Wunder, S.L. Effect of lamellarity and size on calorimetric phase transitions in single component phosphatidylcholine vesicles. Biochim. Biophys. Acta Biomembr. 2015, 1848, 532–543. [Google Scholar] [CrossRef] [PubMed] [Green Version]
- Nele, V.; Holme, M.N.; Kauscher, U.; Thomas, M.R.; Doutch, J.J.; Stevens, M.M. Effect of formulation method, lipid composition, and PEGylation on vesicle lamellarity: A small-angle neutron scattering study. Langmuir 2019, 35, 6064–6074. [Google Scholar] [CrossRef] [Green Version]
- Papagiannopoulos, A.; Pippa, N.; Demetzos, C.; Pispas, S.; Radulescu, A. Lamellarity and size distributions in mixed DPPC/amphiphilic poly(2-oxazoline) gradient copolymer vesicles and their temperature response. Chem. Phys. Lipids 2020. [Google Scholar] [CrossRef]
- Ruggeri, F.; Zhang, F.; Lind, T.; Bruce, E.D.; Lau, B.L.T.; Cárdenas, M. Non-specific interactions between soluble proteins and lipids induce irreversible changes in the properties of lipid bilayers. Soft Matter 2013, 9, 4219–4226. [Google Scholar] [CrossRef] [Green Version]
- Dao, T.P.T.; Brûlet, A.; Fernandes, F.; Er-Rafik, M.; Ferji, K.; Schweins, R.; Chapel, J.P.; Fedorov, A.; Schmutz, M.; Prieto, M.; et al. Mixing block copolymers with phospholipids at the nanoscale: From hybrid polymer/lipid wormlike micelles to vesicles presenting lipid nanodomains. Langmuir 2017, 33, 1705–1715. [Google Scholar] [CrossRef] [Green Version]
- Heberle, F.A.; Petruzielo, R.S.; Pan, J.; Drazba, P.; Kučerka, N.; Standaert, R.F.; Feigenson, G.W.; Katsaras, J. Bilayer thickness mismatch controls domain size in model membranes. J. Am. Chem. Soc. 2013, 135, 6853–6859. [Google Scholar] [CrossRef]
- Papagiannopoulos, A. Chapter 10—Small-angle neutron scattering (SANS). In Microscopy Methods in Nanomaterials Characterization; Thomas, S., Thomas, R., Zachariah, A.K., Mishra, R.K., Eds.; Elsevier: Amsterdam, The Netherlands, 2017; pp. 339–361. [Google Scholar] [CrossRef]
- Di Cola, E.; Grillo, I.; Ristori, S. Small angle X-ray and neutron scattering: Powerful tools for studying the structure of drug-loaded liposomes. Pharmaceutics 2016, 8, 10. [Google Scholar] [CrossRef] [PubMed]
- Meier, M.A.R.; Aerts, S.N.H.; Staal, B.B.P.; Rasa, M.; Schubert, U.S. PEO-b-PCL Block copolymers: Synthesis, detailed characterization, and selected micellar drug encapsulation behavior. Macromol. Rapid Commun. 2005, 26, 1918–1924. [Google Scholar] [CrossRef]
- Koutsioubas, A. Combined coarse-grained molecular dynamics and neutron reflectivity characterization of supported lipid membranes. J. Phys. Chem. B 2016, 120, 11474–11483. [Google Scholar] [CrossRef] [PubMed]
- Nagle, J.F.; Tristram-Nagle, S. Structure of lipid bilayers. Biochim Biophys Acta 2000, 1469, 159–195. [Google Scholar] [CrossRef] [Green Version]
- Hirai, M.; Iwase, H.; Hayakawa, T.; Koizumi, M.; Takahashi, H. Determination of asymmetric structure of ganglioside-DPPC mixed vesicle using SANS, SAXS, and DLS. Biophys. J. 2003, 85, 1600–1610. [Google Scholar] [CrossRef] [Green Version]
- Marrink, S.J.; Risselada, J.; Mark, A.E. Simulation of gel phase formation and melting in lipid bilayers using a coarse grained model. Chem. Phys. Lipids 2005, 135, 223–244. [Google Scholar] [CrossRef] [Green Version]
- Radulescu, A.; Szekely, N.K.; Polachowski, S.; Leyendecker, M.; Amann, M.; Buitenhuis, J.; Drochner, M.; Engels, R.; Hanslik, R.; Kemmerling, G.; et al. Tuning the instrument resolution using chopper and time of flight at the small-angle neutron scattering diffractometer KWS-2. J. Appl. Crystallogr. 2015, 48, 1849–1859. [Google Scholar] [CrossRef]
- Vad, T.; Sager, W.F.C.; Zhang, J.; Buitenhuis, J.; Radulescu, A. Experimental determination of resolution function parameters from small-angle neutron scattering data of a colloidal SiO2 dispersion. J. Appl. Crystallogr. 2010, 43, 686–692. [Google Scholar] [CrossRef]
- Barker, J.G.; Pedersen, J.S. Instrumental smearing effects in radially symmetric small-angle neutron scattering by numerical and analytical methods. J. Appl. Crystallogr. 1995, 28, 105–114. [Google Scholar] [CrossRef]
- Kotlarchyk, M.; Stephens, R.B.; Huang, J.S. Study of Schultz distribution to model polydispersity of microemulsion droplets. J. Phys. Chem. 1988, 92, 1533–1538. [Google Scholar] [CrossRef]
- Vanderbilt, D.; Louie, S.G. A Monte carlo simulated annealing approach to optimization over continuous variables. J. Comput. Phys. 1984, 56, 259–271. [Google Scholar] [CrossRef]
- Goodman, J.; Weare, J. Ensemble samplers with affine invariance. Commun. Appl. Math. Comput. Sci. 2010, 5, 65–80. [Google Scholar] [CrossRef]
- Winslow, S.W.; Shcherbakov-Wu, W.; Liu, Y.; Tisdale, W.A.; Swan, J.W. Characterization of colloidal nanocrystal surface structure using small angle neutron scattering and efficient Bayesian parameter estimation. J. Chem. Phys. 2019, 150, 244702. [Google Scholar] [CrossRef] [PubMed]
- Cornerplot. Available online: https://nl.mathworks.com/matlabcentral/fileexchange/49567-cornerplot (accessed on 18 December 2020).
- Frielinghaus, H. Small-angle scattering model for multilamellar vesicles. Phys. Rev. E 2007, 76, 051603. [Google Scholar] [CrossRef] [PubMed] [Green Version]
- Higgins, J.; Benoit, H. Polymers and Neutron Scattering; Oxford University Press: Oxford, UK, 1994. [Google Scholar]
- Pedersen, J.S. Analysis of small-angle scattering data from colloids and polymer solutions: Modeling and least-squares fitting. Adv. Colloid Interface Sci. 1997, 70, 171–210. [Google Scholar] [CrossRef]
- Beaucage, G. Approximations leading to a unified exponential/power-law approach to small-angle scattering. J. Appl. Crystallogr. 1995, 28, 717–728. [Google Scholar] [CrossRef]
- Hammouda, B. Analysis of the Beaucage model. J. Appl. Crystallogr. 2010, 43, 1474–1478. [Google Scholar] [CrossRef]
- Jung, H.T.; Coldren, B.; Zasadzinski, J.A.; Iampietro, D.J.; Kaler, E.W. The origins of stability of spontaneous vesicles. Proc. Natl. Acad. Sci. USA 2001, 98, 1353–1357. [Google Scholar] [CrossRef]
- Lee, J.-H.; Agarwal, V.; Bose, A.; Payne, G.F.; Raghavan, S.R. Transition from unilamellar to bilamellar vesicles induced by an amphiphilic biopolymer. Phys. Rev. Lett. 2006, 96, 048102. [Google Scholar] [CrossRef] [Green Version]
- Uhríková, D.; Kučerka, N.; Teixeira, J.; Gordeliy, V.; Balgavý, P. Structural changes in dipalmitoylphosphatidylcholine bilayer promoted by Ca2+ ions: A small-angle neutron scattering study. Chem. Phys. Lipids 2008, 155, 80–89. [Google Scholar] [CrossRef]
- Belička, M.; Gerelli, Y.; Kučerka, N.; Fragneto, G. The component group structure of DPPC bilayers obtained by specular neutron reflectometry. Soft Matter 2015, 11, 6275–6283. [Google Scholar] [CrossRef] [PubMed]
- Kučerka, N.; Nagle, J.F.; Feller, S.E.; Balgavý, P. Models to analyze small-angle neutron scattering from unilamellar lipid vesicles. Phys. Rev. E 2004, 69, 051903. [Google Scholar] [CrossRef] [PubMed] [Green Version]
- Heberle, F.A.; Anghel, V.N.P.; Katsaras, J. Scattering from phase-separated vesicles. I. An analytical form factor for multiple static domains. J. Appl. Crystallogr. 2015, 48, 1391–1404. [Google Scholar] [CrossRef]
- Gallová, J.; Uhríková, D.; Kučerka, N.; Doktorovová, S.; Funari, S.S.; Teixeira, J.; Balgavý, P. The effects of cholesterol and β-sitosterol on the structure of saturated diacylphosphatidylcholine bilayers. Eur. Biophys. J. 2011, 40, 153–163. [Google Scholar] [CrossRef] [PubMed] [Green Version]
- Pippa, N.; Perinelli, D.R.; Pispas, S.; Bonacucina, G.; Demetzos, C.; Forys, A.; Trzebicka, B. Studying the colloidal behavior of chimeric liposomes by cryo-TEM, micro-differential scanning calorimetry and high-resolution ultrasound spectroscopy. Colloids Surf. A Physicochem. Eng. Asp. 2018, 555, 539–547. [Google Scholar] [CrossRef]
- Komorowski, K.; Salditt, A.; Xu, Y.; Yavuz, H.; Brennich, M.; Jahn, R.; Salditt, T. Vesicle Adhesion and Fusion Studied by Small-Angle X-Ray Scattering. Biophys. J. 2018, 114, 1908–1920. [Google Scholar] [CrossRef] [PubMed] [Green Version]
- Helfrich, W. Size distributions of vesicles: The role of the effective rigidity of membranes. J. Phys. Fr. 1986, 47, 321–329. [Google Scholar] [CrossRef]
- Huang, C.; Quinn, D.; Sadovsky, Y.; Suresh, S.; Hsia, K.J. Formation and size distribution of self-assembled vesicles. Proc. Natl. Acad. Sci. USA 2017, 114, 2910–2915. [Google Scholar] [CrossRef] [Green Version]
- Beaucage, G. Small-Angle Scattering from Polymeric Mass Fractals of Arbitrary Mass-Fractal Dimension. J. Appl. Crystallogr. 1996, 29, 134–146. [Google Scholar] [CrossRef] [Green Version]
- Schmidt, P. Small-angle scattering studies of disordered, porous and fractal systems. J. Appl. Crystallogr. 1991, 24, 414–435. [Google Scholar] [CrossRef]
- Schober, P.; Boer, C.; Schwarte, L.A. Correlation coefficients: Appropriate use and interpretation. Anesth. Analg. 2018, 126, 1763–1768. [Google Scholar] [CrossRef] [PubMed]


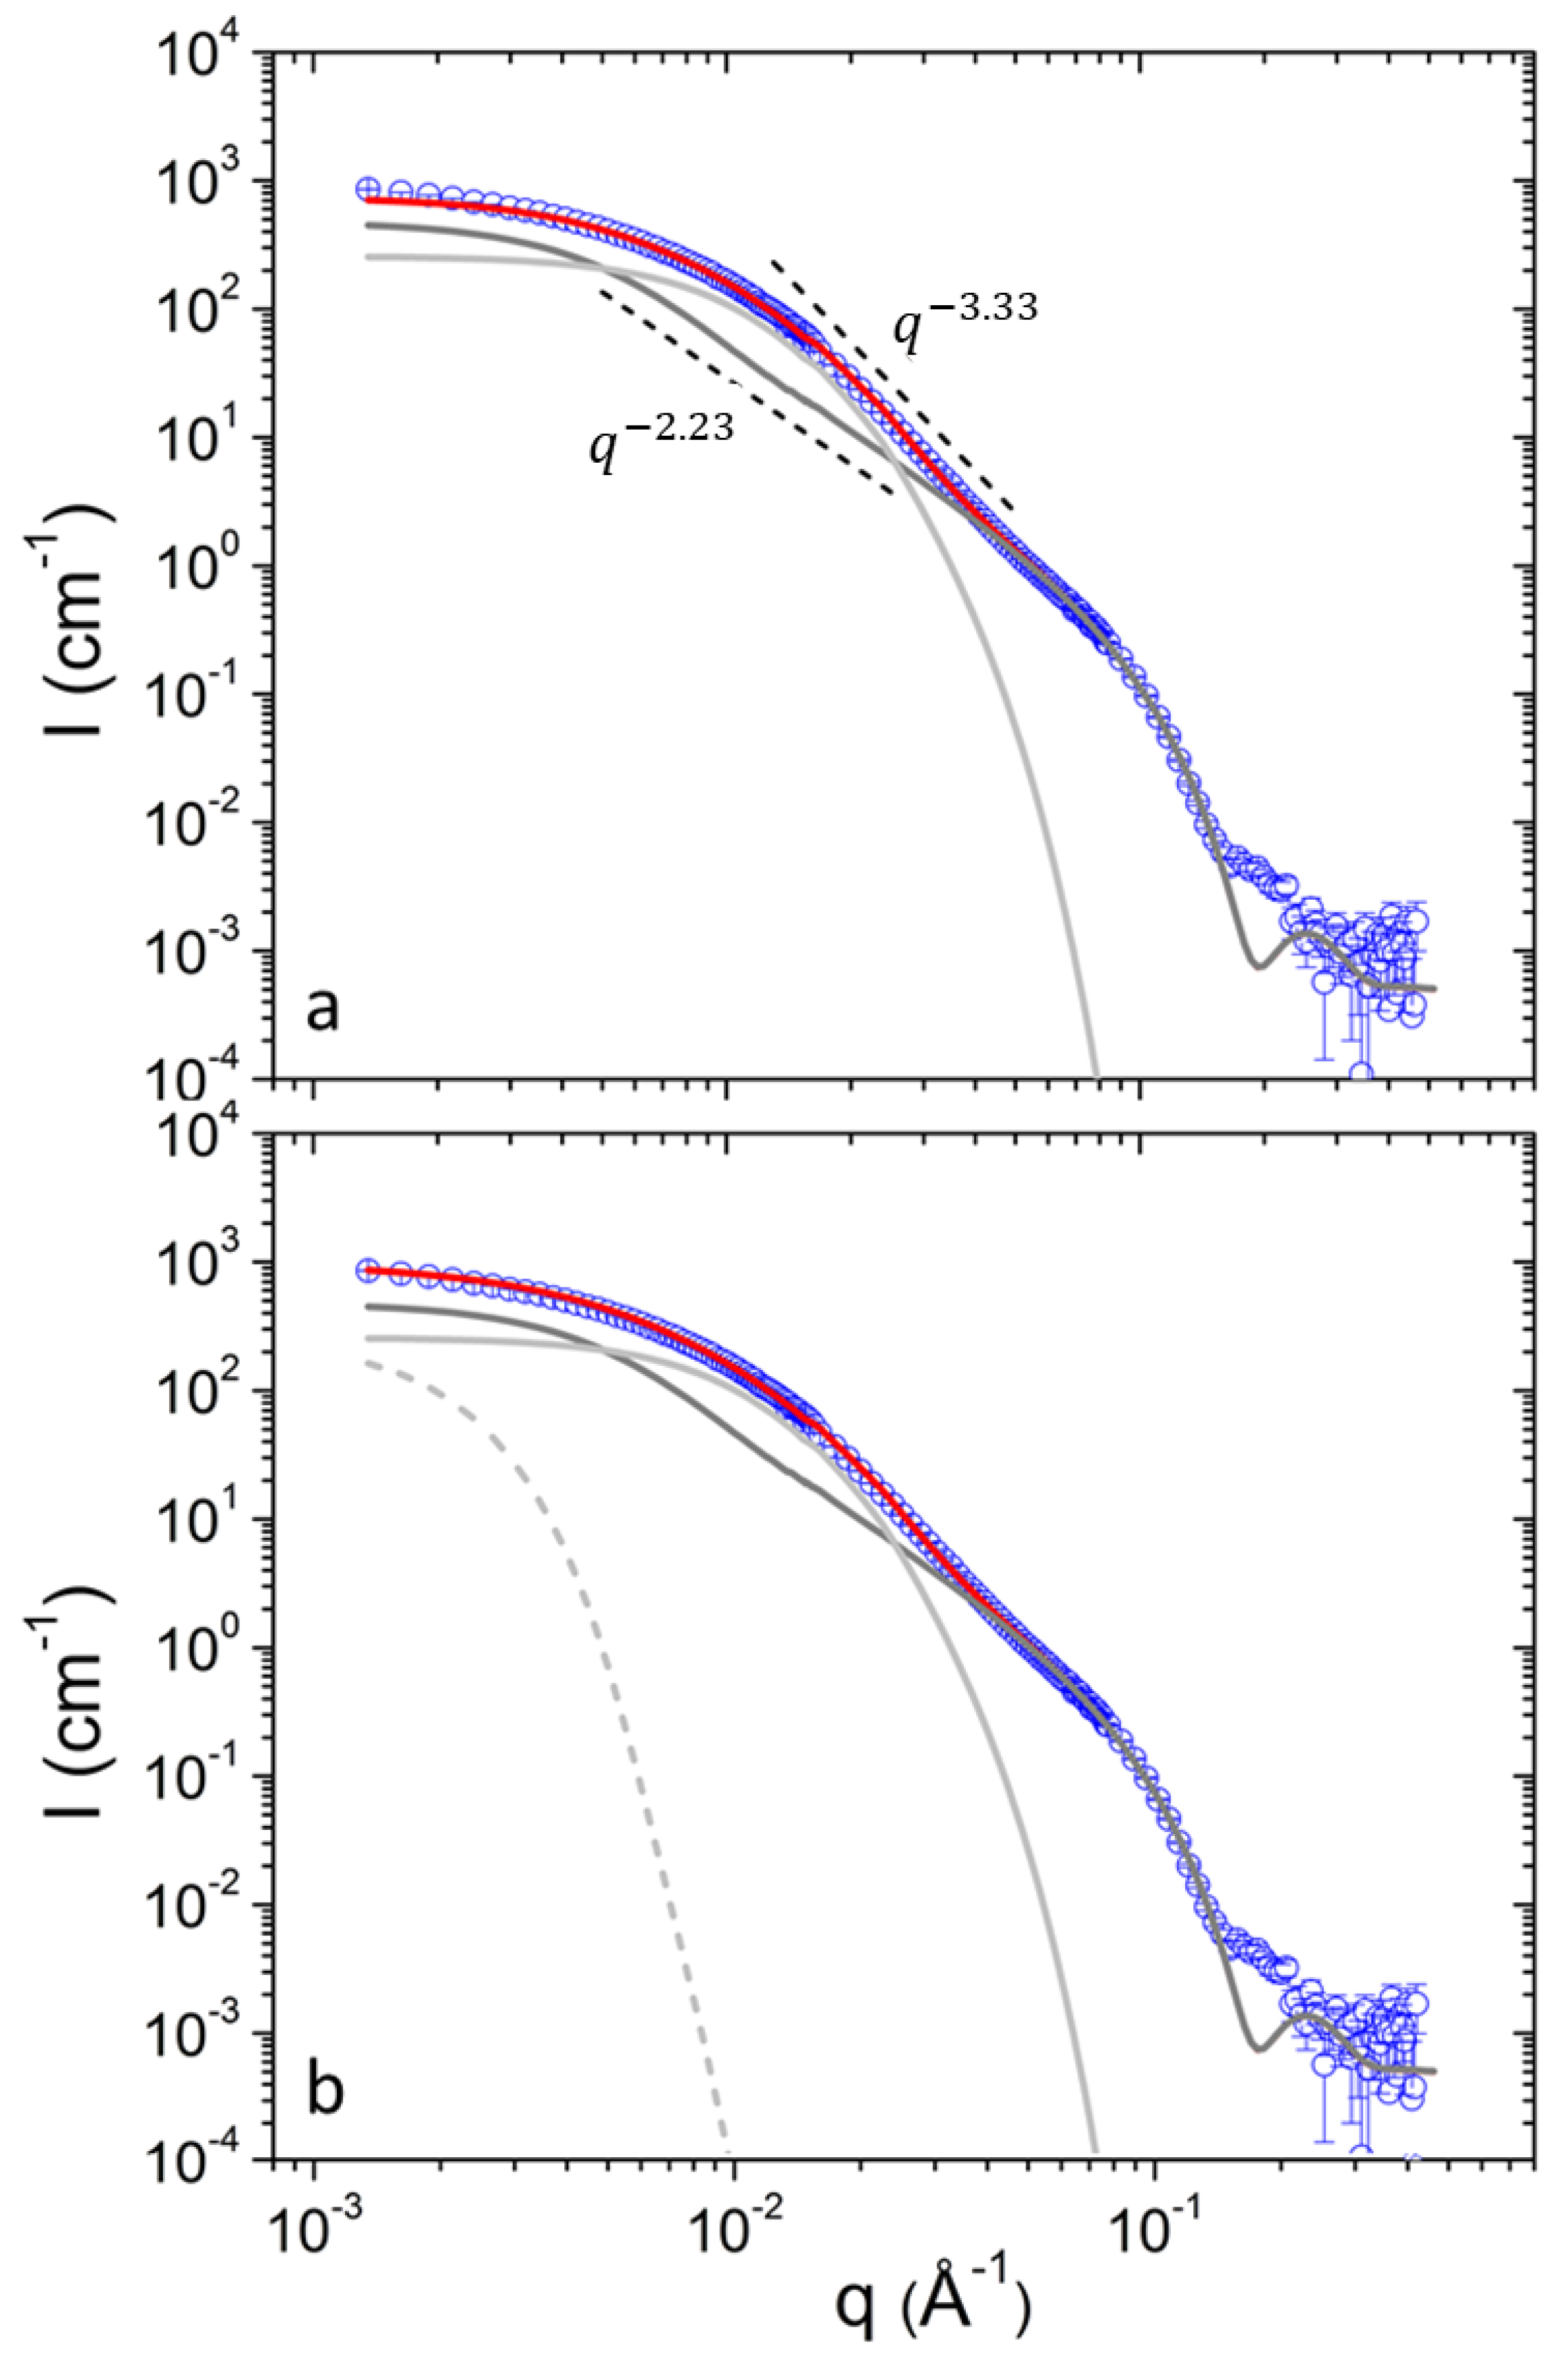
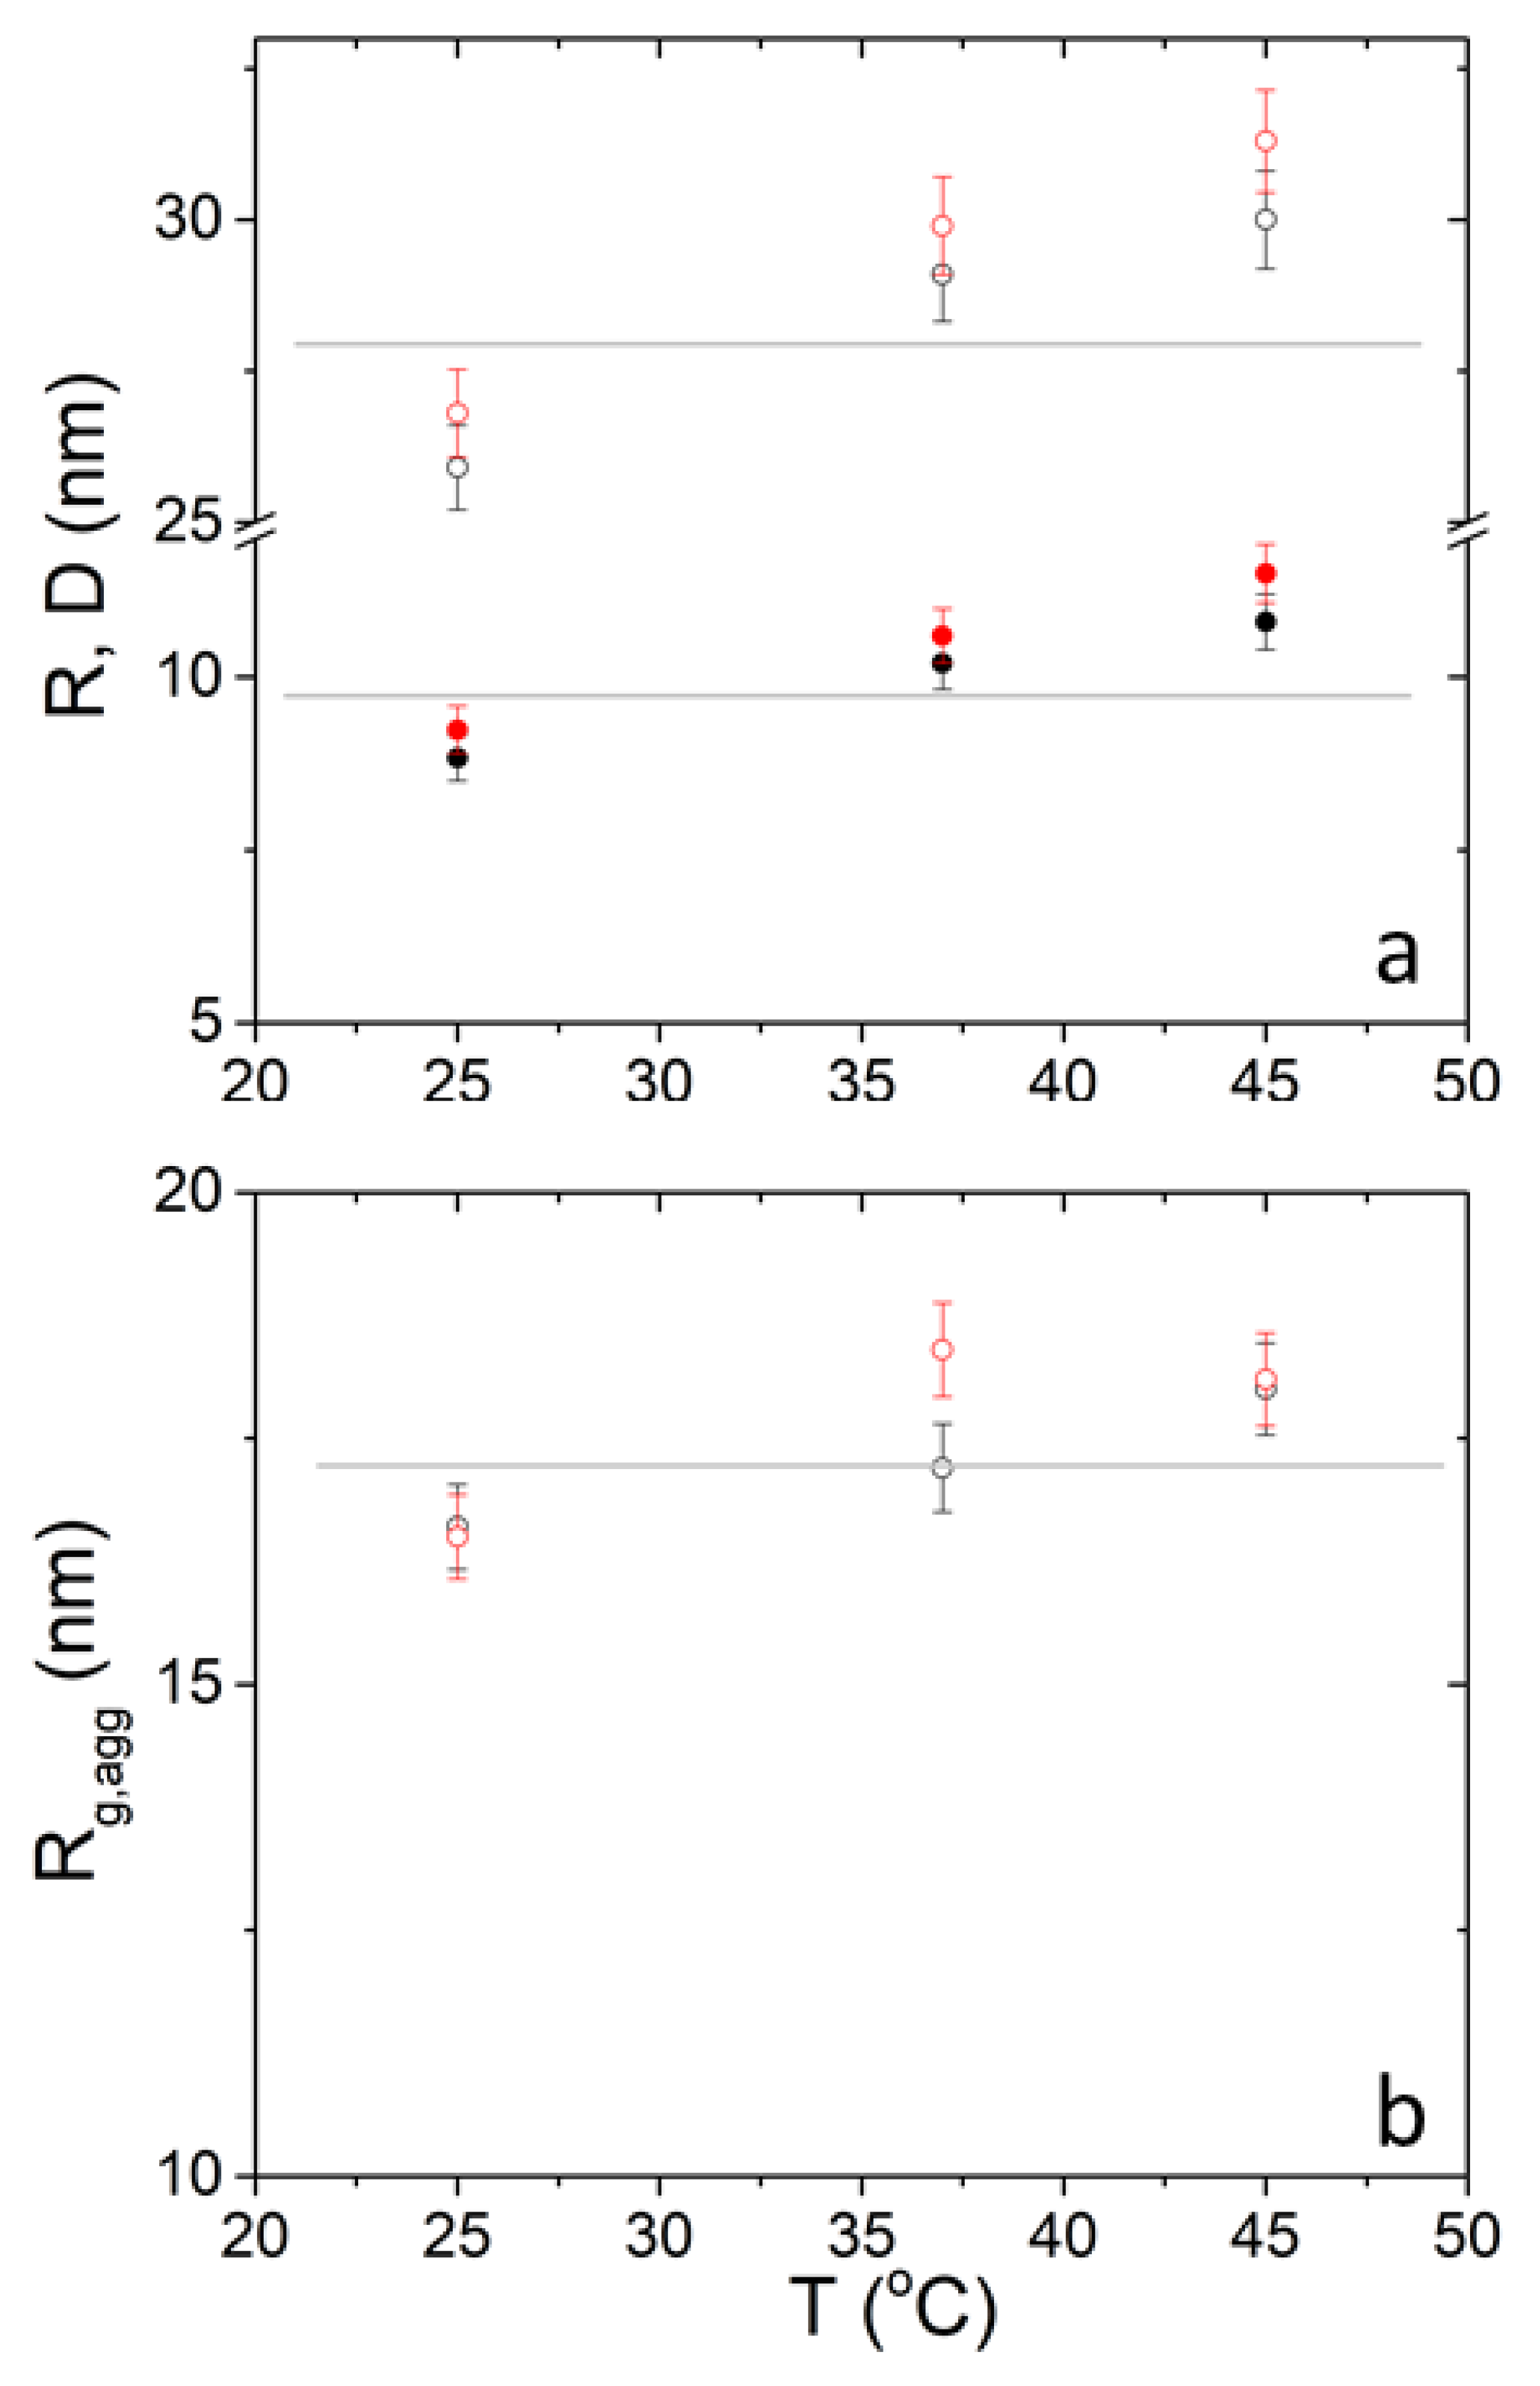
| T (°C) | 25 | 37 | 45 | |||||||
|---|---|---|---|---|---|---|---|---|---|---|
| c (mg mL−1) | 3 | 10 | 30 | 3 | 10 | 30 | 3 | 10 | 30 | |
| DPPC/PEO-b-PCL1 | ||||||||||
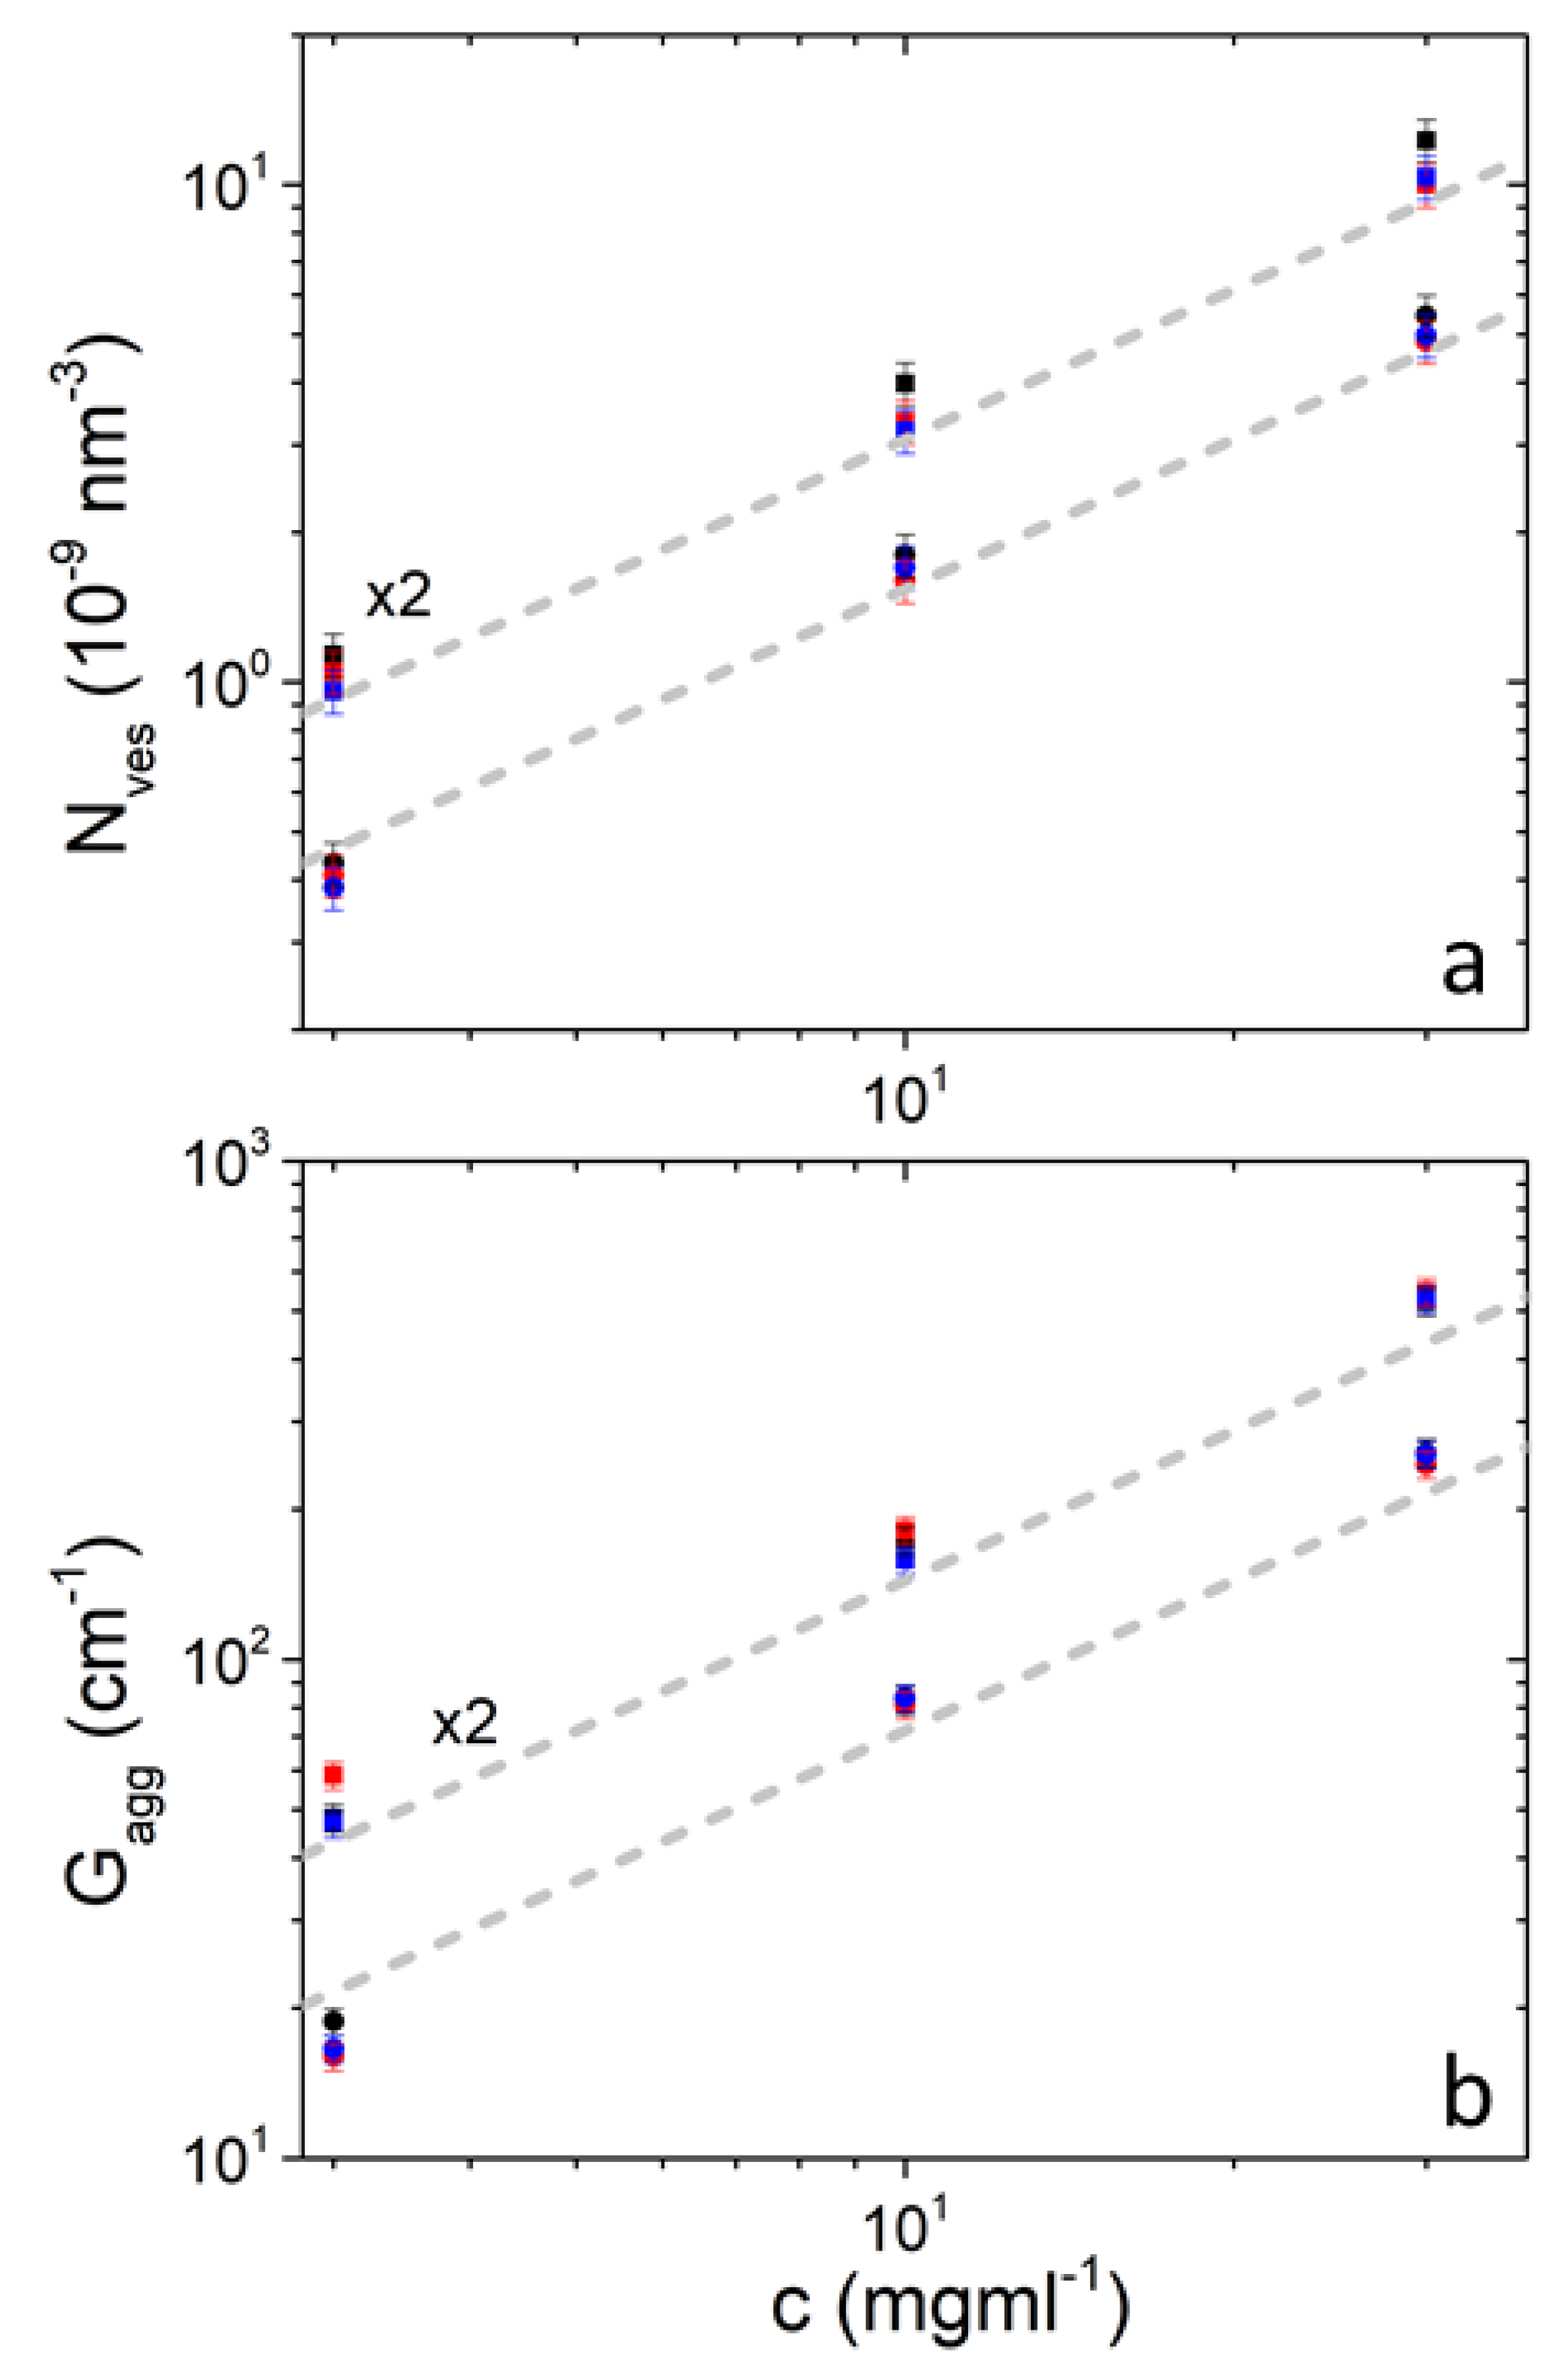
| Nves (10−9 nm−3) | 0.432 | 1.80 | 5.45 | 0.409 | 1.60 | 4.84 | 0.386 | 1.70 | 4.98 | 10 |
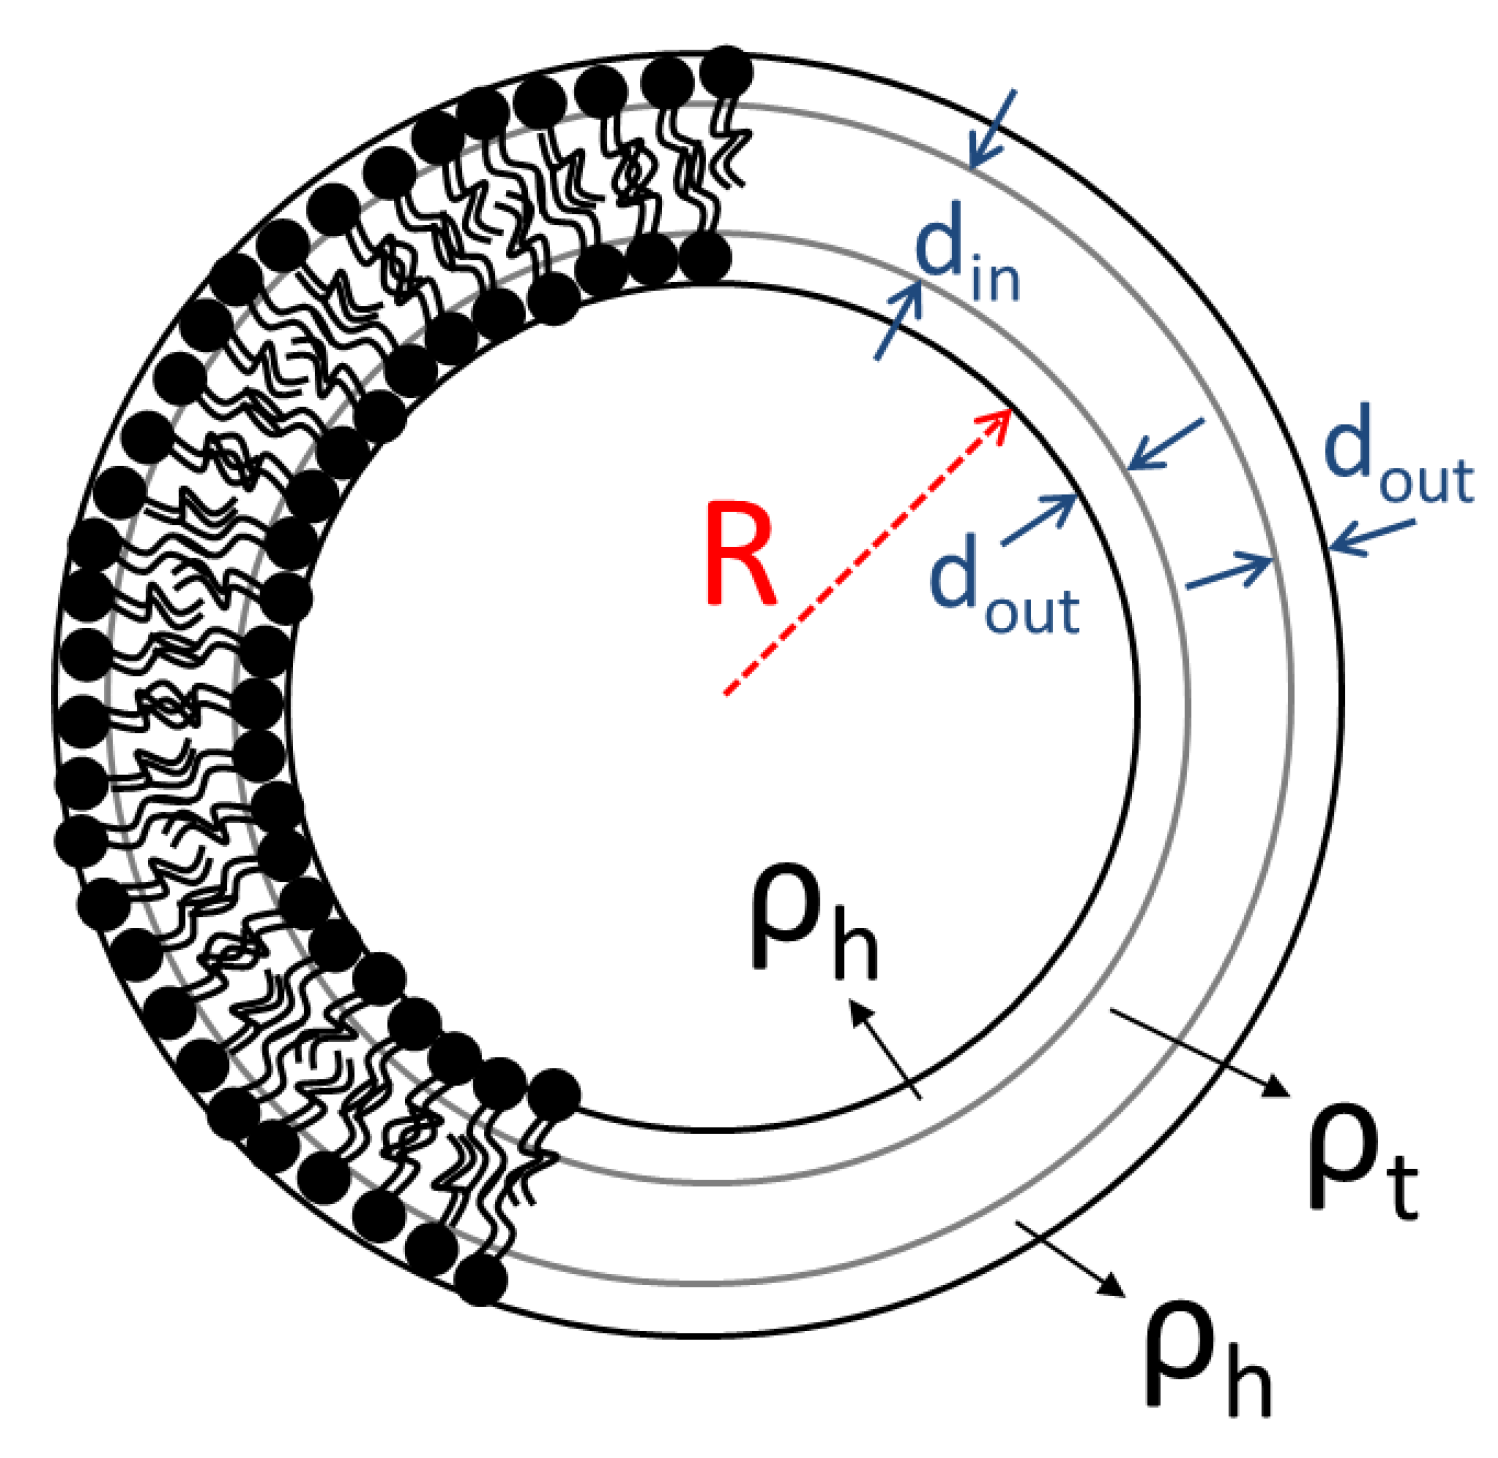
| dout (nm) | 0.61 | 0.64 | 0.60 | 0.59 | 0.62 | 0.58 | 0.62 | 0.63 | 0.60 | 29 |
| din (nm) | 2.86 | 3.16 | 2.88 | 3.03 | 2.93 | 3.13 | 2.74 | 2.94 | 2.91 | 9.6 |
| R (nm) | 8.66 | 8.66 | 8.83 | 9.95 | 9.98 | 10.2 | 10.5 | 10.8 | 10.8 | 3.7 |
| D (nm) | 25.6 | 25.6 | 25.9 | 28.5 | 28.5 | 29.1 | 29.4 | 29.9 | 30.0 | 2.7 |
| PDI | 0.853 | 0.853 | 0.827 | 0.760 | 0.760 | 0.730 | 0.705 | 0.696 | 0.695 | 5.9 |
| Gagg (cm−1) | 18.8 | 83.0 | 260 | 16.00 | 81.0 | 246 | 16.6 | 83.8 | 258 | 6.3 |
| Rg.agg (nm) | 16.4 | 16.8 | 16.6 | 17.5 | 17.5 | 17.2 | 18.5 | 18.5 | 18.0 | 2.6 |
| Dagg | 2.93 | 2.91 | 2.94 | 2.95 | 2.94 | 2.77 | 3.07 | 3.09 | 2.95 | 26 |
| Rcut.agg (nm) | 7.61 | 6.60 | 6.52 | 6.86 | 6.86 | 6.68 | 6.58 | 6.58 | 6.33 | 19 |
| I0,clust (cm −1) | 231 | 164 | 162 | 210 | 171 | 241 | 159 | 236 | 127 | 8.0–30 |
| DPPC/PEO-b-PCL2 | ||||||||||
| N (10−9nm−3) | 0.567 | 1.99 | 6.14 | 0.523 | 1.67 | 5.00 | 0.479 | 1.60 | 5.18 | 10 |
| dout (nm) | 0.64 | 0.60 | 0.62 | 0.61 | 0.59 | 0.64 | 0.60 | 0.62 | 0.58 | 29 |
| din (nm) | 2.87 | 2.96 | 2.86 | 3.15 | 3.08 | 2.89 | 2.94 | 2.97 | 2.91 | 9.6 |
| R (nm) | 8.28 | 8.72 | 9.24 | 9.87 | 10.7 | 10.6 | 11.7 | 11.8 | 11.5 | 3.7 |
| D (nm) | 24.8 | 25.7 | 26.8 | 28.4 | 29.9 | 29.9 | 31.7 | 32.0 | 31.3 | 2.7 |
| PDI | 0.900 | 0.838 | 0.790 | 0.729 | 0.700 | 0.700 | 0.649 | 0.643 | 0.663 | 5.9 |
| Gagg (cm−1) | 24.1 | 86.5 | 261 | 29.3 | 91.00 | 273 | 23.4 | 79.1 | 264 | 6.3 |
| Rg.agg (nm) | 16.8 | 16.7 | 16.5 | 19.3 | 18.4 | 18.4 | 18.8 | 18.7 | 18.1 | 2.6 |
| Dagg | 2.85 | 2.98 | 2.94 | 3.30 | 3.14 | 3.14 | 3.19 | 3.17 | 3.07 | 26 |
| Rcut.agg (nm) | 6.87 | 6.67 | 6.58 | 6.04 | 5.88 | 5.88 | 6.29 | 6.25 | 6.20 | 19 |
| I0,clust (cm−1) | 384 | 633 | 262 | 463 | 581 | 304 | 373 | 670 | 269 | 8.0–30 ** |
| T (°C) | 25 | 37 | 45 | ||||||
|---|---|---|---|---|---|---|---|---|---|
| c (mg mL−1) | 3 | 10 | 30 | 3 | 10 | 30 | 3 | 10 | 30 |
| DPPC/PEO-b-PCL1 | 23.8 | 29.7 | 30.5 | 29.0 | 33.8 | 35.0 | 28.4 | 39.3 | 38.3 |
| DPPC/PEO-b-PCL2 | 29.4 | 32.9 | 37.0 | 35.0 | 38.4 | 38.3 | 41.7 | 42.6 | 44.0 |
Publisher’s Note: MDPI stays neutral with regard to jurisdictional claims in published maps and institutional affiliations. |
© 2020 by the authors. Licensee MDPI, Basel, Switzerland. This article is an open access article distributed under the terms and conditions of the Creative Commons Attribution (CC BY) license (http://creativecommons.org/licenses/by/4.0/).
Share and Cite
Papagiannopoulos, A.; Pippa, N.; Demetzos, C.; Pispas, S.; Radulescu, A. Formation of Uni-Lamellar Vesicles in Mixtures of DPPC with PEO-b-PCL Amphiphilic Diblock Copolymers. Polymers 2021, 13, 4. https://doi.org/10.3390/polym13010004
Papagiannopoulos A, Pippa N, Demetzos C, Pispas S, Radulescu A. Formation of Uni-Lamellar Vesicles in Mixtures of DPPC with PEO-b-PCL Amphiphilic Diblock Copolymers. Polymers. 2021; 13(1):4. https://doi.org/10.3390/polym13010004
Chicago/Turabian StylePapagiannopoulos, Aristeidis, Natassa Pippa, Costas Demetzos, Stergios Pispas, and Aurel Radulescu. 2021. "Formation of Uni-Lamellar Vesicles in Mixtures of DPPC with PEO-b-PCL Amphiphilic Diblock Copolymers" Polymers 13, no. 1: 4. https://doi.org/10.3390/polym13010004
APA StylePapagiannopoulos, A., Pippa, N., Demetzos, C., Pispas, S., & Radulescu, A. (2021). Formation of Uni-Lamellar Vesicles in Mixtures of DPPC with PEO-b-PCL Amphiphilic Diblock Copolymers. Polymers, 13(1), 4. https://doi.org/10.3390/polym13010004