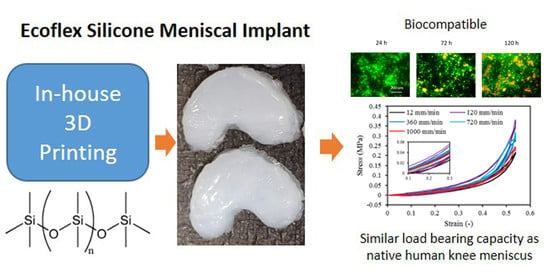
3D Printed Silicone Meniscus Implants: Influence of the 3D Printing Process on Properties of Silicone Implants


 ,
,  , ,
, ,  ,
, 
Abstract
1. Introduction
2. Materials and Methods
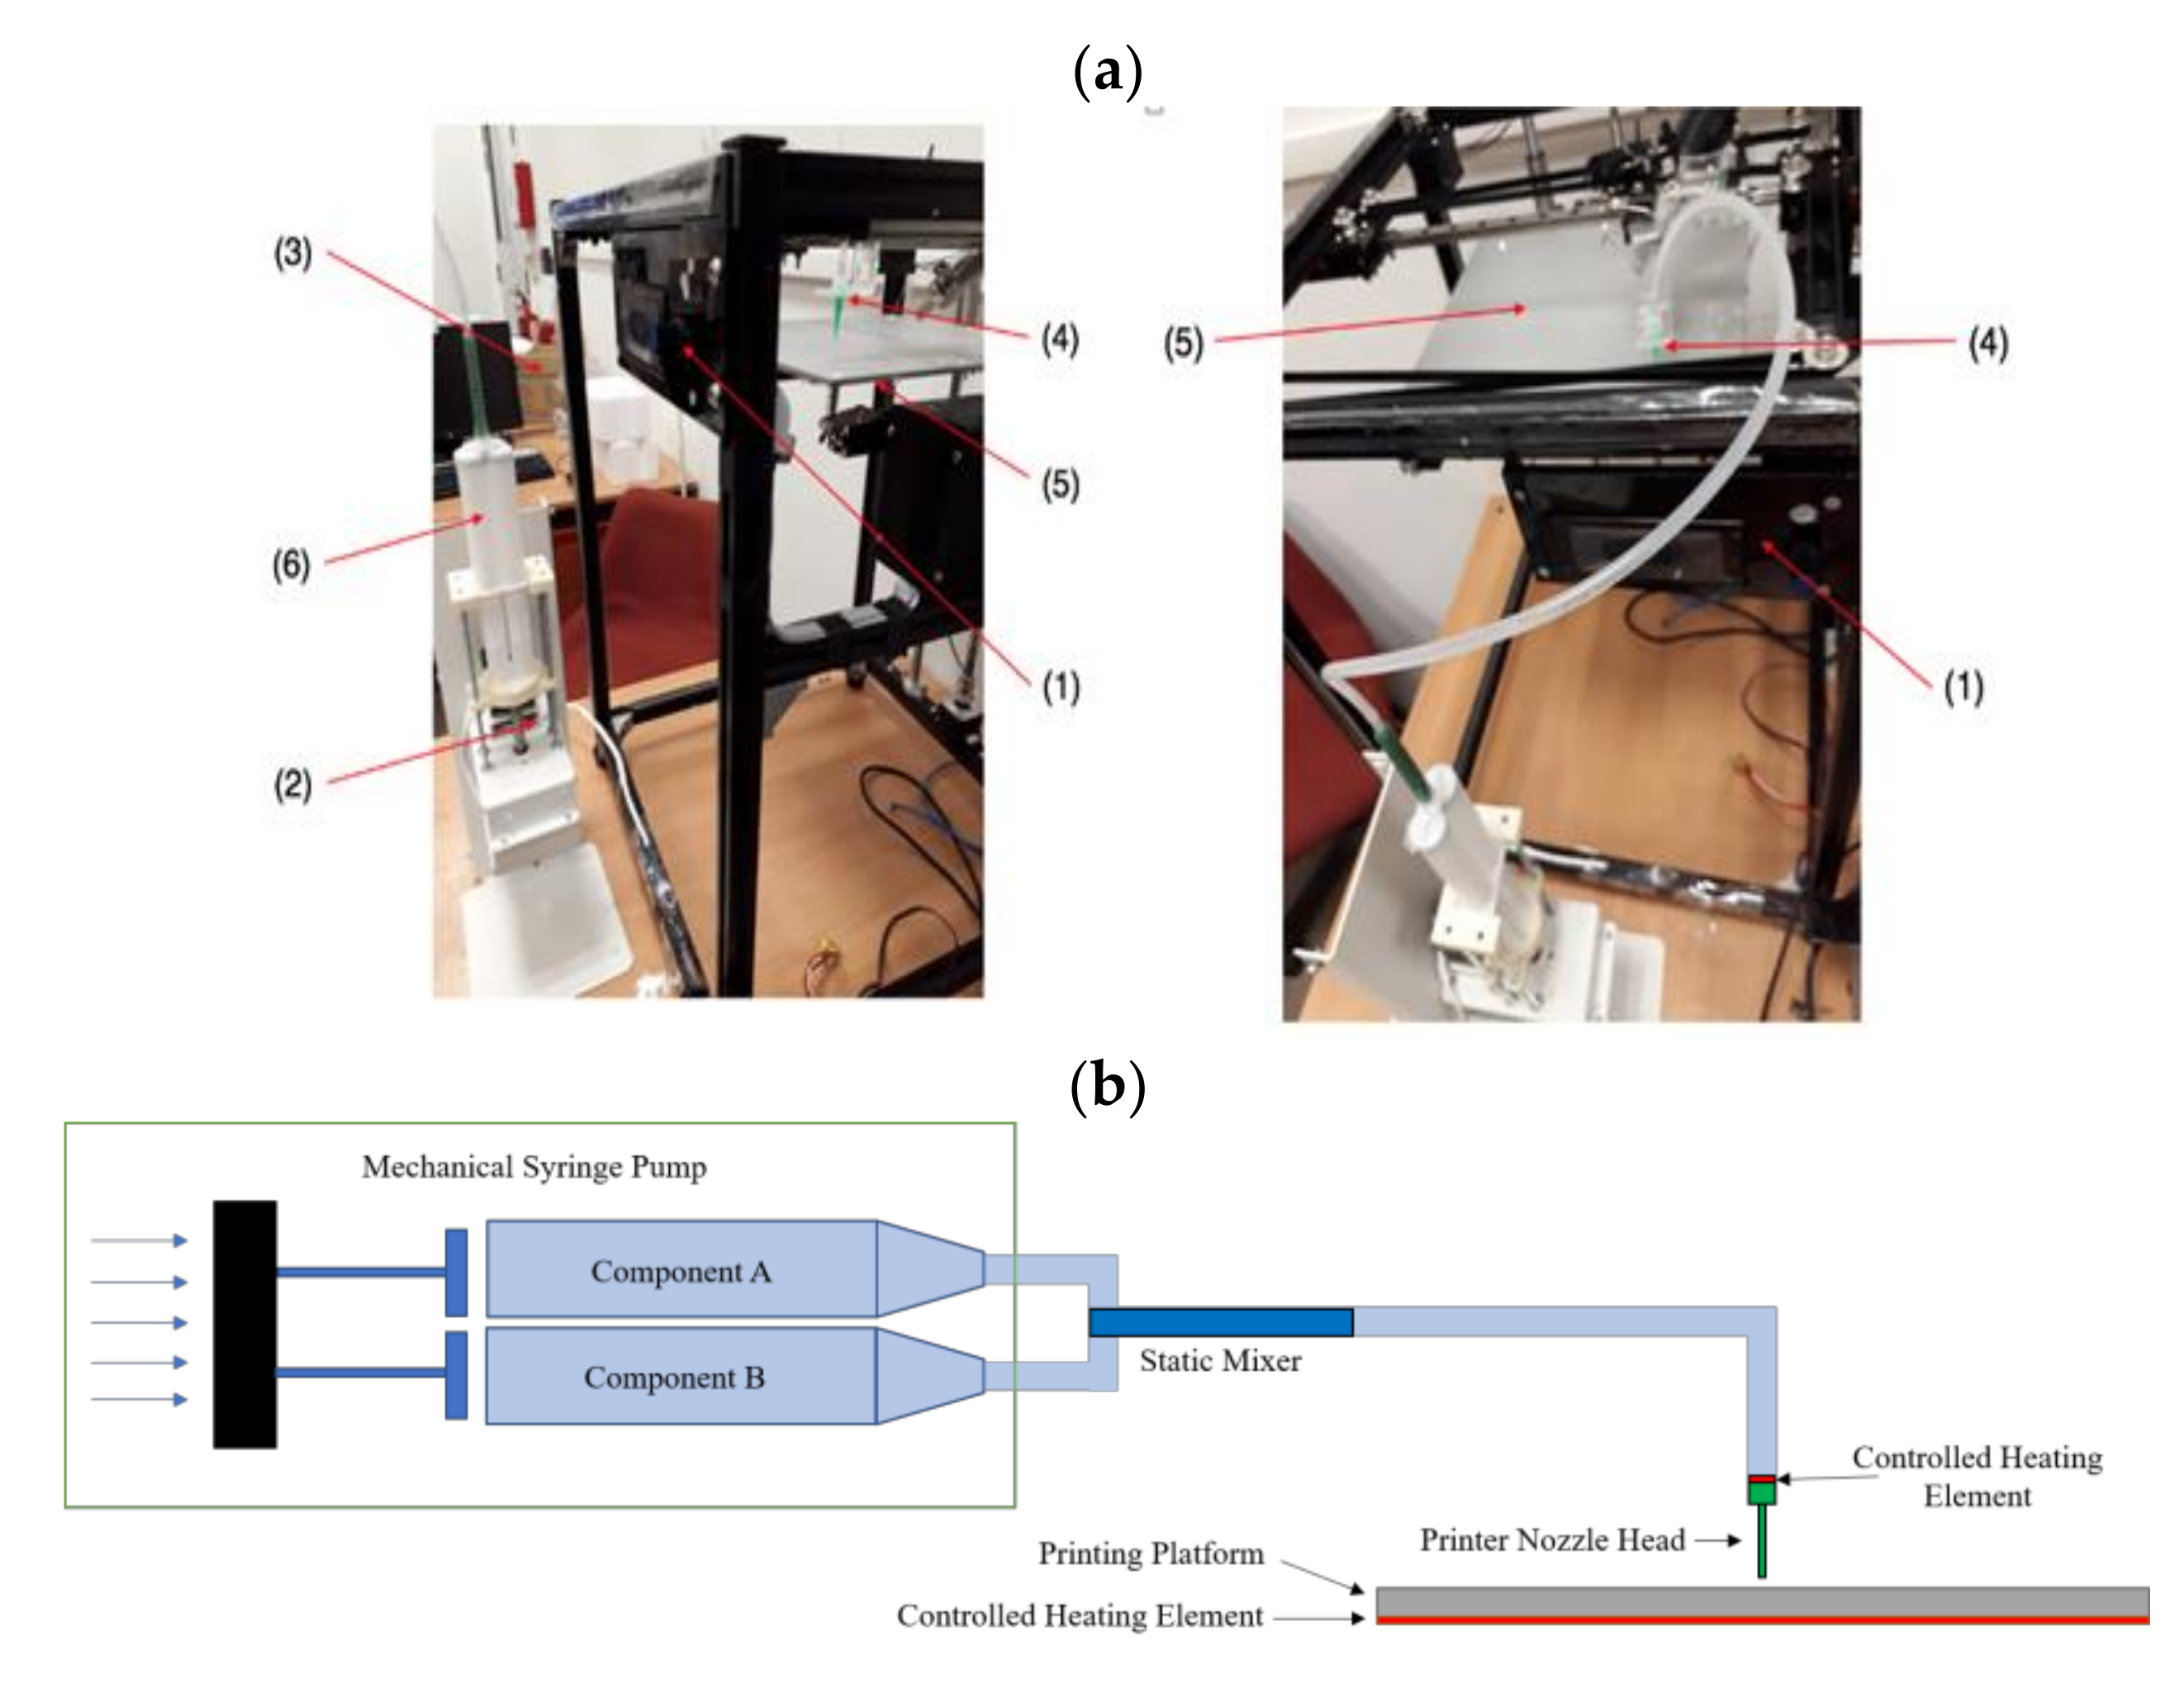
2.1. Experimental Set-Up
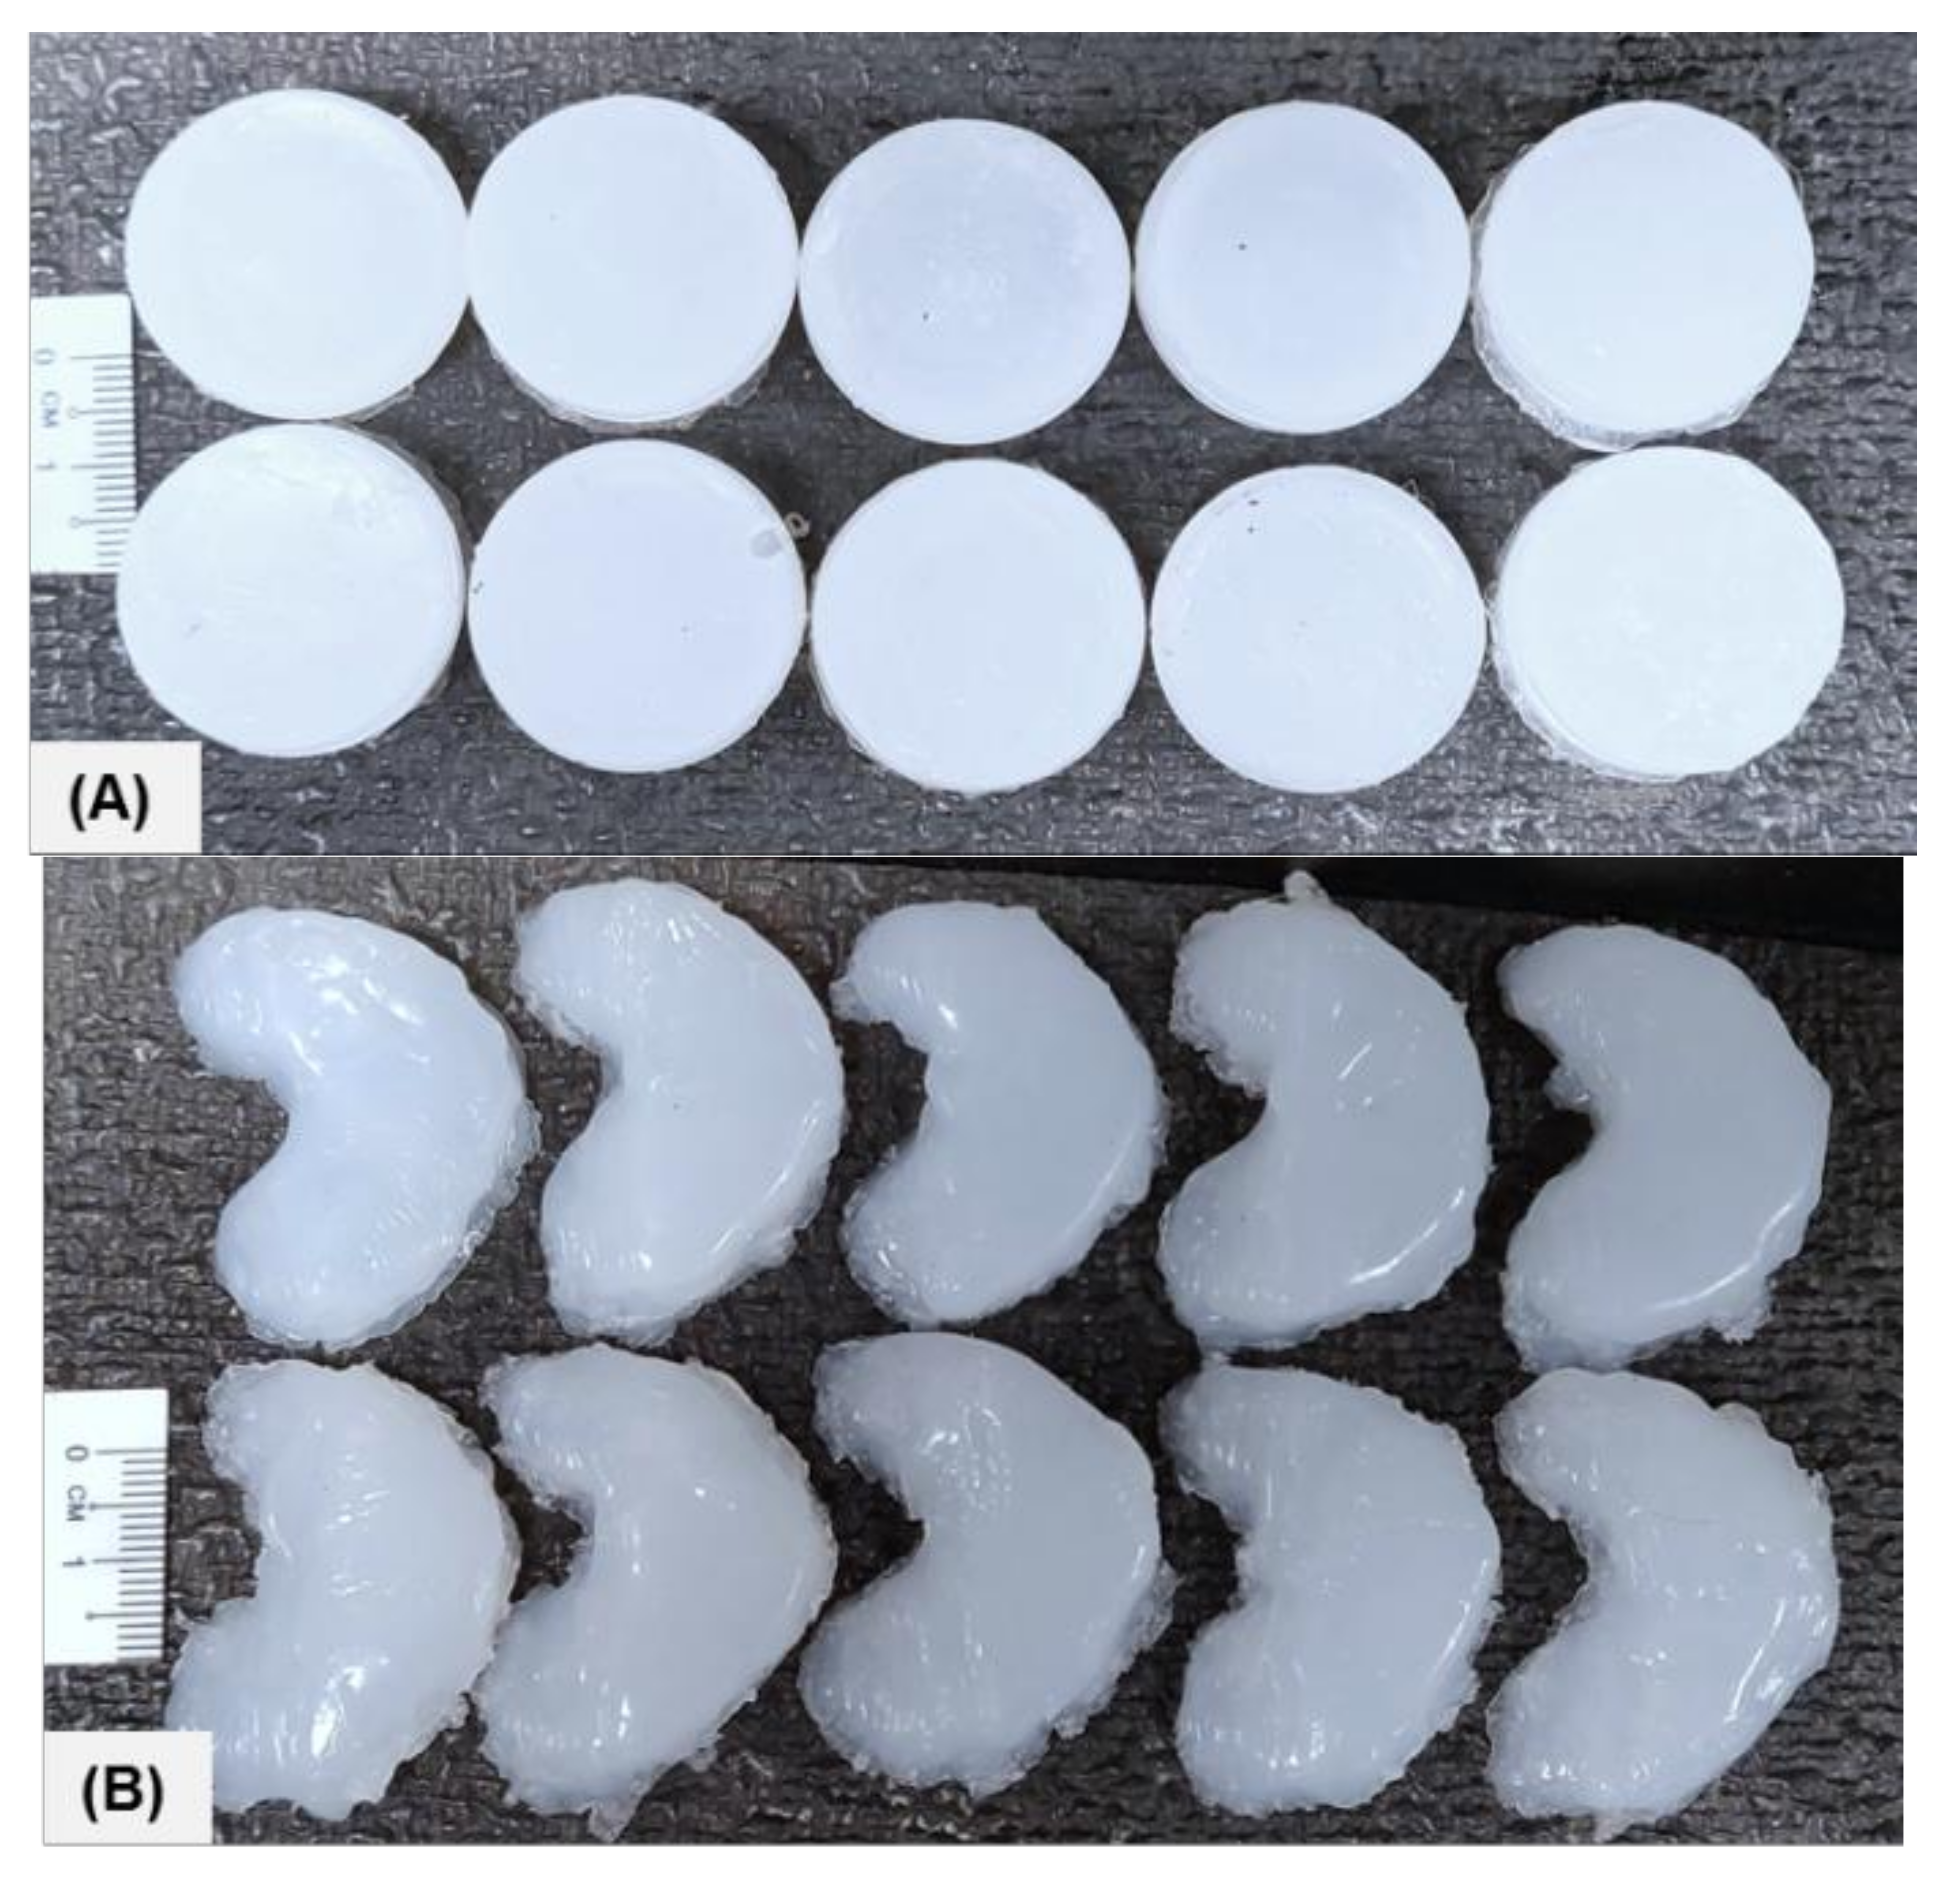
2.2. Sample Data and Dimensions
2.3. Surface Characterization
2.3.1. Light Microscopy
2.3.2. Scanning Electron Microscope
2.3.3. Surface Profilometry
2.3.4. Phosphate Buffer Saline (PBS) Absorption Test
2.3.5. X-ray Photoelectron Spectroscopy (XPS)
2.3.6. Fourier Transform Infrared (FTIR) Spectroscopy
2.3.7. Thermo-Gravimetric Analysis (TGA), Differential Scanning Calorimetry (DSC), and Differential Thermal Gravimetric Analysis (DTG)
2.3.8. Cell Viability/Cytotoxicity Assays
2.3.9. Mechanical Compression
2.3.10. Monotonic Compressive Test Up to Failure
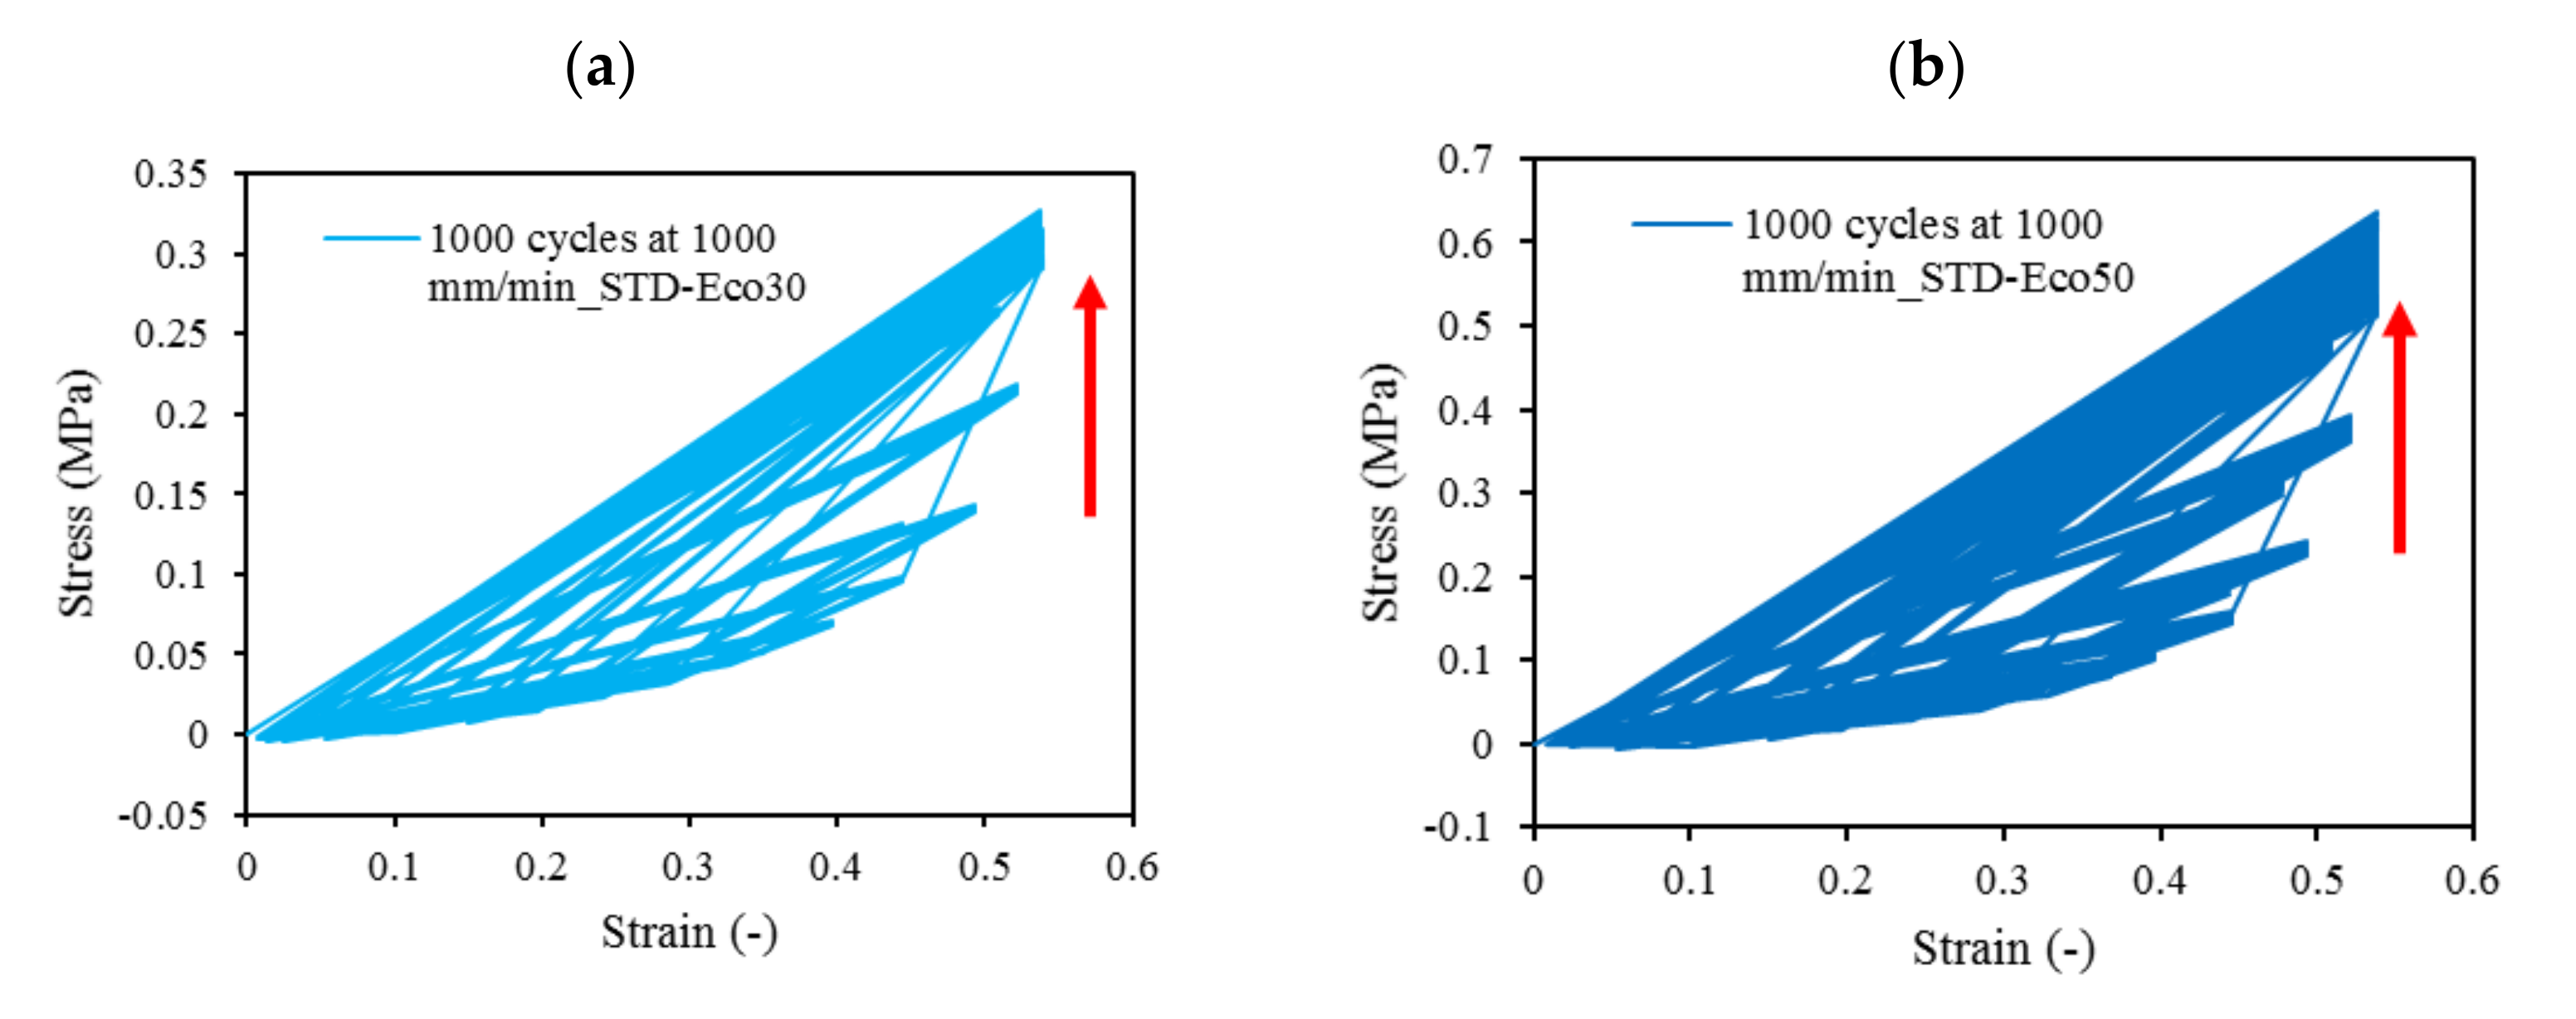
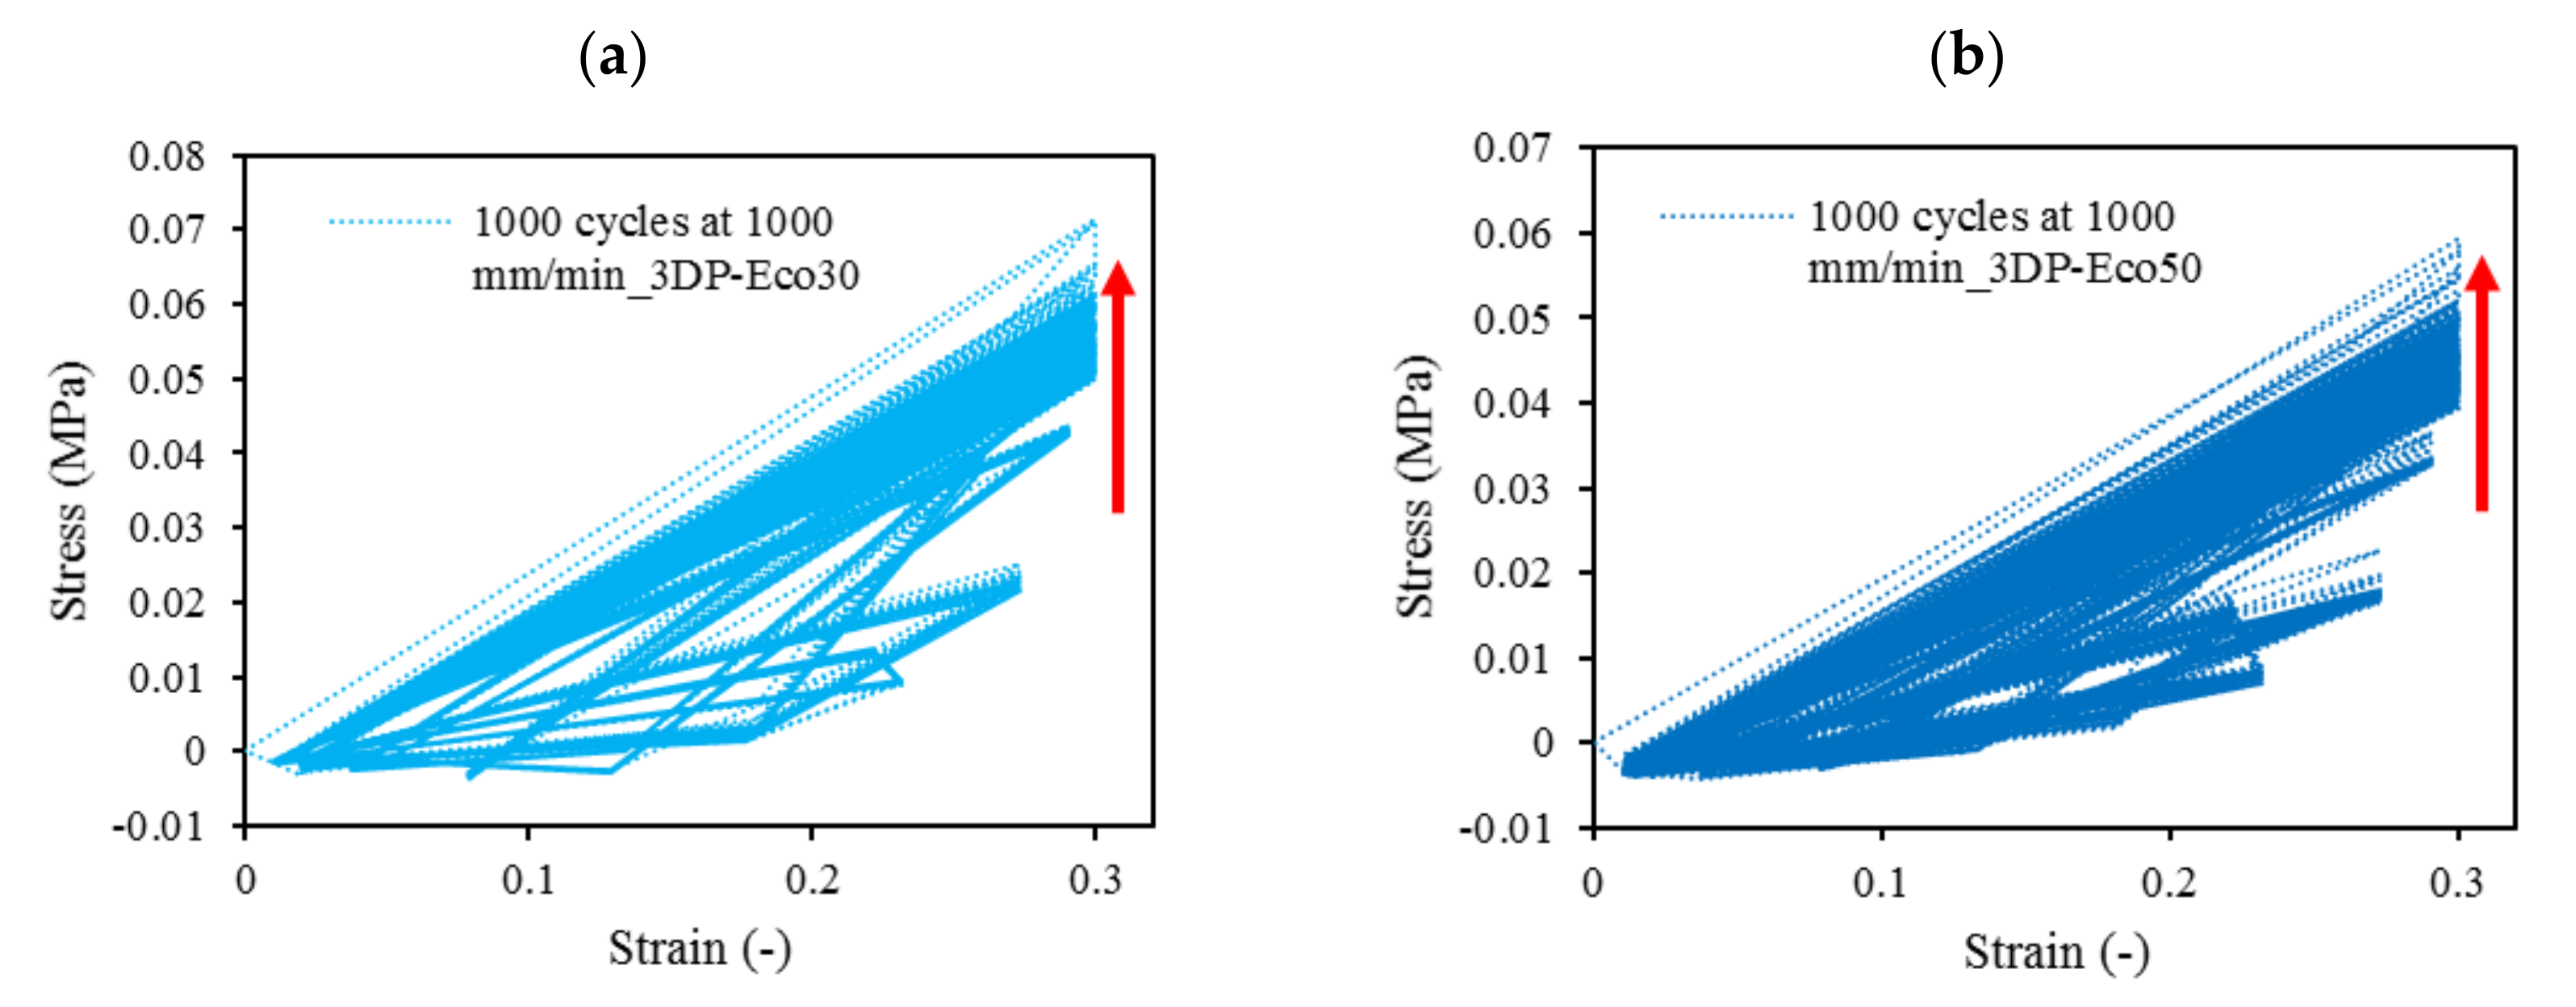
2.3.11. Cyclic Compressive Testing
3. Results and Discussion
3.1. Light Microscope
3.2. Scanning Electron Microscopy
3.3. PBS Absorption Test
3.4. Surface Profilometry
3.5. X-ray Photoelectron Spectroscopy
3.6. FTIR
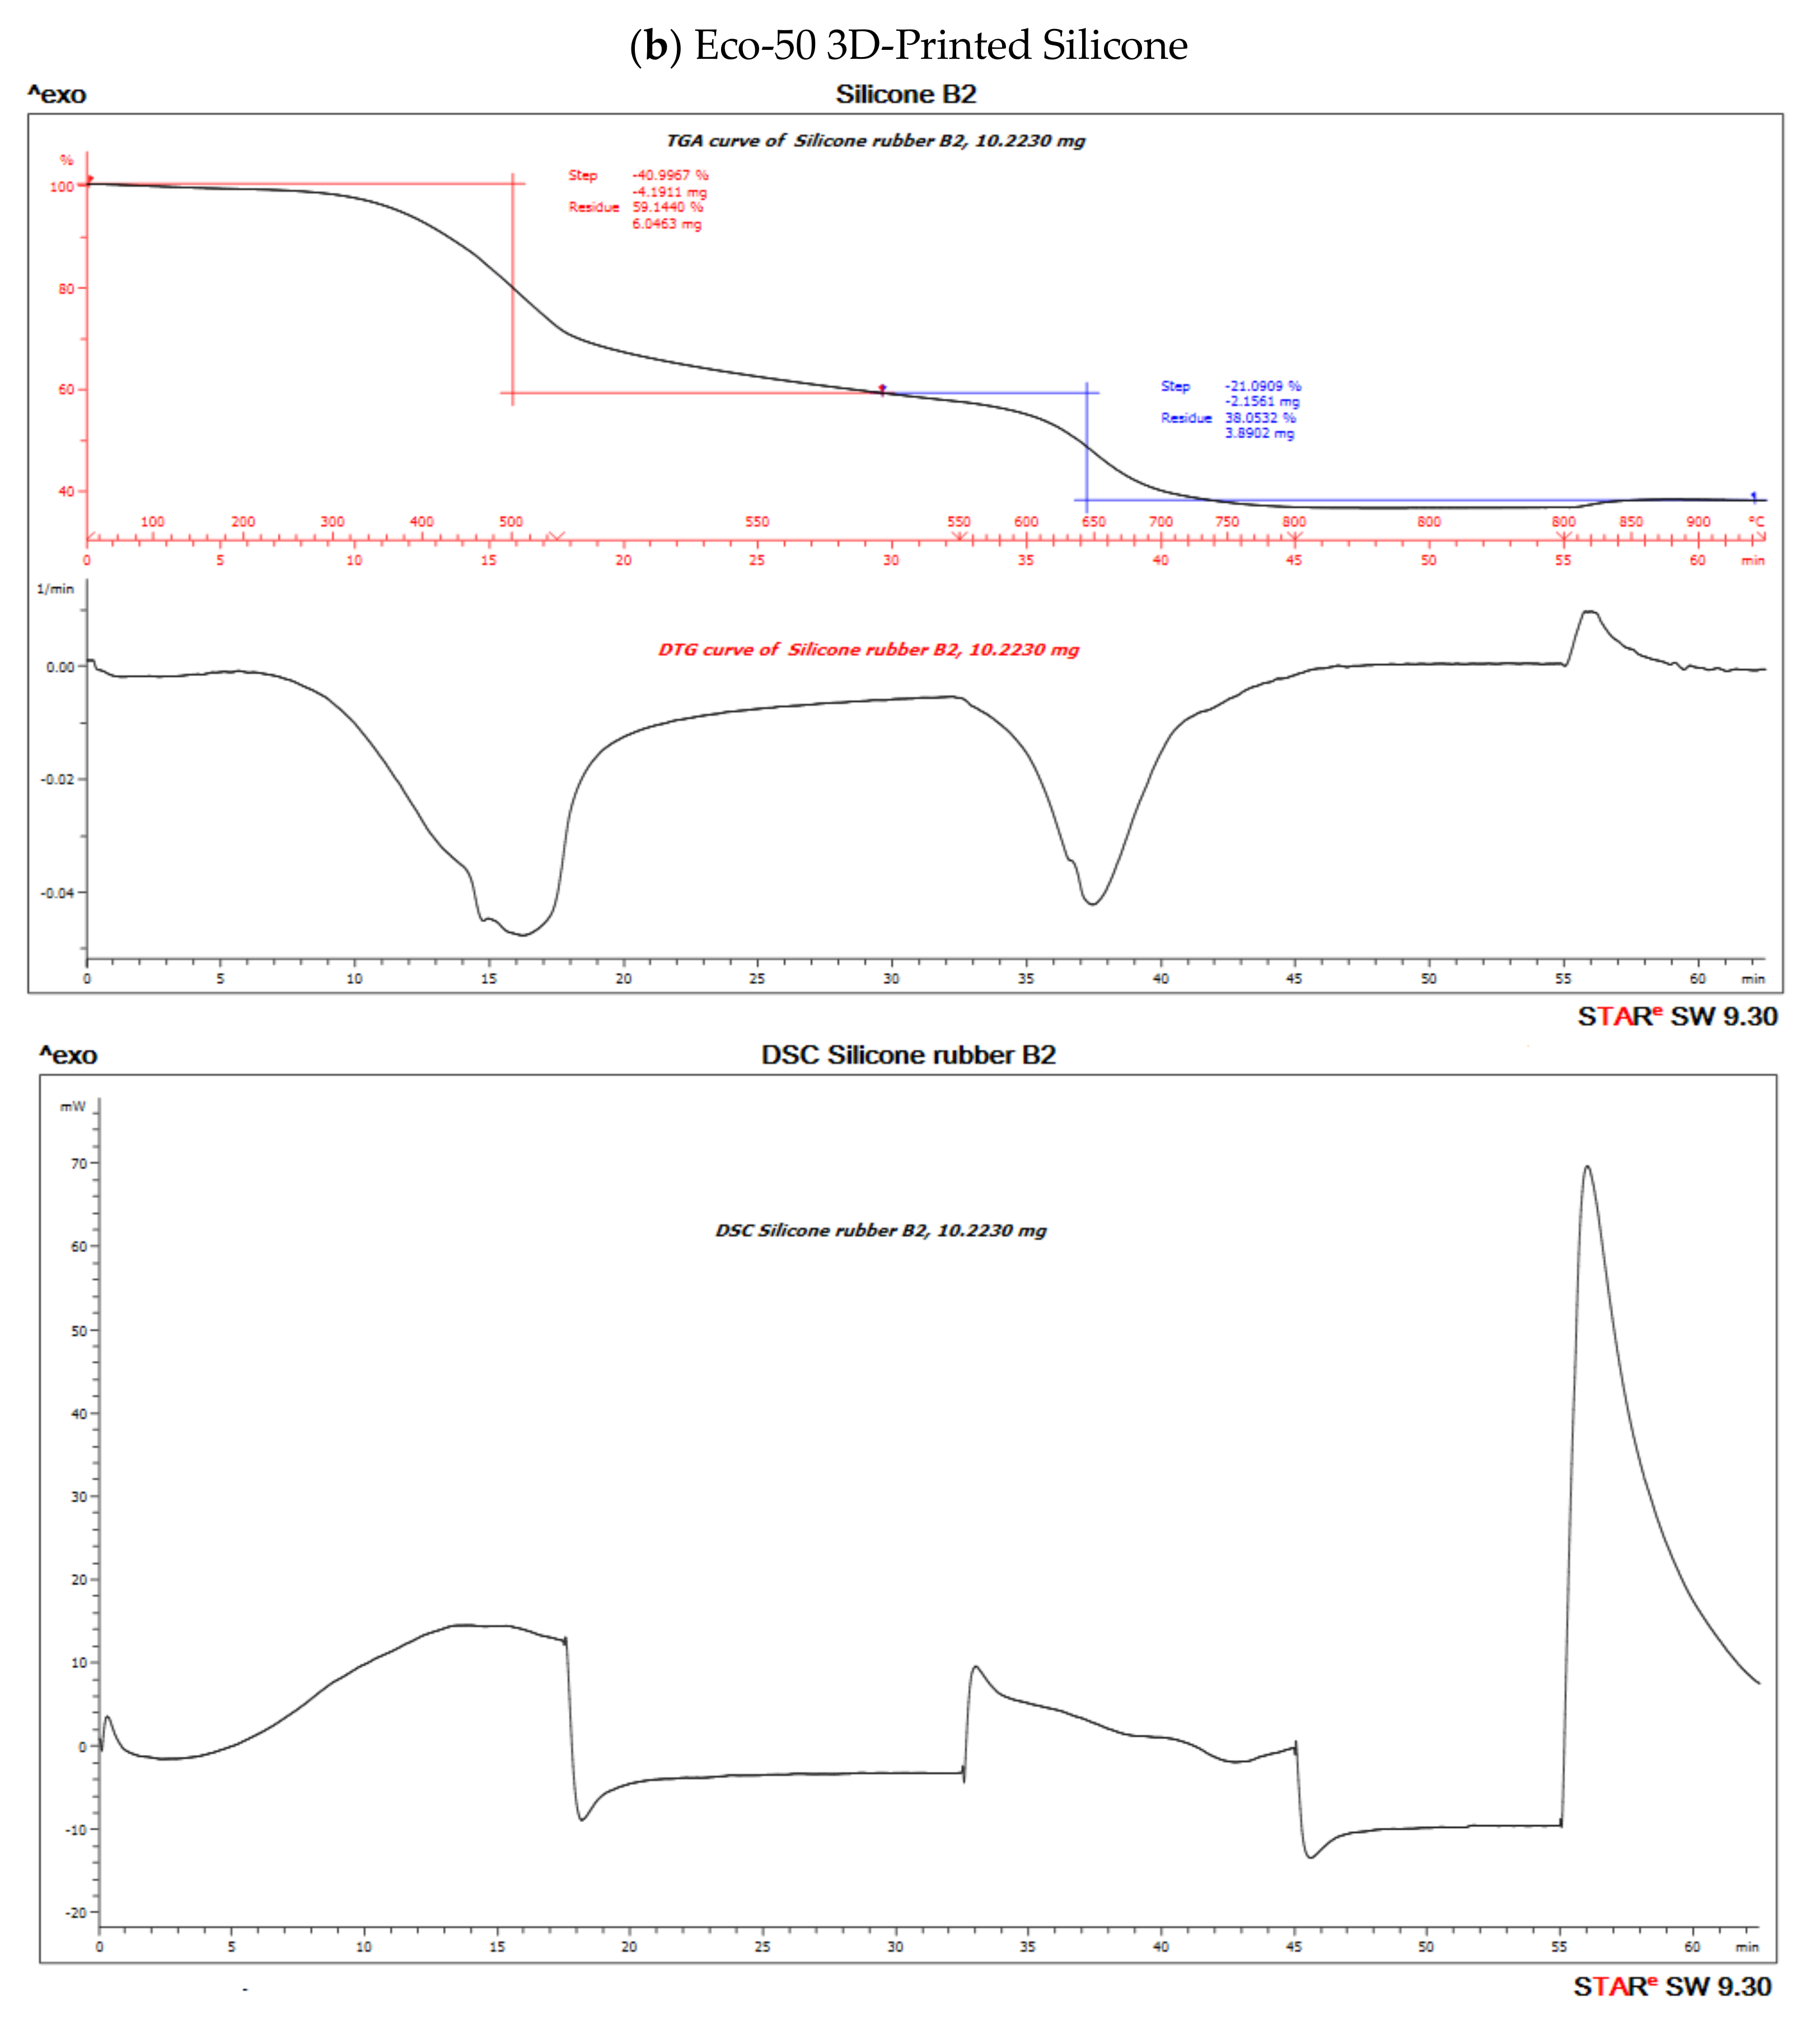
3.7. DSC/TGA/DTG
3.8. Cytocompatibility of Molded and 3D-Printed Silicone
3.9. Mechanical Compression Test
4. Conclusions
Supplementary Materials
Author Contributions
Funding
Acknowledgments
Conflicts of Interest
References
- Shane Anderson, A.; Loeser, R.F. Why is osteoarthritis an age-related disease? Best Pract. Res. Clin. Rheumatol. 2010, 24, 15–26. [Google Scholar] [CrossRef] [PubMed]
- Loeser, R.F. Age-related changes in the musculoskeletal system and the development of osteoarthritis. Clin. Geriatr. Med. 2010, 26, 371–386. [Google Scholar] [CrossRef] [PubMed]
- Jonathan, E.; Vincenzo, C.; Claudio, Z.; Peter, V.; Ron, A.; Elliott, H.; Farshid, G.; Avi, S.; Eran, L.-G.; Emanuele, N. A novel polycarbonate-urethane meniscal implant: From bench to first clinical experience. Orthop. Proc. 2012, 94-B, 125. [Google Scholar]
- Bulgheroni, P.; Murena, L.; Ratti, C.; Bulgheroni, E.; Ronga, M.; Cherubino, P. Follow-up of collagen meniscus implant patients: Clinical, radiological, and magnetic resonance imaging results at 5 years. Knee 2010, 17, 224–229. [Google Scholar] [CrossRef]
- Bouyarmane, H.; Beaufils, P.; Pujol, N.; Bellemans, J.; Roberts, S.; Spalding, T.; Zaffagnini, S.; Marcacci, M.; Verdonk, P.; Womack, M.; et al. Polyurethane scaffold in lateral meniscus segmental defects: Clinical outcomes at 24 months follow-up. Orthop. Traumatol. Surg. Res. 2014, 100, 153–157. [Google Scholar] [CrossRef]
- Baynat, C.; Andro, C.; Vincent, J.P.; Schiele, P.; Buisson, P.; Dubrana, F.; Gunepin, F.X. Actifit® synthetic meniscal substitute: Experience with 18 patients in Brest, France. Orthop. Traumatol. Surg. Res. 2014, 100, S385–S389. [Google Scholar] [CrossRef]
- Liravi, F.; Toyserkani, E. A hybrid additive manufacturing method for the fabrication of silicone bio-structures: 3D printing optimization and surface characterization. Mater. Des. 2018, 138, 46–61. [Google Scholar] [CrossRef]
- Grogan, S.P.; Chung, P.H.; Soman, P.; Chen, P.; Lotz, M.K.; Chen, S.; D’Lima, D.D. Digital micromirror device projection printing system for meniscus tissue engineering. Acta Biomater. 2013, 9, 7218–7226. [Google Scholar] [CrossRef]
- Kobayashi, M.; Toguchida, J.; Oka, M. Development of an artificial meniscus using polyvinyl alcohol-hydrogel for early return to, and continuance of, athletic life in sportspersons with severe meniscus injury. I: Mechanical evaluation. Knee 2003, 10, 47–51. [Google Scholar] [CrossRef]
- Kelly, B.T.; Robertson, W.; Potter, H.G.; Deng, X.-H.; Turner, A.S.; Lyman, S.; Warren, R.F.; Rodeo, S.A. Hydrogel meniscal replacement in the sheep knee: Preliminary evaluation of chondroprotective effects. Am. J. Sports Med. 2007, 35, 43–52. [Google Scholar] [CrossRef]
- Karstedt, B. Platinum Complexes of Unsaturated Siloxanes and Platinum Containing Organopolysiloxanes. U.S. Patent 3,775,452, 27 November 1973. [Google Scholar]
- Kim, Y.; Yuk, H.; Zhao, R.; Chester, S.A.; Zhao, X. Printing ferromagnetic domains for untethered fast-transforming soft materials. Nature 2018, 558, 274–279. [Google Scholar] [CrossRef] [PubMed]
- Bastola, A.K.; Paudel, M.; Li, L. Development of hybrid magnetorheological elastomers by 3D printing. Polymer 2018, 149, 213–228. [Google Scholar] [CrossRef]
- O’Bryan, C.S.; Bhattacharjee, T.; Hart, S.; Kabb, C.P.; Schulze, K.D.; Chilakala, I.; Sumerlin, B.S.; Sawyer, W.G.; Angelini, T.E. Self-assembled micro-organogels for 3D printing silicone structures. Sci. Adv. 2017, 3, e1602800. [Google Scholar] [CrossRef] [PubMed]
- Yuk, H.; Zhao, X. A New 3D printing strategy by harnessing deformation, instability, and fracture of viscoelastic inks. Adv. Mater. 2018, 30, 1704028. [Google Scholar] [CrossRef] [PubMed]
- Bastola, A.K.; Hoang, V.T.; Li, L. A novel hybrid magnetorheological elastomer developed by 3D printing. Mater. Des. 2017, 114, 391–397. [Google Scholar] [CrossRef]
- Bezek, L.B.; Cauchi, M.P.; De Vita, R.; Foerst, J.R.; Williams, C.B. 3D printing tissue-mimicking materials for realistic transseptal puncture models. J. Mech. Behav. Biomed. Mater. 2020, 110, 103971. [Google Scholar] [CrossRef] [PubMed]
- Hossain, M.; Liao, Z. An additively manufactured silicone polymer: Thermo-viscoelastic experimental study and computational modelling. Addit. Manuf. 2020, 35, 101395. [Google Scholar] [CrossRef]
- Zhao, T.; Yu, R.; Li, S.; Li, X.; Zhang, Y.; Yang, X.; Zhao, X.; Wang, C.; Liu, Z.; Dou, R.; et al. Superstretchable and processable silicone elastomers by digital light processing 3D printing. ACS Appl. Mater. Interfaces 2019, 11, 14391–14398. [Google Scholar] [CrossRef]
- McCoul, D.; Rosset, S.; Schlatter, S.; Shea, H. Inkjet 3D printing of UV and thermal cure silicone elastomers for dielectric elastomer actuators. Smart Mater. Struct. 2017, 26, 125022. [Google Scholar] [CrossRef]
- Davoodi, E.; Fayazfar, H.; Liravi, F.; Jabari, E.; Toyserkani, E. Drop-on-demand high-speed 3D printing of flexible milled carbon fiber/silicone composite sensors for wearable biomonitoring devices. Addit. Manuf. 2020, 32, 101016. [Google Scholar] [CrossRef]
- Zhou, L.-y.; Gao, Q.; Fu, J.-z.; Chen, Q.-y.; Zhu, J.-p.; Sun, Y.; He, Y. Multimaterial 3D Printing of Highly Stretchable Silicone Elastomers. ACS Appl. Mater. Interfaces 2019, 11, 23573–23583. [Google Scholar] [CrossRef] [PubMed]
- Abdollahi, S.; Markvicka, E.J.; Majidi, C.; Feinberg, A.W. 3D printing silicone elastomer for patient-specific wearable pulse oximeter. Adv. Healthc. Mater. 2020, 9, 1901735. [Google Scholar] [CrossRef]
- Menon, A.; Póczos, B.; Feinberg, A.W.; Washburn, N.R. Optimization of silicone 3D printing with hierarchical machine learning. 3D Print. Addit. Manuf. 2019, 6, 181–189. [Google Scholar] [CrossRef]
- Bastola, A.K.; Hossain, M. A review on magneto-mechanical characterizations of magnetorheological elastomers. Compos. Part B Eng. 2020, 200, 108348. [Google Scholar] [CrossRef]
- Amjadi, M.; Yoon, Y.J.; Park, I. Ultra-stretchable and skin-mountable strain sensors using carbon nanotubes–Ecoflex nanocomposites. Nanotechnology 2015, 26, 375501. [Google Scholar] [CrossRef]
- Siegenthaler, K.; Künkel, A.; Skupin, G.; Yamamoto, M. Ecoflex® and Ecovio®: Biodegradable, performance-enabling plastics. In Synthetic Biodegradable Polymers; Rieger, B., Künkel, A., Coates, G., Reichardt, R., Dinjus, E., Zevaco, T., Eds.; Springer: Berlin/Heidelberg, Germany, 2011; Volume 245, pp. 91–136. [Google Scholar]
- Mai, H.; Mutlu, R.; Tawk, C.; Alici, G.; Sencadas, V. Ultra-stretchable MWCNT-Ecoflex piezoresistive sensors for human motion detection applications. Compos. Sci. Technol. 2019, 173, 118–124. [Google Scholar] [CrossRef]
- Xu, Z.; Zheng, S.; Wu, X.; Liu, Z.; Bao, R.; Yang, W.; Yang, M. High actuated performance MWCNT/Ecoflex dielectric elastomer actuators based on layer-by-layer structure. Compos. Part A Appl. Sci. Manuf. 2019, 125, 105527. [Google Scholar] [CrossRef]
- Luis, E.; Pan, H.M.; Sing, S.L.; Bajpai, R.; Song, J.; Yeong, W.Y. 3D direct printing of silicone meniscus implant using a novel heat-cured extrusion-based printer. Polymers 2020, 12, 1031. [Google Scholar] [CrossRef]
- Luis, E.; Pan, H.M.; Sing, S.L.; Bastola, A.K.; Goh, G.D.; Goh, G.L.; Tan, H.K.J.; Bajpai, R.; Song, J.; Yeong, W.Y. Silicone 3D printing: Process optimization, product biocompatibility, and reliability of silicone meniscus implants. 3D Print. Addit. Manuf. 2019, 6, 319–332. [Google Scholar] [CrossRef]
- Setua, D.; Awasthi, R.; Kumar, S.; Prasad, M.; Agarwal, K. Scanning electron microscopy of natural rubber surfaces: Quantitative statistical and spectral texture analysis using digital image processing. In Microscopy: Science Technology Application and Education; Formatex Research Center: Badajos, Spain, 2018. [Google Scholar]
- Heinrichs, V.; Dieluweit, S.; Stellbrink, J.; Pyckhout-Hintzen, W.; Hersch, N.; Richter, D.; Merkel, R. Chemically defined, ultrasoft PDMS elastomers with selectable elasticity for mechanobiology. PLoS ONE 2018, 13, e0195180. [Google Scholar] [CrossRef]
- Lee, W.S.; Yeo, K.S.; Andriyana, A.; Shee, Y.G.; Mahamd Adikan, F.R. Effect of cyclic compression and curing agent concentration on the stabilization of mechanical properties of PDMS elastomer. Mater. Des. 2016, 96, 470–475. [Google Scholar] [CrossRef]
- Gong, B.; Tu, Y.; Zhou, Y.; Li, R.; Zhang, F.; Xu, Z.; Liang, D. Moisture absorption characteristics of silicone rubber and its effect on dielectric properties. In 2013 Annual Report Conference on Electrical Insulation and Dielectric Phenomena, Proceedings of the Conference on Electrical Insulation and Dielectric Phenomena (CEIDP), Shenzhen, China, 20–23 October 2013; IEEE: New York, NY, USA, 2013; pp. 430–433. [Google Scholar]
- Vorburger, T.V.; Rhee, H.-G.; Renegar, T.B.; Song, J.-F.; Zheng, A. Comparison of optical and stylus methods for measurement of surface texture. Int. J. Adv. Manuf. Technol. 2007, 33, 110–118. [Google Scholar] [CrossRef]
- Tokoro, T. Effects of temperature and surface roughness on the evaluation of hydrophobic properties of silicone rubber. In Proceedings of the IEEE Conference on Electrical Insulation and Dielectric Phenomena (CEIDP), Toronto, ON, Canada, 16–19 October 2016; pp. 814–817. [Google Scholar]
- Campeau, M.-A.; Lortie, A.; Tremblay, P.; Béliveau, M.-O.; Dubé, D.; Langelier, È.; Rouleau, L. Effect of manufacturing and experimental conditions on the mechanical and surface properties of silicone elastomer scaffolds used in endothelial mechanobiological studies. Biomed. Eng. Online 2017, 16, 1–23. [Google Scholar] [CrossRef] [PubMed]
- Li, W.; Zhou, J.; Xu, Y. Study of the in vitro cytotoxicity testing of medical devices. Biomed. Rep. 2015, 3, 617–620. [Google Scholar] [CrossRef]
- Smooth-On Compare Tool. Available online: https://www.smooth-on.com/compare/4985/5048/a/ (accessed on 17 September 2020).
- Liao, Z.; Hossain, M.; Yao, X. Ecoflex polymer of different Shore hardnesses: Experimental investigations and constitutive modelling. Mech. Mater. 2020, 144, 103366. [Google Scholar] [CrossRef]
- Liao, Z.; Hossain, M.; Yao, X.; Navaratne, R.; Chagnon, G. A comprehensive thermo-viscoelastic experimental investigation of Ecoflex polymer. Polym. Test. 2020, 86, 106478. [Google Scholar] [CrossRef]


| Mixed Viscosity (cps) | Specific Gravity (g/cc) | Specific Vol. (cu. in./lb.) | Pot Life (min) | Cure Time (h) | Shore Hardness | Tensile Strength (psi) | 100% Modulus (psi) | Elongation at Break (%) | Die B Tear Strength (pli) | Shrinkage (in./in.) | |
|---|---|---|---|---|---|---|---|---|---|---|---|
| Ecoflex 50 | 8000 | 1.07 | 25.9 | 18 | 3 | 00–50 | 315 | 12 | 980 | 50 | <0.001 |
| Ecoflex 30 | 3000 | 1.07 | 26.0 | 45 | 4 | 00–30 | 200 | 10 | 900 | 38 | <0.001 |
| Samples | Si (%) | S (%) | Fe (%) | Cu (%) |
|---|---|---|---|---|
| Eco50 molded implant | 99.739 | 0.253 | 0.005 | 0.003 |
| Eco50 3D-printed implant | 99.816 | 0.174 | 0.005 | 0.01 |
| Samples | % Polymer Content | % Residual Silicates/Oxides |
|---|---|---|
| Eco-50 Molded Silicone implant | 59.937 | 40.073 |
| Eco-50 3D Printed Silicone implant | 61.95 | 38.053 |
© 2020 by the authors. Licensee MDPI, Basel, Switzerland. This article is an open access article distributed under the terms and conditions of the Creative Commons Attribution (CC BY) license (http://creativecommons.org/licenses/by/4.0/).
Share and Cite
Luis, E.; Pan, H.M.; Bastola, A.K.; Bajpai, R.; Sing, S.L.; Song, J.; Yeong, W.Y. 3D Printed Silicone Meniscus Implants: Influence of the 3D Printing Process on Properties of Silicone Implants. Polymers 2020, 12, 2136. https://doi.org/10.3390/polym12092136
Luis E, Pan HM, Bastola AK, Bajpai R, Sing SL, Song J, Yeong WY. 3D Printed Silicone Meniscus Implants: Influence of the 3D Printing Process on Properties of Silicone Implants. Polymers. 2020; 12(9):2136. https://doi.org/10.3390/polym12092136
Chicago/Turabian StyleLuis, Eric, Houwen Matthew Pan, Anil Kumar Bastola, Ram Bajpai, Swee Leong Sing, Juha Song, and Wai Yee Yeong. 2020. "3D Printed Silicone Meniscus Implants: Influence of the 3D Printing Process on Properties of Silicone Implants" Polymers 12, no. 9: 2136. https://doi.org/10.3390/polym12092136
APA StyleLuis, E., Pan, H. M., Bastola, A. K., Bajpai, R., Sing, S. L., Song, J., & Yeong, W. Y. (2020). 3D Printed Silicone Meniscus Implants: Influence of the 3D Printing Process on Properties of Silicone Implants. Polymers, 12(9), 2136. https://doi.org/10.3390/polym12092136