Hyaluronan-Arginine Interactions—An Ultrasound and ITC Study


Abstract
1. Introduction
2. Materials and Methods
2.1. Materials
2.2. Methods
2.2.1. High-Resolution Ultrasound Spectroscopy
2.2.2. ITC
2.2.3. The Molar Ratio
3. Results
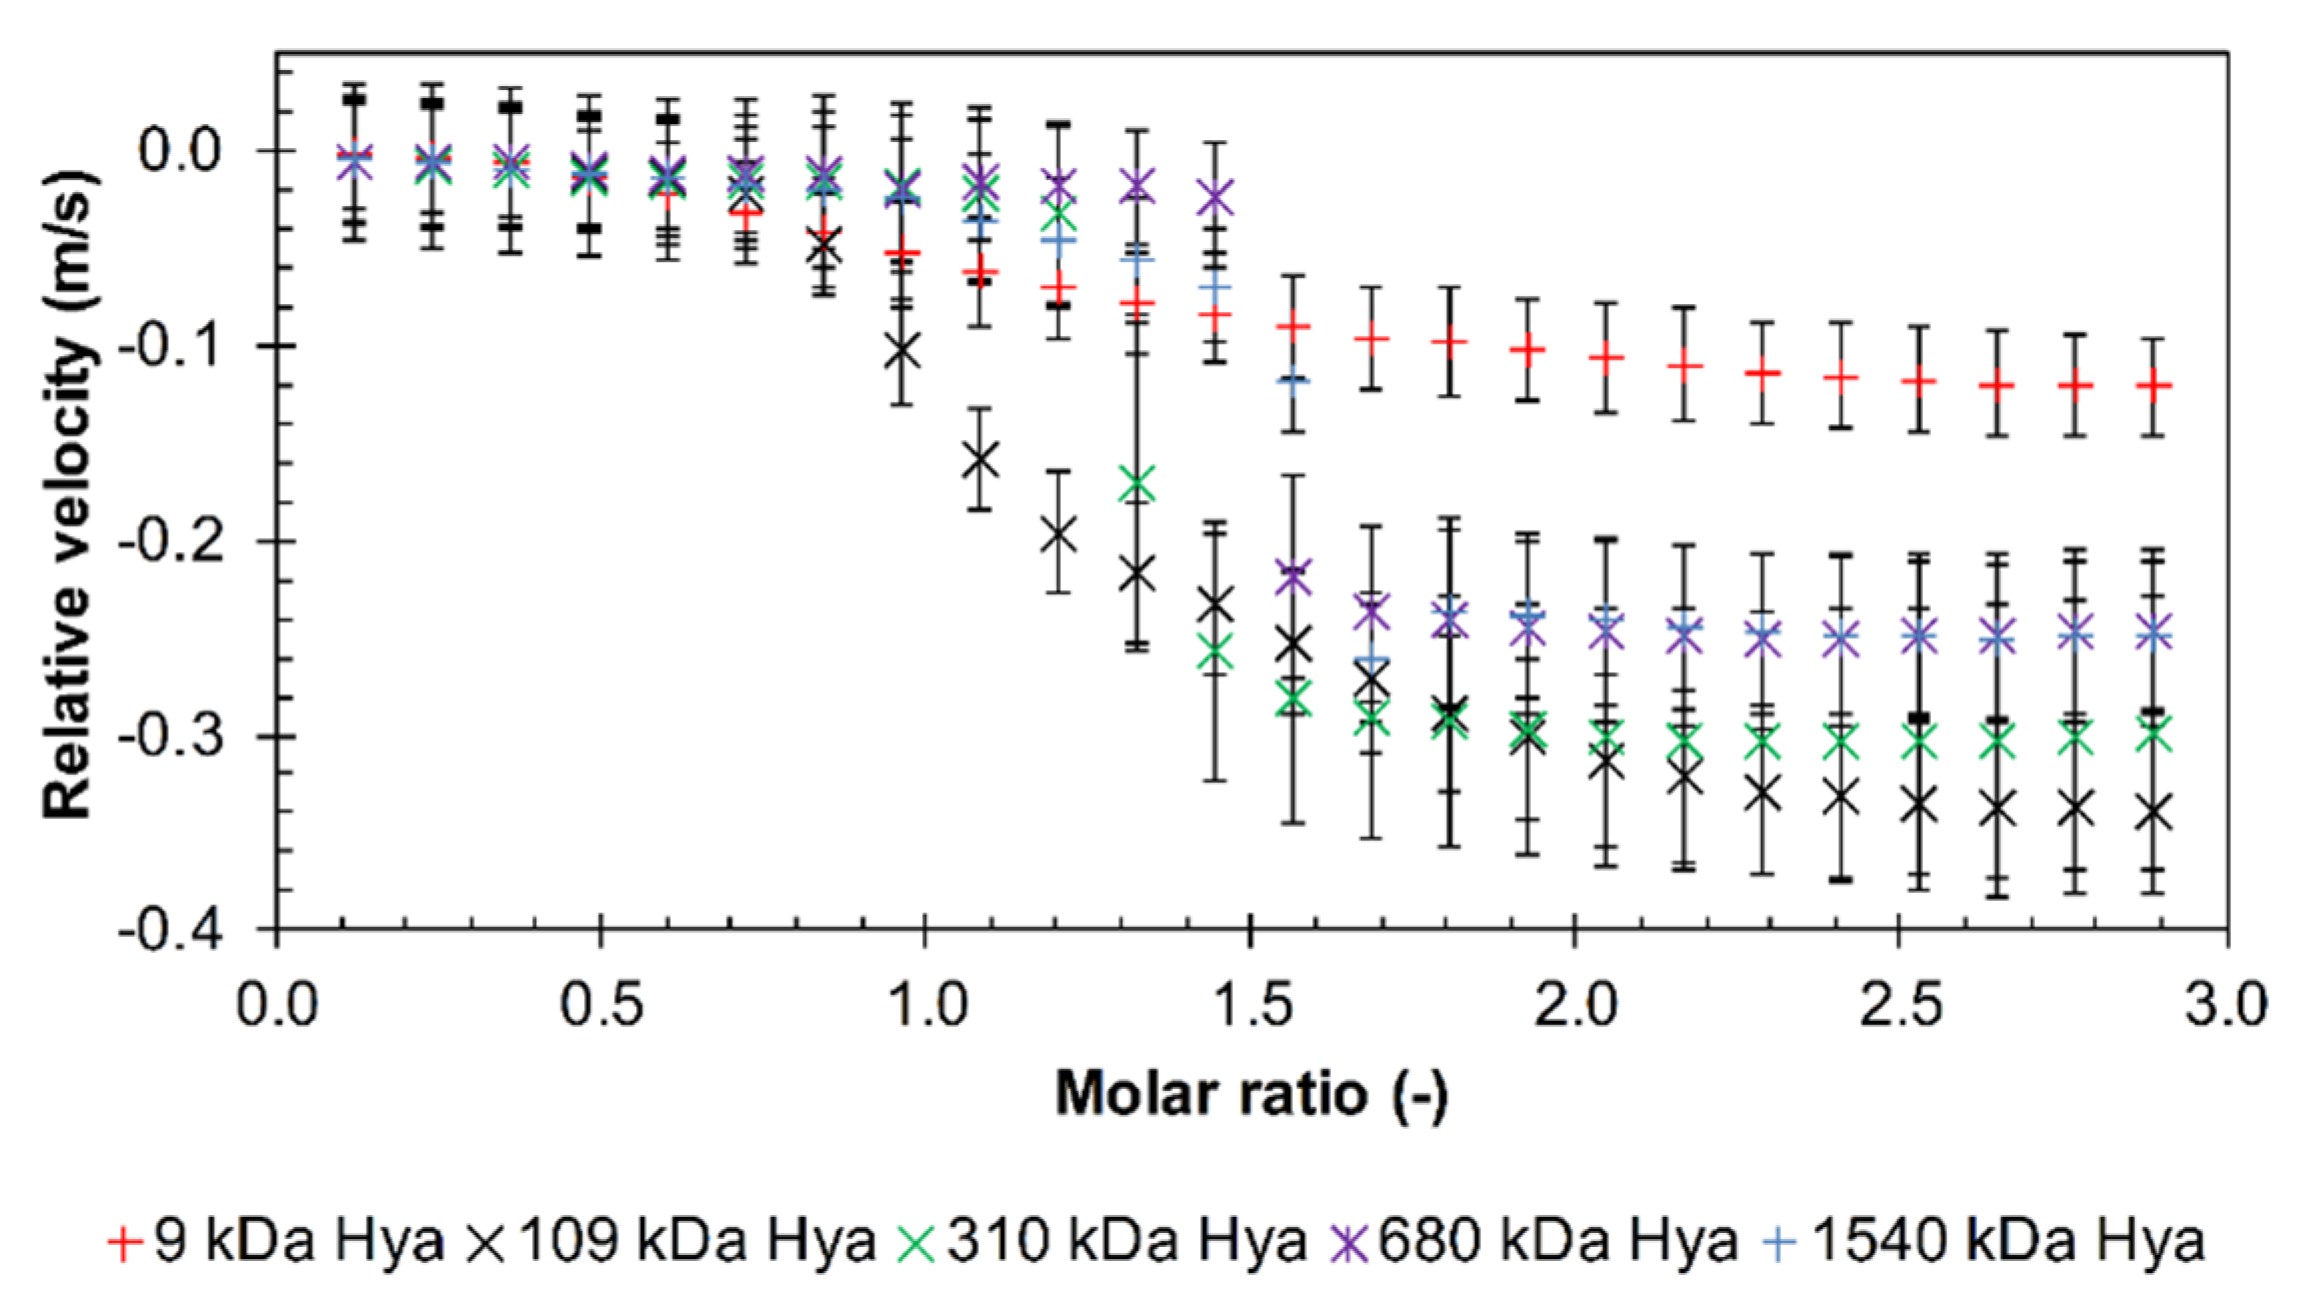
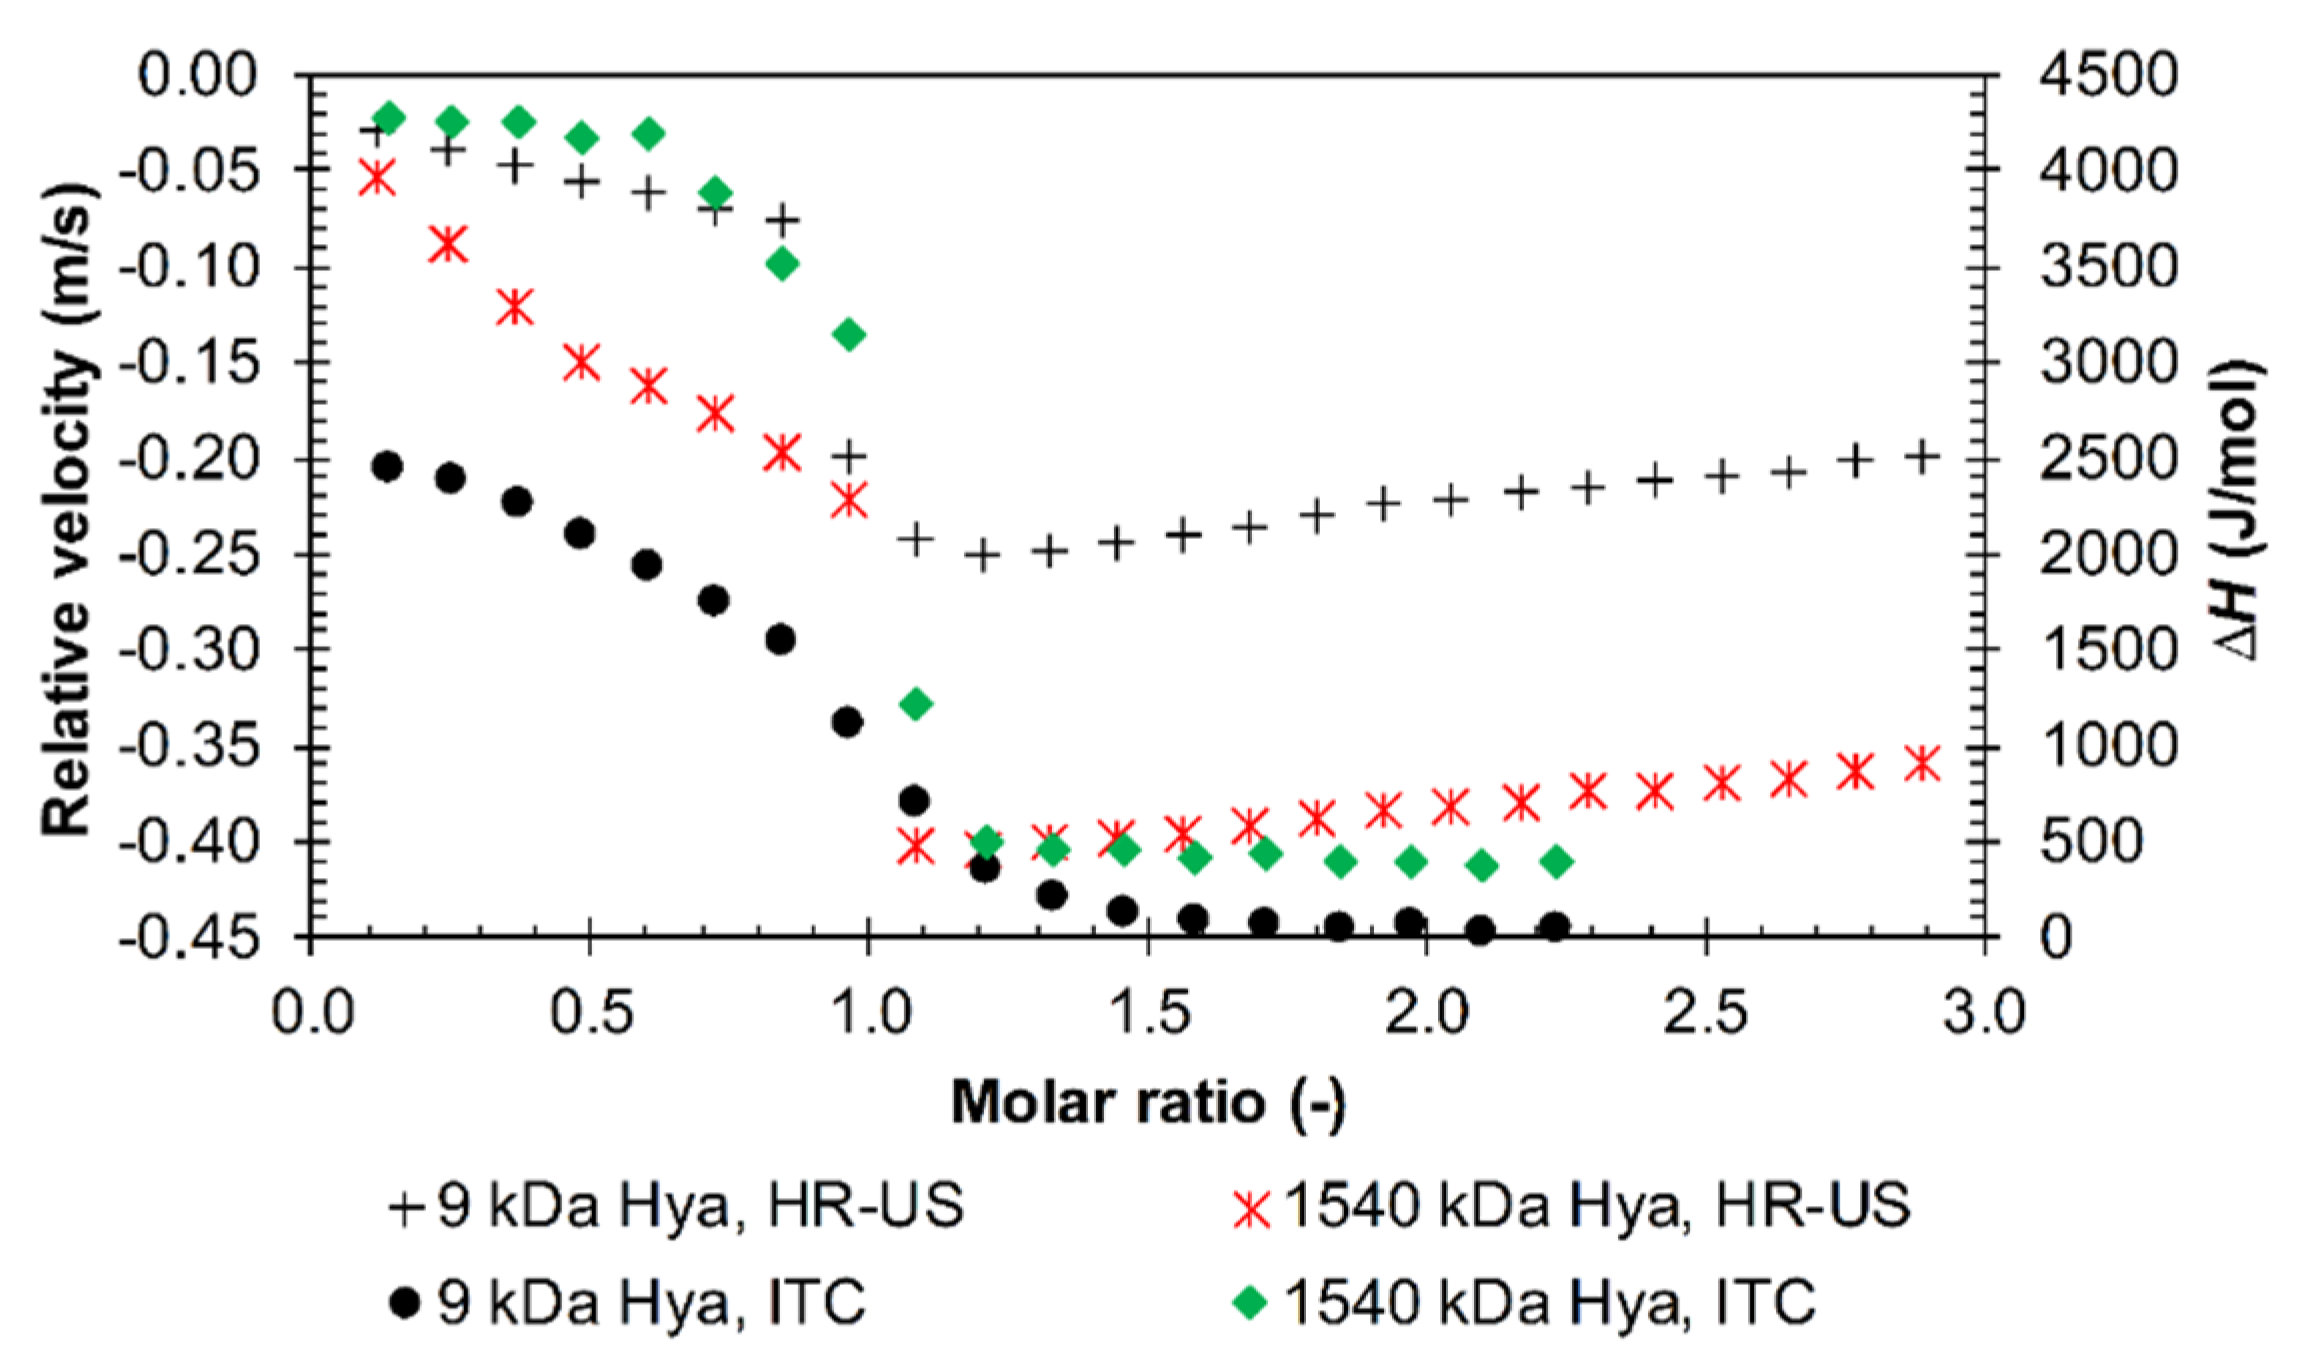
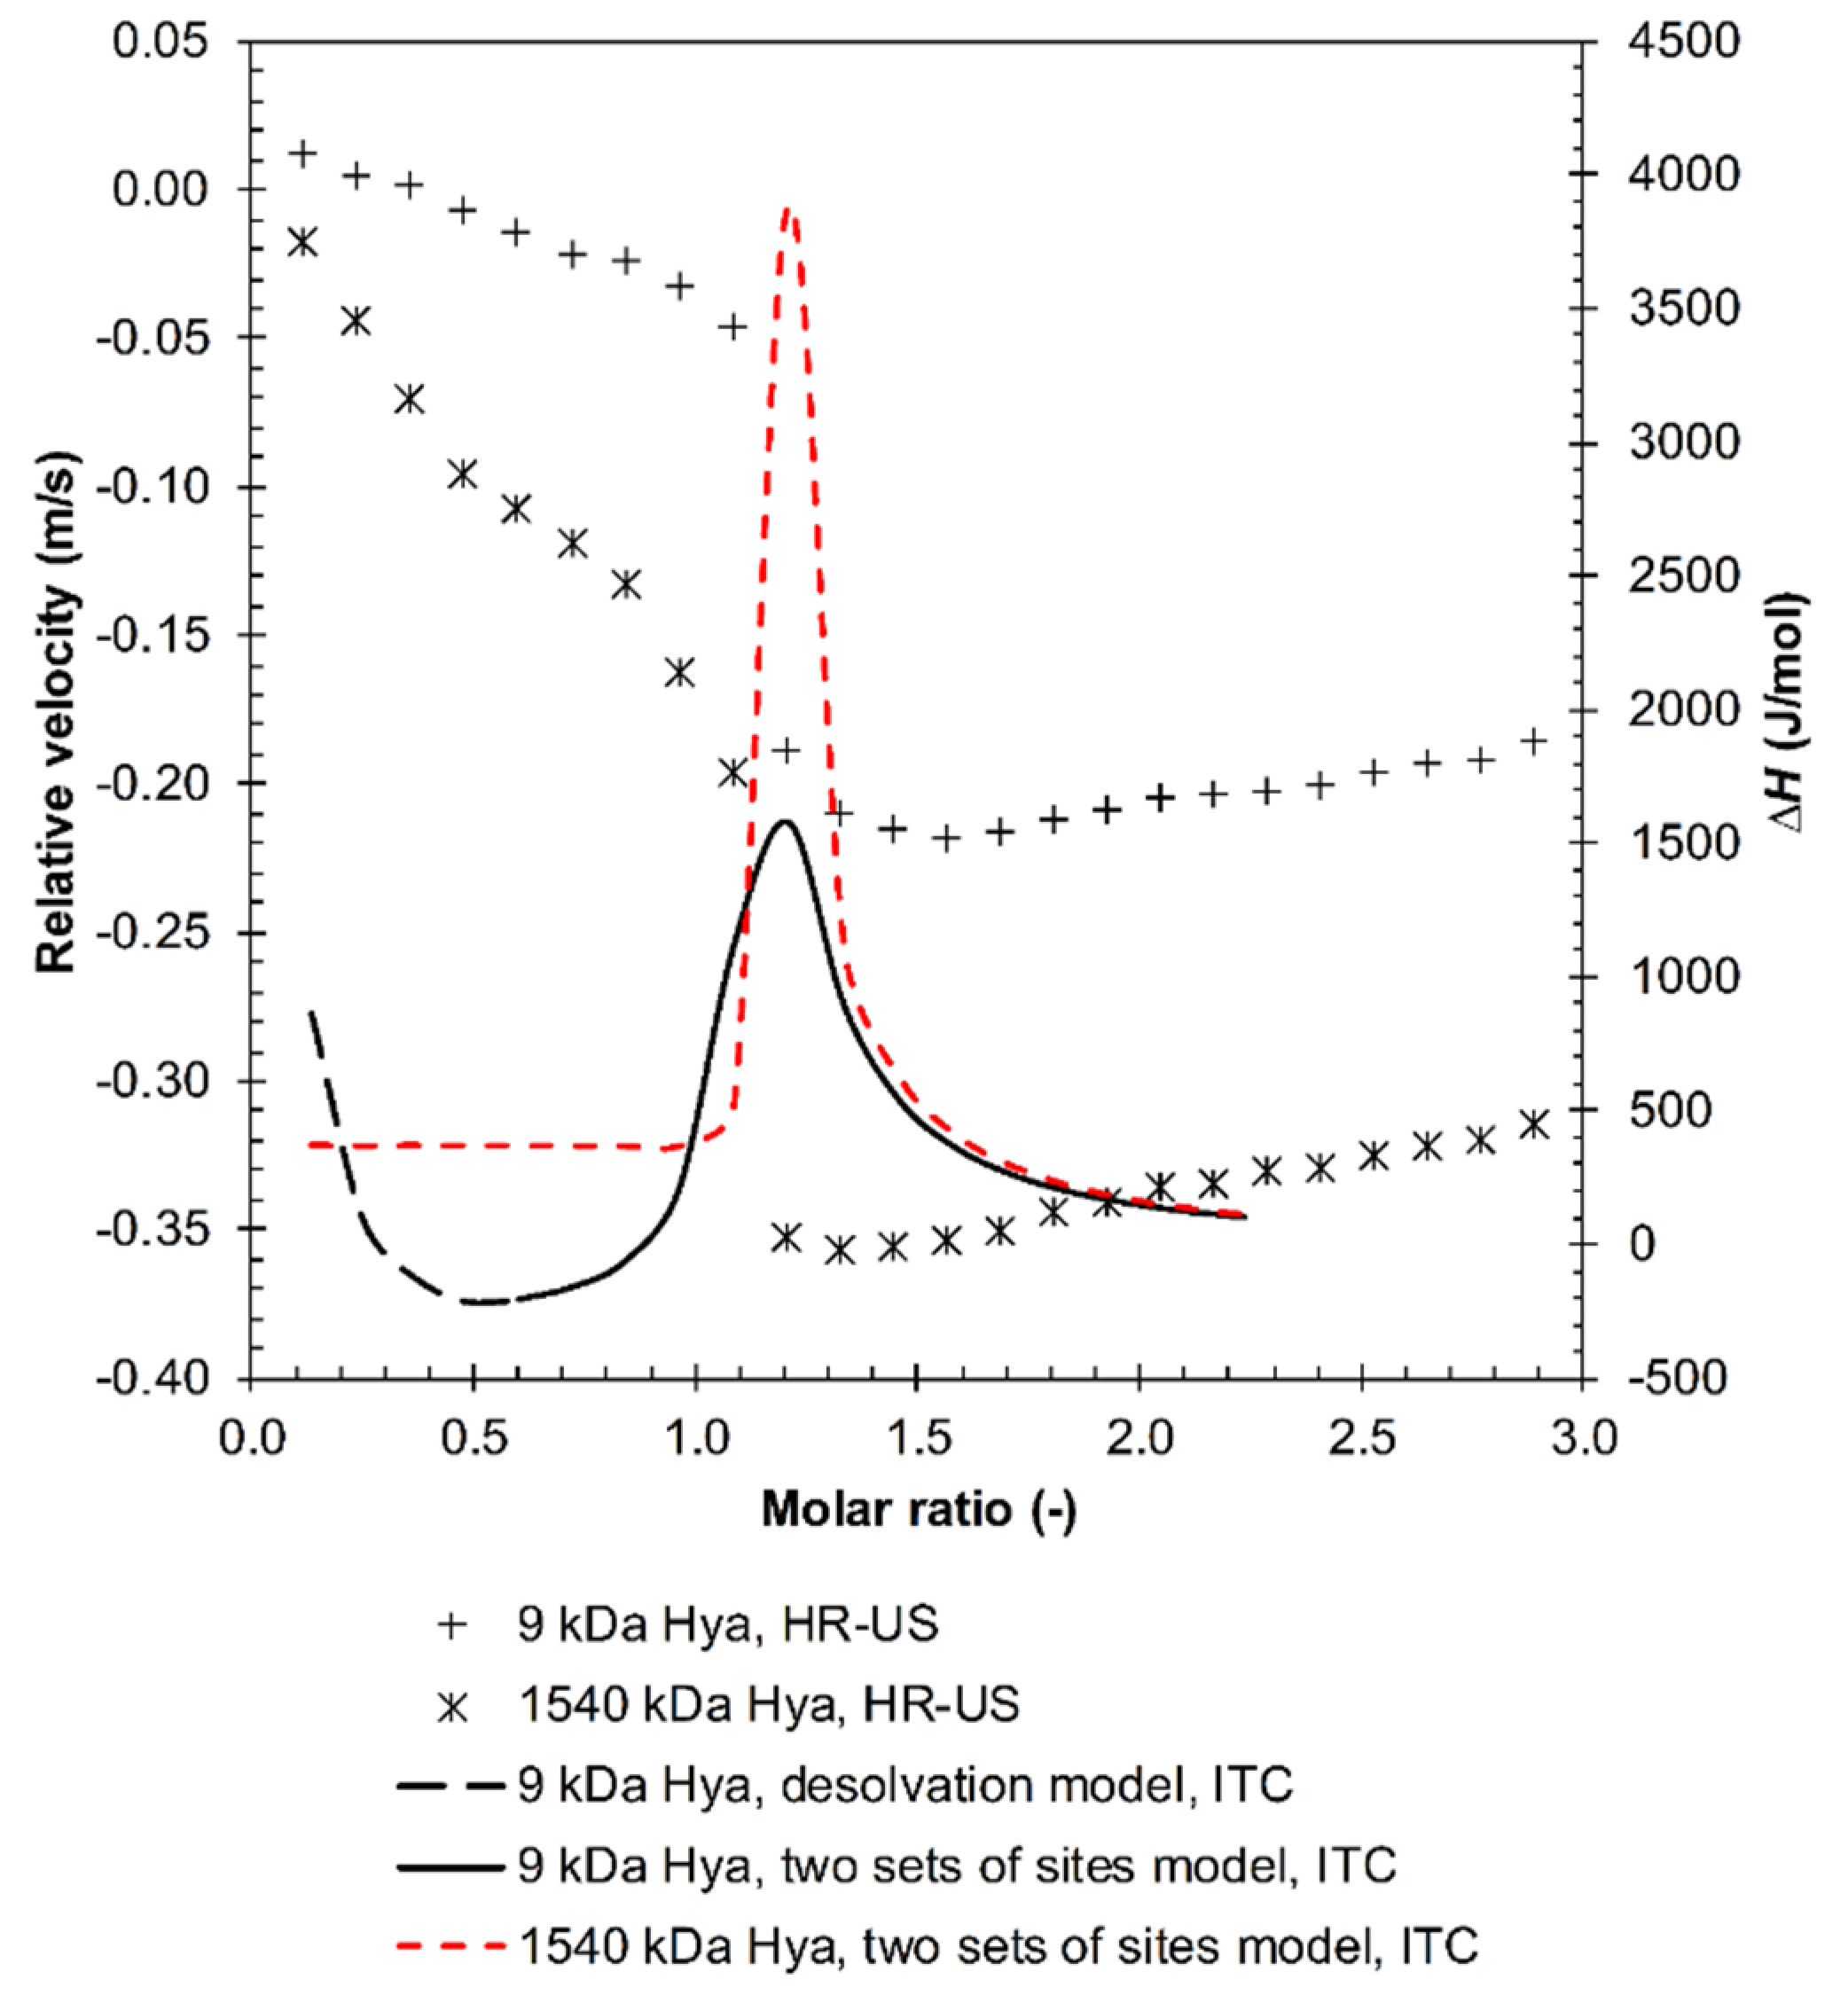
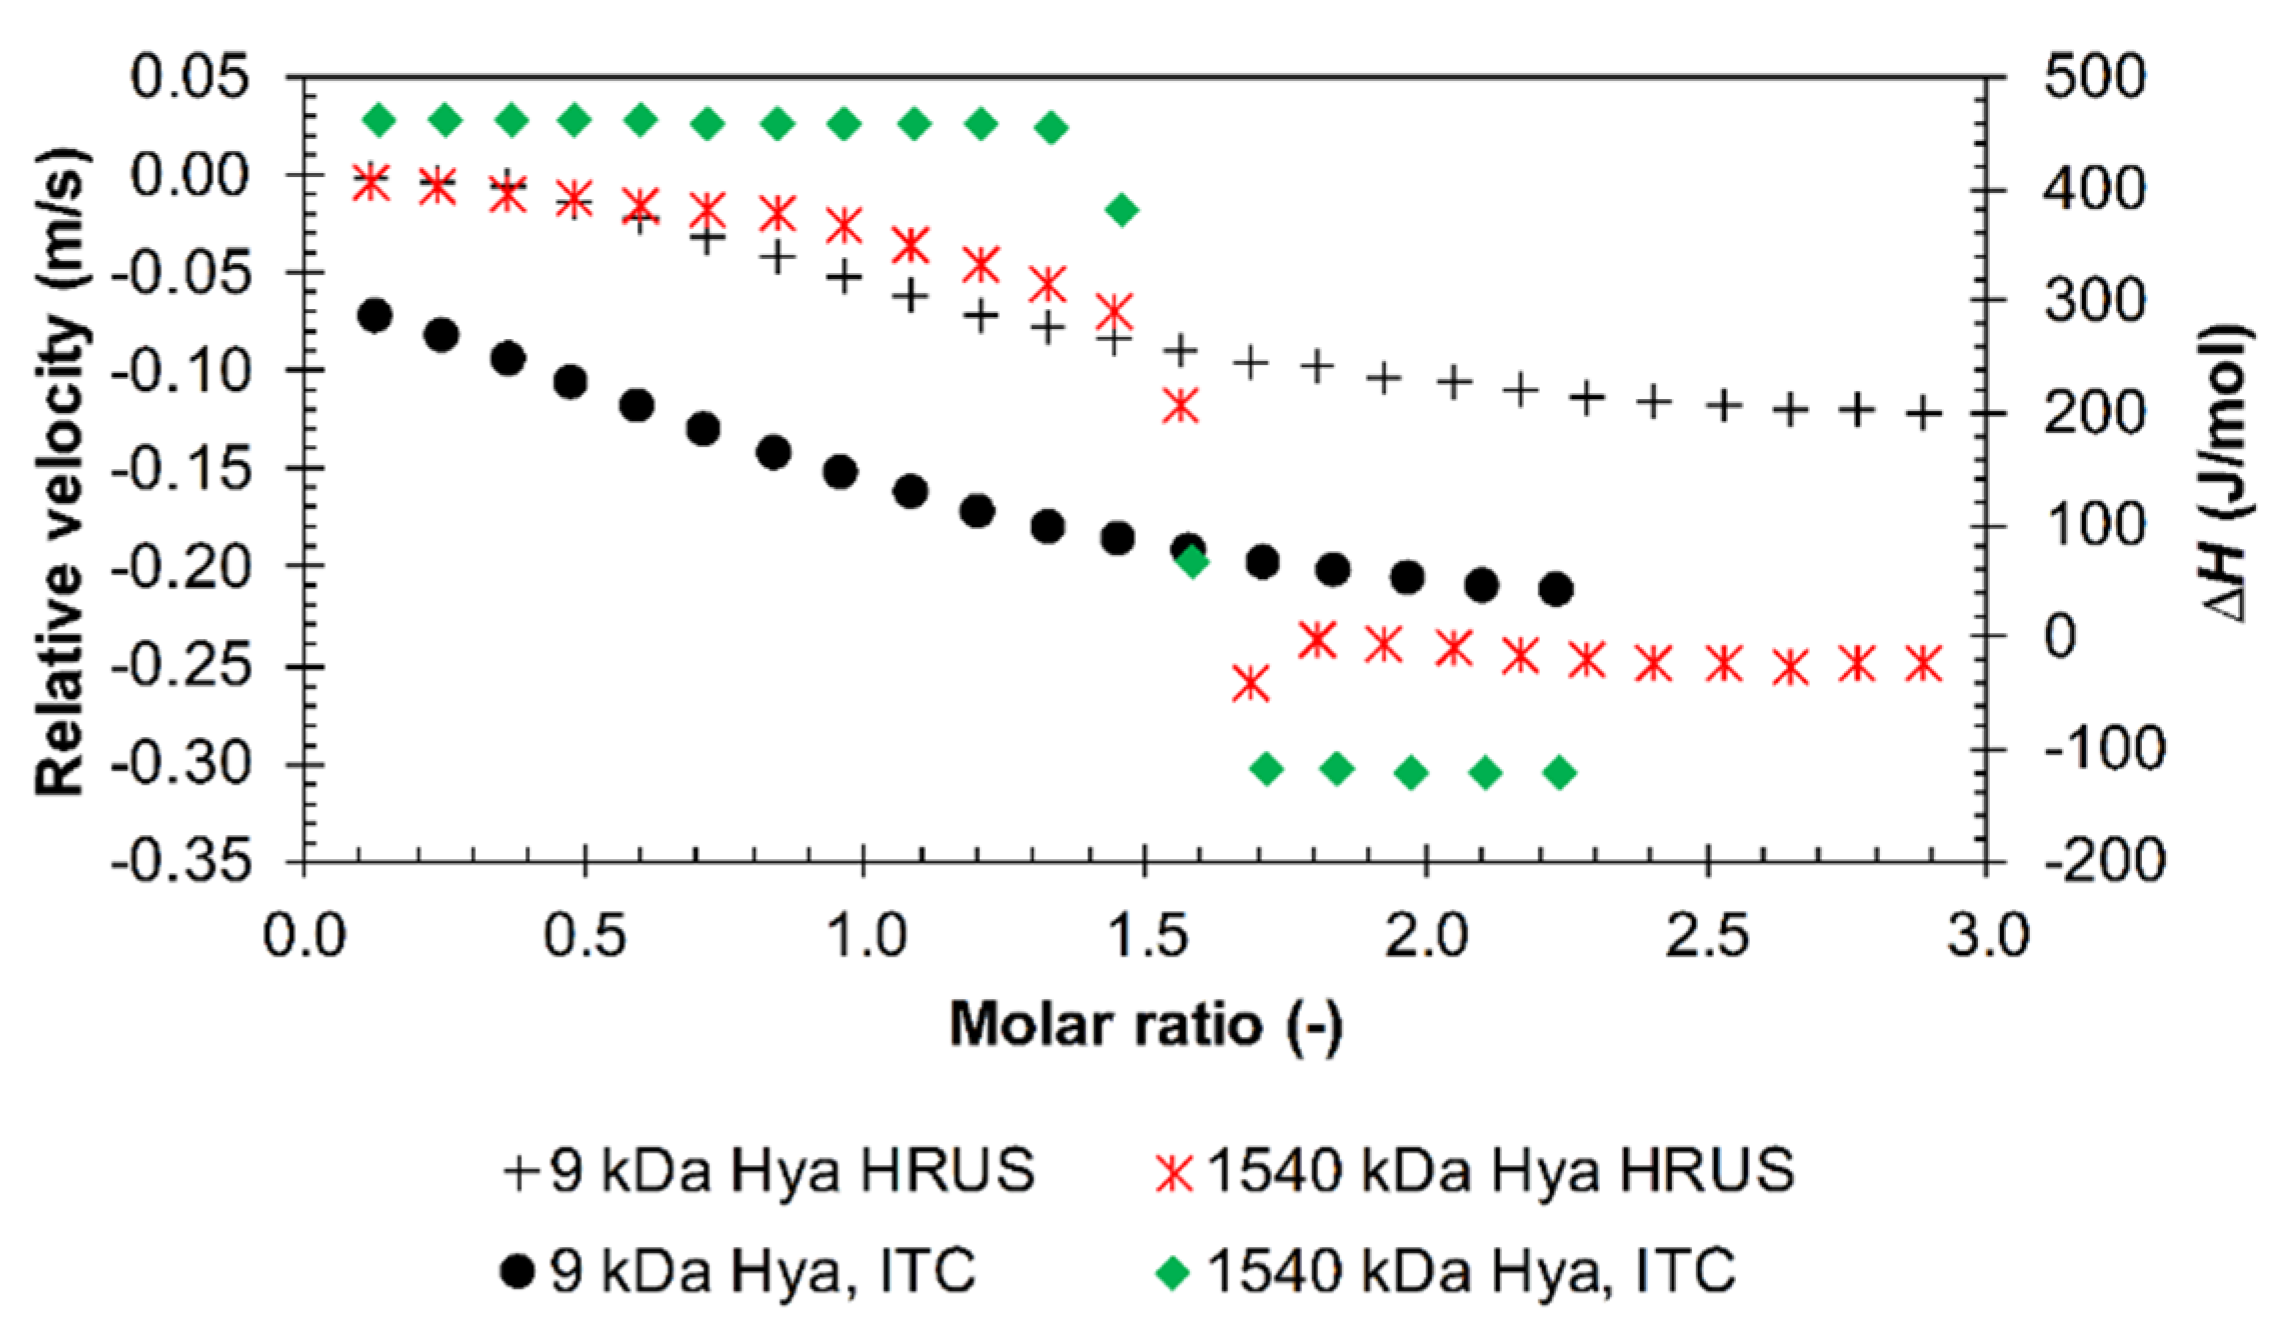
3.1. Results from High-Resolution Ultrasound Spectroscopy
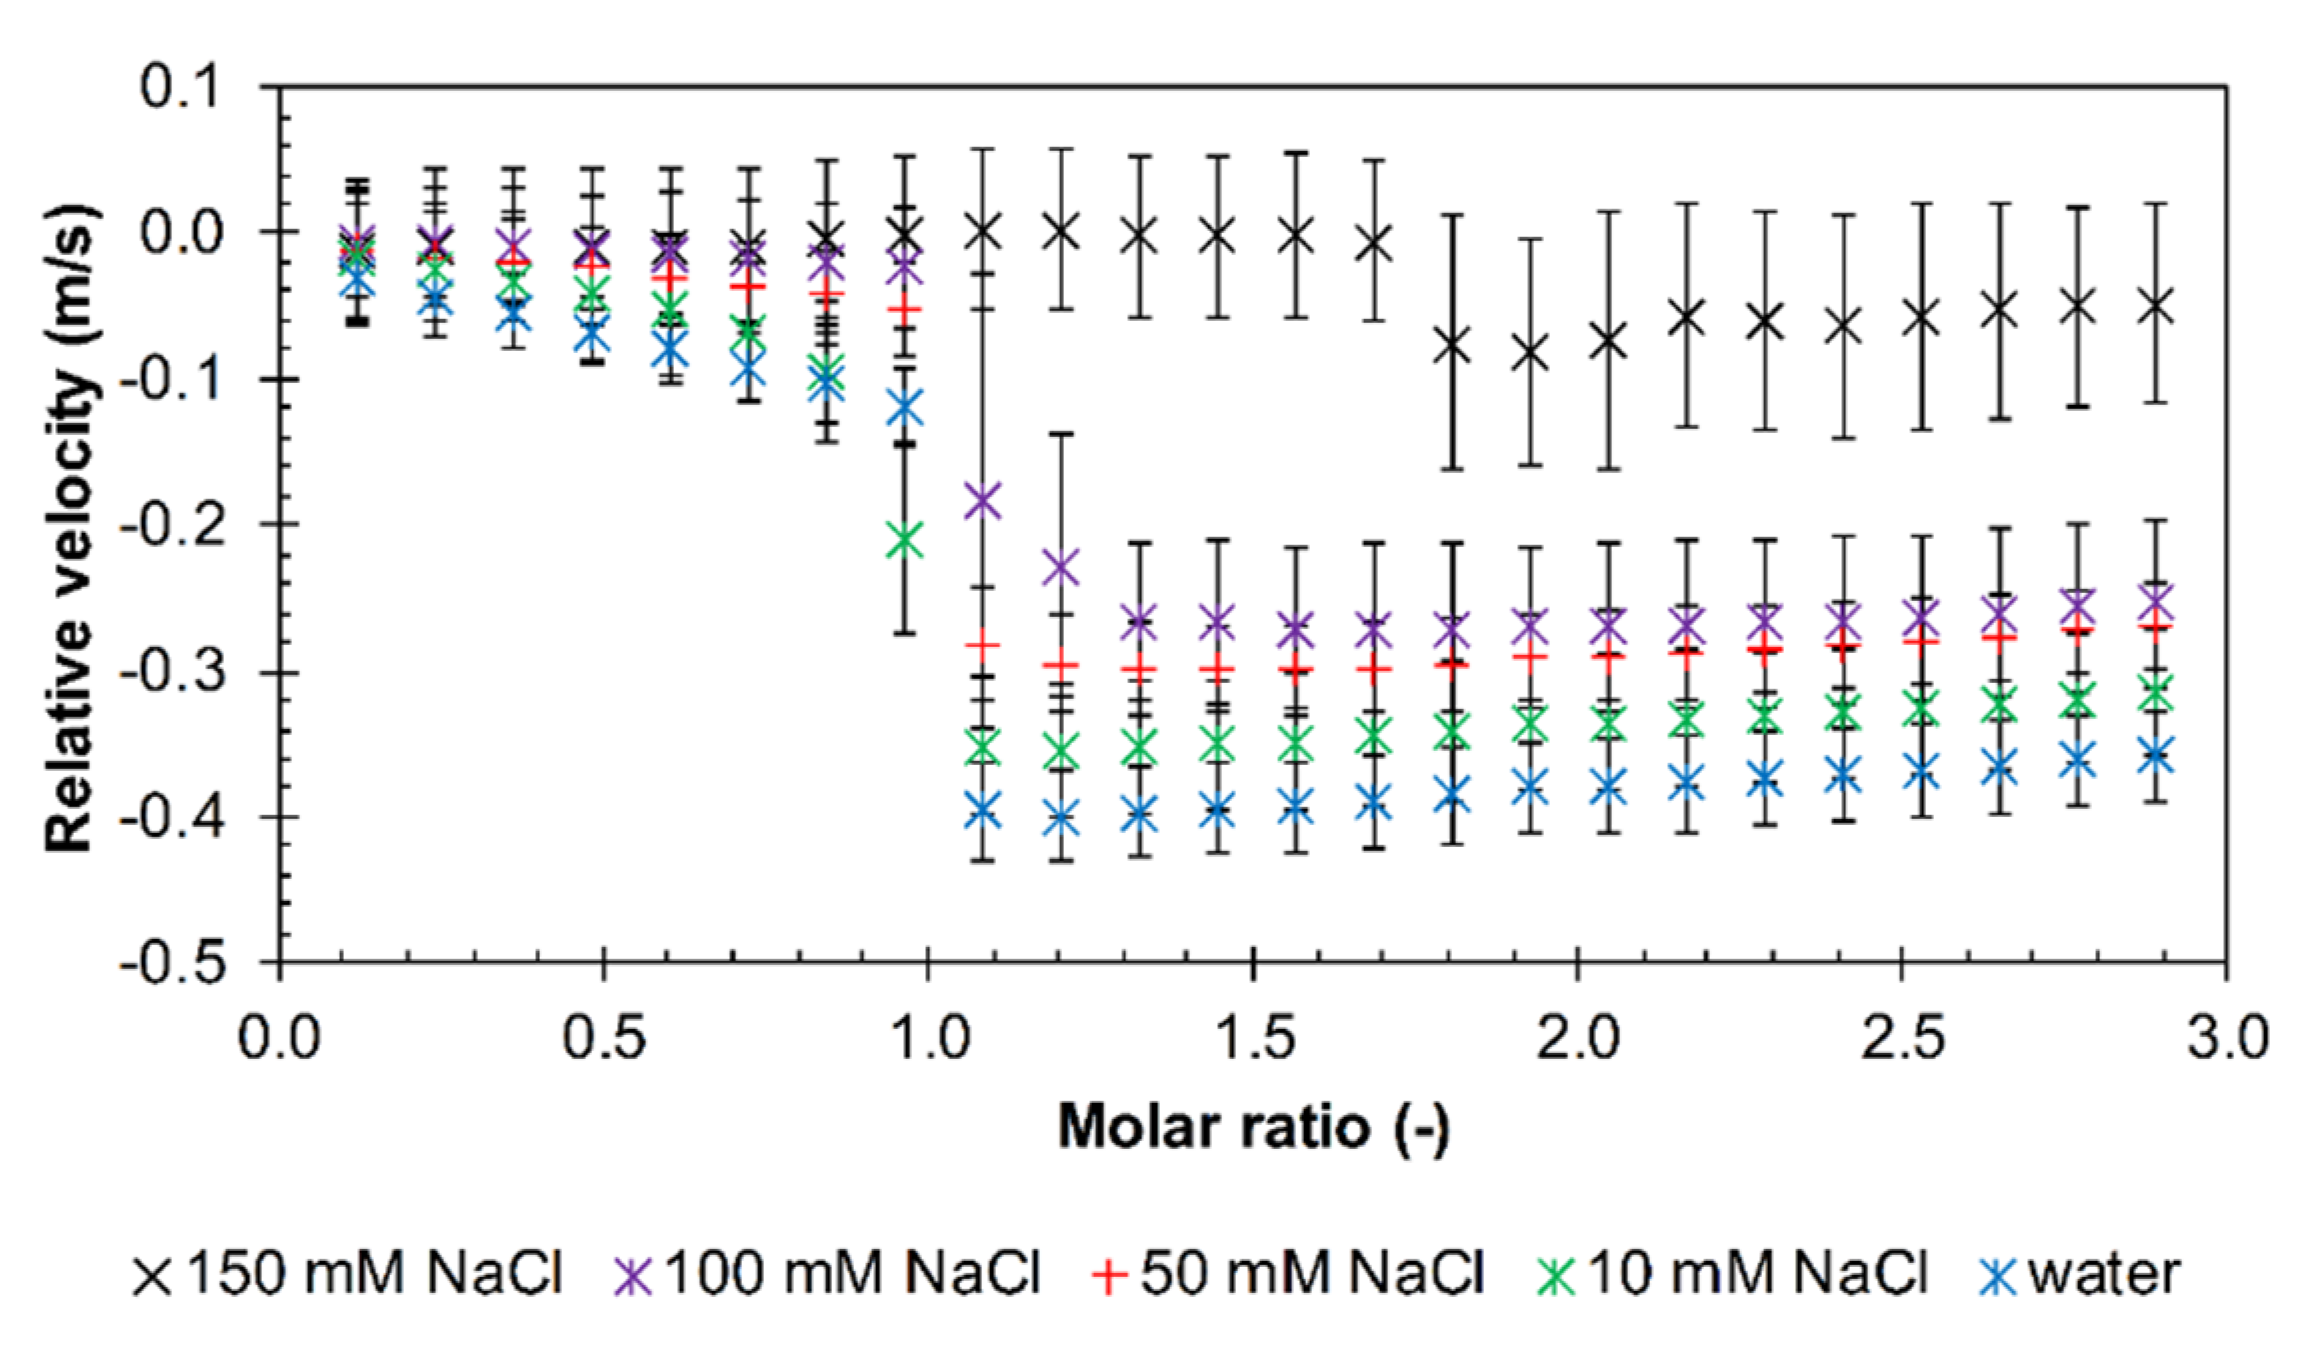
Influence of the Environment
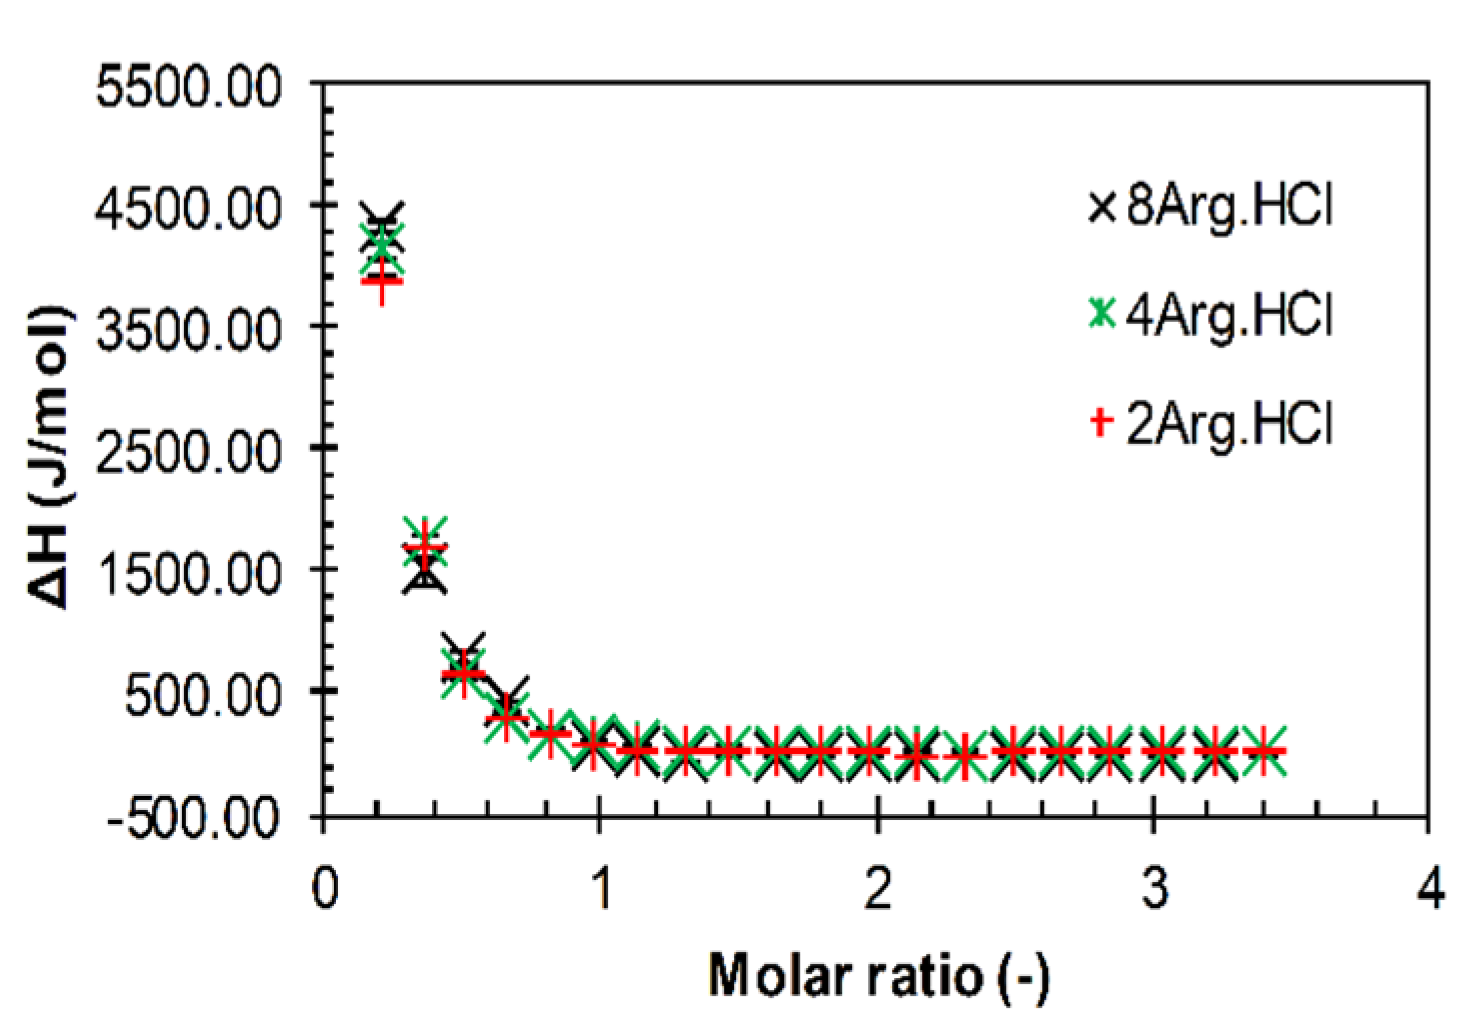
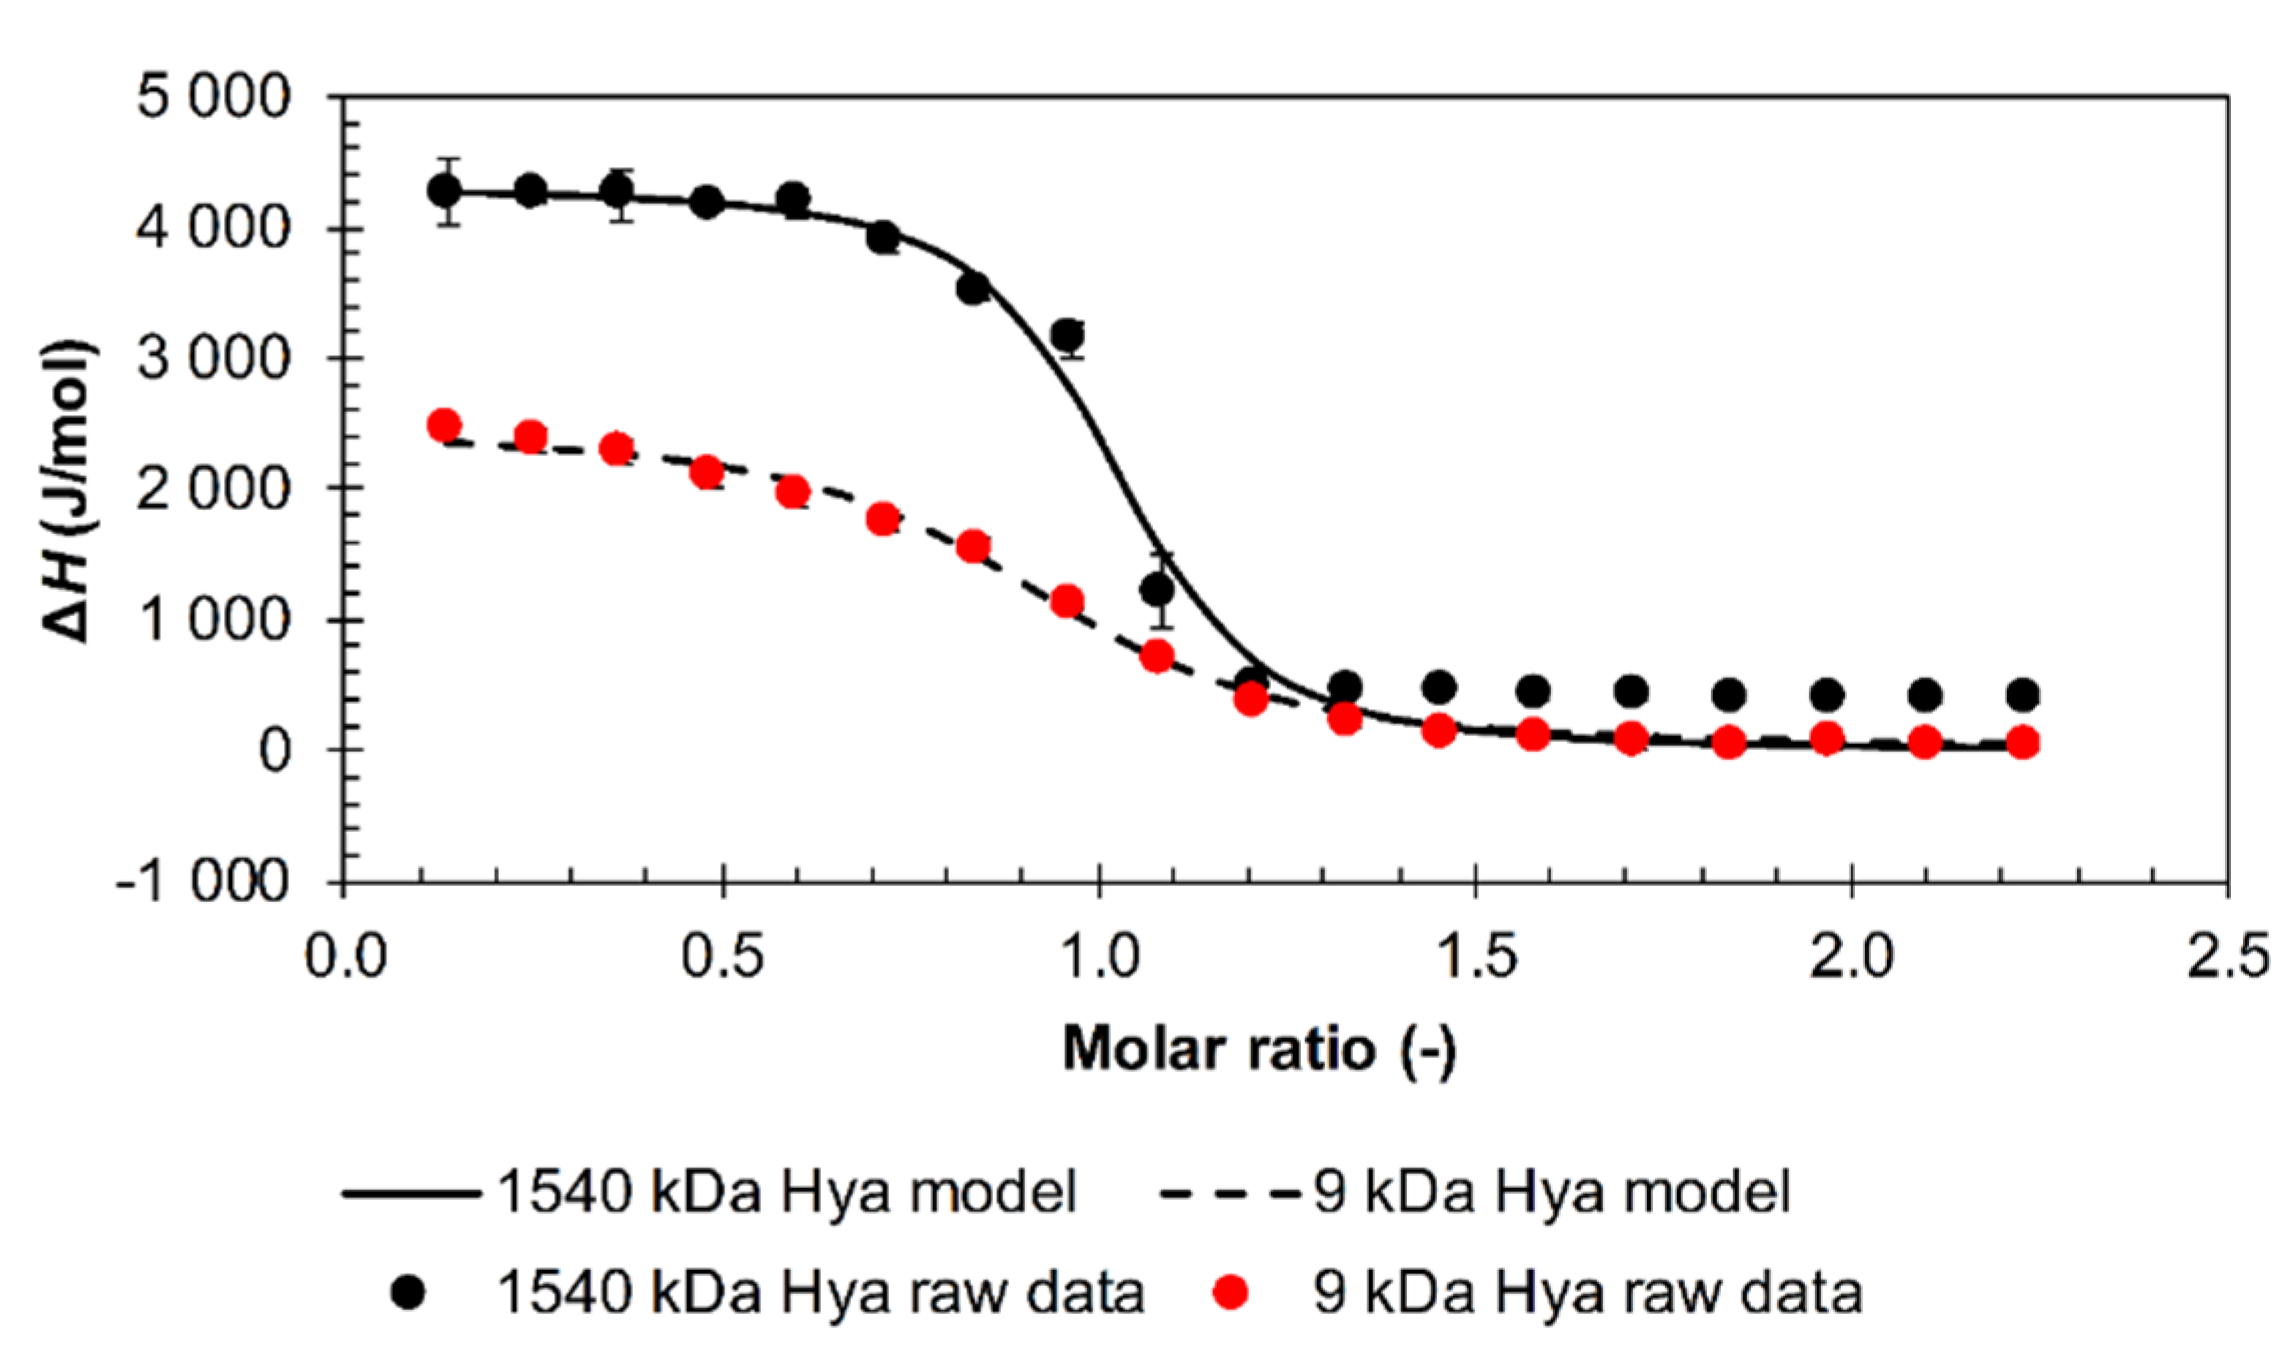
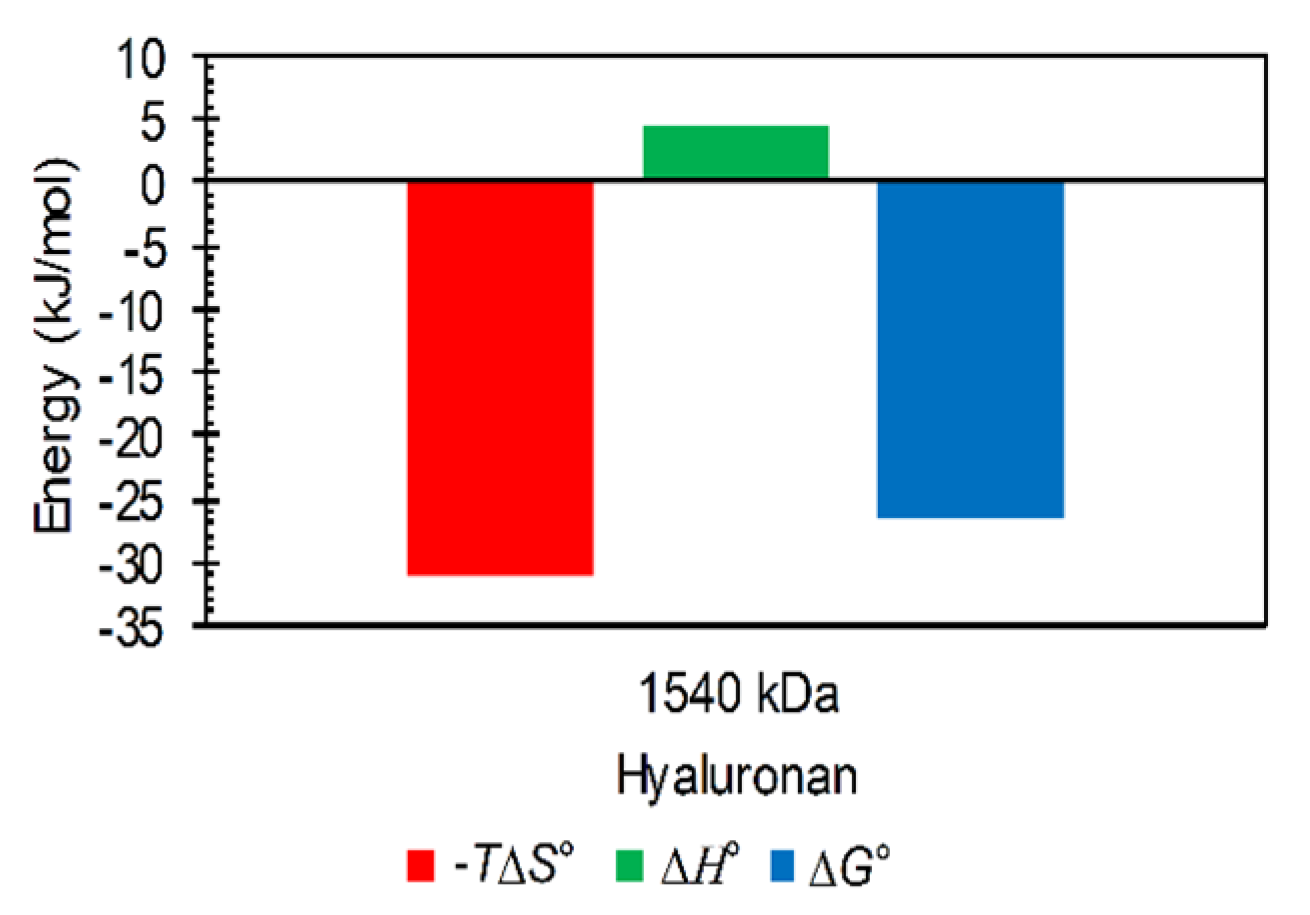
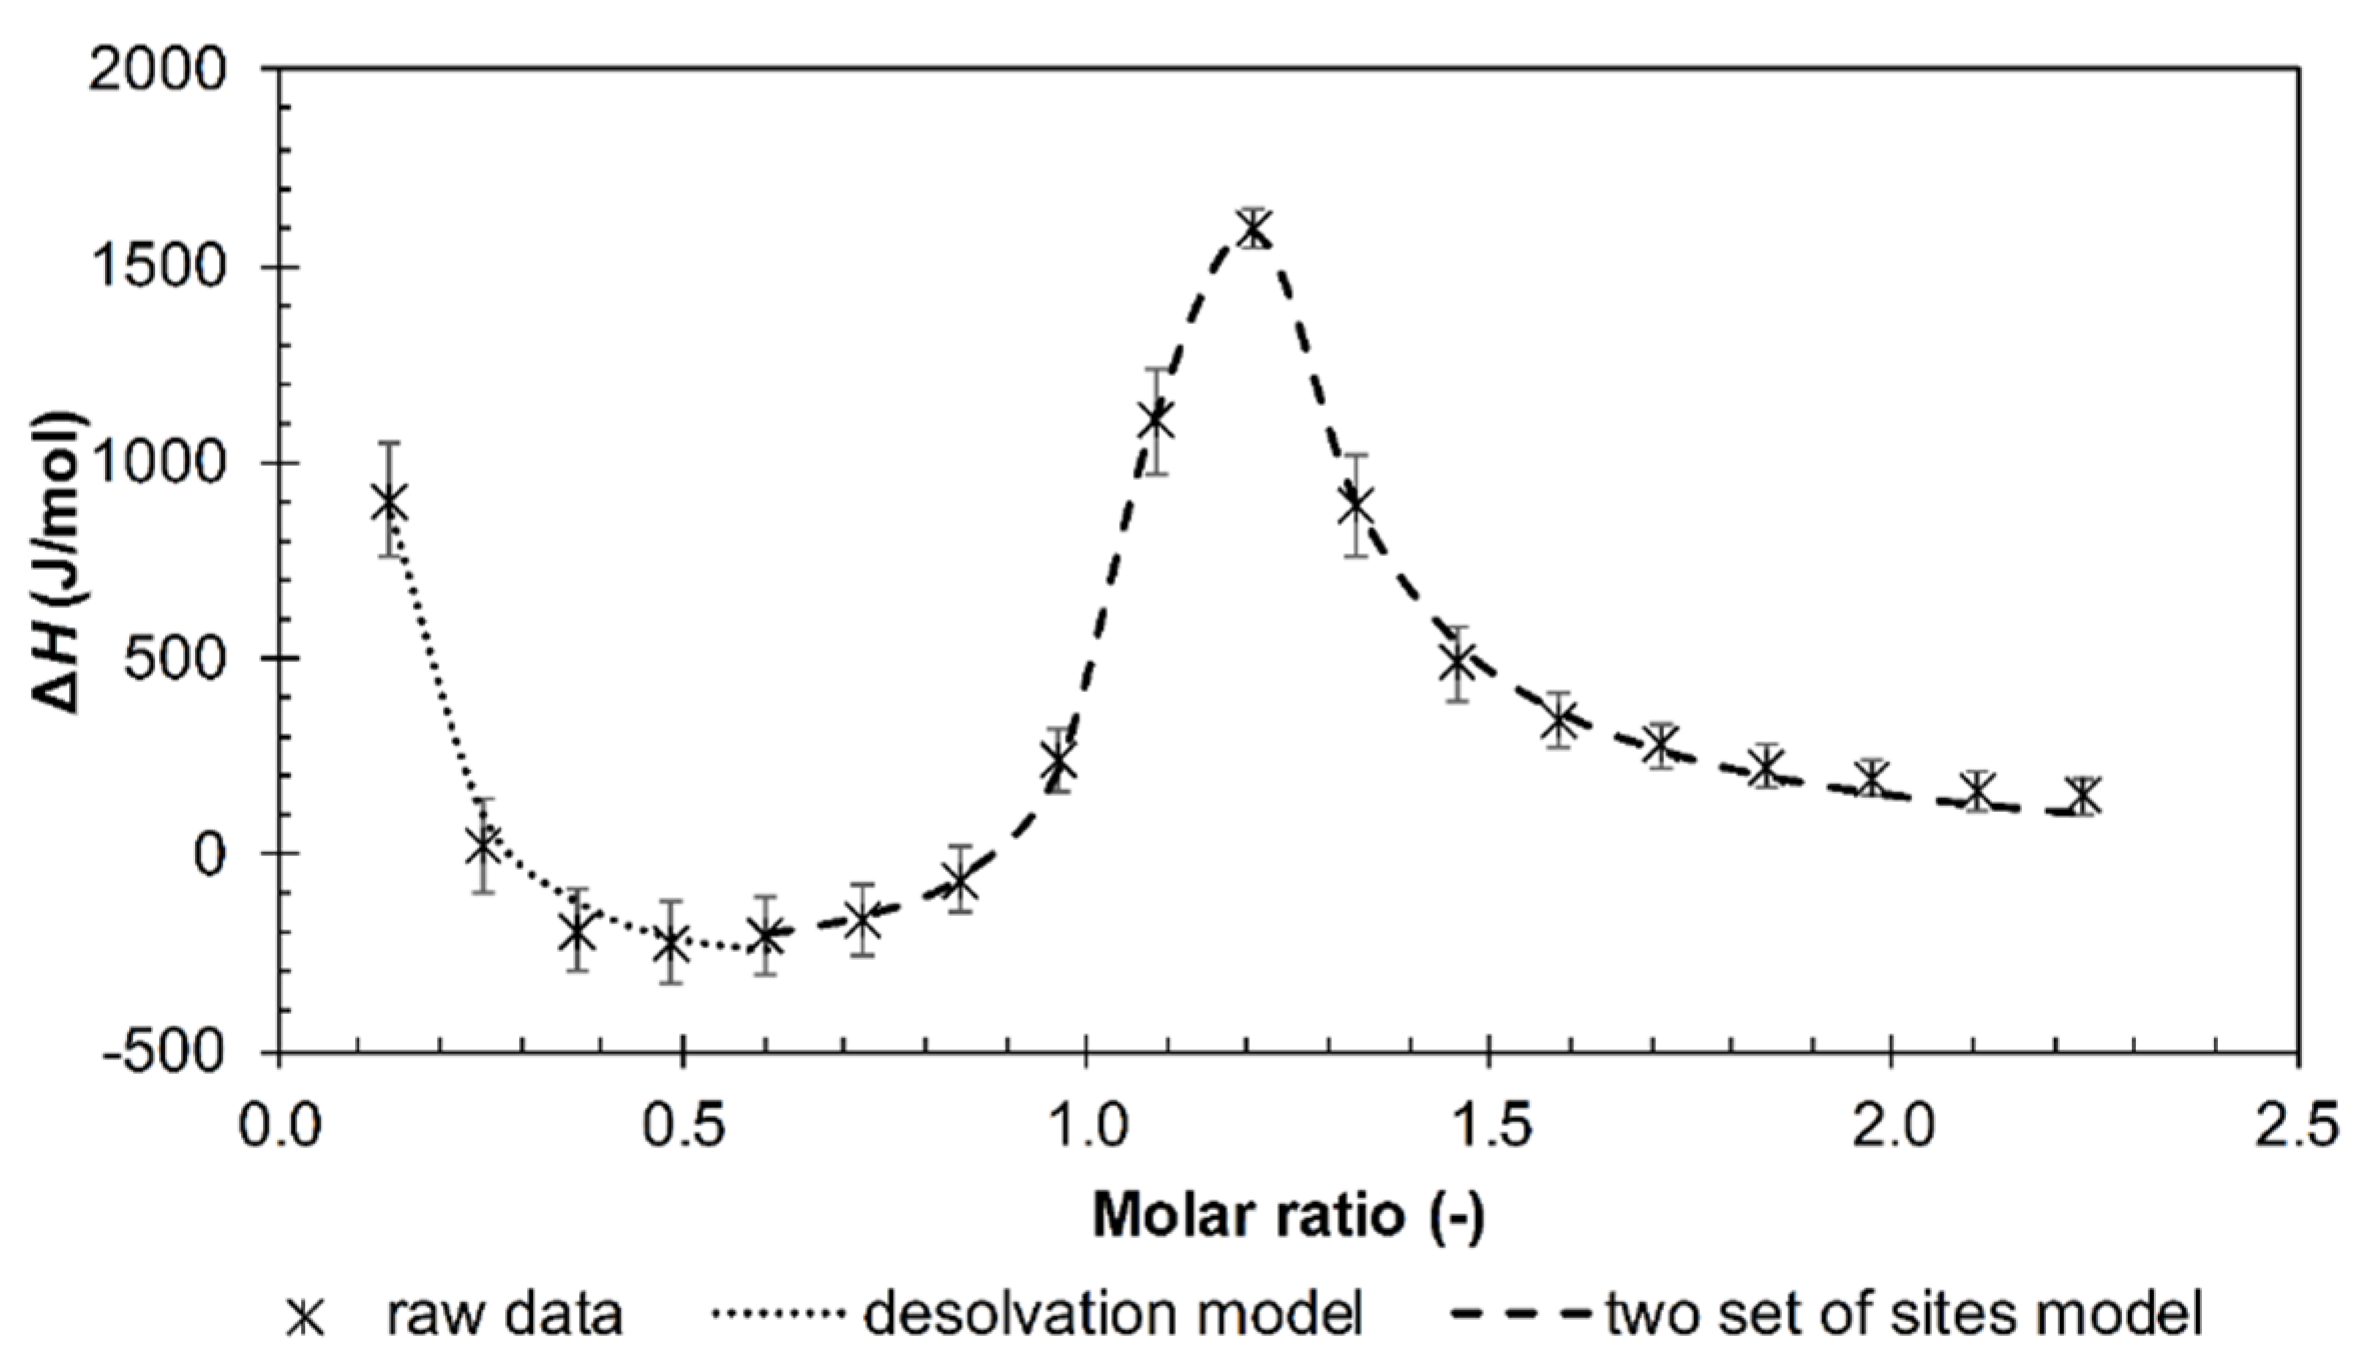
3.2. Results from ITC
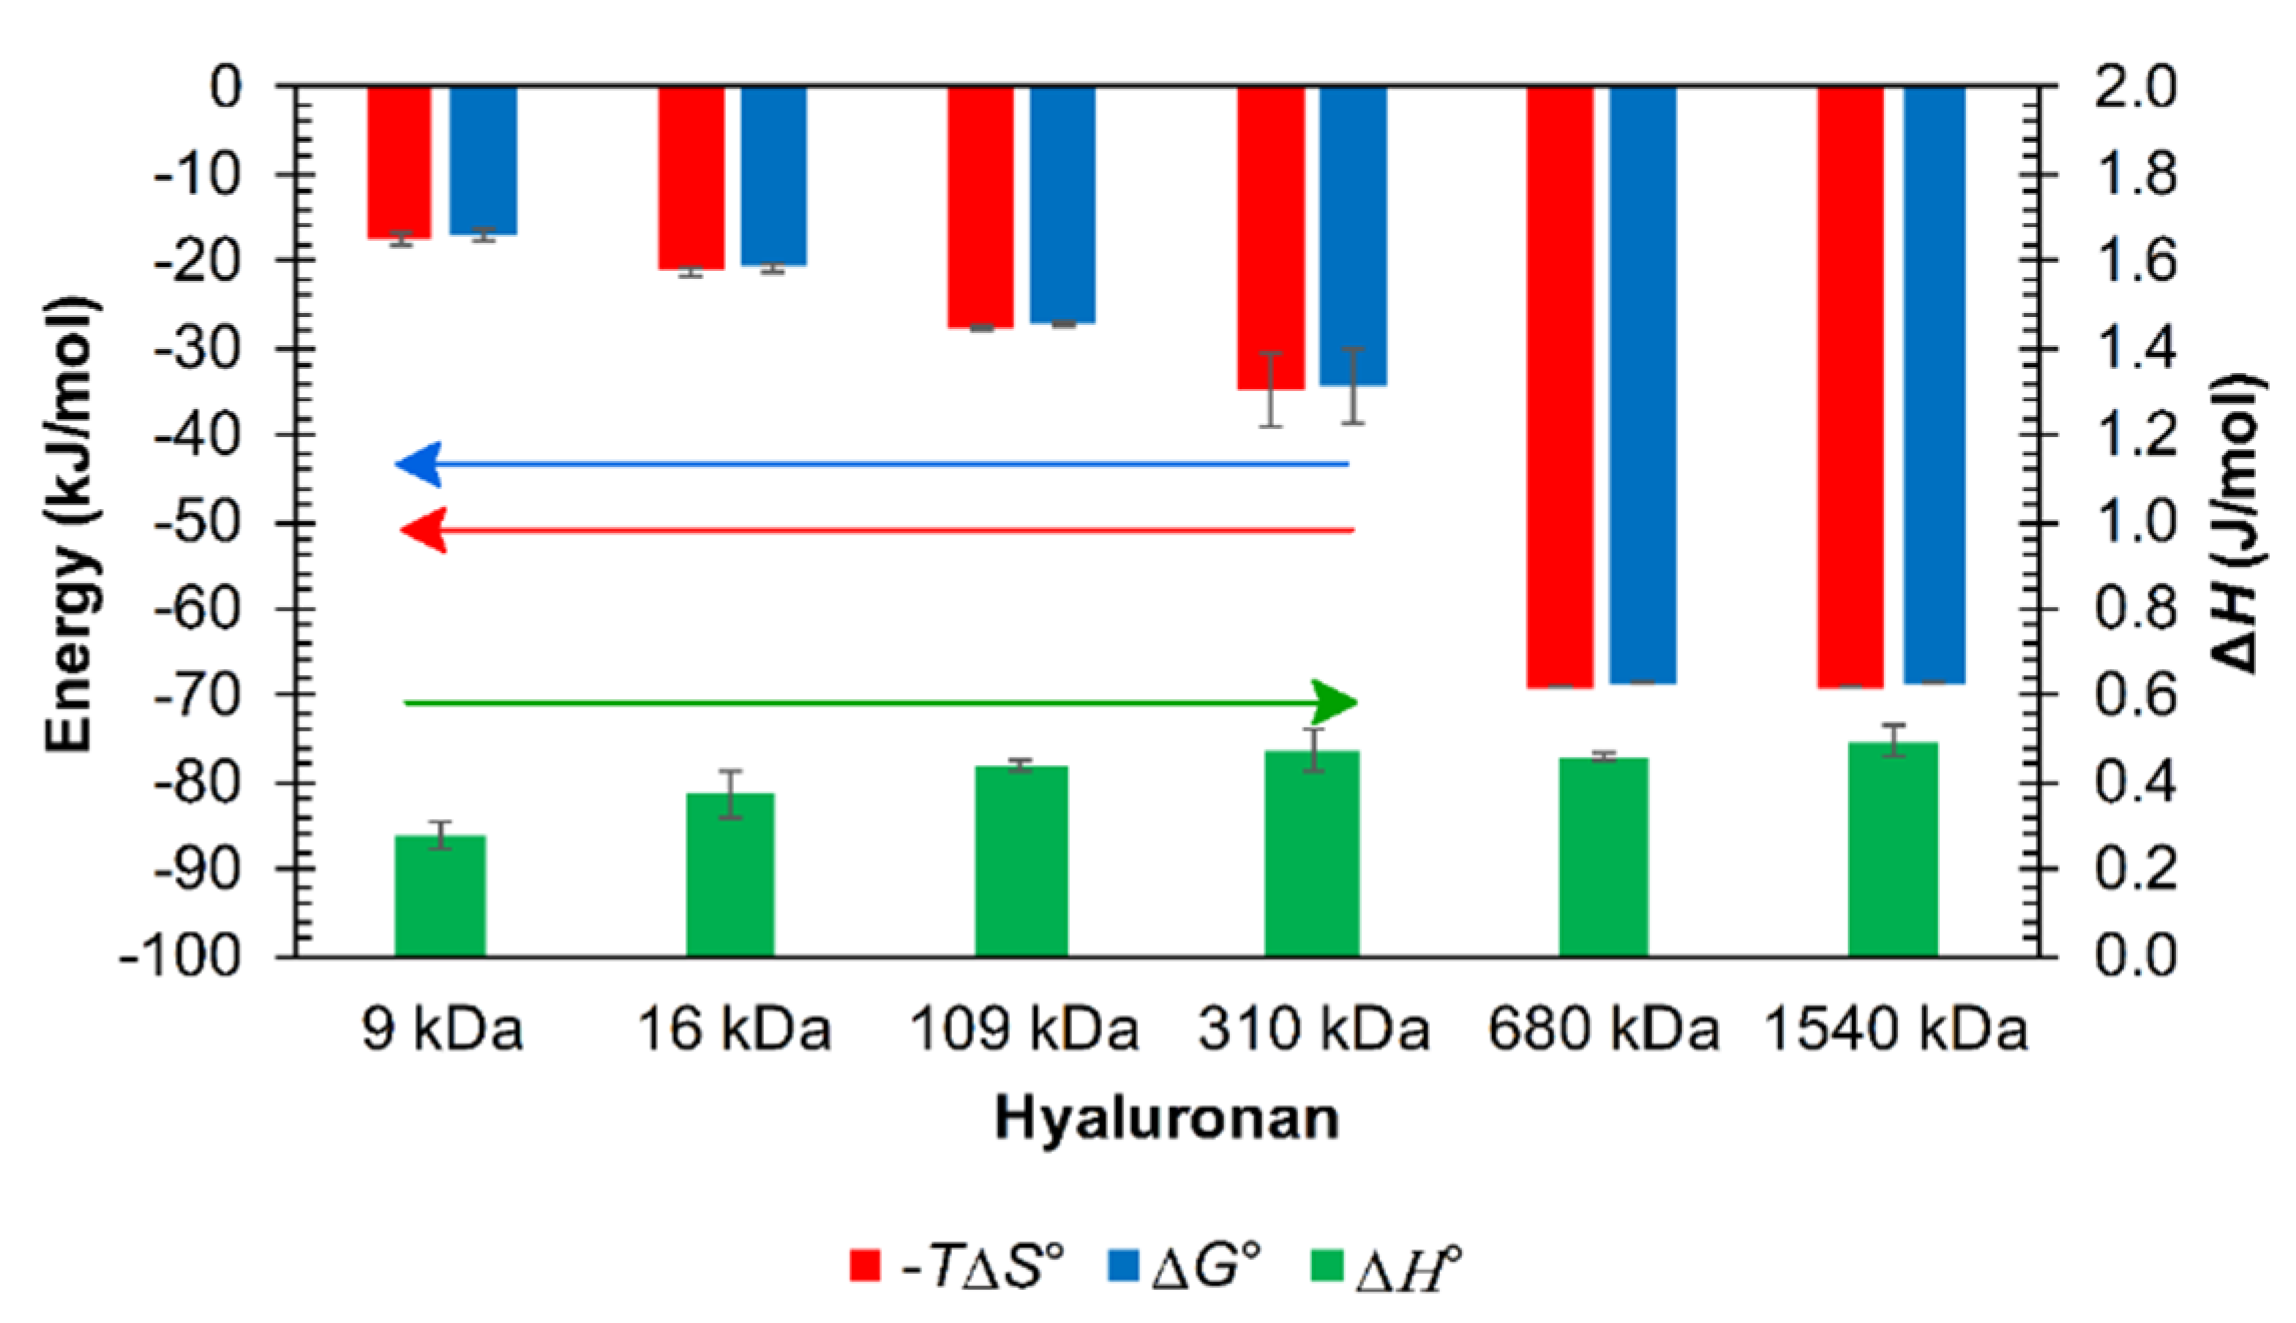
Influence of the Environment
4. Discussion
5. Conclusions
Supplementary Materials
Author Contributions
Funding
Conflicts of Interest
References
- Meyer, K.; Palmer, W.J. The Polysaccharide of the Vitreous Humor. J. Biol. Chem. 1934, 107, 629–634. [Google Scholar]
- Laurent, T.C.; Fraser, J.R.E. Hyaluronan. FASEB J. 1992, 6, 2397–2404. [Google Scholar] [CrossRef] [PubMed]
- Laurent, T.C.; Laurent, U.B.; Fraser, J.R. Functions of Hyaluronan. Ann. Rheum. Dis. 1995, 54, 429–432. [Google Scholar] [CrossRef] [PubMed]
- Laurent, T.C. Biochemistry of Hyaluronan. Acta Otolaryngol. 1987, 104 (Suppl. 442), 7–24. [Google Scholar] [CrossRef]
- Girish, K.S.; Kemparaju, K. The Magic Glue Hyaluronan and Its Eraser Hyaluronidase: A Biological Overview. Life Sci. 2007, 80, 1921–1943. [Google Scholar] [CrossRef] [PubMed]
- Steinbuchel, A.; Hofrichter, M. Biopolymers; Wiley-VCH Verlag GmbH: Hoboken, NJ, USA, 2003; pp. 379–390. [Google Scholar]
- Toole, B.P. Hyaluronan and Its Binding Proteins, the Hyaladherins. Curr. Opin. Cell Biol. 1990, 2, 839–844. [Google Scholar] [CrossRef]
- Ponta, H.; Sherman, L.; Herrlich, P.A. CD44: From Adhesion Molecules to Signalling Regulators. Nat. Rev. Mol. Cell Biol. 2003, 4, 33–45. [Google Scholar] [CrossRef]
- Leite, M.L.; da Cunha, N.B.; Costa, F.F. Antimicrobial Peptides, Nanotechnology, and Natural Metabolites as Novel Approaches for Cancer Treatment. Pharmacol. Ther. 2018, 183, 160–176. [Google Scholar] [CrossRef]
- Almond, A. Hyaluronan. Cell. Mol. Life Sci. 2007, 64, 1591–1596. [Google Scholar] [CrossRef]
- Chytil, M.; Trojan, M.; Kovalenko, A. Study on Mutual Interactions and Electronic Structures of Hyaluronan with Lysine, 6-Aminocaproic Acid and Arginine. Carbohydr. Polym. 2016, 142, 8–15. [Google Scholar] [CrossRef]
- Karousou, E.; Misra, S.; Ghatak, S.; Dobra, K.; Götte, M.; Vigetti, D.; Passi, A.; Karamanos, N.K.; Skandalis, S.S. Roles and Targeting of the HAS/Hyaluronan/CD44 Molecular System in Cancer. Matrix Biol. 2017, 59, 3–22. [Google Scholar] [CrossRef] [PubMed]
- Vuorio, J.; Vattulainen, I.; Martinez-Seara, H. Atomistic Fingerprint of Hyaluronan–CD44 Binding. PLoS Comput. Biol. 2017, 13, e1005663. [Google Scholar] [CrossRef]
- Nagae, M.; Yamaguchi, Y. Three-Dimensional Structural Aspects of Protein–Polysaccharide Interactions. Int. J. Mol. Sci. 2014, 15, 3768–3783. [Google Scholar] [CrossRef] [PubMed]
- Rao, N.V.; Yoon, H.Y.; Han, H.S.; Ko, H.; Son, S.; Lee, M.; Lee, H.; Jo, D.-G.; Kang, Y.M.; Park, J.H. Recent Developments in Hyaluronic Acid-Based Nanomedicine for Targeted Cancer Treatment. Expert Opin. Drug Deliv. 2016, 13, 239–252. [Google Scholar] [CrossRef]
- Banerji, S.; Wright, A.J.; Noble, M.; Mahoney, D.J.; Campbell, I.D.; Day, A.J.; Jackson, D.G. Structures of the Cd44–Hyaluronan Complex Provide Insight into a Fundamental Carbohydrate-Protein Interaction. Nat. Struct. Mol. Biol. 2007, 14, 234–239. [Google Scholar] [CrossRef] [PubMed]
- Plazinski, W.; Knys-Dzieciuch, A. Interactions between CD44 Protein and Hyaluronan: Insights from the Computational Study. Mol. BioSyst. 2012, 8, 543–547. [Google Scholar] [CrossRef] [PubMed]
- Bhattacharya, D.S.; Svechkarev, D.; Souchek, J.J.; Hill, T.K.; Taylor, M.A.; Natarajan, A.; Mohs, A.M. Impact of Structurally Modifying Hyaluronic Acid on CD44 Interaction. J. Mater. Chem. B 2017, 5, 8183–8192. [Google Scholar] [CrossRef]
- Day, A.J.; Prestwich, G.D. Hyaluronan-Binding Proteins: Tying Up the Giant. J. Biol. Chem. 2002, 277, 4585–4588. [Google Scholar] [CrossRef]
- Ye, F.; Xie, Y.; Jensen, H.; Larsen, S.W.; Yaghmur, A.; Larsen, C.; Østergaard, J. Interaction of Amino Acid and Dipeptide β-Naphthylamide Derivatives with Hyaluronic Acid and Human Serum Albumin Studied by Capillary Electrophoresis Frontal Analysis. Chromatographia 2013, 76, 49–57. [Google Scholar] [CrossRef]
- Oyarzun-Ampuero, F.A.; Goycoolea, F.M.; Torres, D.; Alonso, M.J. A New Drug Nanocarrier Consisting of Polyarginine and Hyaluronic Acid. Eur. J. Pharm. Biopharm. 2011, 79, 54–57. [Google Scholar] [CrossRef]
- Kim, E.-J.; Shim, G.; Kim, K.; Kwon, I.C.; Oh, Y.-K.; Shim, C.-K. Hyaluronic Acid Complexed to Biodegradable Poly L-Arginine for Targeted Delivery of SiRNAs. J. Gene Med. 2009, 11, 791–803. [Google Scholar] [CrossRef] [PubMed]
- Balbino, T.A.; Correa, G.S.C.; Favaro, M.T.P.; Toledo, M.A.S.; Azzoni, A.R.; de la Torre, L.G. Physicochemical and in Vitro Evaluation of Cationic Liposome, Hyaluronic Acid and Plasmid DNA as Pseudo-Ternary Complexes for Gene Delivery. Colloids Surf. Physicochem. Eng. Asp. 2015, 484, 262–270. [Google Scholar] [CrossRef]
- Mero, A.; Campisi, M. Hyaluronic Acid Bioconjugates for the Delivery of Bioactive Molecules. Polymers 2014, 6, 346–369. [Google Scholar] [CrossRef]
- Turgeon, S.L.; Schmitt, C.; Sanchez, C. Protein–Polysaccharide Complexes and Coacervates. Curr. Opin. Colloid Interface Sci. 2007, 12, 166–178. [Google Scholar] [CrossRef]
- Lenormand, H.; Deschrevel, B.; Vincent, J.-C. Chain Length Effects on Electrostatic Interactions between Hyaluronan Fragments and Albumin. Carbohydr. Polym. 2010, 82, 887–894. [Google Scholar] [CrossRef]
- Lenormand, H.; Deschrevel, B.; Tranchepain, F.; Vincent, J.-C. Electrostatic Interactions between Hyaluronan and Proteins at PH 4: How Do They Modulate Hyaluronidase Activity. Biopolymers 2008, 89, 1088–1103. [Google Scholar] [CrossRef]
- Lenormand, H.; Deschrevel, B.; Vincent, J.-C. PH Effects on the Hyaluronan Hydrolysis Catalysed by Hyaluronidase in the Presence of Proteins: Part I. Dual Aspect of the PH-Dependence. Matrix Biol. 2010, 29, 330–337. [Google Scholar] [CrossRef]
- Collins, M.N.; Birkinshaw, C. Hyaluronic Acid Solutions-A Processing Method for Efficient Chemical Modification. J. Appl. Polym. Sci. 2013, 130, 145–152. [Google Scholar] [CrossRef]
- Freyer, M.W.; Lewis, E.A. Isothermal Titration Calorimetry: Experimental Design, Data Analysis, and Probing Macromolecule/Ligand Binding and Kinetic Interactions. Methods Cell Biol. 2008, 84, 79–113. [Google Scholar] [CrossRef]
- Liu, J.; Cowman, M.K. Thermal Analysis of Semi-Dilute Hyaluronan Solutions. J. Therm. Anal. Calorim. 2000, 59, 547–557. [Google Scholar] [CrossRef]
- Cleland, R.L. Enthalpy of Mixing Glycosaminoglycans with Aqueous NaCl. Biopolymers 1979, 18, 2673–2681. [Google Scholar] [CrossRef]
- Benegas, J.C.; Di Blas, A.; Paoletti, S.; Cesàro, A. Some Aspects of the Enthalpy of Dilution of Biological Polyelectrolytes. J. Therm. Anal. 1992, 38, 2613–2620. [Google Scholar] [CrossRef]
- Buckin, V.A. High-Resolution Ultrasonic Spectroscopy. J. Sensors Sens. Syst. 2018, 7, 207–217. [Google Scholar] [CrossRef]
- Lehmann, L.; Buckin, V. Determination of the Heat Stability Profiles of Concentrated Milk and Milk Ingredients Using High Resolution Ultrasonic Spectroscopy. J. Dairy Sci. 2005, 88, 3121–3129. [Google Scholar] [CrossRef]
- Graeme, L.C. Biomolecular and Bioanalytical Techniques; Vasudevan, R., Ed.; Wiley: Hoboken, NJ, USA, 2019; 576p. [Google Scholar]
- Le, V.H.; Buscaglia, R.; Chaires, J.B.; Lewis, E.A. Modeling Complex Equilibria in Isothermal Titration Calorimetry Experiments: Thermodynamic Parameters Estimation for a Three-Binding-Site Model. Anal. Biochem. 2013, 434, 233–241. [Google Scholar] [CrossRef]
- Bhowmik, D.; Das, S.; Hossain, M.; Haq, L.; Suresh Kumar, G. Biophysical Characterization of the Strong Stabilization of the RNA Triplex Poly(U)•poly(A)*poly(U) by 9-O-(ω-Amino) Alkyl Ether Berberine Analogs. PLoS ONE 2012, 7, e37939. [Google Scholar] [CrossRef]
- Buckin, V.A.; Kankiya, B.I.; Sarvazyan, A.P.; Uedaira, H. Acoustical Investigation of Poly(DA).Poly(DT), Poly[d(A-T)].Poly[d(A-T)], Poly(A). Poly(U) and DNA Hydration in Dilute Aqueous Solutions. Nucleic Acids Res. 1989, 17, 4189–4203. [Google Scholar] [CrossRef]
- Merzel, F.; Smith, J.C. Is the First Hydration Shell of Lysozyme of Higher Density than Bulk Water? Proc. Natl. Acad. Sci. USA 2002, 99, 5378–5383. [Google Scholar] [CrossRef]
- Chalikian, T.V.; Sarvazyan, A.P.; Breslauer, K.J. Hydration and Partial Compressibility of Biological Compounds. Biophys. Chem. 1994, 51, 89–109. [Google Scholar] [CrossRef]
- Galema, S.A.; Hoeiland, H. Stereochemical Aspects of Hydration of Carbohydrates in Aqueous Solutions. 3. Density and Ultrasound Measurements. J. Phys. Chem. 1991, 95, 5321–5326. [Google Scholar] [CrossRef]
- Zana, R. Studies of Aqueous Solutions of Polyelectrolytes by Means of Ultrasonic Methods. J. Macromol. Sci. Part C Polym. Rev. 1975, 12, 165–189. [Google Scholar] [CrossRef]
- Isemura, T.; Goto, S. Studies of the Hydration and the Structure of Water and Their Roles in Protein Structure. II. The Hydration of Electrolytes by Ultrasonic Interferometry and Its Temperature Dependence. Bull. Chem. Soc. Jpn 1964, 37, 1690–1693. [Google Scholar] [CrossRef]
- Cabani, S.; Gianni, P.; Mollica, V.; Lepori, L. Group Contributions to the Thermodynamic Properties of Non-Ionic Organic Solutes in Dilute Aqueous Solution. J. Solut. Chem. 1981, 10, 563–595. [Google Scholar] [CrossRef]
- Lafont, V.; Armstrong, A.A.; Ohtaka, H.; Kiso, Y.; Mario Amzel, L.; Freire, E. Compensating Enthalpic and Entropic Changes Hinder Binding Affinity Optimization. Chem. Biol. Drug Des. 2007, 69, 413–422. [Google Scholar] [CrossRef] [PubMed]
- Kawasaki, Y.; Chufan, E.E.; Lafont, V.; Hidaka, K.; Kiso, Y.; Mario Amzel, L.; Freire, E. How Much Binding Affinity Can Be Gained by Filling a Cavity? Chem. Biol. Drug Des. 2010, 75, 143–151. [Google Scholar] [CrossRef]
- Mertins, O.; Dimova, R. Binding of Chitosan to Phospholipid Vesicles Studied with Isothermal Titration Calorimetry. Langmuir 2011, 27, 5506–5515. [Google Scholar] [CrossRef] [PubMed]
- Vondrášek, J.; Mason, P.E.; Heyda, J.; Collins, K.D.; Jungwirth, P. The Molecular Origin of Like-Charge Arginine−Arginine Pairing in Water. J. Phys. Chem. B 2009, 113, 9041–9045. [Google Scholar] [CrossRef]
- Lesley, J. Hyaluronan Binding by Cell Surface CD44. J. Biol. Chem. 2000, 275, 26967–26975. [Google Scholar] [CrossRef]
- Simulescu, V.; Mondek, J.; Kalina, M.; Pekař, M. Kinetics of Long-Term Degradation of Different Molar Mass Hyaluronan Solutions Studied by SEC-MALLS. Polym. Degrad. Stab. 2015, 111, 257–262. [Google Scholar] [CrossRef]
- Mondek, J.; Kalina, M.; Simulescu, V.; Pekař, M. Thermal Degradation of High Molar Mass Hyaluronan in Solution and in Powder; Comparison with BSA. Polym. Degrad. Stab. 2015, 120, 107–113. [Google Scholar] [CrossRef]
- Simulescu, V.; Kalina, M.; Mondek, J.; Pekař, M. Long-term degradation study of hyaluronic acid in aqueous solutions without protection against microorganisms. Carbohydr. Polym. 2016, 137, 664–668. [Google Scholar] [CrossRef] [PubMed]
- Scott, J.E.; Cummings, C.; Brass, A.; Chen, Y. Secondary and Tertiary Structures of Hyaluronan in Aqueous Solution, Investigated by Rotary Shadowing-Electron Microscopy and Computer Simulation. Hyaluronan Is a Very Efficient Network-Forming Polymer. Biochem. J. 1991, 274, 699–705. [Google Scholar] [CrossRef] [PubMed]


© 2020 by the authors. Licensee MDPI, Basel, Switzerland. This article is an open access article distributed under the terms and conditions of the Creative Commons Attribution (CC BY) license (http://creativecommons.org/licenses/by/4.0/).
Share and Cite
Jugl, A.; Pekař, M. Hyaluronan-Arginine Interactions—An Ultrasound and ITC Study. Polymers 2020, 12, 2069. https://doi.org/10.3390/polym12092069
Jugl A, Pekař M. Hyaluronan-Arginine Interactions—An Ultrasound and ITC Study. Polymers. 2020; 12(9):2069. https://doi.org/10.3390/polym12092069
Chicago/Turabian StyleJugl, Adam, and Miloslav Pekař. 2020. "Hyaluronan-Arginine Interactions—An Ultrasound and ITC Study" Polymers 12, no. 9: 2069. https://doi.org/10.3390/polym12092069
APA StyleJugl, A., & Pekař, M. (2020). Hyaluronan-Arginine Interactions—An Ultrasound and ITC Study. Polymers, 12(9), 2069. https://doi.org/10.3390/polym12092069