Preparation of Antimicrobial Fibres from the EVOH/EPC Blend Containing Silver Nanoparticles


Abstract
1. Introduction
2. Materials and Experimental Methods
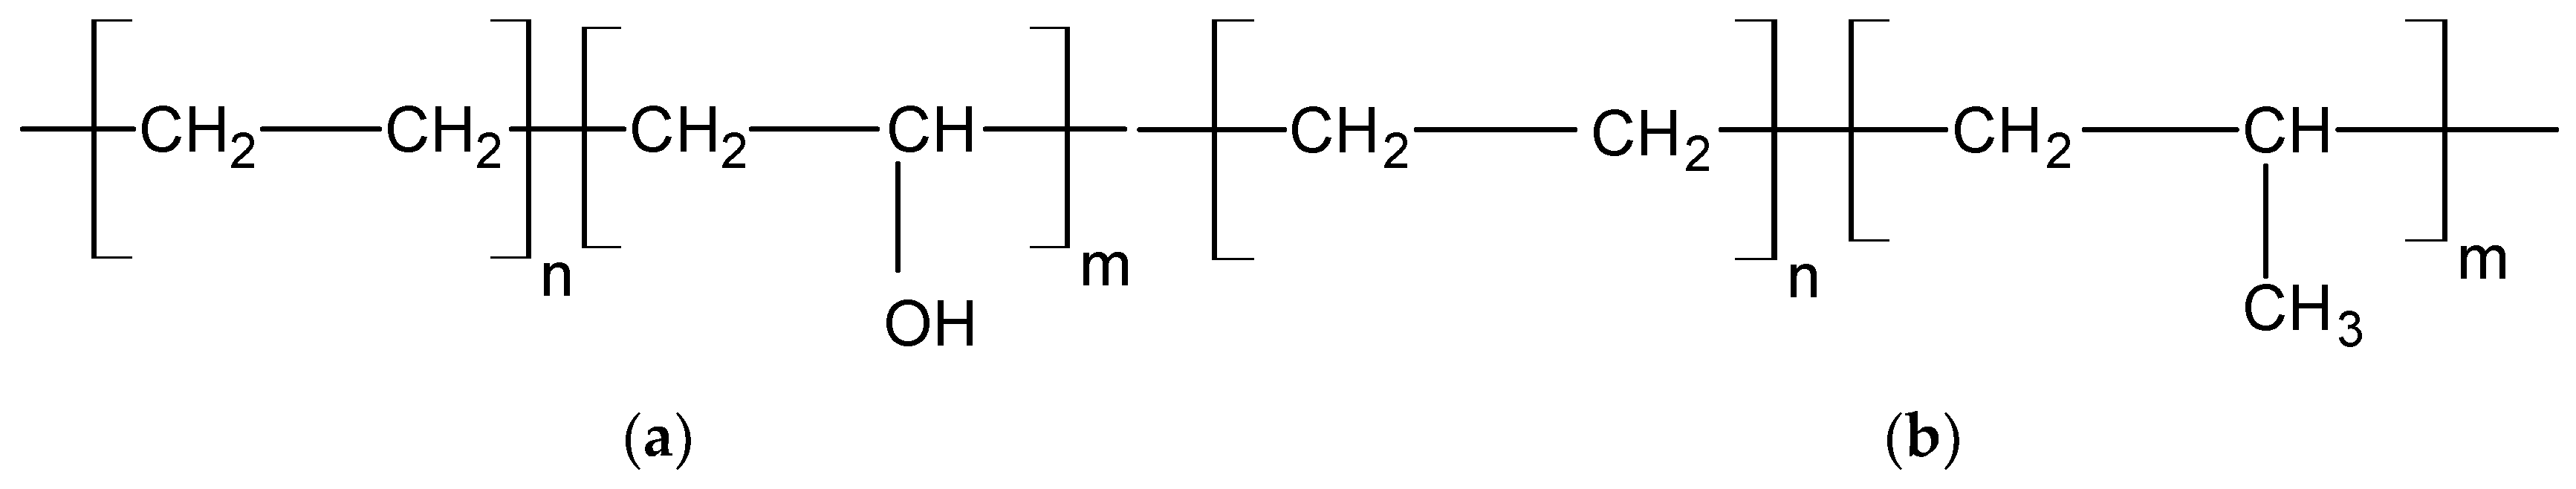
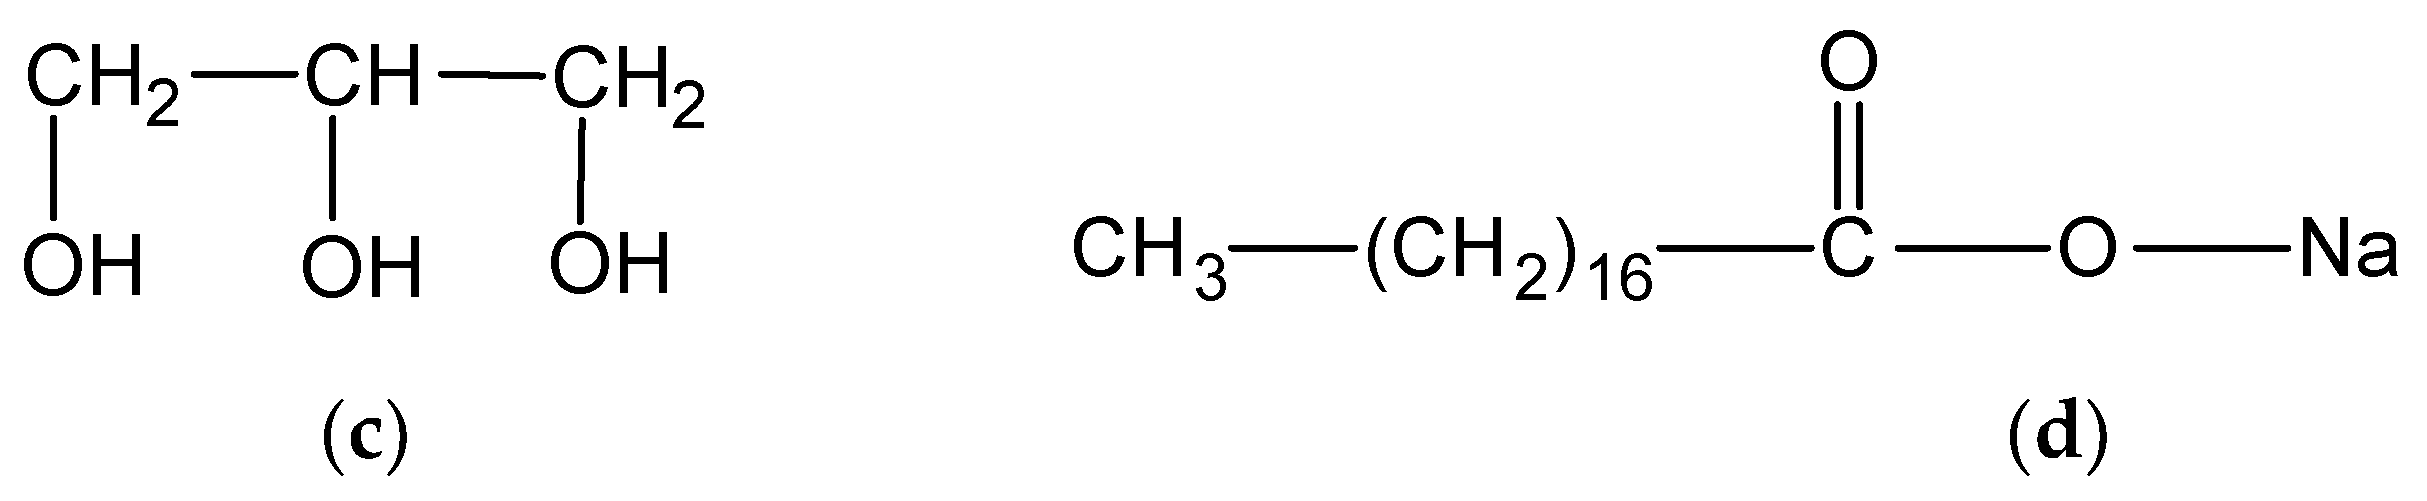
2.1. Materials
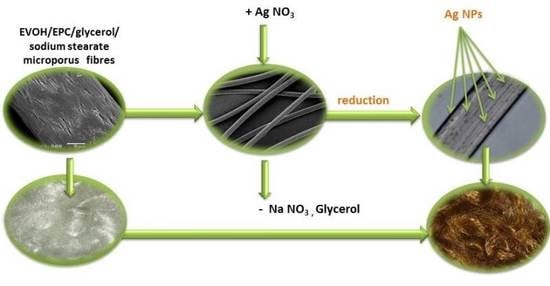
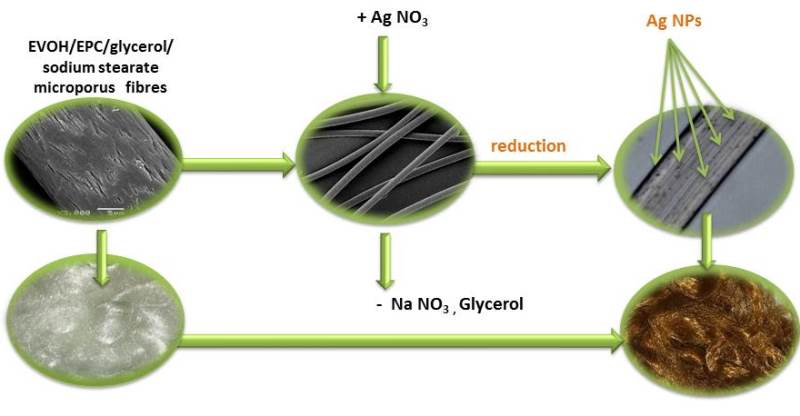
2.2. Preparation of Fibre Blends
2.3. Synthesis of Silver Nanoparticles (AgNPs)
2.4. Microbiological Activity
2.5. Methods of Materials Characterization
3. Results and Discussion
4. Conclusions
Author Contributions
Funding
Conflicts of Interest
References
- Takahashi, M.; Tashiro, K.; Amiya, S. Crystal Structure of Ethylene−Vinyl Alcohol Copolymers. Macromolecules 1999, 32, 5860–5871. [Google Scholar] [CrossRef]
- Milosavljevic, B.H.; Thomas, J.K. Radiation induced processes in the co-polymer, polyethylene-poly(vinyl alcohol). Nucl. Instrum. Methods Phys. Res. Sect. B 2003, 208, 185–190. [Google Scholar] [CrossRef]
- Cabedo, L.; Lagarón, J.M.; Cava, D. The effect of ethylene content on the interaction between ethylene-vinyl alcohol copolymers and water (II): Influence of water sorption on the mechanical properties of EVOH copolymers. Polym. Test. 2006, 25, 860–867. [Google Scholar] [CrossRef]
- Lima, J.A.; Felisberti, M.I. Poly(ethylene-co-vinyl alcohol) and poly(methylmethacrylate) blends: Phase behavior and morphology. Eur. Polym. J. 2008, 44, 1140–1148. [Google Scholar] [CrossRef]
- Aucejo, S.; Catala, R.; Gavara, R. Interactions between water and EVOH food pack-aging films. Food Sci. Technol. Int. 2000, 6, 159–164. [Google Scholar] [CrossRef]
- Lopez-de-Dicastillo, C.; Catala, R.; Gavara, R.; Hernandez-Munoz, P. Food applications of active packaging EVOH films containing cyclodextrins for the preferential scavenging of undesirable compounds. J. Food Eng. 2011, 104, 380–386. [Google Scholar] [CrossRef]
- Ge, C.F.; Fortuna, C.; Lei, K.; Lu, L.-X. Neat EVOH and EVOH/LDPE blend centered three-layer co-extruded blown film without tie layers. Food Packag. Shelf Life 2016, 8, 33–40. [Google Scholar] [CrossRef]
- Lagaron, J.M.; Powell, A.K.; Bonner, G. Permeation of water, methanol, fuel and alcohol-containing fuels in high-barrier ethylene–vinyl alcohol copolymer. Polym. Test. 2001, 20, 569–577. [Google Scholar] [CrossRef]
- Mokwena, K.K.; Tang, J. Ethylene vinyl alcohol: A review of barrier properties for packaging shelf stable foods. Crit. Rev. Food Sci. Nutr. 2012, 52, 640–650. [Google Scholar] [CrossRef]
- Neppalli, R.; Causin, V.; Marigo, A.; Meincken, M.; Hartmann, P.; van Reenen, A.J. Effect of electrospun ethylene vinyl alcohol copolymer (EVOH) fibres on the structure, morphology, and properties of poly(lactic acid) (PLA). Polymer 2013, 54, 5909–5919. [Google Scholar] [CrossRef]
- Lasagabaster, A.; Abad, M.J.; Barral, L.; Ares, A. FTIR study on the nature of water sorbedin polypropylene (PP)/ethylene alcohol vinyl (EVOH) films. Eur. Polym. J. 2006, 42, 3121–3132. [Google Scholar] [CrossRef]
- Yokoyama, Y.; Kimata, H.; Mitarai, S. Ethylene vinyl alcohol (EVOH) fiber compared to cotton underwear in the treatment of childhood atopic dermatitis: A double-blind randomized study. Indian Pediatr. 2009, 46, 611–614. [Google Scholar] [PubMed]
- Rwei, S.-P.; Jue, Z.-F.; Chiang, W.-Y.; Chen, J.-H.; Chen, Y.-H. Characterization of melt spinnability of ethylene vinyl alcohol copolymers. Text. Res. J. 2016, 86, 1191–1201. [Google Scholar] [CrossRef]
- Marconi, W.; Benvenuti, F.; Piozzi, A. Covalent bonding of heparin to a vinyl copolymer for biomedical applications. Biomaterials 1997, 18, 885–890. [Google Scholar] [CrossRef]
- Zamashita, S.; Nagata, S.; Takakura, K. Studies on preparation condition and properties of ethylene-vinyl alcohol copolymer membranes for hemodialysis. KobunshiRonbunshu 1979, 36, 249–256. [Google Scholar] [CrossRef]
- de Dicastillo, C.L.; Nerin, C.; Alfaro, P.; Catala, R.; Gavara, R.; Hernandez-Munoz, P. Development of new antioxidant active packaging films based on ethylene vinyl alcohol copolymer (EVOH) and green tea extract. J. Agric. Food Chem. 2011, 59, 7832–7840. [Google Scholar] [CrossRef]
- Tarazona, A.; Gómez, J.V.; Gavara, R.; Mateo-Castro, R.; Gimeno-Adelantado, J.V.; Jiménez, M.; Mateo, E.M. Risk management of ochratoxigenic fungi and ochratoxin A in maize grains by bioactive EVOH films containing individual components of some essential oils. Int. J. Food Microbiol. 2018, 269, 107–119. [Google Scholar] [CrossRef]
- Yeo, J.H.; Lee, C.H.; Park, C.-S.; Lee, K.-J.; Nam, J.-D.; Kim, S.W. Rheological, morphological, mechanical, and barrier properties of PP/EVOH blends. Adv. Polym. Technol. 2001, 20, 191–201. [Google Scholar] [CrossRef]
- Toki, S.; Sircs, I.; Burger, C.; Fang, D.; Liu, L.; Hsiao, B.; Datta, S.; Tsou, A. Structure evolution during cyclic deformation of an elastic propylene-based ethylene-propylene copolymer. Macromolecules 2006, 39, 3588–3597. [Google Scholar] [CrossRef]
- Lin, Y.; Marchand, G.R.; Hiltner, A.; Baer, E. Adhesion of Olefin Block Copolymers to Polypropylene and High Density Polyethylene and Their Effectiveness as Compatibilizers in Blends. Polymer 2011, 52, 1635–1644. [Google Scholar] [CrossRef]
- The Dow Chemical Company, Engage Polyolefin Elastomers Dow Elastomers, 995–2015. Available online: http://www.dow.com/elastomers/products/engage.htm (accessed on 2 September 2015).
- Wiley, B.; Sun, Y.G.; Xia, Y.N. Synthesis of silver nanostructures with controlled shapes and properties. Acc. Chem. Res. 2007, 40, 1067–1076. [Google Scholar] [CrossRef] [PubMed]
- Khodashenas, B.; Ghorbani, H.R. Synthesis of silver nanoparticles with different shapes. Arab. J. Chem. 2015. [Google Scholar] [CrossRef]
- De, M.; Ghosh, P.S.; Rotello, V.M. Applications of nanoparticles in biology. Adv. Mater. 2008, 20, 4225–4241. [Google Scholar] [CrossRef]
- Kumar, A.; Aerry, S.; Goia, D.V. Preparation of concentrated stable dispersions of uniform Ag nanoparticles using resorcinol as reductant. J. Colloid Interface Sci. 2016, 470, 196–203. [Google Scholar] [CrossRef]
- Eckhardt, S.; Brunetto, P.S.; Gagnon, J.; Priebe, M.; Giese, B.; Fromm, K.M. Nanobio silver its interactions with peptides and bacteria, and its uses in medicine. Chem. Rev. 2013, 113, 4708–4754. [Google Scholar] [CrossRef] [PubMed]
- Lemire, J.A.; Harrison, J.J.; Turner, R.J. Antimicrobial activity of metals: Mechanisms, molecular targets and applications. Nat. Rev. Microbiol. 2013, 11, 371–384. [Google Scholar] [CrossRef]
- Sondi, I.; Salopek-Sondi, B. Silver nanoparticles as antimicrobial agent: A case study on E. coli as a model for Gram-negative bacteria. J. Colloid Interface Sci. 2004, 275, 177–182. [Google Scholar] [CrossRef]
- Zhao, G.; Stevens, S.E. Multiple parameters for the comprehensive evaluation of the susceptibility of Escherichia coli to the silver ion. BioMetals 1998, 11, 27–32. [Google Scholar] [CrossRef]
- Chen, C.Y.; Chiang, C.L. Preparation of cotton fibers with antibacterial silver nanoparticles. Mater. Lett. 2008, 62, 3607–3609. [Google Scholar] [CrossRef]
- Perelshtein, I.; Applerot, G.; Perkas, N.; Guibert, G.; Mikhailov, S.; Gedanken, A. Sonochemical coating of silver nanoparticles on textile fabrics (nylon, polyester and cotton) and their antibacterial activity. Nanotechnology 2008, 19, 245705. [Google Scholar] [CrossRef]
- Lee, H.J.; Yeo, S.Y.; Jeong, S.H. Antibacterial effect of nanosized silver colloidal solution on textile fabrics. J. Mater. Sci. 2003, 38, 2199–2204. [Google Scholar] [CrossRef]
- Balogh, L.; Swanson, D.R.; Tomalia, D.A.; Hagnauer, G.L.; McManus, A.T. Dendrimer−Silver Complexes and Nanocomposites as Antimicrobial Agents. Nano Lett. 2001, 1, 18–21. [Google Scholar] [CrossRef]
- Gong, P.; Li, H.; He, X.; Wang, K.; Hu, J.; Tan, W.; Zhang, S.; Yang, X. Preparation and antibacterial activity of Fe3O4@Ag nanoparticles. Nanotechnology 2007, 18, 285604. [Google Scholar] [CrossRef]
- Emam, H.E.; Ahmed, H.B. Polysaccharides templates for assembly of nanosilver. Carbohydr.Polym. 2016, 135, 300–307. [Google Scholar] [CrossRef]
- Lee, K.J.; Browning, L.M.; Nallathamby, P.D.; Xu, X.-H.N. Study of Charge-Dependent Transport and Toxicity of Peptide-Functionalized Silver Nanoparticles Using Zebrafish Embryos and Single Nanoparticle Plasmonic Spectroscopy. Chem. Res. Toxicol. 2013, 26, 904–917. [Google Scholar] [CrossRef] [PubMed]
- Carbone, M.; Donia, T.D.; Sabbatella, G.; Antiochia, R. Silver nanoparticles in polymeric matrices for fresh food packaging. J. King Saud Univ. Sci. 2016, 28, 273–279. [Google Scholar] [CrossRef]
- Socrates, G. Infrared and Raman Characteristic Group Frequencies: Tables and Charts; John Wiley&Sons: Hoboken, NJ, USA, 2007. [Google Scholar]


| Properties | EVOH | EPC |
|---|---|---|
| Ethylene content [mol%] | 32 | 13 |
| Density [g/cm3] | 1.19 | 0.865 |
| Melting temperature [°C] | 180 | - |
| Crystallization temperature [°C] | 155 | - |
| Melt Flow Index (MFI) (190 °C, 2160 g) [g/10 min] | 1.51 | 21 |
| Component w/w [%] | Sample A0.0 | Sample B0.0 |
|---|---|---|
| EVOH | 57 | 57 |
| EPC | 3 | 3 |
| glycerol | 38 | 32 |
| sodium stearate | 2 | 8 |
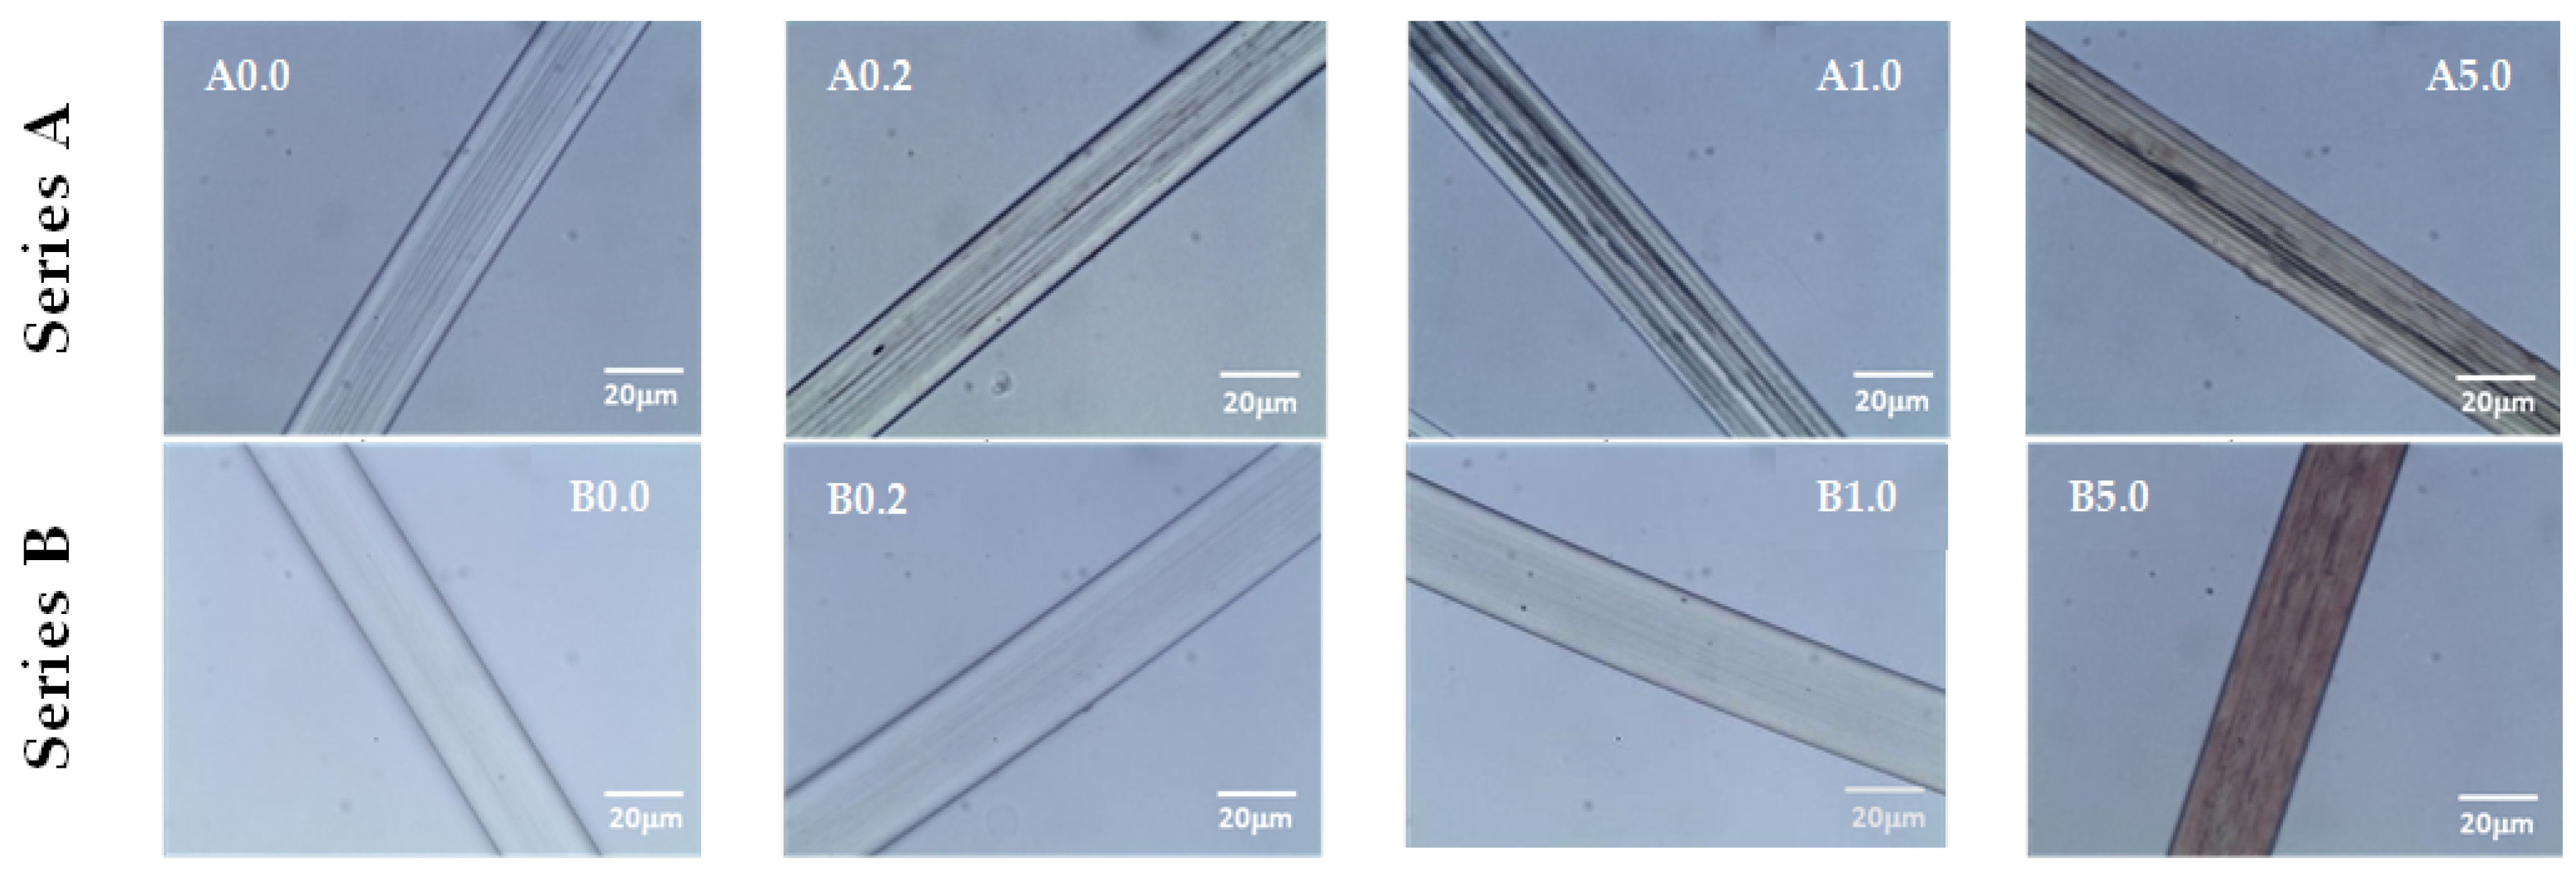
| Samples for Treatment | Concentrations AgNO3 [%] | Designations of Samples |
|---|---|---|
| A0.0 | 0.2 | A0.2 |
| A0.0 | 1.0 | A1.0 |
| A0.0 | 5.0 | A5.0 |
| B0.0 | 0.2 | B0.2 |
| B0.0 | 1.0 | B1.0 |
| B0.0 | 5.0 | B5.0 |
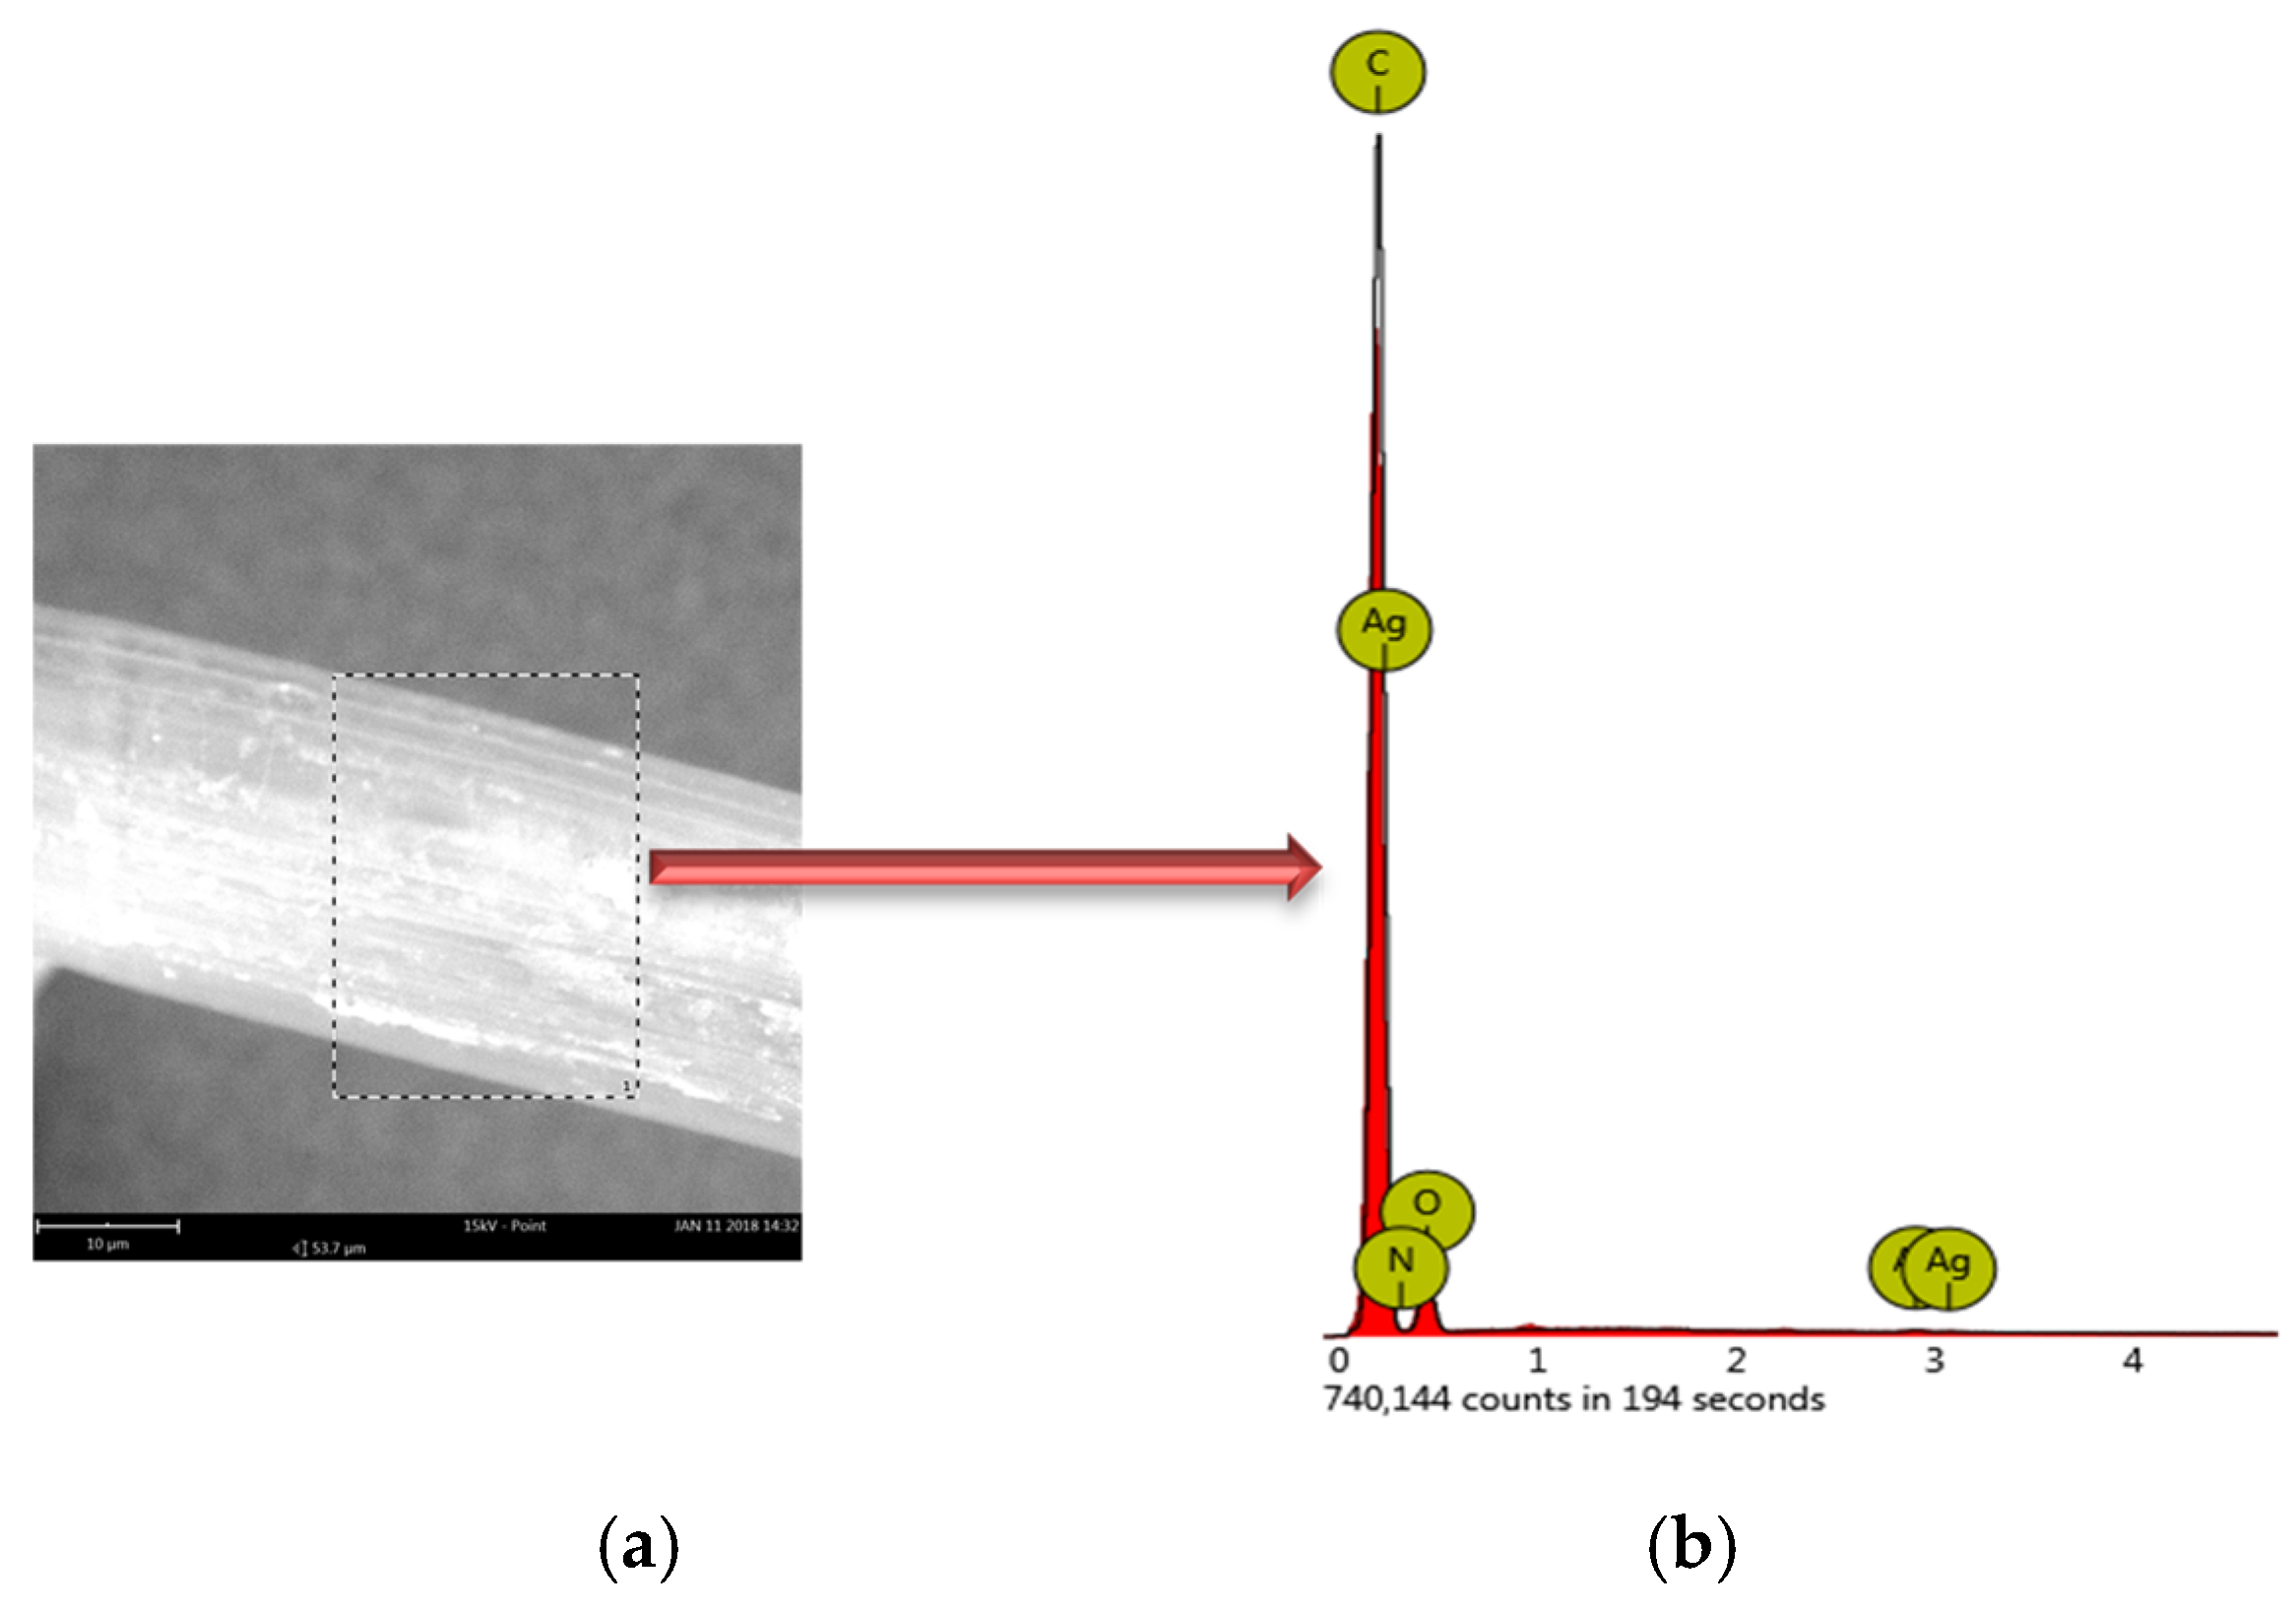
| Symbols of Elements | Atomic Percent A0.2 | Atomic Percent A1.0 |
|---|---|---|
| C | 80.82 | 75.44 |
| O | 19.03 | 23.66 |
| Ag | 0.10 | 0.80 |
| Na | 0.05 | 0.10 |
| N | 0.00 | 0.00 |
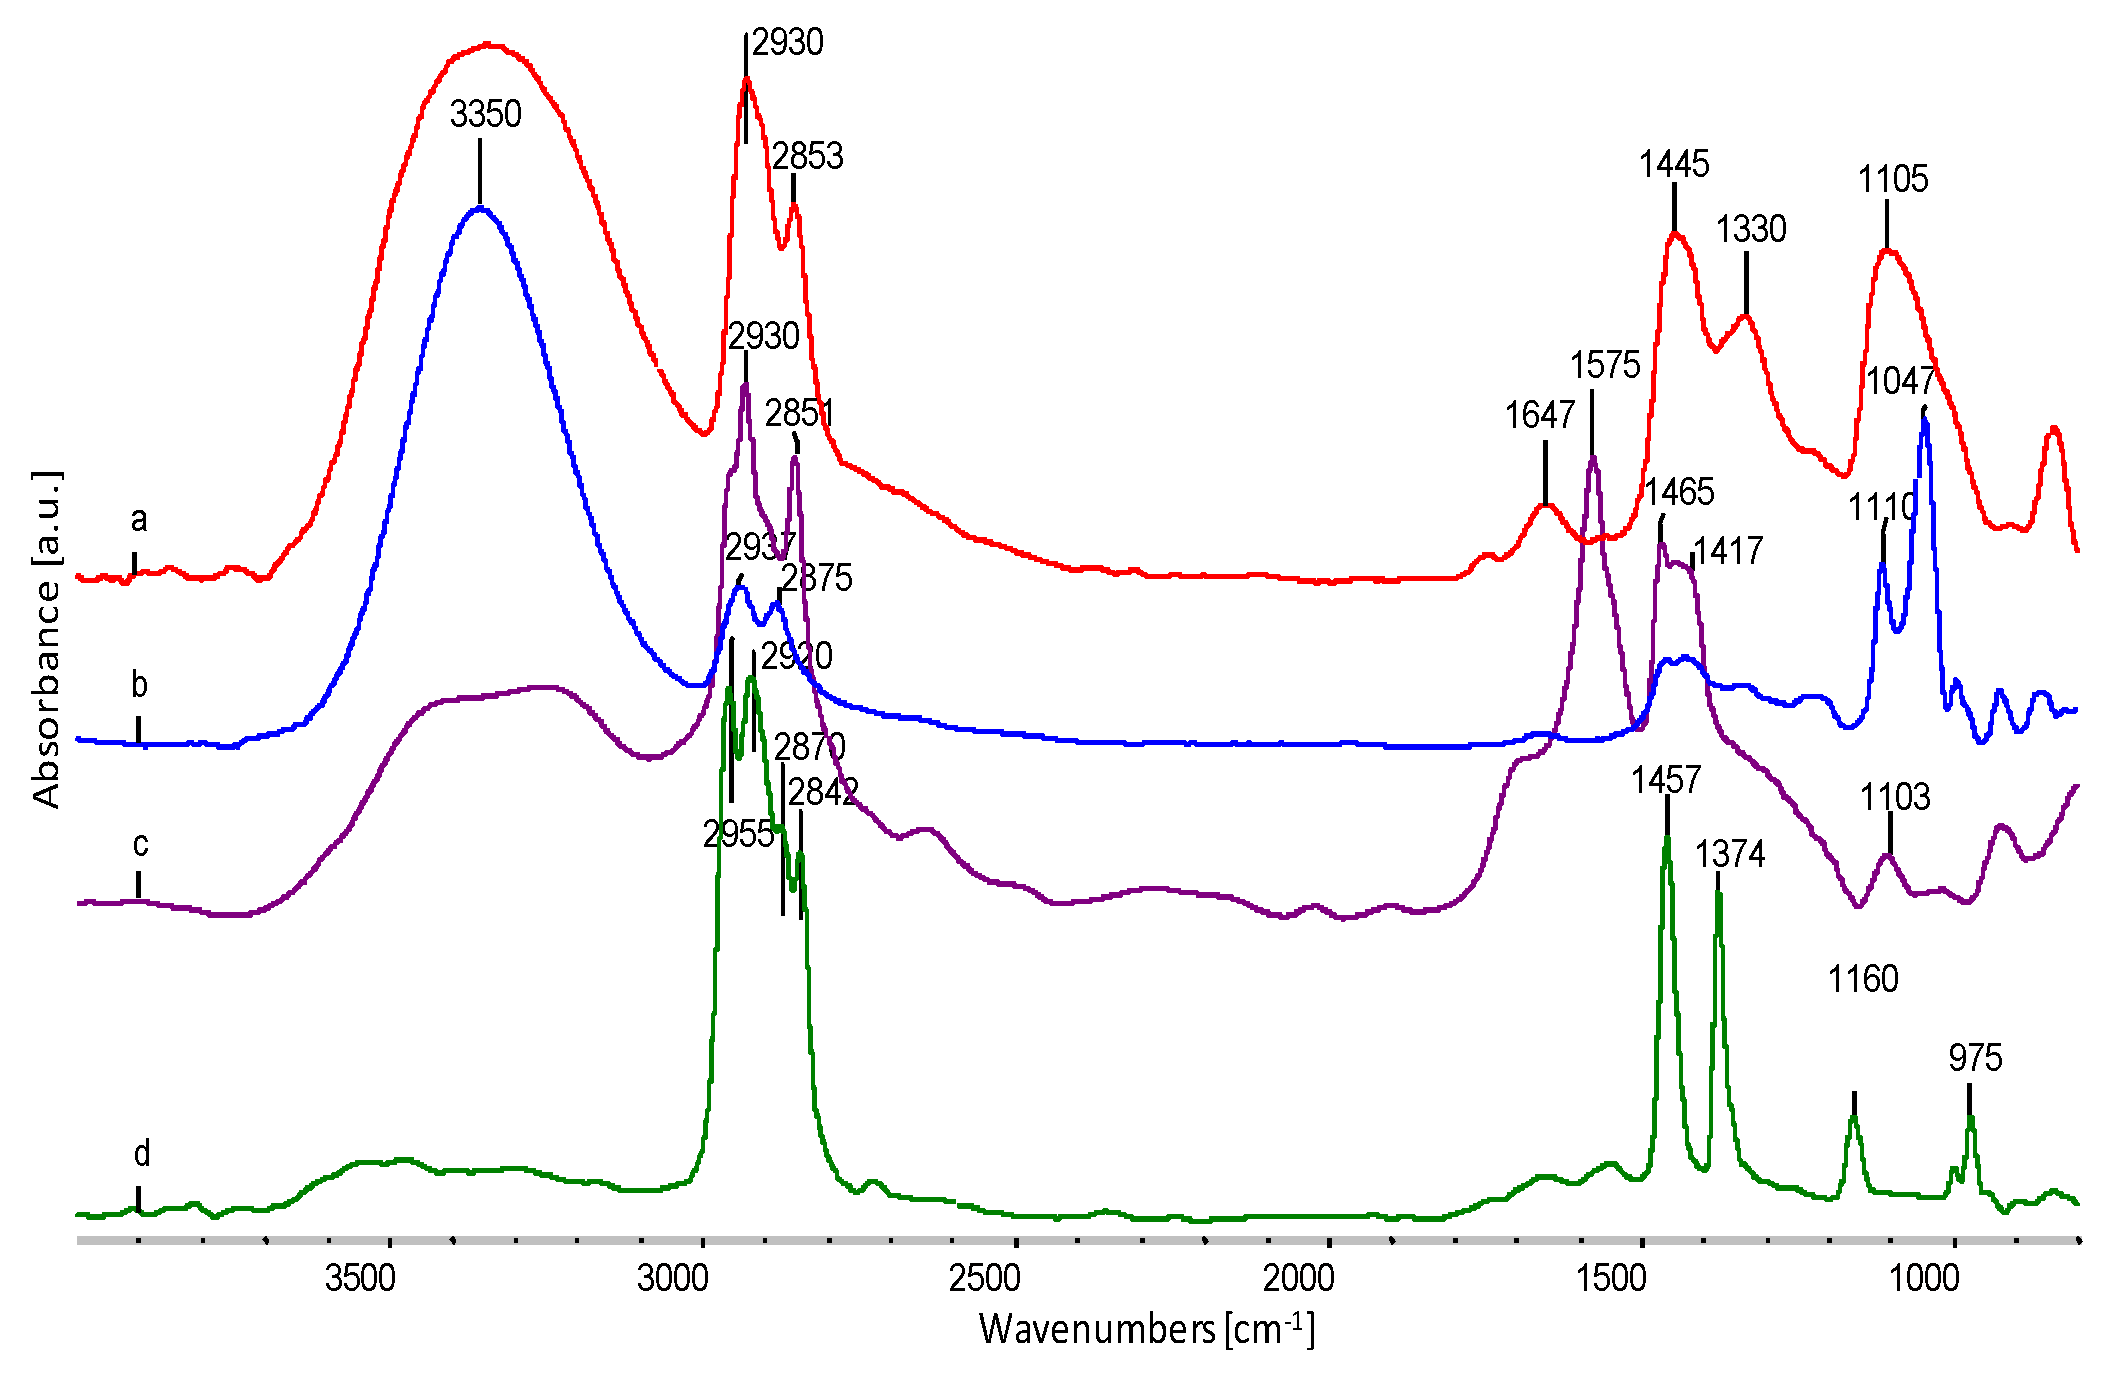
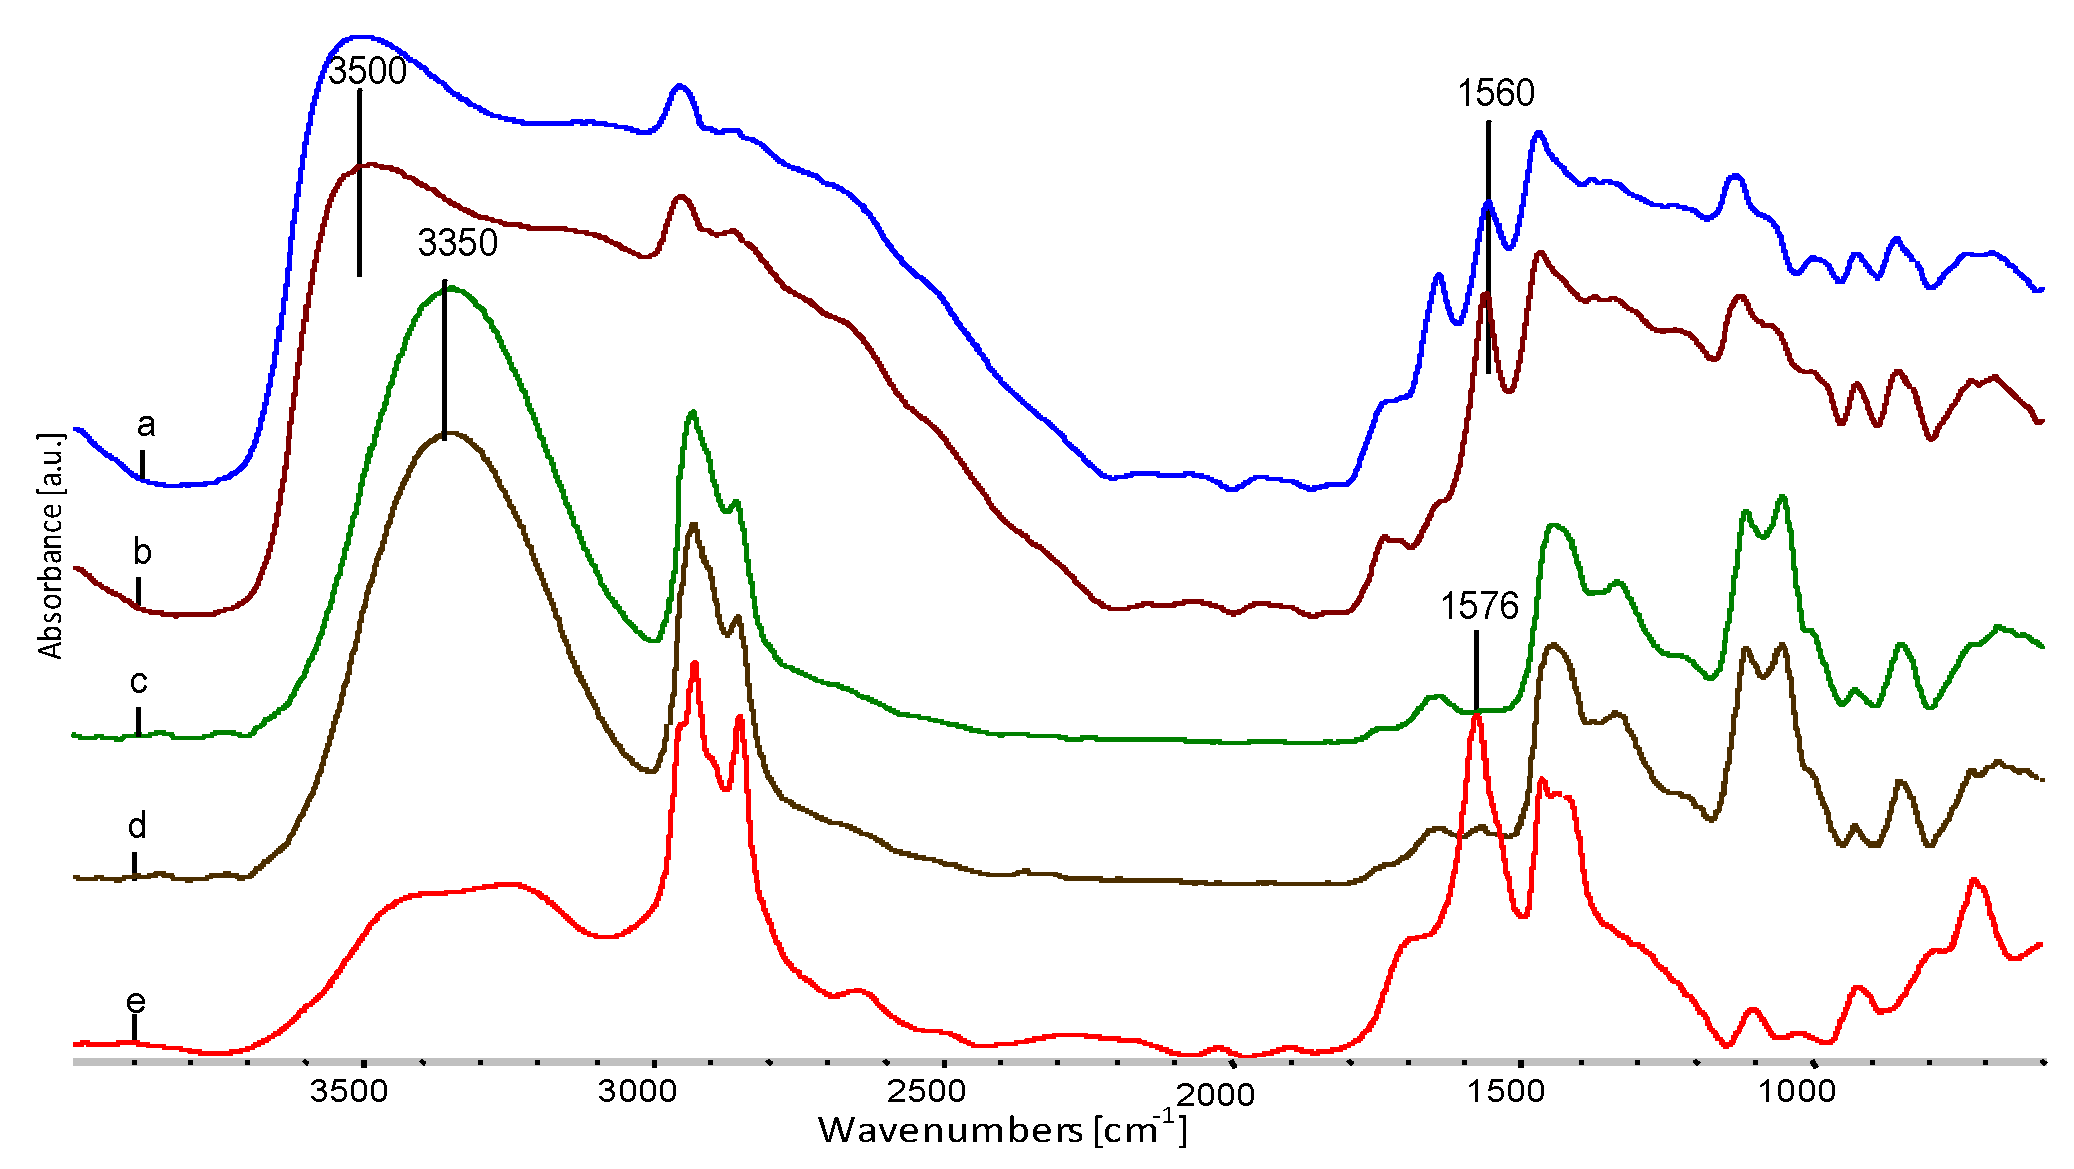
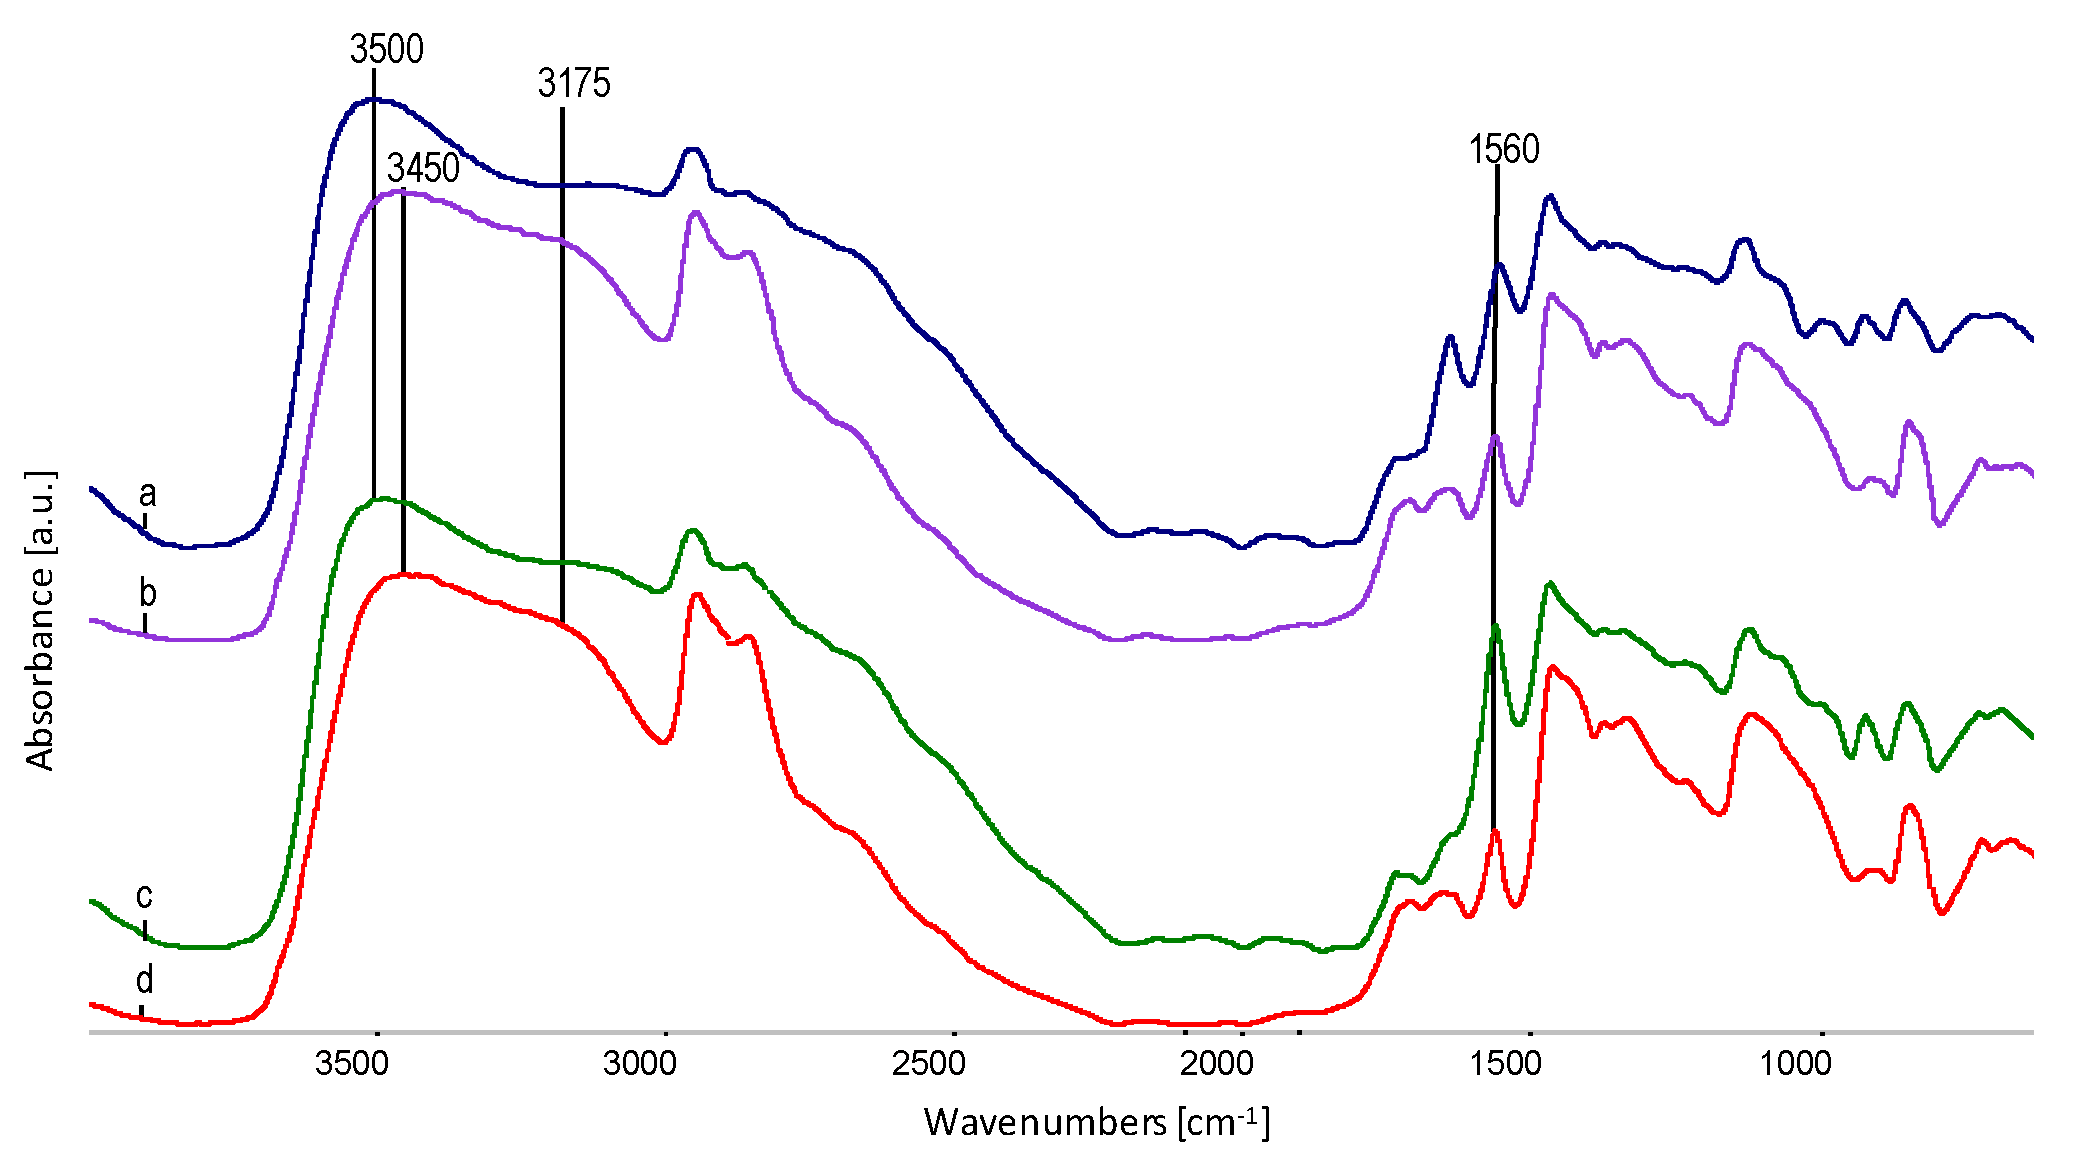
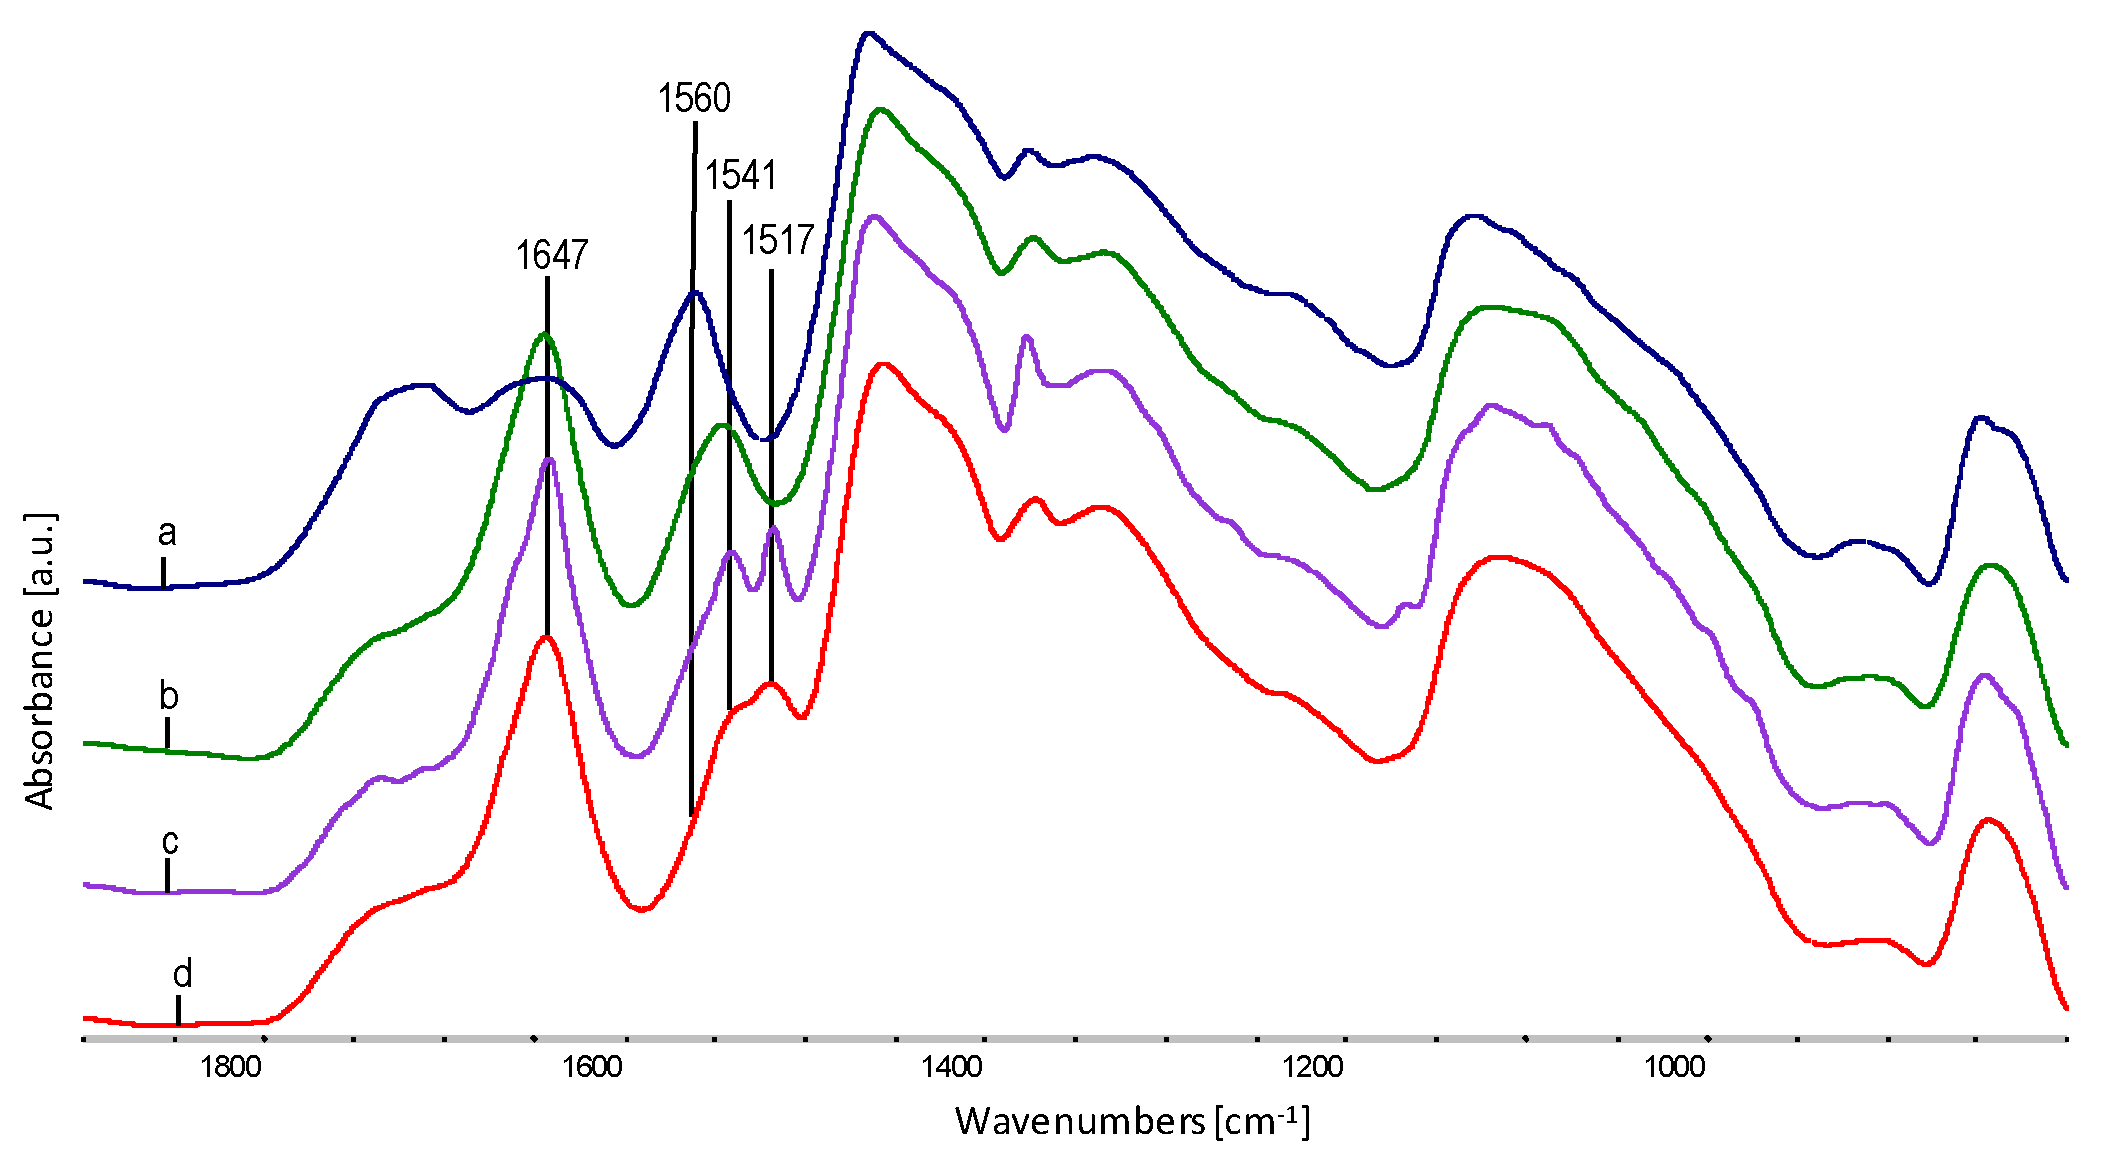
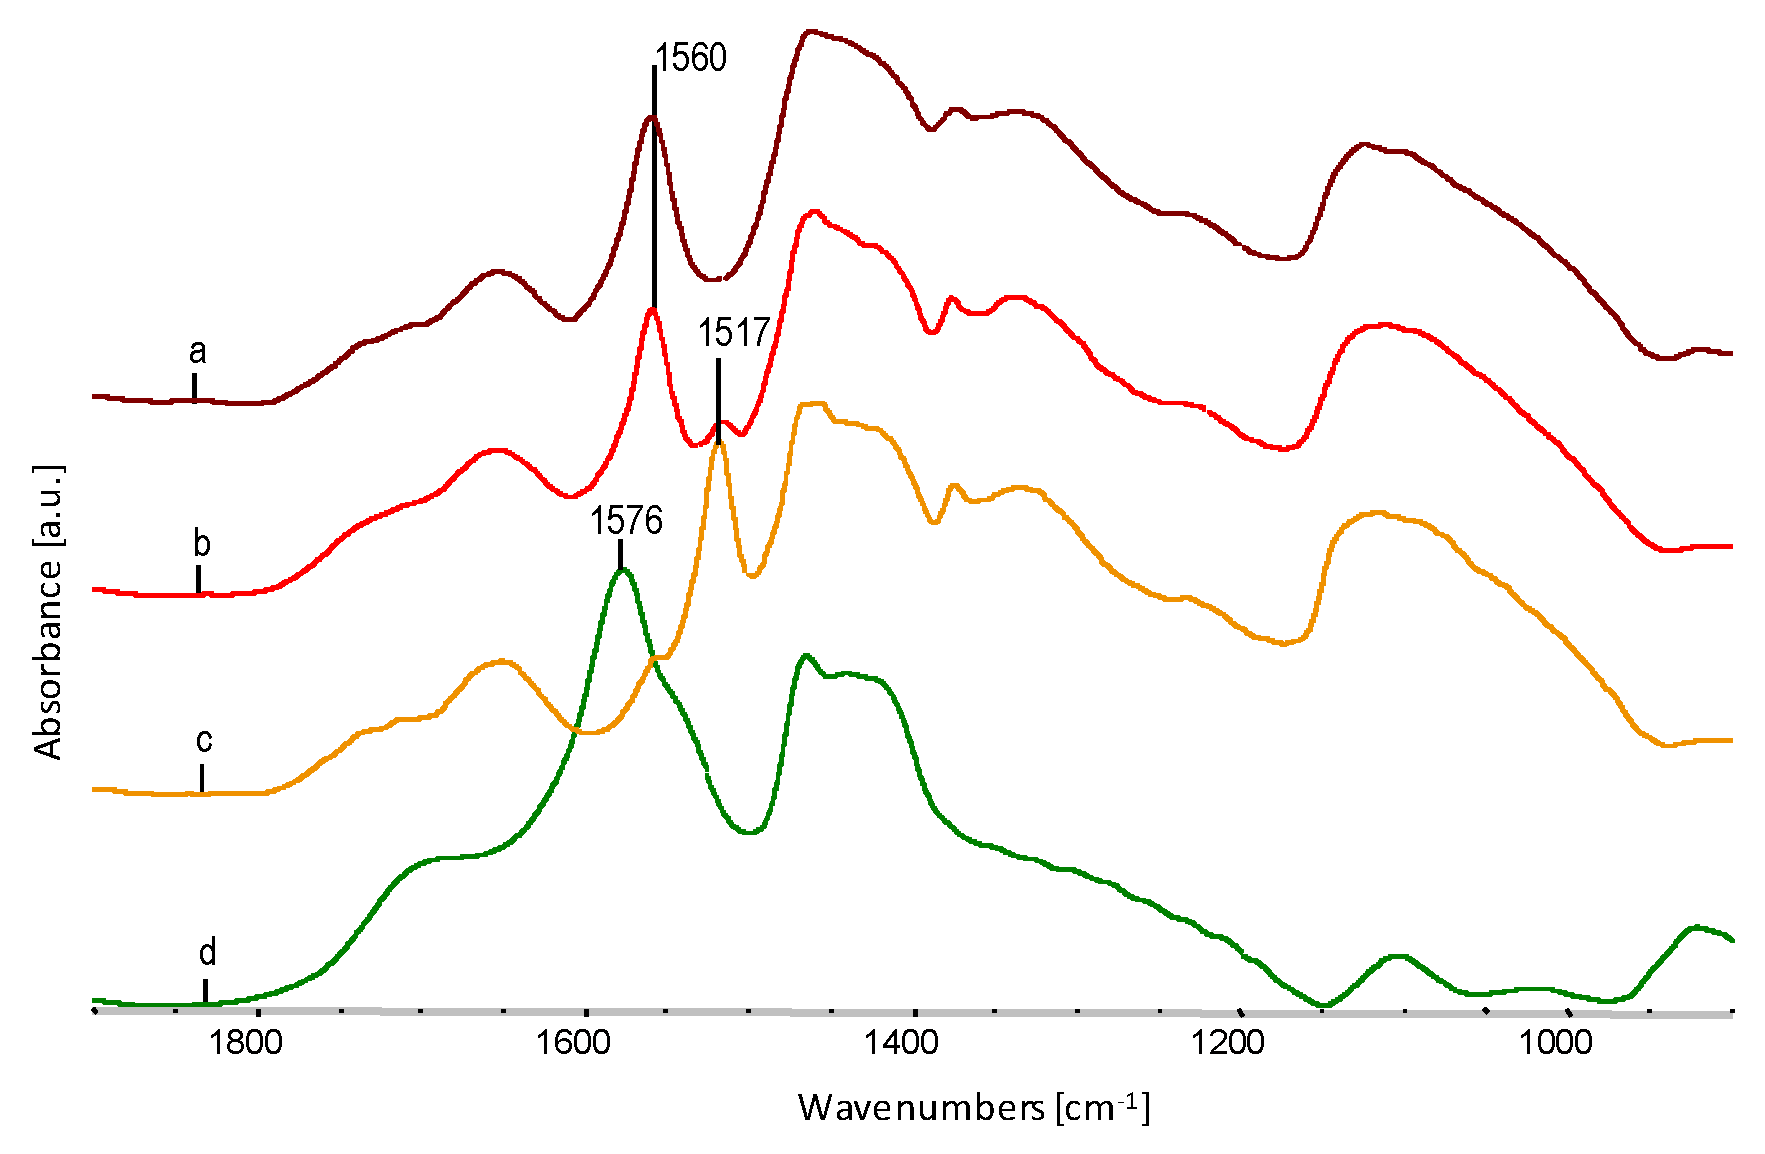
| Sample | Wavenumber from FTIR, cm−1 | Oscillation Bands |
|---|---|---|
| EVOH | 3350 | O–H str. in hydrogen bond |
| 2930 | CH2 str. asym. | |
| 2853 | CH2 str. sym. | |
| 1647 | O–H def. | |
| 1445 | CH2 sc. | |
| 1330 | CH2 def. | |
| 1105 | C–O II-secondary | |
| EPC | 2955 | CH3 str. asym. |
| 2920 | CH3 str.sym. | |
| 2870 | CH2 str. asym. | |
| 2842 | CH2 str.sym. | |
| 1457 | CH2 sc. | |
| 1374 | CH2 def. | |
| 1160 | C–C str. | |
| 975 | CH3 roc. | |
| Glycerol | 3350 | O–H str. in hydrogen bond |
| 2937 | CH2 str. asym. | |
| 2875 | CH2 str.sym. | |
| 1110 | C–O II-secondary | |
| 1047 | C–O I-primary | |
| Sodium stearate | 2930 | CH2 str. asym. |
| 2851 | CH2 str.sym. | |
| 1576 | C=O in COONa | |
| 1465 | CH2 sc. | |
| 1417 | CH3 sc. | |
| 1003 | C–C sk. |
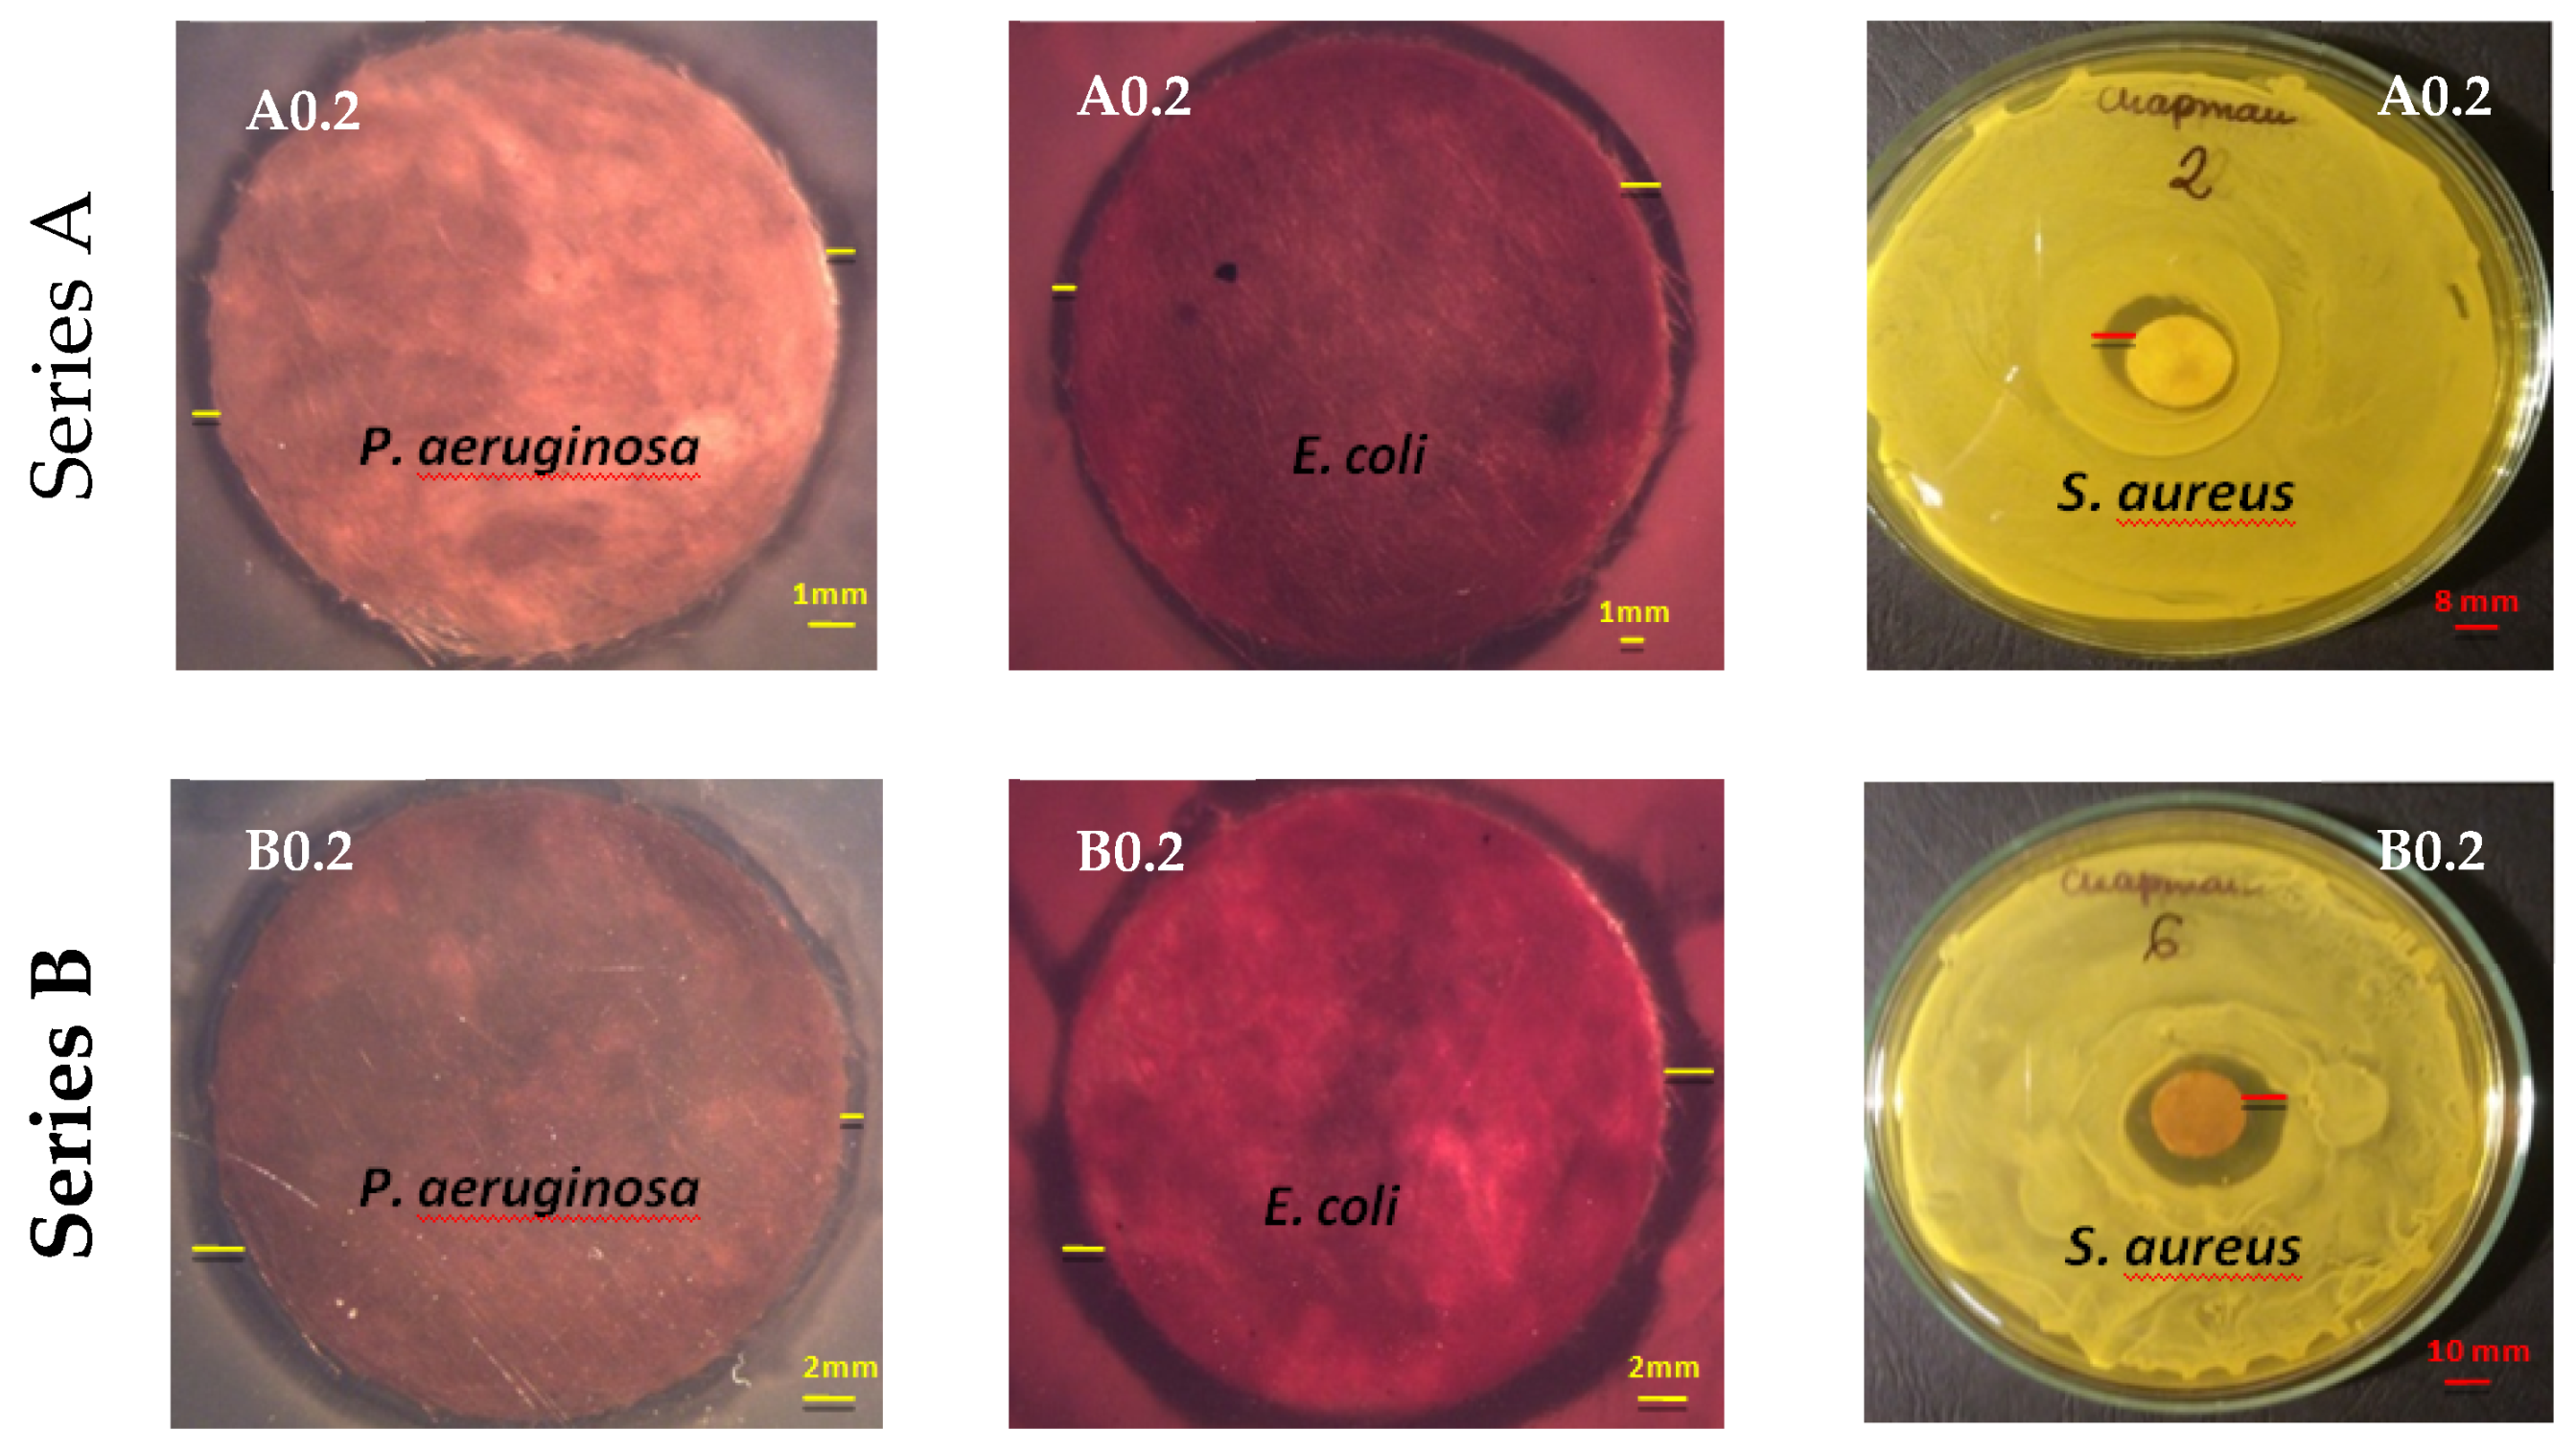
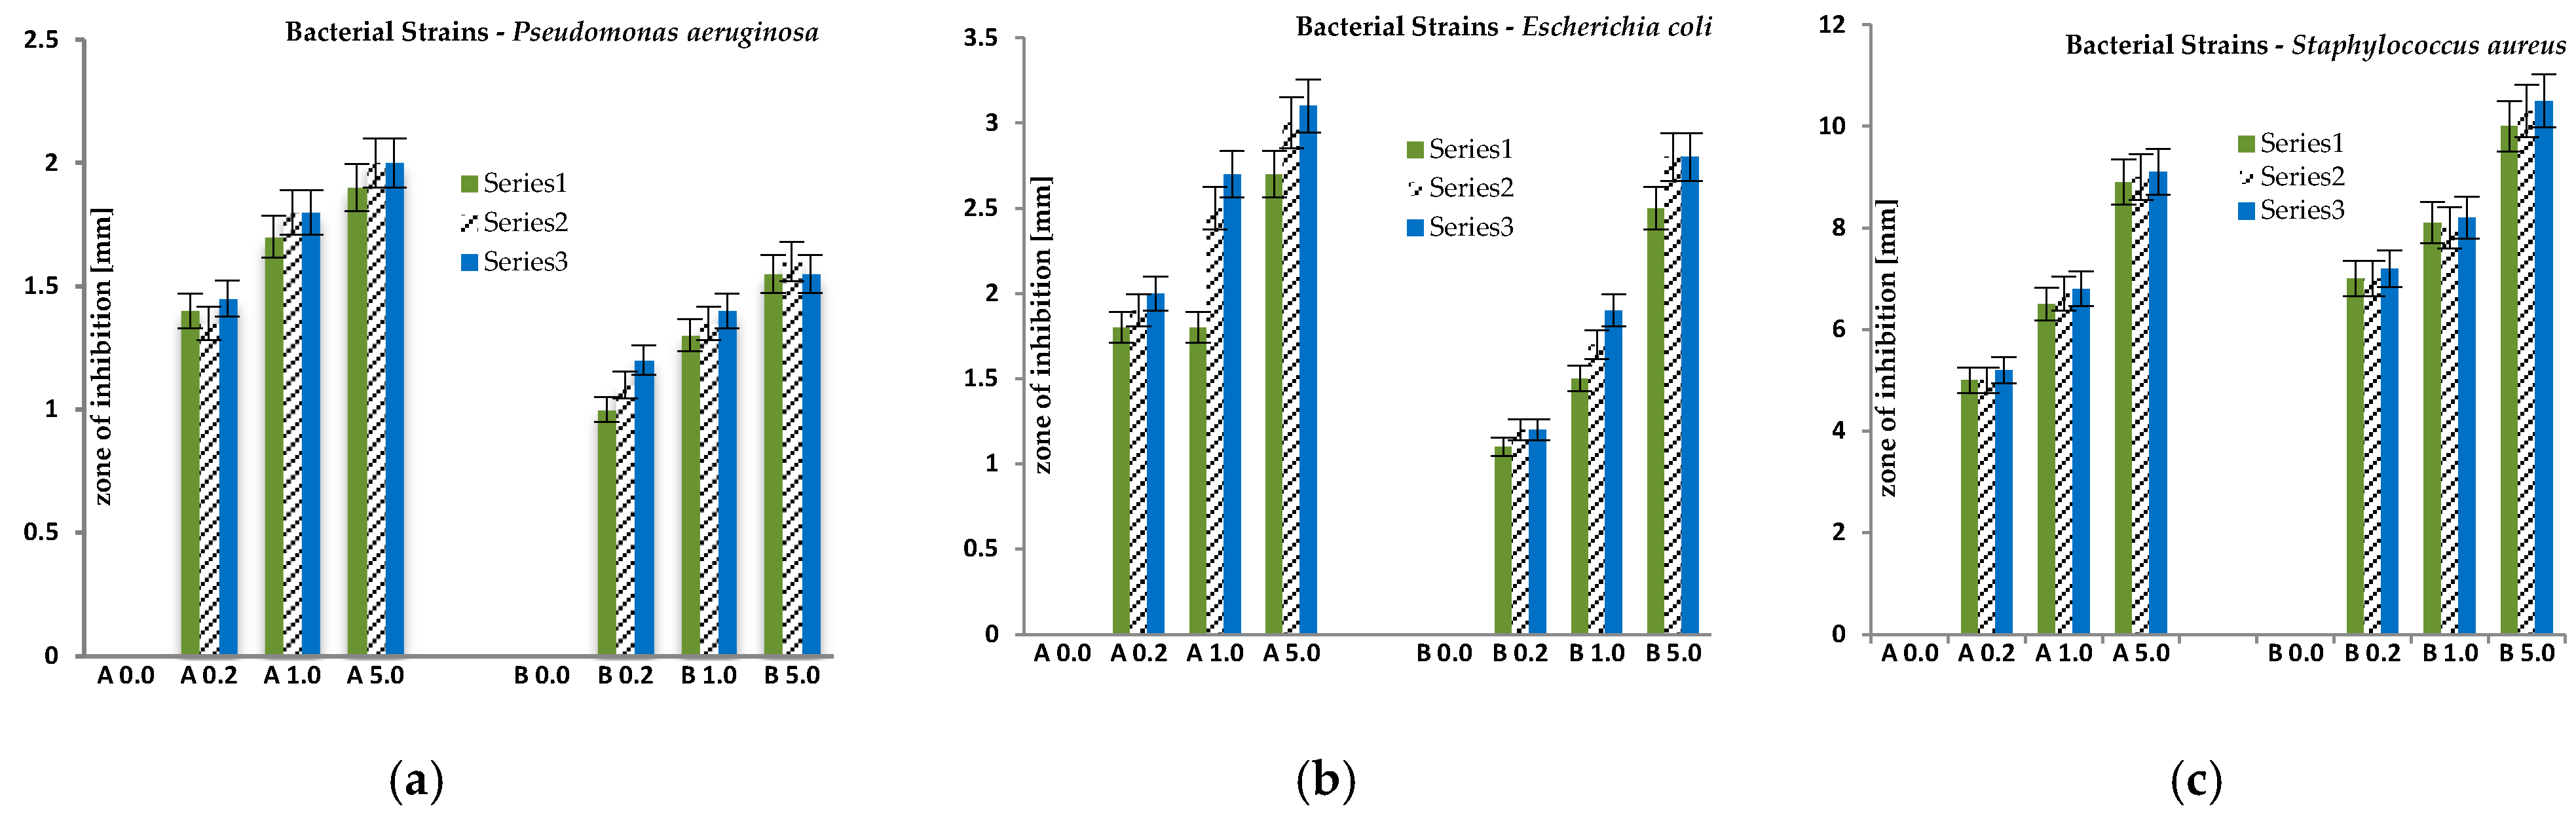
| Samples | Average Zone of Inhibition ± 0.1 ÷ 0.5 [mm] | ||
|---|---|---|---|
| Pseudomonasaeruginosa Gram-Negative | Escherichia coli Gram-Negative | Staphylococcus aureus Gram-Positive | |
| A 0.0 | - | - | - |
| A 0.2 | 1.4 | 1.9 | 5.0 |
| A 1.0 | 1.8 | 2.3 | 6.7 |
| A 5.0 | 2.0 | 3.0 | 3.0 |
| Average zone of inhibition [mm] | 1.7 | 2.4 | 4.9 |
| B 0.0 | - | - | - |
| B 0.2 | 1.1 | 1.2 | 7.1 |
| B 1.0 | 1.4 | 1.7 | 8.1 |
| B 5.0 | 1.6 | 2.7 | 10.3 |
| Average zone of inhibition [mm] | 1.4 | 1.9 | 8.5 |
© 2020 by the authors. Licensee MDPI, Basel, Switzerland. This article is an open access article distributed under the terms and conditions of the Creative Commons Attribution (CC BY) license (http://creativecommons.org/licenses/by/4.0/).
Share and Cite
Biniaś, D.; Biniaś, W.; Machnicka, A.; Hanus, M. Preparation of Antimicrobial Fibres from the EVOH/EPC Blend Containing Silver Nanoparticles. Polymers 2020, 12, 1827. https://doi.org/10.3390/polym12081827
Biniaś D, Biniaś W, Machnicka A, Hanus M. Preparation of Antimicrobial Fibres from the EVOH/EPC Blend Containing Silver Nanoparticles. Polymers. 2020; 12(8):1827. https://doi.org/10.3390/polym12081827
Chicago/Turabian StyleBiniaś, Dorota, Włodzimierz Biniaś, Alicja Machnicka, and Monika Hanus. 2020. "Preparation of Antimicrobial Fibres from the EVOH/EPC Blend Containing Silver Nanoparticles" Polymers 12, no. 8: 1827. https://doi.org/10.3390/polym12081827
APA StyleBiniaś, D., Biniaś, W., Machnicka, A., & Hanus, M. (2020). Preparation of Antimicrobial Fibres from the EVOH/EPC Blend Containing Silver Nanoparticles. Polymers, 12(8), 1827. https://doi.org/10.3390/polym12081827